
Biologics in Canada. Part 2: Biosimilar Savings, 2018
May 2020
ISBN 978-0-660-34595-6
Cat. no.: H82-50/2-2020E-PDF
Table of Contents
Acknowledgements
This report was prepared by the Patented Medicine Prices Review Board (PMPRB) as part of the National Prescription Drug Utilization Information System (NPDUIS) initiative.
The PMPRB wishes to acknowledge and thank the members of the NPDUIS Advisory Committee for their expert oversight and guidance in the preparation of this chartbook. Please note that the statements, findings, and conclusions do not necessarily reflect those of the members or their organizations.
Appreciation goes to Jared Berger and Patrick McConnell for leading this project, as well as to Jeffrey Menzies, Elena Lungu, and Tanya Potashnik and for their oversight in its development. The PMPRB also wishes to acknowledge Nevzeta Bosnic for providing direction in the development of the analysis; Blake Wladyka for his contribution to the analysis; and the editorial staff Carol McKinley, Sarah Parker, and Shirin Paynter.
Disclaimer
NPDUIS operates independently of the regulatory activities of the Board of the PMPRB. The research priorities, data, statements, and opinions expressed or reflected in NPDUIS reports do not represent the position of the PMPRB with respect to any regulatory matter. NPDUIS reports do not contain information that is confidential or privileged under sections 87 and 88 of the Patent Act, and the mention of a medicine in a NPDUIS report is not and should not be understood as an admission or denial that the medicine is subject to filings under sections 80, 81, or 82 of the Patent Act or that its price is or is not excessive under section 85 of the Patent Act.
Although this information is based in part on data obtained from the NPDUIS Database of the Canadian Institute for Health Information (CIHI) and under license from IQVIA’s MIDAS® Database, Payer Insights database, and Private Pay Direct Drug Plan database, the statements, findings, conclusions, views, and opinions expressed in this report are exclusively those of the PMPRB and are not attributable to CIHI or IQVIA.
Contact Information
Patented Medicine Prices Review Board
Standard Life Centre
Box L40
333 Laurier Avenue West
Suite 1400
Ottawa, ON K1P 1C1
Tel.: 1-877-861-2350
TTY 613-288-9654
Email: PMPRB.Information-Renseignements.CEPMB@pmprb-cepmb.gc.ca
Introduction
Biologics are a high-growth market segment. In Canada, sales of biologic medicines have tripled over the last decade, reaching $7.7 billion in 2018 and accounting for almost one third of all pharmaceutical sales.
While biosimilars of infliximab, etanercept, insulin glargine, and filgrastim saved Canadians an estimated $93.9 million in drug costs in 2018, the savings could have been many times greater if domestic uptake and pricing had been more closely aligned with median OECD levels.
Drawing on current trends in domestic and international biosimilar pricing and uptake, this analysis estimates the additional savings that could be achieved by increasing the uptake and/or lowering the prices of biosimilars in Canada.
This is the second publication in a two-part chartbook series. The first part in the series, Biosimilars in Canada. Part 1: Market Trends, 2018, examines the market dynamics of biologics in Canada and compares Canadian and international trends in biologic sales and pricing, as well as biosimilar uptake.
Biologics are a class of medicines formed from living organisms or from their cells using advanced biotechnology processes. They are typically larger and more complex than chemically produced pharmaceutical drugs. In Canada, biologic drugs are listed in Schedule D of the Food and Drugs Act.
Health Canada defines a biosimilar as a biologic drug that is highly similar to a biologic drug that was already authorized for sale. There are no expected clinically meaningful differences in efficacy and safety between a biosimilar and the originator or reference biologic.
Background
Biosimilars are launched later in Canada than in Europe, and when they do arrive, biosimilar uptake tends to be lower. Even though the biosimilar discounts in Canada are greater than in other counties, Canadians still end up paying more, as the discounts do not offset the higher reference price of the more expensive originator biologics.
Why biosimilar savings matter
Historically, the savings from generic substitution and generic price reductions have helped to offset the cost pressures from new drugs and increased utilization for Canadian drug plans. However, in recent years, the impact from these savings has been gradually declining.
Given the high-growth market for biologics in Canada, biosimilars offer an excellent opportunity for significant cost savings; but this is a complex market space, and these potential savings have yet to be fully realized. Unlike small molecule medicines, which experience a relatively quick market adjustment after generic entry, most originator biologics in Canada continue to dominate the market long after the introduction of a biosimilar. This, in turn, limits the savings for Canadian payers and their potential ability to fund new therapies that are increasingly coming at high prices.
Despite the availability of a biosimilar alternative, the originator biologic Remicade still accounted for the vast majority of infliximab sales in 2018, a market worth over $1 billion in Canada. Since then, policy initiatives by public plans in British Columbia and Alberta, as well as by Green Shield Canada, have been introduced to promote switching to available biosimilars. Future analyses will measure the impact of these policy changes on the market in Canada.
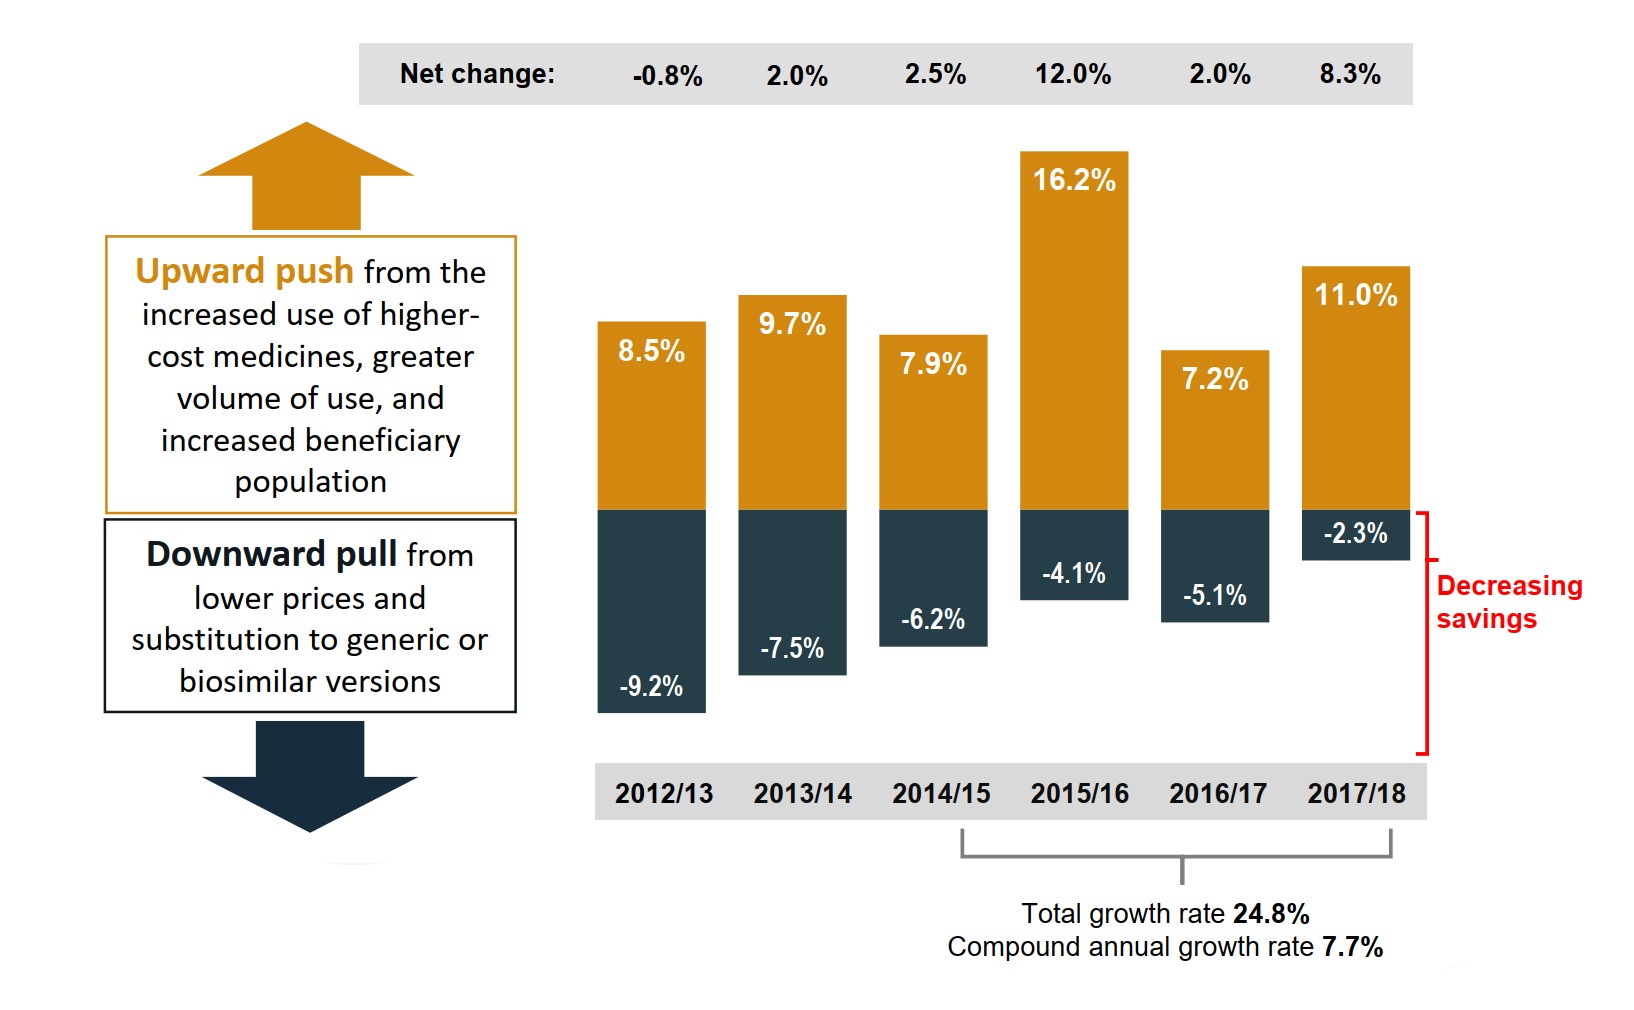
Figure description
A bar graph shows the overall trend in the annual growth in drug expenditures for Canada’s public drug plans from fiscal year 2012/13 to 2017/18. The growth for each year is broken down into the percentage contribution of the upward push from higher prices, more expensive medicines, greater volume of use, and increased beneficiary population; as well as the percentage downward pull from lower prices and substitution to generic or biosimilar versions. The net change in each fiscal year is also given. The total growth rate from 2014/15 to 2017/18 was 24.8%, with a compound annual growth rate of 7.7%.
| Fiscal year | Upward push | Downward pull | Net change |
|---|---|---|---|
| 2012/13 | 8.5% | -9.2% | -0.8% |
| 2013/14 | 9.7% | -7.5% | 2.0% |
| 2014/15 | 7.9% | -6.2% | 2.5% |
| 2015/16 | 16.2% | -4.1% | 12.0% |
| 2016/17 | 7.2% | -5.1% | 2.0% |
| 2017/18 | 11.0% | -2.3% | 8.3% |
Note: The upward push in 2015/16 and the downward pull in 2016/17 were heavily influenced by the introduction of direct-acting antiviral drugs for hepatitis C.
Values may not add to totals due to rounding and the cross effect.
Data source: National Prescription Drug Utilization Information System Database, Canadian Institute for Health Information.
Methods and Limitations
This analysis explores the potential savings from a select number of biosimilars that have been launched in the Canadian market or are expected to be available by the end of 2020.
Estimated savings are based on various scenarios of market entry, uptake, and price discounts, as observed in Canadian and foreign markets. Estimates are based on an aggregate of the potential savings of select biosimilars in the third year following market entry.
Pricing and uptake information were calculated by converting the physical quantities of drugs into a standard unit of measure. This allowed for the aggregation of units across groups of drugs, which would not otherwise be possible.
International availability, uptake, and pricing information were determined based on data from the IQVIA MIDAS® Database for member countries in the Organisation for Economic Co-operation and Development (OECD).
Combination products were excluded from the analysis and reported Canadian sales. Somatropin (omnitrope) was also excluded from the analysis due to low sales and data limitations in estimating overall savings.
The anticipated launch dates reported in this chartbook were based on reviews of various publicly available sources. These dates are estimates and may change at any time.
Selection of Medicines
Ten biologic medicines met the selection criteria for analysis.
| Biologic medicine* | 2018 Canadian sales | Biosimilar(s) availability† in EU and US | First biosimilar availability in Canada | ||
|---|---|---|---|---|---|
| Approval | First sales‡ | Anticipated launch | |||
| Established biosimilars available in Canada for at least two years | |||||
| Infliximab | $1,123M | EU, US | Jan-14 | Q1-2015 | – |
| Etanercept | $309M | EU | Aug-16 | Q4-2016 | – |
| Insulin glargine | $285M | EU, US | Sept-15 | Q1-2016 | – |
| Filgrastim | $133M | EU, US | Dec-15 | Q2-2016 | – |
| Biosimilars recently launched in Canada or that are expected to be available by Q4-2020 | |||||
| Ranibizumab | $317M | – | – | – | 2020 |
| Rituximabc | $266M | EU, US | Apr-19 | Q4-2019 | – |
| Trastuzumabc | $186M | EU, US | May-19 | Q2-2019 | – |
| Bevacizumabc | $118M | EU, US | Apr-18 | Q3-2019 | – |
| Insulin lispro | $77M | EU, US | Nov-17 | Q4-2019 | – |
| Pegfilgrastim | $47M | EU, US | Apr-18 | Q1-2019 | – |
* Oncology medicines are marked with a superscript “C”.
† Approval and/or sales.
‡ Sales for 2019 were based on data captured by Health Canada’s Drug Product Database (DPD).
Data source: IQVIA MIDAS® Database, prescription retail and hospital markets, Q4-2018. All rights reserved.
1. Potential Savings from Established Biosimilars
The use of biosimilars of infliximab, etanercept, insulin glargine, and filgrastim, which have been available in Canada for at least two years, saved Canadians an estimated $93.9 million in 2018. Assuming that the trend in uptake follows the status quo, in 2021, these savings will total $294 million.
Using two different scenarios based on international experience, this section demonstrates the additional savings that Canadians could realize by increasing biosimilar uptake and/or lowering prices. Results are given for the unrealized savings potential in 2018, as well as the forecast savings for 2021.
Biosimilars savings model: Established biosimilars
Two scenarios based on OECD biosimilar uptake and pricing are used to determine the additional potential savings for 2018 and the forecasted savings for 2021.
OECD moderate estimate: Assumes that the uptake of biosimilars in Canada matches the OECD median (indexed to launch) and biosimilar prices remain at the Canadian level.
Under this scenario, the savings potential in 2018 would have increased from an estimated $94 million to $346 million.
OECD high estimate: Assumes that the uptake of biosimilars in Canada matches the median uptake in the top four OECD countries and the Canadian price matches the OECD median price.
Under this scenario, the savings potential in 2018 would have increased from an estimated $94 million to $808 million.
Canadians are only realizing a fraction of the potential savings from biosimilars
Increasing the uptake and/or lowering the prices of the four biosimilars analyzed would have a significant potential impact on the savings realized by Canadians.
Projecting to 2021, if moderate OECD uptake rates are applied, the estimated savings from these biosimilars could be increased by $401 million over the status quo estimate. If the high OECD estimate is applied, estimated future savings of $1,136 million could be attained, $842 million more than the Canadian estimate of $294 million.
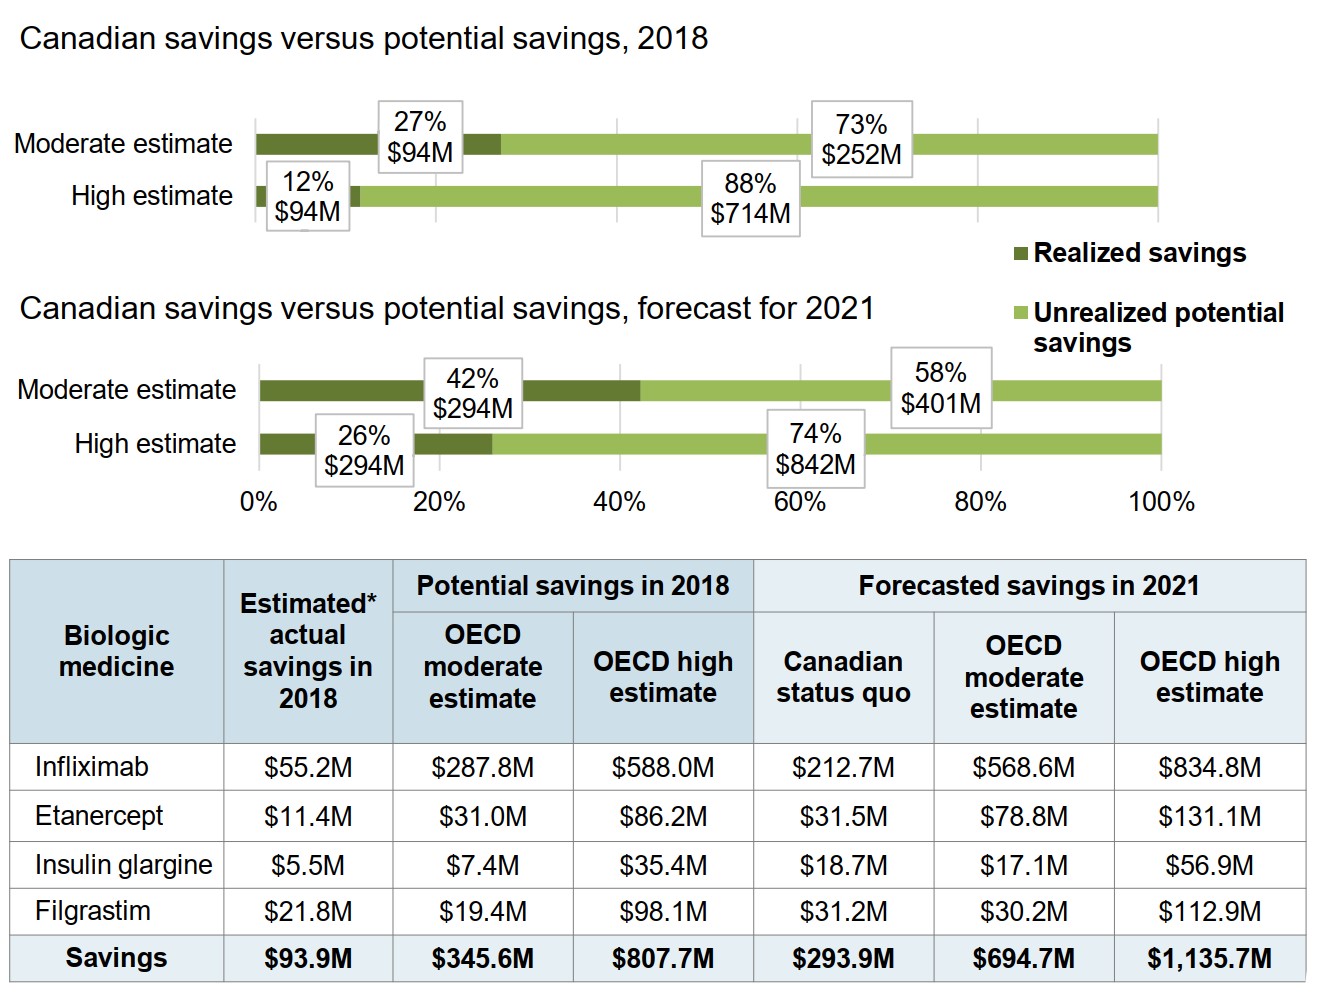
Figure description
Two stacked bar graphs show the realized and unrealized potential savings from increased biosimilar uptake and/or lower prices in Canada, first in 2018 then forecasted for 2021. Results are given using a moderate estimate and at a high estimate, based on OECD values, both as a percentage of the total potential savings and as a dollar amount.
Canadian savings versus potential savings, 2018
| Realized savings | Unrealized potential savings | |
|---|---|---|
| Moderate estimate | $94 million (27%) | $252 million (73%) |
| High estimate | $94 million (12%) | $714 million (88%) |
Canadian savings versus potential savings, forecast for 2021
| Realized savings | Unrealized potential savings | |
|---|---|---|
| Moderate estimate | $294 million (42%) | $401 million (58%) |
| High estimate | $294 million (26%) | $842 million (74%) |
An accompanying table gives the estimated actual savings and potential savings in 2018, and well as the forecasted savings for 2021 broken out by medicine.
All values given are in millions of dollars.
| Biologic medicine | Estimated* actual savings in 2018 | Potential savings in 2018 | Forecasted savings in 2021 | |||
|---|---|---|---|---|---|---|
| OECD moderate estimate | OECD high estimate | Canadian status quo | OECD moderate estimate | OECD high estimate | ||
| Infliximab | $55.2 | $287.8 | $588.0 | $212.7 | $568.6 | $834.8 |
| Etanercept | $11.4 | $31.0 | $86.2 | $31.5 | $78.8 | $131.1 |
| Insulin glargine | $5.5 | $7.4 | $35.4 | $18.7 | $17.1 | $56.9 |
| Filgrastim | $21.8 | $19.4 | $98.1 | $31.2 | $30.2 | $112.9 |
| Savings | $93.9 | $345.6 | $807.7 | $293.9 | $694.7 | $1,135.7 |
* Assuming that the total use of each medicine remained the same and that the price of the originator biologic did not drop after the launch of the biosimilar.
Data source: IQVIA MIDAS® Database, prescription retail and hospital markets. All rights reserved.
2. Infliximab Case Study
Infliximab is over a one billion dollar market in Canada.
The infliximab biosimilar Inflectra first entered the Canadian market in 2015. From that time until the end of 2018, Canadians spent a total of $62 million on the biosimilar, resulting in estimated savings of $108 million. Following this same trend, the anticipated savings from 2019 until the end of 2021 would be an estimated $447 million.
However, if the biosimilar uptake was increased to the median OECD level for the 2019 to 2021 period, these forecasted savings could more than triple. Using higher uptake values and median OECD prices would increase the estimated savings even further to well over $2 billion, more than five-fold the anticipated level using the current Canadian trends.
This section illustrates the potential savings from the use of infliximab biosimilars from 2015 to 2021 under three different scenarios: current Canadian trends; the OECD moderate estimate; and the OECD high estimate.
Future savings will be limited based on the current uptake and pricing of infliximab
If the current trend in biosimilar uptake continues, biosimilar sales are forecast to reach $457 million from 2019 to 2021. This would result in an estimated $447 million in savings over that period.
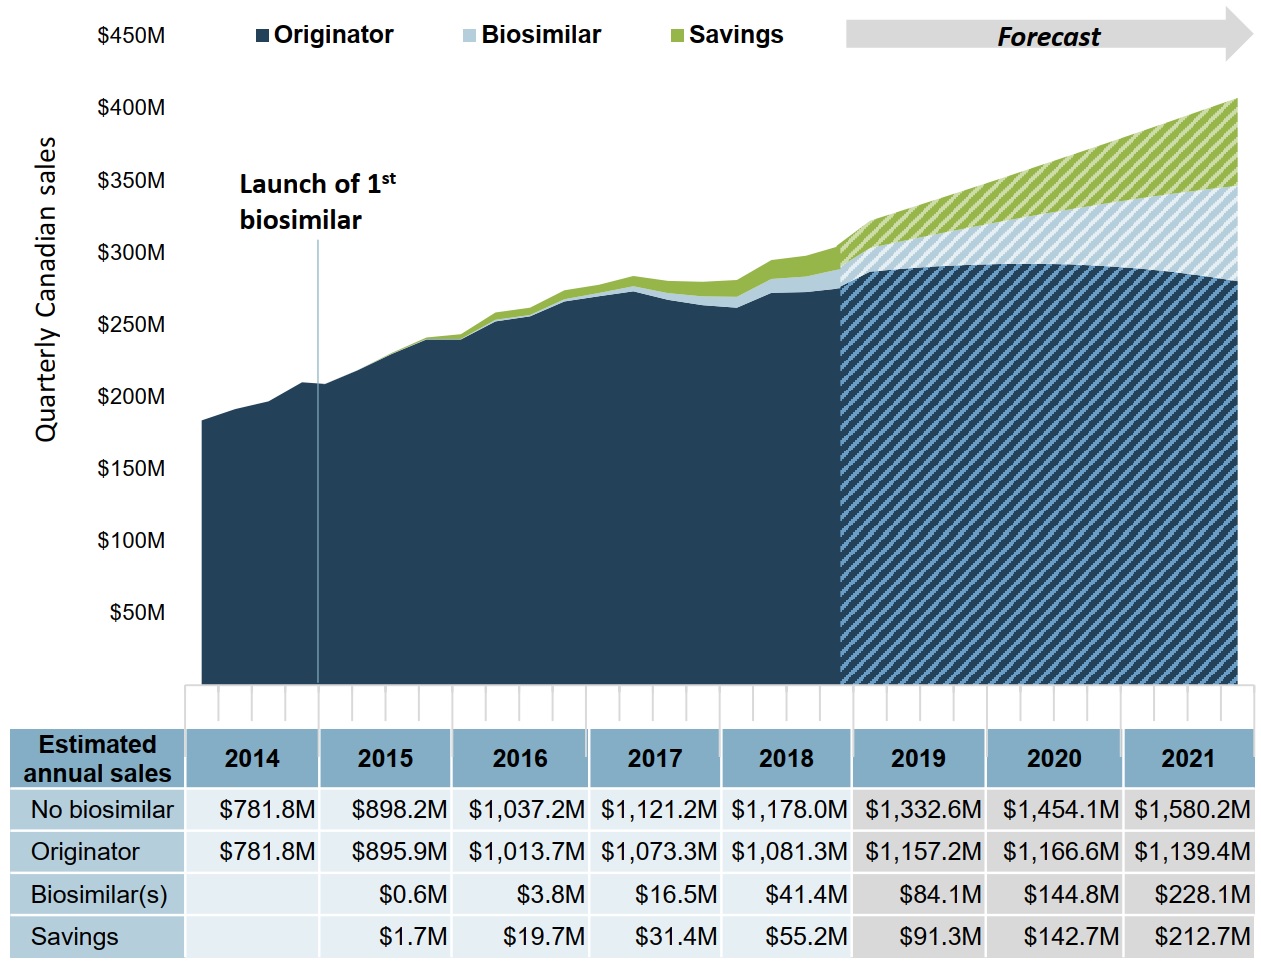
Figure description
An area graph shows the trend in quarterly Canadian sales for infliximab biosimilars and the originator biologic from 2014 to 2018, as well as projected sales from 2019 to 2021, and presents the estimated cost savings from biosimilar use over the same period. Projected sales are based on the estimated Canadian sales from 2015 to 2018. The first infliximab biosimilar was launched in 2015.
| Year | Quarter | Originator | Biosimilar | Savings |
|---|---|---|---|---|
| 2014 | 1 | $183,564,155 | – | – |
| 2 | $191,456,414 | – | – | |
| 3 | $196,772,463 | – | – | |
| 4 | $209,960,322 | – | – | |
| 2015 | 1 | $208,278,695 | $30,846 | $14,718 |
| 2 | $218,246,003 | $85,832 | $40,866 | |
| 3 | $229,716,330 | $179,118 | $540,680 | |
| 4 | $239,684,339 | $316,092 | $1,075,562 | |
| 2016 | 1 | $239,674,980 | $336,492 | $3,336,863 |
| 2 | $252,218,489 | $1,092,606 | $5,092,253 | |
| 3 | $255,741,862 | $894,725 | $5,103,090 | |
| 4 | $266,051,546 | $1,506,837 | $6,178,829 | |
| 2017 | 1 | $269,633,369 | $2,268,522 | $5,694,744 |
| 2 | $273,085,741 | $3,499,732 | $7,133,040 | |
| 3 | $267,156,911 | $4,616,138 | $8,517,173 | |
| 4 | $263,426,478 | $6,124,247 | $10,054,234 | |
| 2018 | 1 | $261,672,655 | $7,592,493 | $11,626,285 |
| 2 | $271,980,387 | $9,665,383 | $13,054,744 | |
| 3 | $272,560,632 | $10,744,369 | $14,414,426 | |
| 4 | $275,125,659 | $13,415,784 | $16,139,383 | |
| 2019 forecast | 1 | $286,668,282 | $16,438,155 | $18,894,865 |
| 2 | $288,733,487 | $19,300,241 | $21,349,464 | |
| 3 | $290,340,472 | $22,453,580 | $24,042,180 | |
| 4 | $291,465,029 | $25,911,520 | $26,983,872 | |
| 2020 forecast |
1 | $292,082,553 | $29,687,631 | $30,185,576 |
| 2 | $292,168,033 | $33,795,704 | $33,658,511 | |
| 3 | $291,696,055 | $38,249,754 | $37,414,076 | |
| 4 | $290,640,806 | $43,064,016 | $41,463,849 | |
| 2021 forecast |
1 | $288,976,068 | $48,252,949 | $45,819,591 |
| 2 | $286,675,219 | $53,831,233 | $50,493,241 | |
| 3 | $283,711,238 | $59,813,769 | $55,496,921 | |
| 4 | $280,056,699 | $66,215,681 | $60,842,931 |
A table below the graph gives the total annual estimated and projected sales for the originator biologic and biosimilars, as well as the total annual savings. An estimate is also given for biologic sales without biosimilar savings. All values given are in millions of dollars.
| Year | No biosimilar | Originator | Biosimilar | Savings |
|---|---|---|---|---|
| 2014 | $781.8 | $781.8 | – | – |
| 2015 | $898.2 | $895.9 | $0.6 | $1.7 |
| 2016 | $1,037.2 | $1,013.7 | $3.8 | $19.7 |
| 2017 | $1,121.2 | $1,073.3 | $16.5 | $31.4 |
| 2018 | $1,178.0 | $1,081.3 | $41.4 | $55.2 |
| 2019 | $1,332.6 | $1,157.2 | $84.1 | $91.3 |
| 2020 | $1,454.1 | $1,166.6 | $144.8 | $142.7 |
| 2021 | $1,580.2 | $1,139.4 | $228.1 | $212.7 |
Note: Due to rounding, the originator, biosimilar, and savings values may not add to the total biosimilar value in any given year.
Data source: IQVIA MIDAS® Database, prescription retail and hospital markets. All rights reserved.
If the uptake in infliximab biosimilars in Canada matched the median OECD level, savings could potentially increase by almost $1 billion over 3 years
For the 2019 to 2021 period, increased biosimilar uptake would result in forecasted biosimilar sales of $1,644 million. This would give rise to an estimated $1,412 million in savings, $965 million more than in the Canadian uptake scenario.
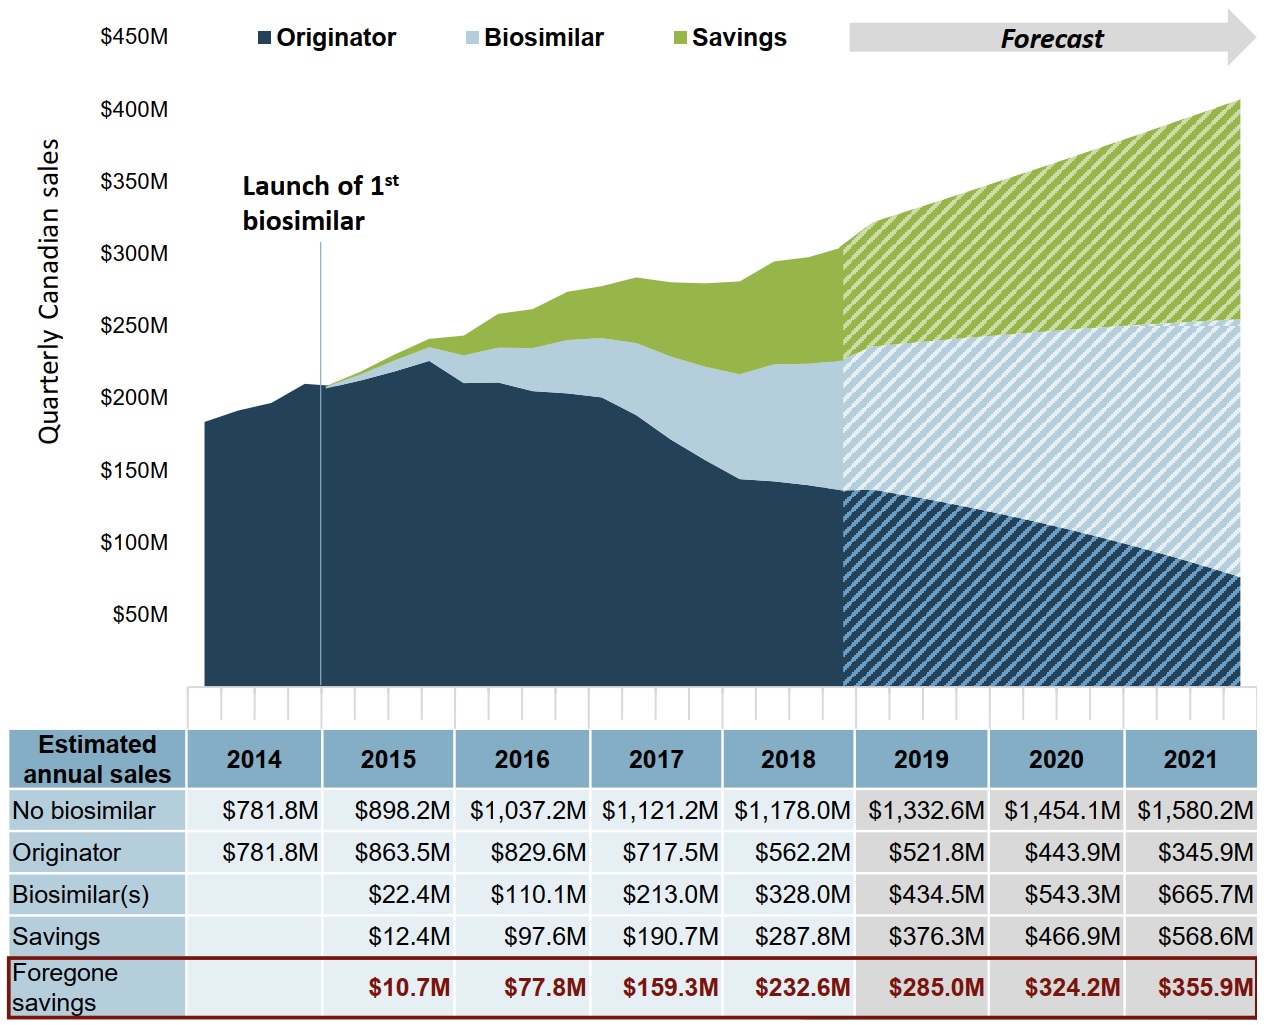
Figure description
An area graph shows the trend in quarterly Canadian sales for infliximab biosimilars and the originator biologic from 2014 to 2018, as well as projected sales from 2019 to 2021, and presents the estimated cost savings from biosimilar use over the same period. Estimated and projected sales are based on the Organisation for Economic Cooperation and Development moderate estimate. The first infliximab biosimilar was launched in 2015.
| Year | Quarter | Originator | Biosimilar | Potential savings | Foregone savings |
|---|---|---|---|---|---|
| 2014 | 1 | $ 183,564,155 | – | – | – |
| 2 | $ 191,456,414 | – | – | – | |
| 3 | $ 196,772,463 | – | – | – | |
| 4 | $ 209,960,322 | – | – | – | |
| 2015 | 1 | $ 206,797,675 | $1,033,466 | $493,118 | $478,400 |
| 2 | $ 212,272,905 | $4,132,332 | $1,967,464 | $1,926,598 | |
| 3 | $ 218,598,443 | $7,625,096 | $4,212,589 | $3,671,909 | |
| 4 | $ 225,812,333 | $9,570,326 | $5,693,333 | $4,617,772 | |
| 2016 | 1 | $ 210,461,984 | $ 19,161,438 | $13,724,913 | $10,388,049 |
| 2 | $ 210,873,437 | $ 24,210,745 | $23,319,165 | $18,226,912 | |
| 3 | $ 204,876,183 | $ 29,811,308 | $27,052,186 | $21,949,096 | |
| 4 | $ 203,372,196 | $ 36,900,539 | $33,464,477 | $27,285,647 | |
| 2017 | 1 | $ 200,544,023 | $ 41,074,519 | $35,978,094 | $30,283,350 |
| 2 | $ 188,342,973 | $ 49,928,723 | $45,446,817 | $38,313,777 | |
| 3 | $ 171,397,770 | $ 57,408,278 | $51,484,174 | $42,967,001 | |
| 4 | $ 157,201,319 | $ 64,583,000 | $57,820,641 | $47,766,406 | |
| 2018 | 1 | $ 143,999,752 | $ 72,609,584 | $64,282,097 | $52,655,812 |
| 2 | $ 142,465,886 | $ 81,048,475 | $71,186,153 | $58,131,409 | |
| 3 | $ 139,703,747 | $ 84,207,036 | $73,808,644 | $59,394,218 | |
| 4 | $ 136,004,104 | $ 90,135,472 | $78,541,249 | $62,401,867 | |
| 2019 | 1 | $ 136,710,327 | $99,133,662 | $86,157,313 | - |
| 2 | $ 132,733,585 | $105,327,628 | $91,321,979 | - | |
| 3 | $ 128,465,254 | $111,720,957 | $96,650,021 | - | |
| 4 | $ 123,900,725 | $118,316,189 | $102,143,508 | - | |
| 2020 | 1 | $ 119,035,390 | $125,115,865 | $107,804,505 | - |
| 2 | $ 113,864,642 | $132,122,527 | $113,635,079 | - | |
| 3 | $ 108,383,871 | $139,338,716 | $119,637,298 | - | |
| 4 | $ 102,588,471 | $146,766,972 | $125,813,228 | - | |
| 2021 | 1 | $ 96,473,834 | $154,409,837 | $132,164,936 | - |
| 2 | $ 90,035,351 | $162,269,852 | $138,694,490 | - | |
| 3 | $ 83,268,414 | $170,349,559 | $145,403,955 | - | |
| 4 | $ 76,168,415 | $178,651,497 | $152,295,399 | - |
A table below the graph gives the total annual sales for the originator biologic and biosimilars, as well as the total annual savings and foregone savings. An estimate is also given for biologic sales without biosimilar savings. All values given are in millions of dollars.
| Year | No biosimilar | Originator | Biosimilar | Savings | Foregone savings |
|---|---|---|---|---|---|
| 2014 | $781.8 | $781.8 | – | – | – |
| 2015 | $898.2 | $863.5 | $22.4 | $12.4 | $10.7 |
| 2016 | $1,037.2 | $829.6 | $110.1 | $97.6 | $77.8 |
| 2017 | $1,121.2 | $717.5 | $213.0 | $190.7 | $159.3 |
| 2018 | $1,178.0 | $562.2 | $328.0 | $287.8 | $232.6 |
| 2019 | $1,332.6 | $521.8 | $434.5 | $376.3 | $285.0 |
| 2020 | $1,454.1 | $443.9 | $543.3 | $466.9 | $324.2 |
| 2021 | $1,580.2 | $345.9 | $665.7 | $568.6 | $355.9 |
Note: Due to rounding, the originator, biosimilar, and savings values may not add to the total biosimilar value in any given year.
Data source: IQVIA MIDAS® Database, prescription retail and hospital markets. All rights reserved.
With a higher uptake in infliximab biosimilars and Canadian prices matching the OCED median level, anticipated savings could potentially increase by more than $1.8 billion over 3 years
If the Canadian uptake of infliximab biosimilars matched the median of the top four OECD countries and the biosimilar price matched the OECD median price, the forecasted biosimilar sales from 2019 to 2021 would be $1,876 million. This would give rise to an estimated $2,310 million in savings, $1,863 million more than in the Canadian uptake scenario.
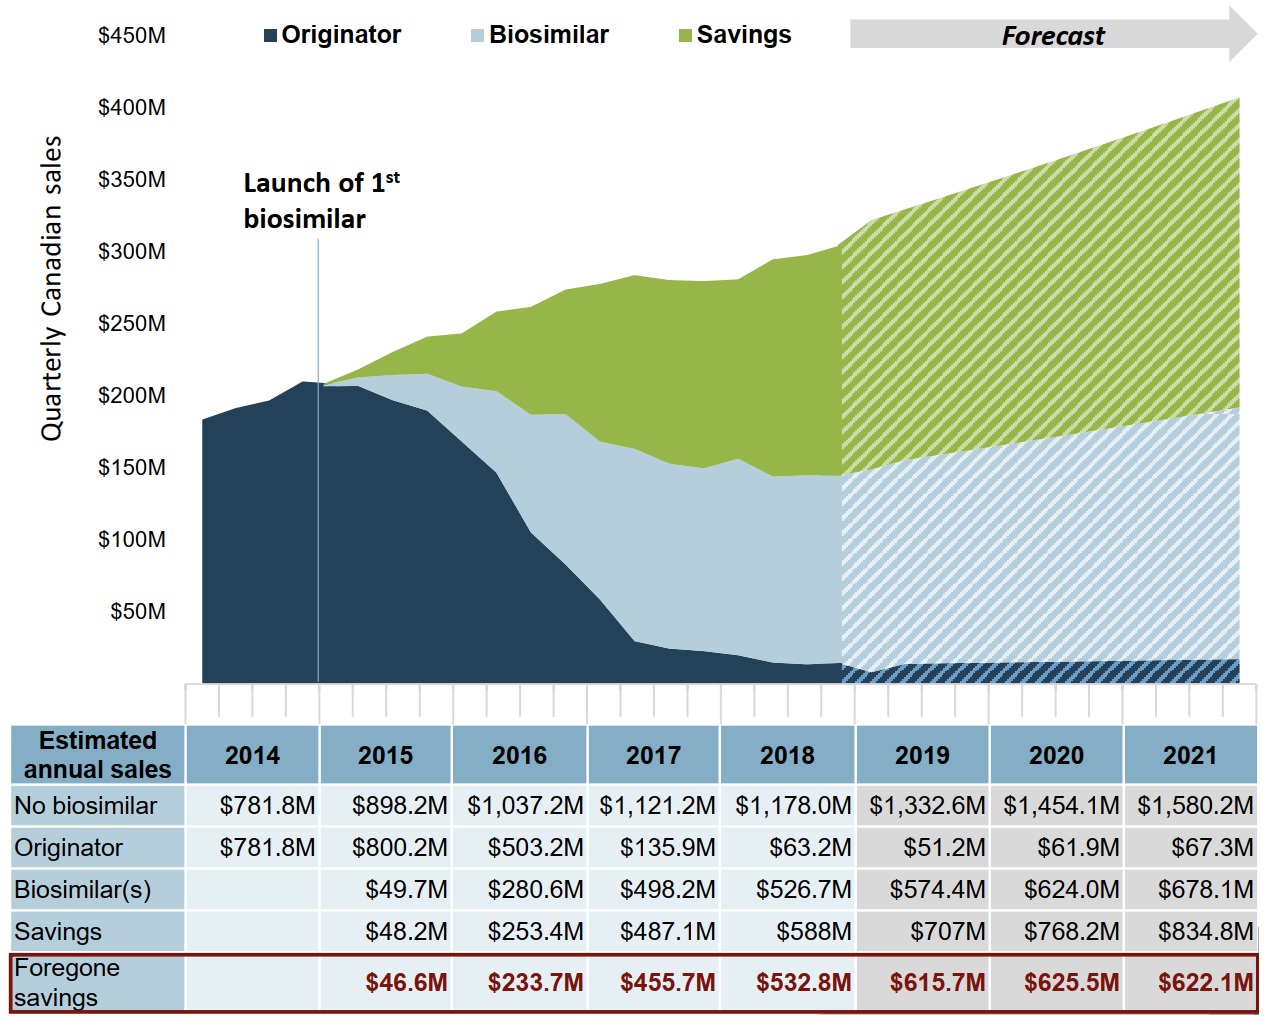
Figure description
An area graph shows the trend in Canadian sales for infliximab biosimilars and the originator biologic from 2014 to 2018, as well as projected sales from 2019 to 2021, and presents the estimated cost savings from biosimilar use over the same period. Projected sales are based on the Organisation for Economic Cooperation and Development high estimate. The first infliximab biosimilar was launched in 2015.
| Year | Quarter | Reference Actuals | Biosimilar | Potential Savings | Foregone Savings |
|---|---|---|---|---|---|
| 2014 | 1 | $183,564,155 | – | – | – |
| 2 | $191,456,414 | – | – | – | |
| 3 | $196,772,463 | – | – | – | |
| 4 | $209,960,322 | – | – | – | |
| 2015 | 1 | $ 206,594,934 | $894,446 | $834,880 | $820,161 |
| 2 | $206,894,623 | $5,869,142 | $5,608,936 | $5,568,070 | |
| 3 | $197,003,274 | $17,387,898 | $16,044,957 | $15,504,277 | |
| 4 | $189,742,562 | $25,575,398 | $25,758,033 | $24,682,471 | |
| 2016 | 1 | $168,239,064 | $38,158,550 | $36,950,722 | $33,613,858 |
| 2 | $146,754,215 | $56,486,149 | $55,162,984 | $50,070,731 | |
| 3 | $105,220,302 | $81,588,964 | $74,930,412 | $69,827,321 | |
| 4 | $82,970,578 | $104,384,940 | $86,381,694 | $80,202,865 | |
| 2017 | 1 | $58,643,228 | $109,637,182 | $109,316,226 | $103,621,481 |
| 2 | $29,792,678 | $133,404,388 | $120,521,447 | $113,388,407 | |
| 3 | $24,617,947 | $128,359,555 | $127,312,719 | $118,795,547 | |
| 4 | $22,882,106 | $126,786,630 | $129,936,222 | $119,881,988 | |
| 2018 | 1 | $19,922,092 | $136,459,374 | $124,509,967 | $112,883,682 |
| 2 | $14,887,694 | $129,108,763 | $150,704,057 | $137,649,313 | |
| 3 | $13,676,620 | $131,225,715 | $152,817,093 | $138,402,666 | |
| 4 | $14,736,360 | $129,942,050 | $160,002,416 | $143,863,033 | |
| 2019 | 1 | $8,180,772 | $140,703,225 | $173,117,305 | - |
| 2 | $14,027,469 | $141,346,070 | $174,009,653 | - | |
| 3 | $14,344,872 | $144,544,345 | $177,947,015 | - | |
| 4 | $14,665,306 | $147,773,151 | $181,921,965 | - | |
| 2020 | 1 | $14,988,769 | $151,032,489 | $185,934,501 | - |
| 2 | $15,315,262 | $154,322,360 | $189,984,626 | - | |
| 3 | $15,644,786 | $157,642,762 | $194,072,338 | - | |
| 4 | $15,977,339 | $160,993,695 | $198,197,637 | - | |
| 2021 | 1 | $16,312,923 | $164,375,161 | $202,360,524 | - |
| 2 | $16,651,536 | $167,787,159 | $206,560,998 | - | |
| 3 | $16,993,180 | $171,229,688 | $210,799,060 | - | |
| 4 | $17,337,853 | $174,702,750 | $215,074,709 | - |
A table below the graph gives the total annual sales for the originator biologic and biosimilars, as well as the total annual savings and foregone savings. An estimate is also given for biologic sales without biosimilar savings. All values given are in millions of dollars.
| Year | No biosimilar | Originator | Biosimilar | Savings | Foregone savings |
|---|---|---|---|---|---|
| 2014 | $781.8 | $781.8 | – | – | – |
| 2015 | $898.2 | $800.2 | $49.7 | $48.2 | $46.6 |
| 2016 | $1,037.2 | $503.2 | $280.6 | $253.4 | $233.7 |
| 2017 | $1,121.2 | $135.9 | $498.2 | $487.1 | $455.7 |
| 2018 | $1,178.0 | $63.2 | $526.7 | $588.0 | $532.8 |
| 2019 | $1,332.6 | $51.2 | $574.4 | $707.0 | $615.7 |
| 2020 | $1,454.1 | $61.9 | $624.0 | $768.2 | $625.5 |
| 2021 | $1,580.2 | $67.3 | $678.1 | $834.8 | $622.1 |
Note: Due to rounding, the originator, biosimilar, and savings values may not add to the total biosimilar value in any given year.
Data source: IQVIA MIDAS® Database, prescription retail and hospital markets. All rights reserved.
3. Forecasted Savings for New Biosimilars
With many new biosimilars entering the market, there is a potential for significant future savings.
This section forecasts the potential savings for six biologic medicines with biosimilars that recently entered the Canadian market or that are expected to be available in Canada by the end of 2020: ranibizumab, rituximab, trastuzumab, bevacizumab, insulin lispro, and pegfilgrastim.
Their potential uptake, price, and resulting savings are estimated based on the experience of similar biosimilars in Canadian and international markets.
Biosimilars savings model: New biosimilars
Three scenarios are used to calculate the potential savings from these biosimilars in 2023.
Canadian estimate: Assumes that the Canadian price of the originator biologic is discounted by the average Canadian biosimilar discount (30.05%), unless it has a publicly available price.
OECD moderate estimate: Assumes that the OECD median uptake is combined with the Canadian prices used in the first scenario.
OECD high estimate: Assumes that the median uptake in the top four OECD countries is combined with the OECD median price. If no OECD biosimilar price is available, the OECD median prices are discounted by the OECD average biosimilar discount of 29.51%.
Canadian and OECD uptake is modelled after the uptake of similar biologic medicines currently available in the related market. Biosimilar uptake is measured for the first three years after introduction indexed to the year of launch. Total medicine use was projected based on the Canadian use of the originator biologic.
Biosimilars savings model: Uptake modelling for new biosimilars
Five of the biosimilars analyzed have indications for acute diseases or cancer. Their potential rate of uptake in Canada is modelled after the indexed uptake of the filgrastim biosimilar, which has a higher Canadian market share than median OECD share in the third year after launch. The new insulin medicine is expected to follow a similar trend as insulin glargine.
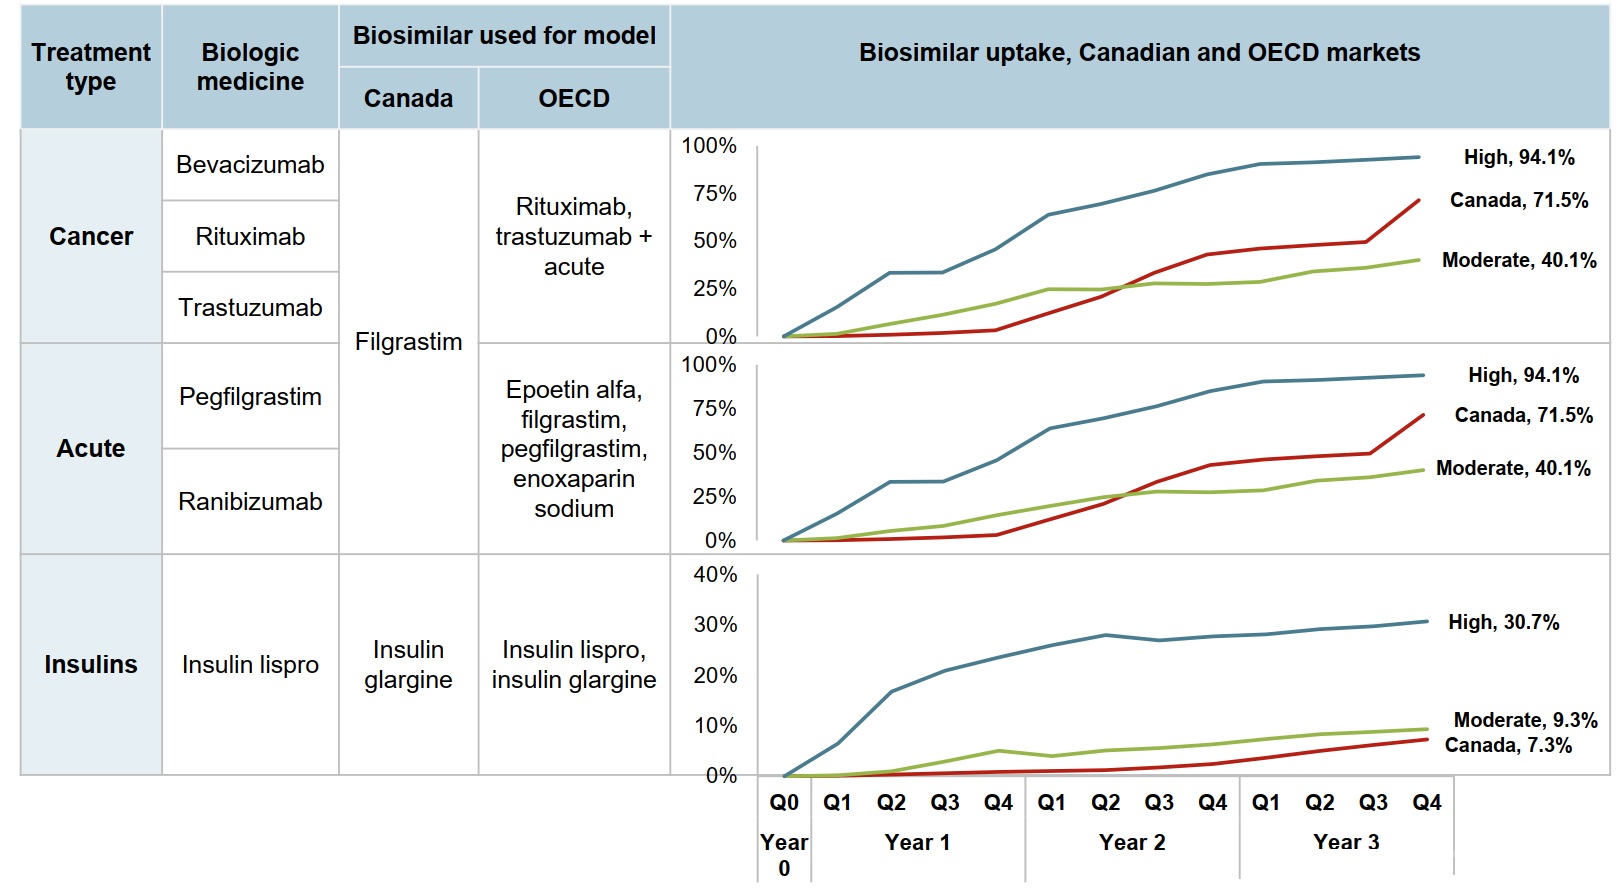
Figure description
This series of three line graphs describes the uptake of biosimilars for cancer, acute indications, and insulin treatments for the Canadian market and for the Organisation for Economic Cooperation and Development moderate and high uptake scenarios. Each graph shows the quarterly uptake for the first three years after introduction, indexed to the year of launch.
Cancer
Biologic medicines in this treatment type include bevacizumab, rituximab, and trastuzumab. The model uses the filgrastim biosimilar for Canada, and the rituximab and trastuzumab biosimilars as well as those in the acute category for the OECD.
| Year 1 | Year 2 | Year 3 | ||||||||||
|---|---|---|---|---|---|---|---|---|---|---|---|---|
| Q1 | Q2 | Q3 | Q4 | Q1 | Q2 | Q3 | Q4 | Q1 | Q2 | Q3 | Q4 | |
| Canada | 0.2% | 0.9% | 1.8% | 3.2% | 12.1% | 20.8% | 33.4% | 43.0% | 46.1% | 47.9% | 49.5% | 71.5% |
| OECD moderate uptake | 1.4% | 6.5% | 11.4% | 17.2% | 24.8% | 24.7% | 27.9% | 27.5% | 28.6% | 34.0% | 36.0% | 40.1% |
| OECD high uptake | 15.3% | 33.4% | 33.6% | 45.7% | 63.8% | 69.5% | 76.4% | 85.0% | 90.5% | 91.4% | 92.6% | 94.1% |
Acute
Biologic medicines in this treatment type include pegfilgrastim and ranibizumab. The model uses the filgrastim biosimilar for Canada, and the epoetin alfa, filgrastim, pegfilgrastim, and enoxaparin sodium biosimilars for the OECD.
| Year 1 | Year 2 | Year 3 | ||||||||||
|---|---|---|---|---|---|---|---|---|---|---|---|---|
| Q1 | Q2 | Q3 | Q4 | Q1 | Q2 | Q3 | Q4 | Q1 | Q2 | Q3 | Q4 | |
| Canada | 0.2% | 0.9% | 1.8% | 3.2% | 12.1% | 20.8% | 33.4% | 43.0% | 46.1% | 47.9% | 49.5% | 71.5% |
| OECD moderate uptake | 1.4% | 5.4% | 8.3% | 14.4% | 19.7% | 24.7% | 27.9% | 27.5% | 28.6% | 34.0% | 36.0% | 40.1% |
| OECD high uptake | 15.3% | 33.4% | 33.6% | 45.7% | 63.8% | 69.5% | 76.4% | 85.0% | 90.5% | 91.4% | 92.6% | 94.1% |
Insulins
This treatment type includes the biologic medicine insulin lispro. The model uses the insulin glargine biosimilar for Canada, and both the insulin lispro and insulin glargine biosimilars for the OECD.
| Year 1 | Year 2 | Year 3 | ||||||||||
|---|---|---|---|---|---|---|---|---|---|---|---|---|
| Q1 | Q2 | Q3 | Q4 | Q1 | Q2 | Q3 | Q4 | Q1 | Q2 | Q3 | Q4 | |
| Canada | 0.1% | 0.3% | 0.6% | 0.9% | 1.0% | 1.2% | 1.7% | 2.4% | 3.7% |
5.0% | 6.2% | 7.3% |
| OECD moderate uptake | 0.2% | 1.0% | 2.9% | 5.0% | 4.0% | 5.1% | 5.6% | 6.3% | 7.4% | 8.3% | 8.8% | 9.3% |
| OECD high uptake | 6.5% | 16.8% | 20.9% | 23.6% | 26.0% | 28.0% | 26.9% | 27.7% | 28.1% | 29.2% | 29.7% | 30.7% |
Data source: IQVIA MIDAS® Database, prescription retail and hospital markets. All rights reserved.
New biosimilars entering the Canadian market present an opportunity for significant future savings
In 2023, the total savings from these new biosimilar medicines in Canada could vary from $222 million to $447 million depending on their rate of uptake and price discount.
Table 3.1 Estimated potential savings of new biosimilars in 2023, Canada
| Biologic medicine* | 2018 Canadian sales | First biosimilar availability | 2023 forecast sales† | Potential savings in 2023 | ||||
|---|---|---|---|---|---|---|---|---|
| Approval | First sales | Anticipated launch | Canadian estimate | OECD | ||||
| Moderate estimate | High estimate | |||||||
Ranibizumab |
$317M |
— |
— |
2020 |
$372M |
$79M |
$54M |
$201M |
Rituximabc |
$266M |
Apr-19 |
Q4-2019 |
2020 |
$283M |
$59M |
$40M |
$83M |
Trastuzumabc |
$186M |
May-19 |
Q2-2019 |
— |
$194M |
$46M |
$39M |
$83M |
Bevacizumabc |
$118M |
Apr-18 |
Q3-2019 |
— |
$130M |
$30M |
$26M |
$54M |
Insulin lispro |
$77M |
Nov-17 |
Q4-2019 |
— |
$96M |
$3M |
$3M |
$12M |
Pegfilgrastim |
$47M |
Apr-18 |
Q1- 2019 |
— |
$22M |
$5M |
$4M |
$13M |
Total savings (2023) |
$1,011M |
— |
— |
— |
$1,097M |
$222M |
$167M |
$447M |
* Oncology medicines are marked with a superscript “C”.
† Assuming no biosimilar availability.
Data source: IQVIA MIDAS® Database, prescription retail and hospital markets. All rights reserved.