
Infographic: Caribou abundance and migration
Description: Summary of Caribou abundance and migration
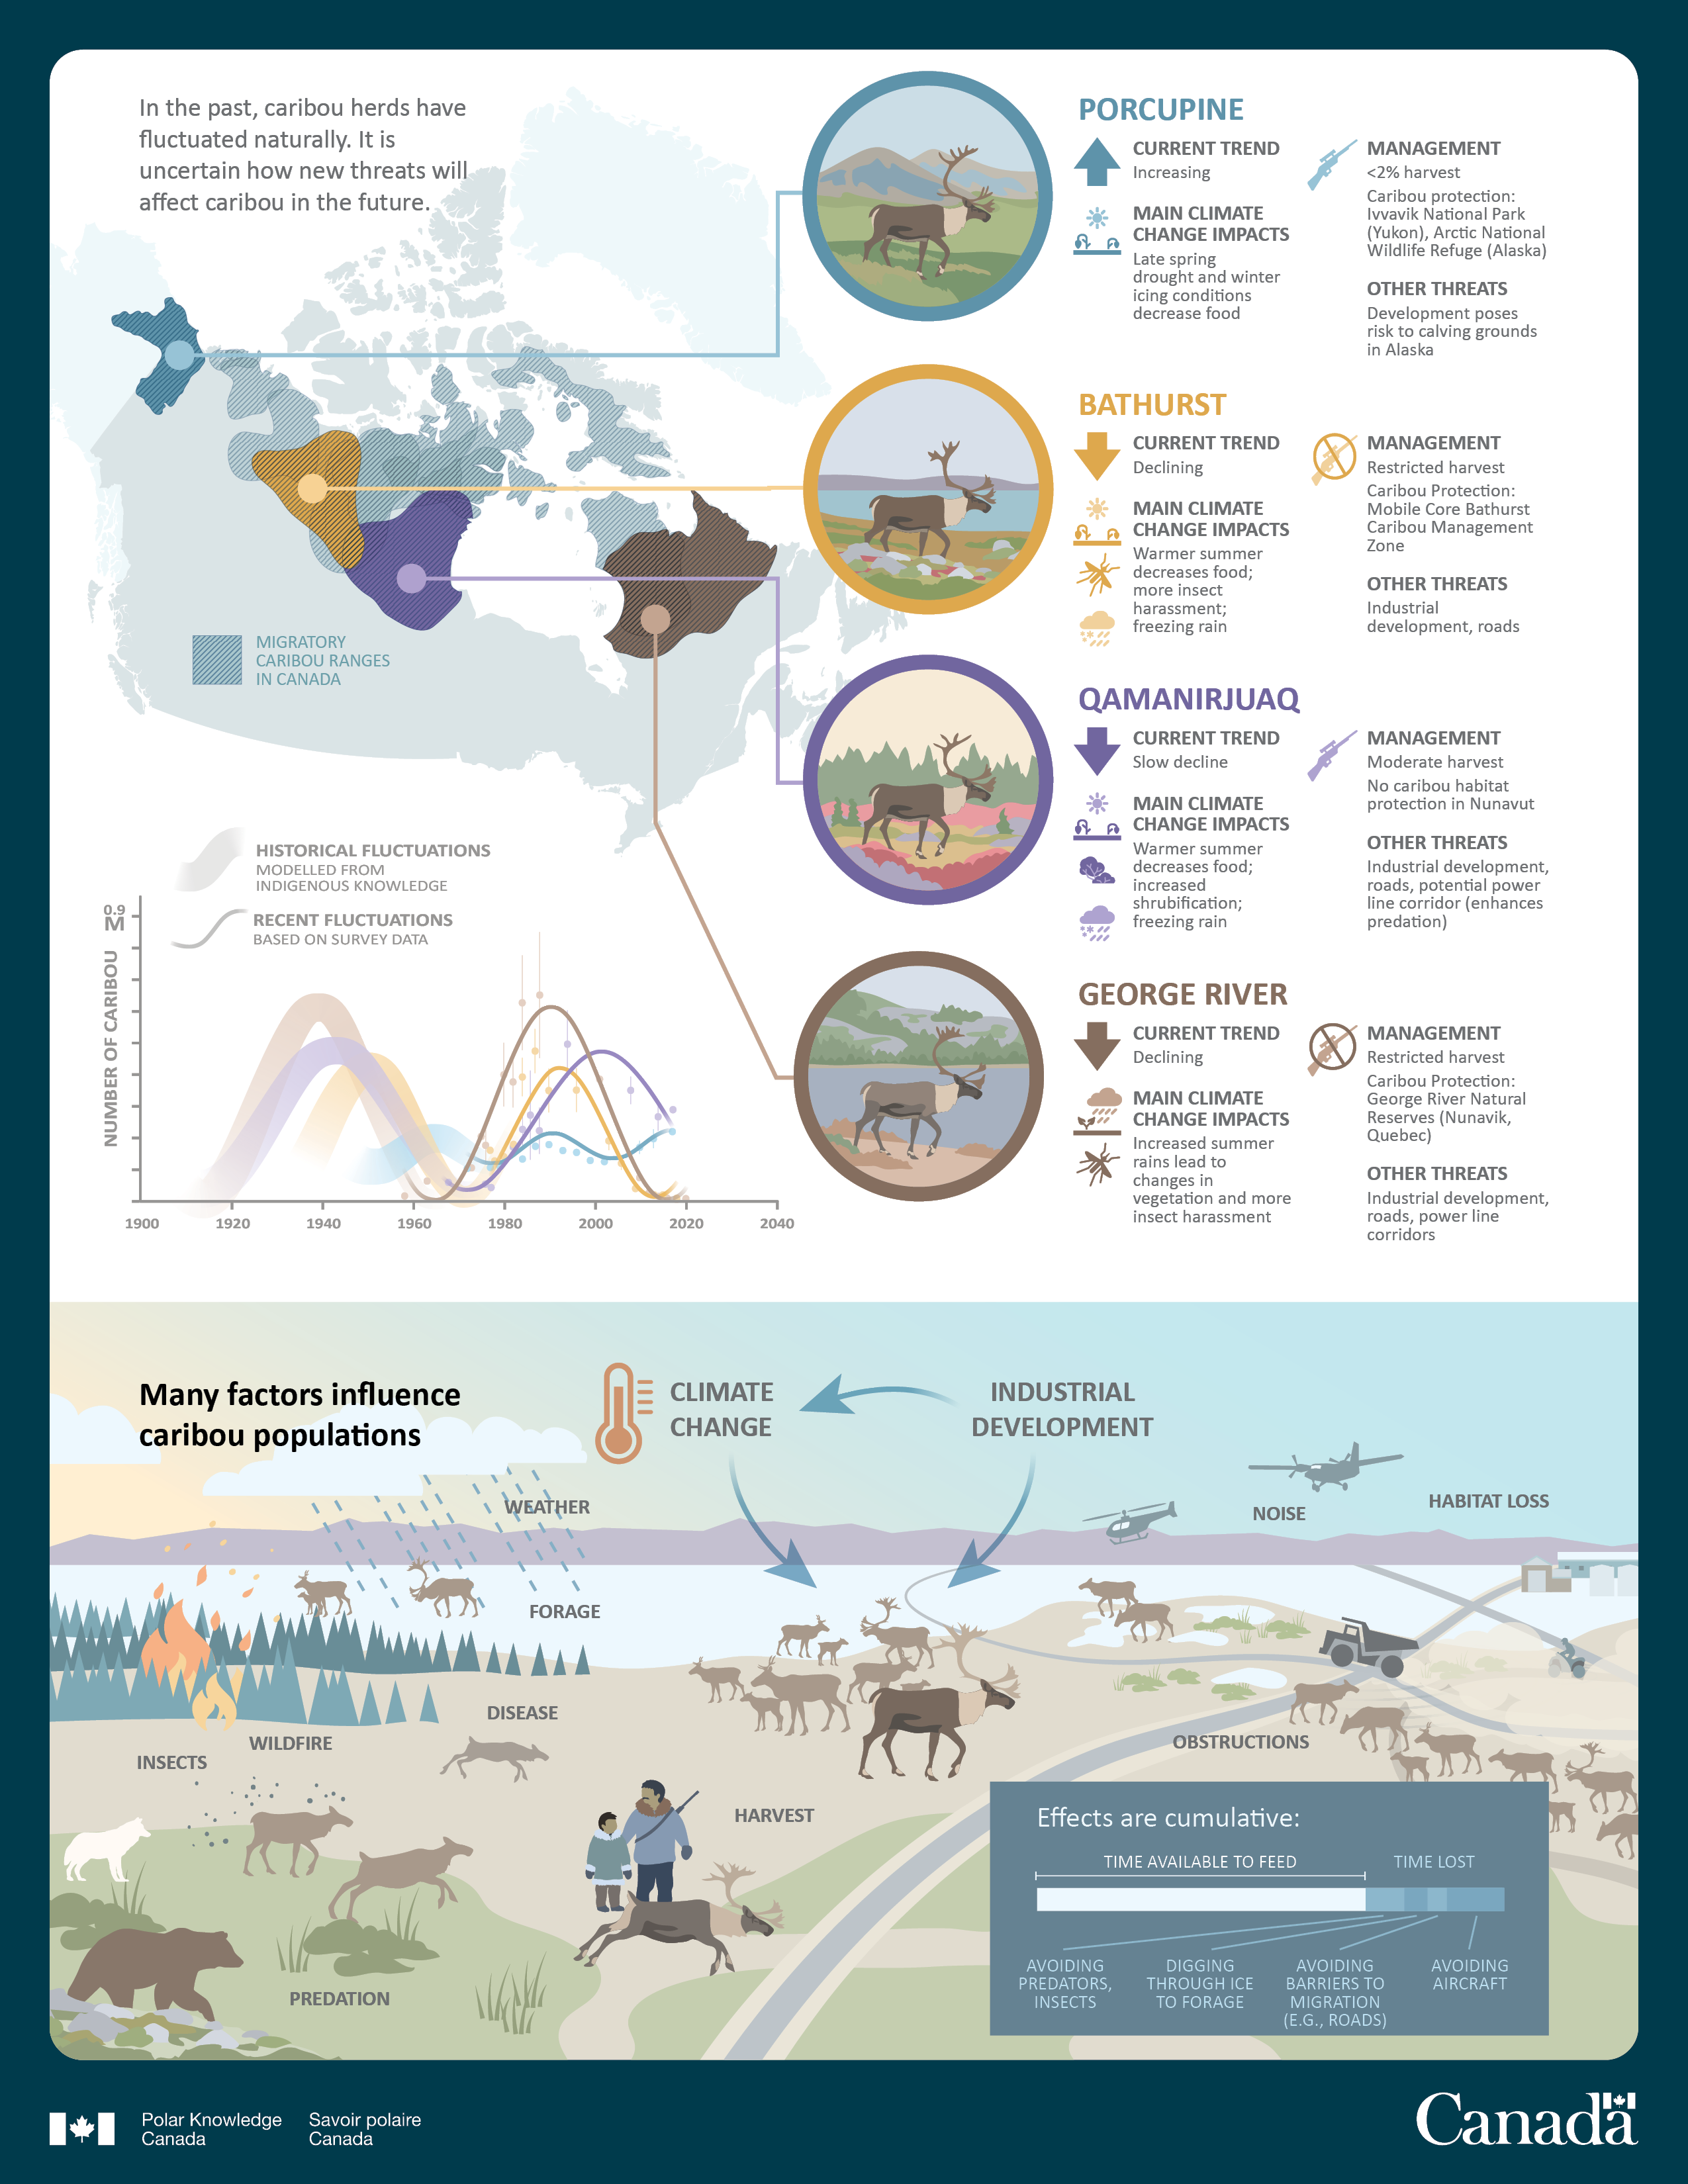
An infographic shows a simplified state of caribou herds in northern Canada and the factors affecting caribou population in the country. In the upper left corner of the infographic on the background of Canada's map are outlined ranges of the four caribou herds including: Porcupine, Bathurst, Quamaniruaq and Gorge River. In addition, migratory ranges of the herds are also outlined on the map. Above the map the capture reads "In the past, caribou herds have fluctuated naturally. It is uncertain how new threats will affect caribou in the future. "From each of the outlined ranges on the map, an arrow points into an image of caribou in a circle symbolizing each of the four herds and the environment those herds live in.
The first image symbolizes the Porcupine herd. An arrow beside points upwards and the capture reads "current (population) trend- increasing. An image of snow and vegetation symbolizing climate change is accompanied by the capture "main climate change impacts- Late spring drought and winter icing conditions decrease food". An image of the rifle is accompanied by a capture "managed harvest less than 2 percent a year" and "other threats- Development poses risk to calving grounds in Alaska"
Below, the second image symbolizes the Bathurst herd. An arow beside points downward symbolizing current population and the capture reads "current trend-declining". Images of snow, vegetation, insects and rain are symbolizing climate change is accompanied by the capture "main climate change impacts- Warmer summer decreases food; more insect harassment; freezing rain". An image of a crossed rifle is accompanied by a capture "managed harvest-restricted" and "other threats-industrial development, roads".
Third image below symbolizes the Quamaniruaq herd. An arow beside points downward symbolizing current population and the capture reads "current trend-declining". Images of snow, vegetation, and rain are symbolizing climate change is accompanied by the capture "main climate change impacts- Warmer summer decreases food; increased shrubbification; freezing rain. An image of a rifle is accompanied by a capture "managed harvest-moderate" and "other threats-industrial development, roads, potential power line corridor (enhances predation), ".
The fourth image below symbolizes the George River herd. An arow beside points downward symbolizing current population and the capture reads "current trend-declining". Images of rain, vegetation and insects and rain are symbolizing climate change is accompanied by capture "Increased summer rains lead to changes in vegetation and more insect harassment. An image of a rifle is accompanied by a capture " managed harvest-restricted" and "other threats-industrial development, roads power line corridors, ".
On the left beside the images representing the four herds there is a graph showing historical fluctuations in caribou population of all four herds. The graph shows how the number of caribou in all four herds fared from the year 1900 to the present time showing herds peaking around 1940s, collapsing in the 1960s, rising again in the 1980s and showing significant decline in the 2000s. The graph is based on the surveys completed and on the Indigenous Knowledge as identified by the captures above the graph.
The last part of the infographic symbolizes factors influencing caribou population. On the image of a landscape symbolizing taiga, tundra and sea ice there are number of caribou and captures listing factors impacting caribou population, In the upper left corner of this part of the infographic the capture reads "Many factors influence caribou populations" Beside is an image of falling rain on a group of caribou crossing the ice and the capture reads "weather and forage". Beside the image of a burning forest the capture reads "wildfire" and beside an image of a sickly caribou the capture reads "disease". Images of a wolf, bear and mosquitos are accompanied by captures "insects" and "predation". An image of two hunters is accompanies by a capture "harvest". In the center of this part of the infographic a group of caribou is accompanied by the images of a thermometer symbolizing climate change and two captures reading "climate change" and "industrial development" are joined by circular arrows symbolizing the dual impacts on caribou. Images of helicopter and a plane are accompanied by a capture reading "noise". The image of settlement is accompanied by a capture "habitat loss and the image of roads crossing the tundra is accompanied by the capture "obstructions". In the right corner of the infographic there is a bar graph showing the cumulative impacts of factors influencing caribou population. The graph shows time available to feed as the longer bar and time lost due to avoiding predators and insects; digging through ice; avoiding barriers to migration; avoiding aircraft, as shorter bars.

Citation information
Bongelli, E., Orman, L., Adamczewski, J., Campbell, M., Cluff, H. D., Guile, A., Pellissey, J., Qaqqutaq, E., Ray, J., Russell, D., Schmelzer, I., Suitor, M. and Taillon, J., 2022, Caribou – Heartbeat of the tundra. Polar Knowledge: Aqhaliat Report, Volume 4, Polar Knowledge Canada, p. 84–105. DOI: 10.35298/pkc.2021.04.eng