
Modelling projections for opioid-related deaths to December 2022
Backgrounder
Download in PDF format
(940 KB, 5 pages)
Organization: Public Health Agency of Canada
Date published: 2022-06-23
June 23, 2022
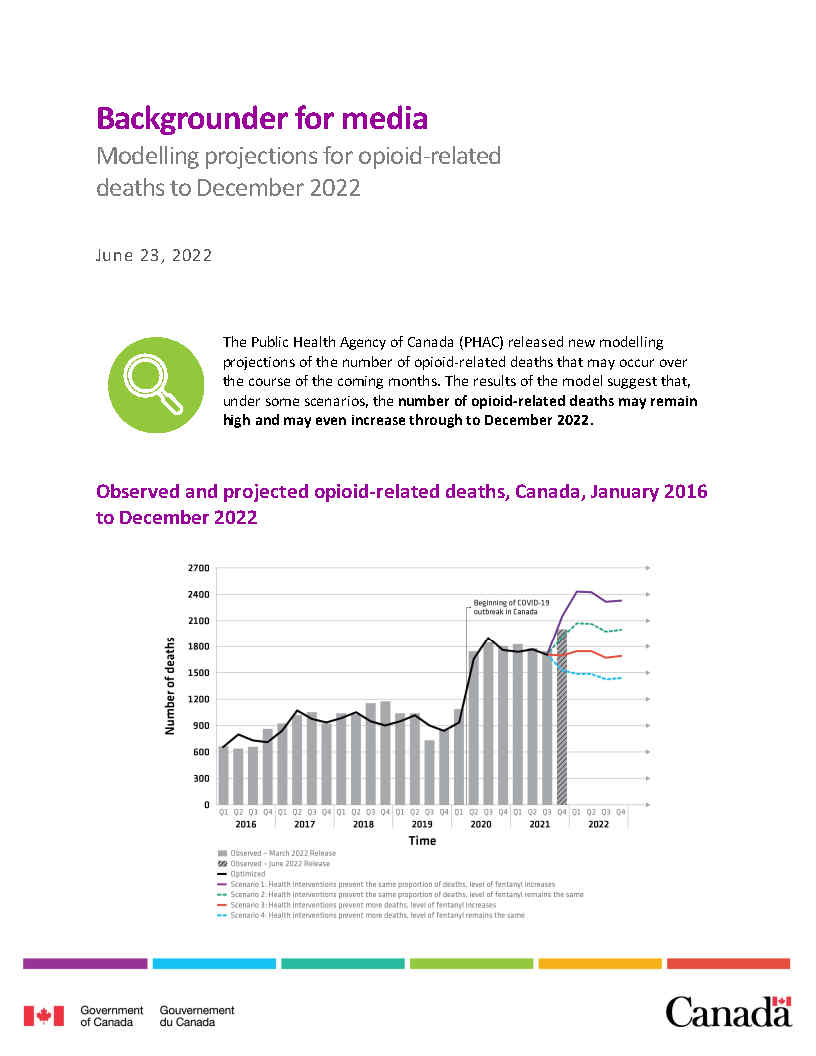
The Public Health Agency of Canada (PHAC) released new modelling projections of the number of opioid-related deaths that may occur over the course of the coming months. The results of the model suggest that, under some scenarios, the number of opioid-related deaths may remain high and may even increase through to December 2022.
Questions and answers
What would be the projected number of deaths under each scenario?
Scenario 1
- Health interventions continue to prevent the same proportion of opioid-related deaths.
- The level of fentanyl in the drug supply is higher than in December 2021.
- Projections reach the highest levels of opioid-related deaths since 2016, between approximately 2300 and 2400 deaths quarterly.
Scenario 2
- Health interventions continue to prevent the same proportion of opioid-related deaths.
- The level of fentanyl in the drug supply remains the same as in December 2021.
- Projections continue to show slightly higher levels of opioid-related deaths than what we have seen in the last year, between approximately 1950 and 2100 deaths quarterly.
Scenario 3
- Health interventions prevent an increased proportion of opioid-related deaths.
- The level of fentanyl in the drug supply is higher than in December 2021.
- Projections suggest that deaths may be lower than previous levels of opioid-related deaths seen during the COVID-19 period from the COVID-19 outbreak in 2020 through to December 2022, between approximately 1650 and 1750 deaths quarterly.
Scenario 4
- Health interventions prevent an increased proportion of opioid-related deaths.
- The level of fentanyl in the drug supply remains the same as in December 2021.
- Projections show a decrease in opioid-related deaths, but not to levels lower than the onset of COVID-19, between approximately 1400 and 1500 deaths quarterly.
Which scenario are we currently trending towards to in Canada?
Based on the most recent national data from December 2021, we are trending at Scenario 2, opioid-related deaths remaining high. In this scenario, deaths range from approximately 1950 to 2100 per quarter.
Can we use these projections for specific regions or provinces/territories?
This model was developed at a national level only and cannot be used for simulations at a provincial or territorial level.
How does this compare to the last modelling projections that were released in December 2021?
The most recent trends are similar to those released in December 2021. To better align the modelled results with observed data, the June 2022 simulations use a higher proportion of deaths prevented by health interventions during the observed period, lowering the level of people dying of overdose in comparison to the December 2021 simulations.
What do you mean by "health interventions to reduce opioid-related deaths"?
Given that models are simplifications of real-life systems, this model does not include specific health interventions to prevent opioid-relateddeaths. Rather, we include a value representing the combination of a wide range of efforts to reduce opioid-related deaths, such as:
- prevention e.g. public education, reduction of stigma around drug use and its impact on people who are using drugs;
- harm reduction e.g. supervised consumption sites, overdose prevention sites, safer supply, naloxone access/distribution and training, and
- treatment e.g. opioid agonist therapy.
In the model, the impact of these efforts is represented as the proportion of opioid-related deaths they may be preventing together. The model does not include specific interventions, as evidence on some is still emerging, while others lack findings that are applicable to the population level used in our model.
How are fentanyl levels measured? What data do you use in relation to these levels?
Similar to how we represent health interventions in the model, we include a value representing the level of fentanyl in the drug supply rather than the direct measurement of this. To create this "proxy" value, PHAC used data from Health Canada's Drug Analysis Service.
Why are you doing modelling projections for opioid-related deaths? Why is it important?
While models have recently been widely used in Canada in relation to infectious diseases, they can also be applied to other public health issues, such as substance-related deaths and harms.
While models cannot predict what will happen, they can help us understand what might happen in certain scenarios. This can help us plan and take action.
What kind of model is used in this case and how does it work?
PHAC developed a dynamic simulation model of opioid-related deaths. Models use mathematical equations to estimate how many cases of a disease may occur in the coming days, weeks, months or years. They help researchers simulate real-world possibilities in a virtual environment.
This model simulates how opioid-related deaths across Canada may unfold over the coming months, based on the level of fentanyl in the drug supply and the proportion of opioid-related deaths that are prevented by health interventions. PHAC uses data and information in the simulation model from many sources, including data from Statistics Canada, the Canadian Institute for Health Information, PHAC, Health Canada, the provinces and territories, and peer-reviewed literature.
Are the impacts of COVID-19 public health measures, such as physical distancing or reducing gathering sizes, reflected in these projections?
The impact of these COVID-19 public health measures are not accounted for in the model directly.
Rather, the model accounts for the COVID-19 context by changing the value of the proportion of opioid-related deaths that are prevented by health interventions within the context of the pandemic.
This value can be influenced by factors related to the pandemic such as isolation, causing people to use drugs alone, or the limited availability or accessibility of health and social services for people who use drugs, including life-saving harm reduction initiatives and treatment.
How often are these projections published?
As opioid-related harms have changed significantly over the past years, this model will be published twice a year.
How do I learn more about the methodology behind this model or fact check my news story?
Contact us and we will connect you with experts to answer your questions.