
Modelling apparent opioid toxicity deaths during the overdose crisis
On this page
- Overview
- Simulation model of apparent opioid toxicity deaths
- Current projections
- Technical notes
- Canada's approach to the overdose crisis
- Previous projections
Overview
The Public Health Agency of Canada (PHAC) developed a simulation model of apparent opioid toxicity deaths (AOTDs). The model provides information on the number of these deaths that might occur through to June 2025.
The opioid overdose crisis continues to have significant impacts on people living in Canada, their families and their communities. It remains one of the most serious public health crises in Canada's recent history.
There was a substantial increase in opioid-related harms and deaths at the beginning of the COVID-19 pandemic in 2020. The increase in opioid-related harms may have been related to:
- changes in the illegal drug supply
- increased use of substances as a way to cope with stress
- less access to supports and services for people who use drugs
Since then, although pandemic-related restrictions have been lifted, AOTDs have remained above pre-pandemic levels. The rise of fentanyl and other synthetic illegal opioids has made the drug supply increasingly unpredictable. As well, the rising trend of polysubstance use—for example, where individuals use opioids in combination with stimulants or benzodiazepines—has increased overdose risk and may impact the effectiveness of health interventions.
PHAC publishes data on opioid-related harms every 3 months based on coroner and medical examiner investigations. These data help provide a national picture, inform decision makers, and guide response efforts. There is an average 6-month delay across Canada between a death occurring and it being included in the data. To supplement these data, PHAC developed a model for projecting AOTDs that might occur in Canada. This report presents the results from that model.
Simulation model of apparent opioid toxicity deaths
Simulation models approximate real-world possibilities by using math equations to estimate how many cases of a disease or health event may occur in the coming months or years. The PHAC simulation model can't predict what will happen. However, it can help governments and Canadians understand what might happen in certain scenarios. These results can help plan and act to achieve the best possible outcome.
Simulations are based on several scenarios, specifically:
- the proportion of toxic fentanyl and its analogues in the opioid drug supply
- the proportion of AOTDs prevented by a combination of health interventions, like supervised consumption sites and naloxone distribution
Please refer to the Technical notes section for more information.
Current projections
Projections to June 2025
The model results suggest that, under some scenarios, the number of AOTDs may remain high or may decrease through to June 2025, but not to levels seen before 2020.
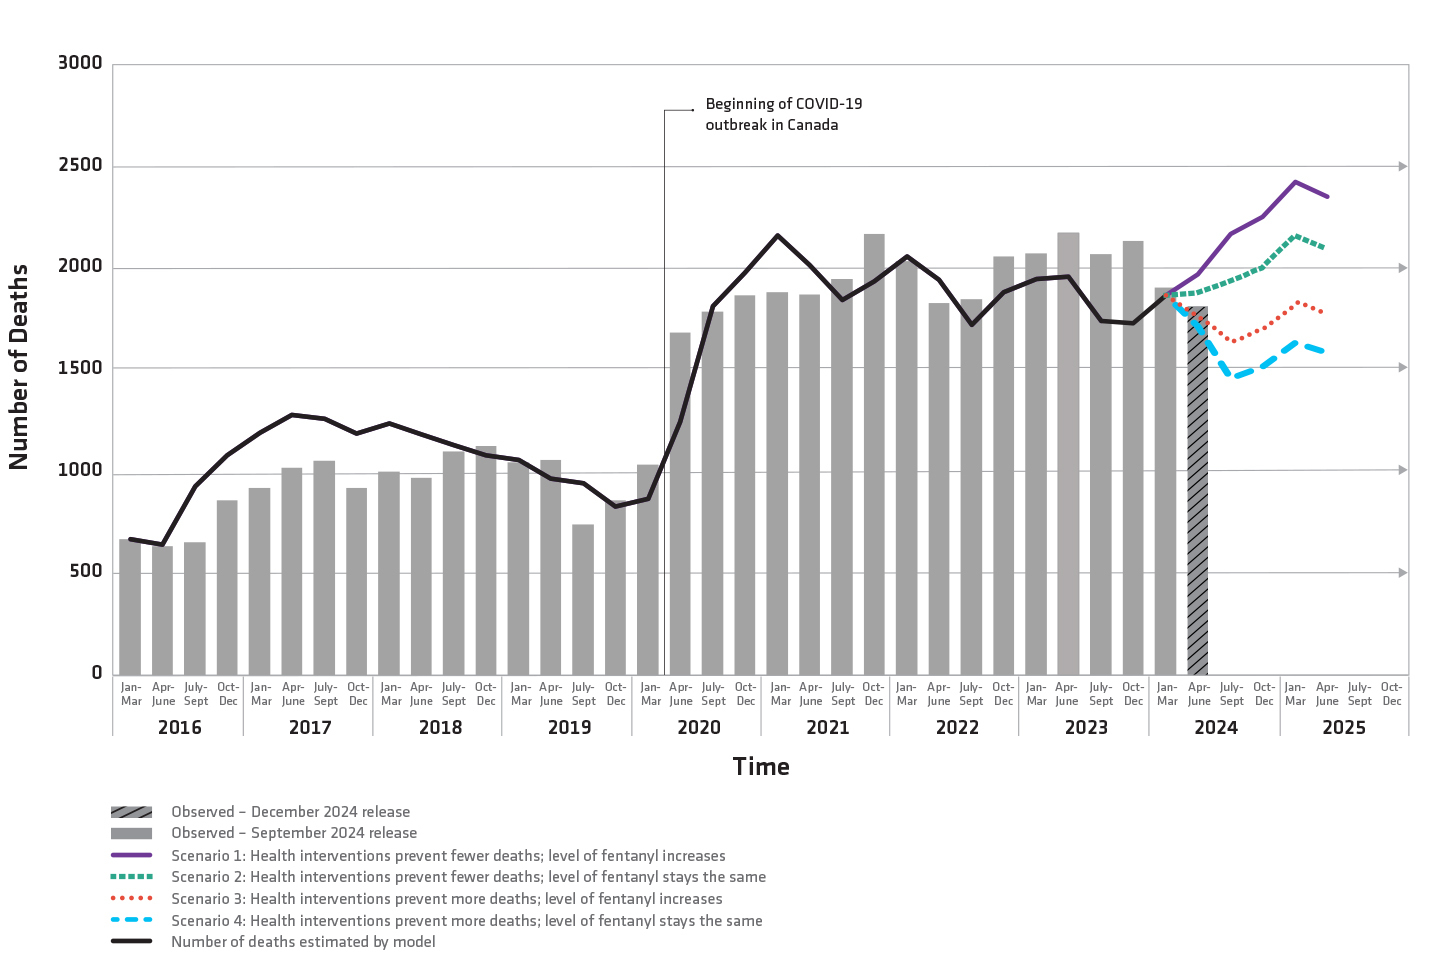
Figure 1 text description: Observed and projected apparent opioid toxicity deaths, Canada, January 2016 to June 2025
| Time period | Observed number of deaths based on September 2024 surveillance data release | Number of deaths estimated by the modelFootnote a | Scenario 1: Health interventions prevent fewer deaths; level of fentanyl increases | Scenario 2: Health interventions prevent fewer deaths; level of fentanyl stays the same | Scenario 3: Health interventions prevent more deaths; level of fentanyl increases | Scenario 4: Health interventions prevent more deaths; level of fentanyl stays the same | |
|---|---|---|---|---|---|---|---|
| 2016 | Jan - Mar | 669 | 668 | N/A | N/A | N/A | N/A |
| Apr - June | 636 | 641 | N/A | N/A | N/A | N/A | |
| July - Sept | 654 | 929 | N/A | N/A | N/A | N/A | |
| Oct - Dec | 862 | 1082 | N/A | N/A | N/A | N/A | |
| 2017 | Jan - Mar | 922 | 1192 | N/A | N/A | N/A | N/A |
| Apr - June | 1022 | 1280 | N/A | N/A | N/A | N/A | |
| July - Sept | 1057 | 1263 | N/A | N/A | N/A | N/A | |
| Oct - Dec | 922 | 1188 | N/A | N/A | N/A | N/A | |
| 2018 | Jan - Mar | 1001 | 1238 | N/A | N/A | N/A | N/A |
| Apr - June | 972 | 1186 | N/A | N/A | N/A | N/A | |
| July - Sept | 1100 | 1131 | N/A | N/A | N/A | N/A | |
| Oct - Dec | 1128 | 1082 | N/A | N/A | N/A | N/A | |
| 2019 | Jan - Mar | 1049 | 1061 | N/A | N/A | N/A | N/A |
| Apr - June | 1060 | 968 | N/A | N/A | N/A | N/A | |
| July - Sept | 741 | 943 | N/A | N/A | N/A | N/A | |
| Oct - Dec | 862 | 830 | N/A | N/A | N/A | N/A | |
| 2020 | Jan - Mar | 1037 | 870 | N/A | N/A | N/A | N/A |
| Apr - June | 1686 | 1248 | N/A | N/A | N/A | N/A | |
| July - Sept | 1788 | 1817 | N/A | N/A | N/A | N/A | |
| Oct - Dec | 1870 | 1980 | N/A | N/A | N/A | N/A | |
| 2021 | Jan - Mar | 1883 | 2162 | N/A | N/A | N/A | N/A |
| Apr - June | 1874 | 2017 | N/A | N/A | N/A | N/A | |
| July - Sept | 1951 | 1845 | N/A | N/A | N/A | N/A | |
| Oct - Dec | 2171 | 1937 | N/A | N/A | N/A | N/A | |
| 2022 | Jan - Mar | 2036 | 2061 | N/A | N/A | N/A | N/A |
| Apr - June | 1832 | 1947 | N/A | N/A | N/A | N/A | |
| July - Sept | 1848 | 1724 | N/A | N/A | N/A | N/A | |
| Oct - Dec | 2060 | 1882 | N/A | N/A | N/A | N/A | |
| 2023 | Jan - Mar | 2075 | 1948 | N/A | N/A | N/A | N/A |
| Apr - June | 2176 | 1959 | N/A | N/A | N/A | N/A | |
| July - Sept | 2071 | 1741 | N/A | N/A | N/A | N/A | |
| Oct - Dec | 2137 | 1731 | N/A | N/A | N/A | N/A | |
| 2024 | Jan - Mar | 1906 | 1869 | N/A | N/A | N/A | N/A |
| Apr - June | 1817Footnote b | N/A | 1972 | 1887 | 1779 | 1715 | |
| July - Sept | N/A | N/A | 2170 | 1934 | 1637 | 1460 | |
| Oct - Dec | N/A | N/A | 2255 | 2010 | 1702 | 1518 | |
| 2025 | Jan - Mar | N/A | N/A | 2427 | 2164 | 1833 | 1634 |
| Apr - June | N/A | N/A | 2355 | 2100 | 1779 | 1587 | |
|
N/A: not applicable
|
|||||||
- Scenario 1 (solid purple line): If health interventions prevent fewer AOTDs and the level of fentanyl and its analogues in the illegal drug supply increases after March 2024, then deaths may increase through to June 2025.
- Scenario 2 (square hashed green line): If health interventions prevent fewer AOTDs and the level of fentanyl and its analogues in the illegal drug supply remains the same compared to March 2024, then deaths through to June 2025 may be similar to levels observed in the past year.
- Scenario 3 (dotted hashed red line): If health interventions prevent more AOTDs and the level of fentanyl and its analogues in the illegal drug supply increases after March 2024, then deaths through to June 2025 may decrease.
- Scenario 4 (rectangular hashed blue line): If health interventions prevent more AOTDs and the level of fentanyl and its analogues in the illegal drug supply remains the same compared to March 2024, then deaths through to June 2025 may further decrease but not to levels observed before 2020.
Technical notes
PHAC developed a simulation model of AOTDs using a method called system dynamics modelling.
The simulations presented in the model reflect a combination of:
- model structure
- assumptions about what may happen to the opioid drug supply
- the proportion of AOTDs that are prevented through health interventions such as naloxone distribution and supervised consumption sites
In the model, people using opioids medically or non-medically can die from an opioid-related overdose at different rates. Non-medical opioid use is defined as the use of opioids without a prescription or in ways other than medically prescribed. Mortality rates for non-medical opioid use are affected by:
- the time of year
- the proportion of fentanyl and its analogues in the illegal drug supply
- the proportion of deaths prevented by health interventions designed to reduce AOTDs
Values used in the model were identified from:
- Health Canada
- Statistics Canada
- Public Health Agency of Canada
- Canadian Institute for Health Information
- provinces and territories
- peer-reviewed literature
The 4 projected scenarios each had the following assumptions:
- Scenario 1: Health interventions prevent 20% of AOTDs and fentanyl and its analogues make up 80% of the opioid drug supply.
- Scenario 2: Health interventions prevent 20% of AOTDs and fentanyl and its analogues make up 70% of the opioid drug supply.
- Scenario 3: Health interventions prevent 40% of AOTDs and fentanyl and its analogues make up 80% of the opioid drug supply.
- Scenario 4: Health interventions prevent 40% of AOTDs and fentanyl and its analogues make up 70% of the opioid drug supply.
Considerations
When interpreting model results, the following factors should be taken into consideration:
- if the model structure, parameter values or assumptions are incorrect, the simulations may not accurately represent what may happen
- this model considers Canada as a whole and does not account for regional variation
- as with all models, if the projections result in the introduction of measures that reduce the number of AOTDs, the projected numbers will be less accurate
- AOTDs from April to June 2024 are not used to create the model but are included in Figure 1
- the model uses data from the September 2024 release, which may vary slightly from the surveillance data released in December 2024, and comparisons should be made with caution
Ongoing updates
As opioid use and related harms have changed significantly over the past few years, this model will be published twice a year. Changes between the previous model released in June 2024 and the current model released in December 2024 include:
- updating the measure of toxicity in the drug supply to represent the most recent information on fentanyl and its analogues in the opioid drug supply from the Health Canada Drug Analysis Service (DAS)
- updating other parameter values as more peer-reviewed literature and data has become available
- updating the model with the surveillance data on AOTDs through March 2024
PHAC will update its model as it learns more about the opioid overdose crisis.
Additional information
For details regarding the first version of the model, visit A Dynamic Model of Opioid Overdose Deaths in Canada during the Co-Occurring Opioid Overdose Crisis and COVID-19 Pandemic.
Canada's approach to the overdose crisis
Previous projections
Projections for 2024 (released June 2024)
The model results suggest that, under some scenarios, the number of opioid-related deaths may remain high or may even increase through to December 2024.
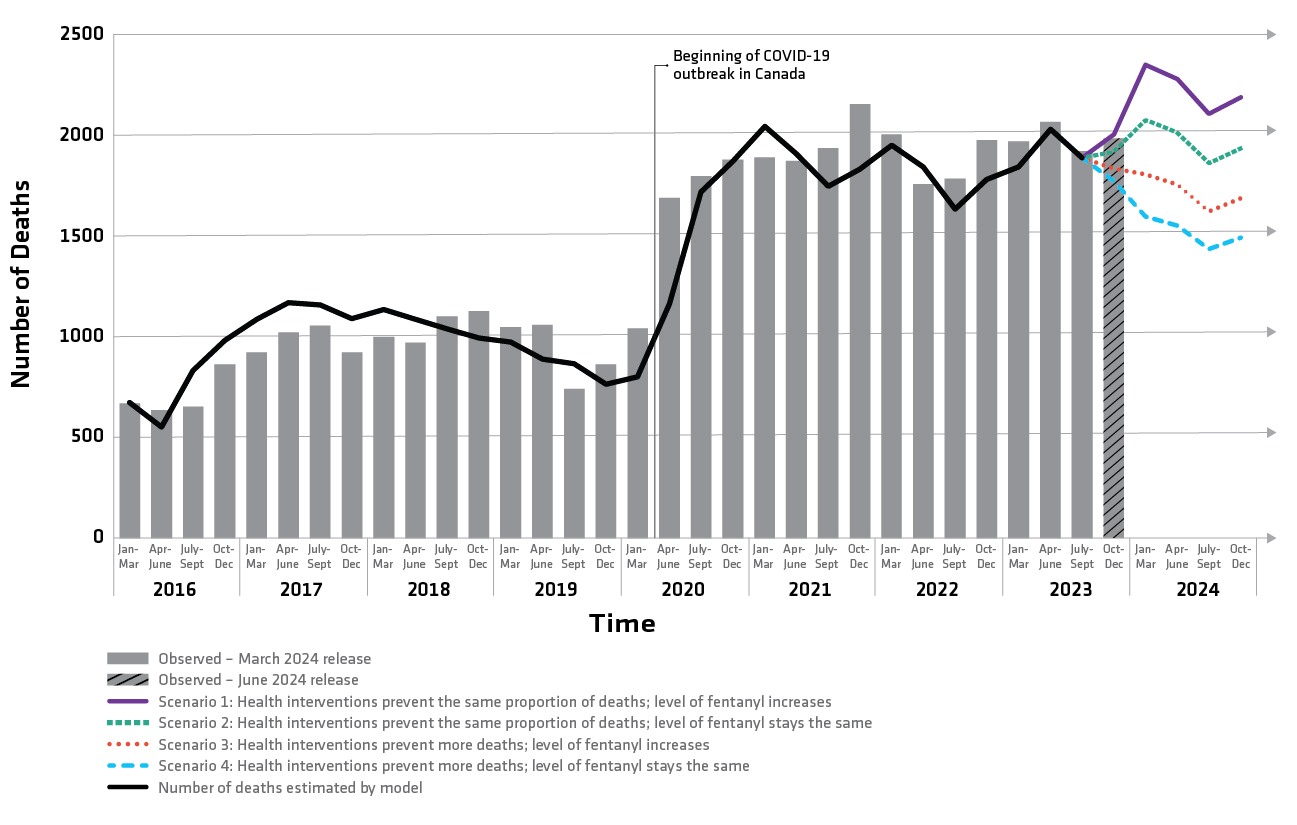
Figure 1 - text description: Observed and projected opioid-related deaths, Canada, January 2016 to December 2024
| Time | Observed number of deaths based on March 2024 surveillance data release | Number of deaths estimated by the modelFootnote a | Scenario 1: Health interventions prevent the same proportion of deaths; level of fentanyl increases | Scenario 2: Health interventions prevent the same proportion of deaths; level of fentanyl stays the same | Scenario 3: Health interventions prevent more deaths; level of fentanyl increases | Scenario 4: Health interventions prevent more deaths; level of fentanyl stays the same | |
|---|---|---|---|---|---|---|---|
| 2016 | Jan - Mar | 669 | 669 | N/A | N/A | N/A | N/A |
| Apr - June | 636 | 547 | N/A | N/A | N/A | N/A | |
| July - Sept | 654 | 829 | N/A | N/A | N/A | N/A | |
| Oct - Dec | 862 | 979 | N/A | N/A | N/A | N/A | |
| 2017 | Jan - Mar | 922 | 1084 | N/A | N/A | N/A | N/A |
| Apr - June | 1021 | 1168 | N/A | N/A | N/A | N/A | |
| July - Sept | 1056 | 1154 | N/A | N/A | N/A | N/A | |
| Oct - Dec | 922 | 1086 | N/A | N/A | N/A | N/A | |
| 2018 | Jan - Mar | 1000 | 1132 | N/A | N/A | N/A | N/A |
| Apr - June | 972 | 1085 | N/A | N/A | N/A | N/A | |
| July - Sept | 1102 | 1035 | N/A | N/A | N/A | N/A | |
| Oct - Dec | 1128 | 991 | N/A | N/A | N/A | N/A | |
| 2019 | Jan - Mar | 1048 | 972 | N/A | N/A | N/A | N/A |
| Apr - June | 1059 | 887 | N/A | N/A | N/A | N/A | |
| July - Sept | 741 | 864 | N/A | N/A | N/A | N/A | |
| Oct - Dec | 863 | 761 | N/A | N/A | N/A | N/A | |
| 2020 | Jan - Mar | 1042 | 797 | N/A | N/A | N/A | N/A |
| Apr - June | 1688 | 1161 | N/A | N/A | N/A | N/A | |
| July - Sept | 1797 | 1717 | N/A | N/A | N/A | N/A | |
| Oct - Dec | 1880 | 1871 | N/A | N/A | N/A | N/A | |
| 2021 | Jan - Mar | 1890 | 2043 | N/A | N/A | N/A | N/A |
| Apr - June | 1873 | 1906 | N/A | N/A | N/A | N/A | |
| July - Sept | 1936 | 1744 | N/A | N/A | N/A | N/A | |
| Oct - Dec | 2154 | 1831 | N/A | N/A | N/A | N/A | |
| 2022 | Jan - Mar | 2005 | 1949 | N/A | N/A | N/A | N/A |
| Apr - June | 1757 | 1841 | N/A | N/A | N/A | N/A | |
| July - Sept | 1784 | 1631 | N/A | N/A | N/A | N/A | |
| Oct - Dec | 1975 | 1781 | N/A | N/A | N/A | N/A | |
| 2023 | Jan - Mar | 1969 | 1843 | N/A | N/A | N/A | N/A |
| Apr - June | 2066 | 2029 | N/A | N/A | N/A | N/A | |
| July - Sept | 1922 | 1886 | N/A | N/A | N/A | N/A | |
| Oct - Dec | 1984Footnote b | N/A | 2003 | 1918 | 1835 | 1770 | |
| 2024 | Jan - Mar | N/A | N/A | 2351 | 2076 | 1806 | 1596 |
| Apr - Jun | N/A | N/A | 2280 | 2015 | 1754 | 1550 | |
| July - Sept | N/A | N/A | 2106 | 1862 | 1621 | 1434 | |
| Oct - Dec | N/A | N/A | 2189 | 1935 | 1686 | 1491 | |
| N/A: not applicable | |||||||
|
|||||||
- Scenario 1 (solid purple line): If health interventions prevent the same proportion of opioid-related deaths as they did in September 2023 and the level of fentanyl and its analogues in the illegal drug supply increases after September 2023, then deaths may increase through to December 2024.
- Scenario 2 (square hashed green line): If health interventions prevent the same proportion of opioid-related deaths as they did in September 2023 and the level of fentanyl and its analogues in the illegal drug supply remains the same as September 2023, then deaths through to December 2024 may be similar to levels observed in the past year.
- Scenario 3 (dotted hashed red line): If health interventions prevent more opioid-related deaths after September 2023 and the level of fentanyl and its analogues in the illegal drug supply increases after September 2023, then deaths through to December 2024 may decrease.
- Scenario 4 (rectangular hashed blue line): If health interventions prevent more opioid-related deaths after September 2023 and the level of fentanyl and its analogues in the illegal drug supply remains the same as September 2023, then deaths through to December 2024 may further decrease but not to levels observed before the onset of the COVID-19 pandemic.
Technical notes
PHAC developed a simulation model of opioid-related deaths using a method called system dynamics modelling.
The simulations presented in the model reflect a combination of:
- model structure
- assumptions about what may happen to the opioid drug supply
- the proportion of opioid-related deaths that are prevented through health interventions such as naloxone or supervised consumption sites
In the model, people using opioids medically or non-medically, can die from an opioid-related overdose at different rates depending on the type of opioid use. Non-medical opioid use is defined as the use of opioids without a prescription or in ways other than medically prescribed. Mortality rates for non-medical opioid use are affected by:
- the time of year
- the proportion of fentanyl and its analogues in the illegal drug supply
- the proportion of deaths prevented by health interventions designed to reduce opioid-related deaths
Values used in the model were identified from:
- Health Canada
- Statistics Canada
- Public Health Agency of Canada
- Canadian Institute for Health Information
- provinces and territories
- peer-reviewed literature
The 4 projected scenarios each had the following assumptions:
Scenario 1: Health interventions prevent 15% of opioid-related deaths and fentanyl and its analogues make up 80% of the opioid drug supply.
Scenario 2: Health interventions prevent 15% of opioid-related deaths and fentanyl and its analogues make up 69% of the opioid drug supply.
Scenario 3: Health interventions prevent 35% of opioid-related deaths and fentanyl and its analogues make up 80% of the opioid drug supply.
Scenario 4: Health interventions prevent 35% of opioid-related deaths and fentanyl and its analogues make up 69% of the opioid drug supply.
Considerations
When interpreting model results, the following factors should be taken into consideration:
- if the model structure, parameter values or assumptions are incorrect, the simulations may not accurately represent what may happen
- this model considers Canada as a whole and does not account for regional variation
- as with all models, if the projections result in the introduction of measures that reduce the number of opioid-related deaths, the projected numbers will be less accurate
- opioid-related deaths from October to December 2023 are not used to create the model but are included in Figure 1
- the model uses data from the March 2024 release, which may vary slightly from the surveillance data released in June 2024, and comparisons should be made with caution
Ongoing updates
As opioid use and related harms have changed significantly over the past few years, this model will be published twice a year. Changes between the previous model released in December 2023 and the current model released in June 2024 include:
- the measure of toxicity in the drug supply has been updated to represent the most recent information on fentanyl and its analogues in the opioid drug supply from the Health Canada Drug Analysis Service (DAS)
- other parameter values have been updated as more peer-reviewed literature and data has become available
- the model has been updated with the surveillance data on apparent opioid-related deaths through September 2023
PHAC will update its model as it learns more about the opioid overdose crisis.
Projections for 2024 (released December 2023)
The results of the model suggest that, under some scenarios, the number of opioid-related deaths may remain high or may even increase through to June 2024.
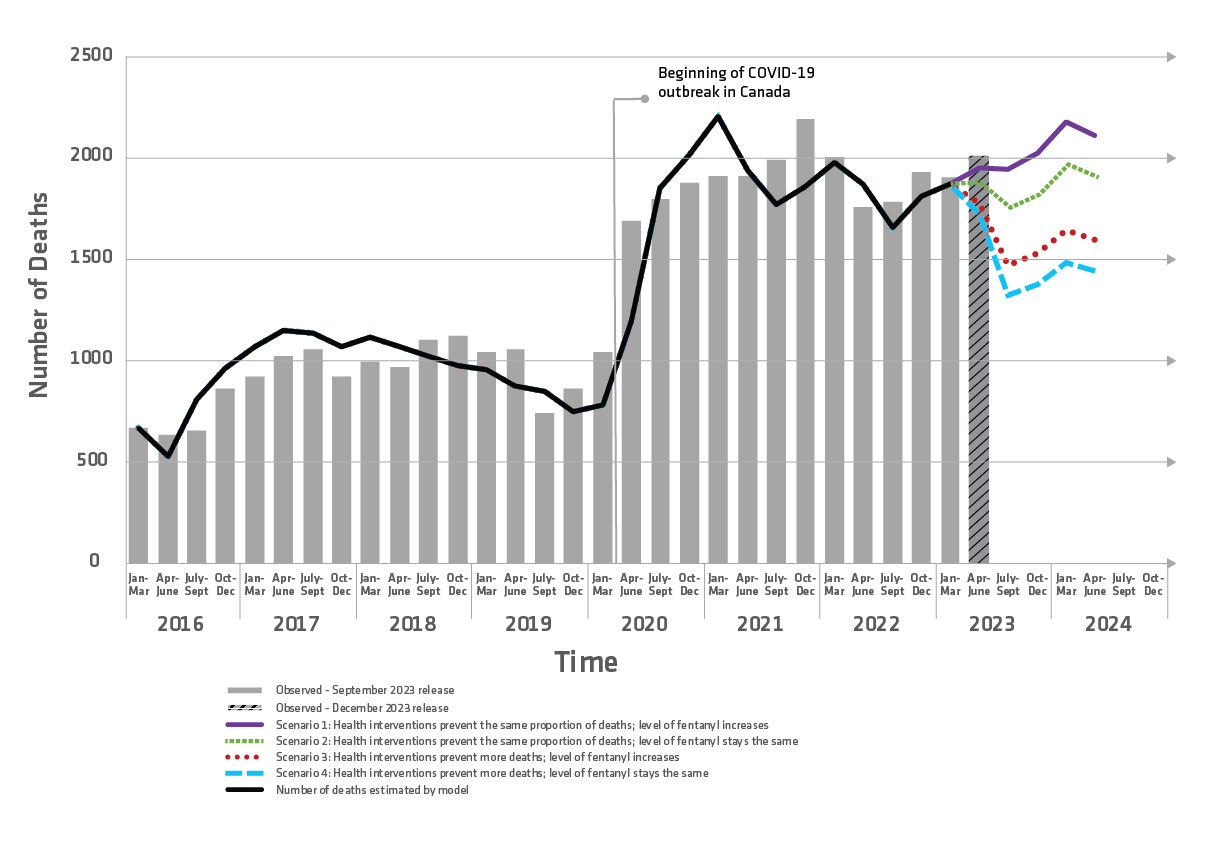
Figure 1 - text description: Observed and projected opioid-related deaths, Canada, January 2016 to June 2024
| Time | Observed number of deaths based on September 2023 surveillance data release | Number of deaths estimated by the modelFootnote a | Scenario 1: Health interventions prevent the same proportion of deaths; level of fentanyl increases | Scenario 2: Health interventions prevent the same proportion of deaths; level of fentanyl stays the same | Scenario 3: Health interventions prevent more deaths; level of fentanyl increases | Scenario 4: Health interventions prevent more deaths; level of fentanyl stays the same | |
|---|---|---|---|---|---|---|---|
| 2016 | Jan - Mar | 669 | 668 | N/A | N/A | N/A | N/A |
| Apr - June | 636 | 528 | N/A | N/A | N/A | N/A | |
| July - Sept | 654 | 813 | N/A | N/A | N/A | N/A | |
| Oct - Dec | 862 | 964 | N/A | N/A | N/A | N/A | |
| 2017 | Jan - Mar | 922 | 1070 | N/A | N/A | N/A | N/A |
| Apr - June | 1021 | 1153 | N/A | N/A | N/A | N/A | |
| July - Sept | 1056 | 1139 | N/A | N/A | N/A | N/A | |
| Oct - Dec | 921 | 1073 | N/A | N/A | N/A | N/A | |
| 2018 | Jan - Mar | 999 | 1117 | N/A | N/A | N/A | N/A |
| Apr - June | 972 | 1071 | N/A | N/A | N/A | N/A | |
| July - Sept | 1102 | 1022 | N/A | N/A | N/A | N/A | |
| Oct - Dec | 1126 | 978 | N/A | N/A | N/A | N/A | |
| 2019 | Jan - Mar | 1046 | 958 | N/A | N/A | N/A | N/A |
| Apr - June | 1058 | 874 | N/A | N/A | N/A | N/A | |
| July - Sept | 741 | 851 | N/A | N/A | N/A | N/A | |
| Oct - Dec | 862 | 750 | N/A | N/A | N/A | N/A | |
| 2020 | Jan - Mar | 1041 | 786 | N/A | N/A | N/A | N/A |
| Apr - June | 1689 | 1200 | N/A | N/A | N/A | N/A | |
| July - Sept | 1796 | 1852 | N/A | N/A | N/A | N/A | |
| Oct - Dec | 1878 | 2017 | N/A | N/A | N/A | N/A | |
| 2021 | Jan - Mar | 1911 | 2201 | N/A | N/A | N/A | N/A |
| Apr - June | 1913 | 1935 | N/A | N/A | N/A | N/A | |
| July - Sept | 1992 | 1771 | N/A | N/A | N/A | N/A | |
| Oct - Dec | 2193 | 1859 | N/A | N/A | N/A | N/A | |
| 2022 | Jan - Mar | 2001 | 1979 | N/A | N/A | N/A | N/A |
| Apr - June | 1758 | 1870 | N/A | N/A | N/A | N/A | |
| July - Sept | 1782 | 1657 | N/A | N/A | N/A | N/A | |
| Oct - Dec | 1928 | 1808 | N/A | N/A | N/A | N/A | |
| 2023 | Jan - Mar | 1902 | 1873 | N/A | N/A | N/A | N/A |
| Apr - June | 2010Footnote b | N/A | 1951 | 1882 | 1778 | 1727 | |
| July - Sept | N/A | N/A | 1946 | 1755 | 1469 | 1325 | |
| Oct - Dec | N/A | N/A | 2023 | 1824 | 1527 | 1378 | |
| 2024 | Jan – Mar | N/A | N/A | 2178 | 1964 | 1645 | 1484 |
| Apr – Jun | N/A | N/A | 2113 | 1906 | 1597 | 1441 | |
| N/A: not applicable | |||||||
|
|||||||
Scenario 1 (solid purple line): If health interventions prevent the same proportion of opioid-related deaths as they did in March 2023 and the level of fentanyl and its analogues in the illegal drug supply increases after March 2023, then deaths may increase through to June 2024.
Scenario 2 (square hashed green line): If health interventions prevent the same proportion of opioid-related deaths as they did in March 2023, and the level of fentanyl and its analogues in the illegal drug supply remains the same as March 2023, then deaths through to June 2024 may be similar to levels observed in late 2021 and early 2022.
Scenario 3 (dotted hashed red line): If health interventions prevent more opioid-related deaths after March 2023, and the level of fentanyl and its analogues in the illegal drug supply increases after March 2023, then deaths through to June 2024 may decrease.
Scenario 4 (rectangular hashed blue line): If health interventions prevent more opioid-related deaths after March 2023, and the level of fentanyl and its analogues in the illegal drug supply remains the same as March 2023, then deaths through to June 2024 may further decrease but not to levels seen before the onset of the COVID-19 pandemic.
Notes
PHAC developed a simulation model of opioid-related deaths using a method called system dynamics modelling.
The simulations presented in the model reflect a combination of:
- model structure
- assumptions about what may happen to the opioid drug supply
- the proportion of opioid-related deaths that are prevented through health interventions such as naloxone or supervised consumption sites
In the model, people using opioids medically or non-medically can die from an opioid-related overdose at different rates, depending on the type of opioid use. Mortality rates for non-medical opioid use (the use of opioids without a prescription or in ways other than medically prescribed) are also affected by:
- the time of year
- the proportion of fentanyl and its analogues in the illegal drug supply
- the proportion of deaths prevented by health interventions designed to reduce opioid-related deaths
Values used in the model were identified from:
- Health Canada
- Statistics Canada
- Public Health Agency of Canada
- Canadian Institute for Health Information
- provinces and territories
- peer-reviewed literature
The 4 projected scenarios each had the following assumptions:
Scenario 1: Health interventions prevent 20% of opioid-related deaths and fentanyl and its analogues make up 80% of the opioid drug supply.
Scenario 2: Health interventions prevent 20% of opioid-related deaths and fentanyl and its analogues make up 71% of the opioid drug supply.
Scenario 3: Health interventions prevent 40% of opioid-related deaths and fentanyl and its analogues make up 80% of the opioid drug supply.
Scenario 4: Health interventions prevent 40% of opioid-related deaths and fentanyl and its analogues make up 71% of the opioid drug supply.
Considerations
When interpreting model results, it's important to recognize that:
- if the model structure, parameter values, or assumptions are incorrect, the simulations may not accurately represent what may happen
- this model considers Canada as a whole and does not account for regional variation
- as with all models, if the projections result in the introduction of measures that reduce the number of opioid-related deaths, the projected numbers will be less accurate
- opioid-related deaths from April to June 2023 are not used to create the model but are included in Figure 1
- the model uses data from the September 2023 release which may vary slightly from the surveillance data released in December 2023, and comparisons should be made with caution
Ongoing updates
As opioid use and related harms have changed significantly over the past few years, this model will be published twice a year. Changes between the previous model released in June 2023 and the current model released in December 2023 include:
- The measure of toxicity in the drug supply has been updated to represent the most recent information of fentanyl and its analogues in the opioid drug supply from the Health Canada Drug Analysis Service (DAS)
- Other parameter values have been updated as more peer-reviewed literature and data has become available
- The model has been updated with the surveillance data on apparent opioid-related deaths through March 2023
PHAC will update its model as it learns more about the opioid overdose crisis.
Projections for 2023 (released June 2023)
The results of the model suggest that, under some scenarios, the number of opioid-related deaths through to December 2023 may remain high or may decrease, but not to levels seen before the onset of the COVID-19 pandemic.
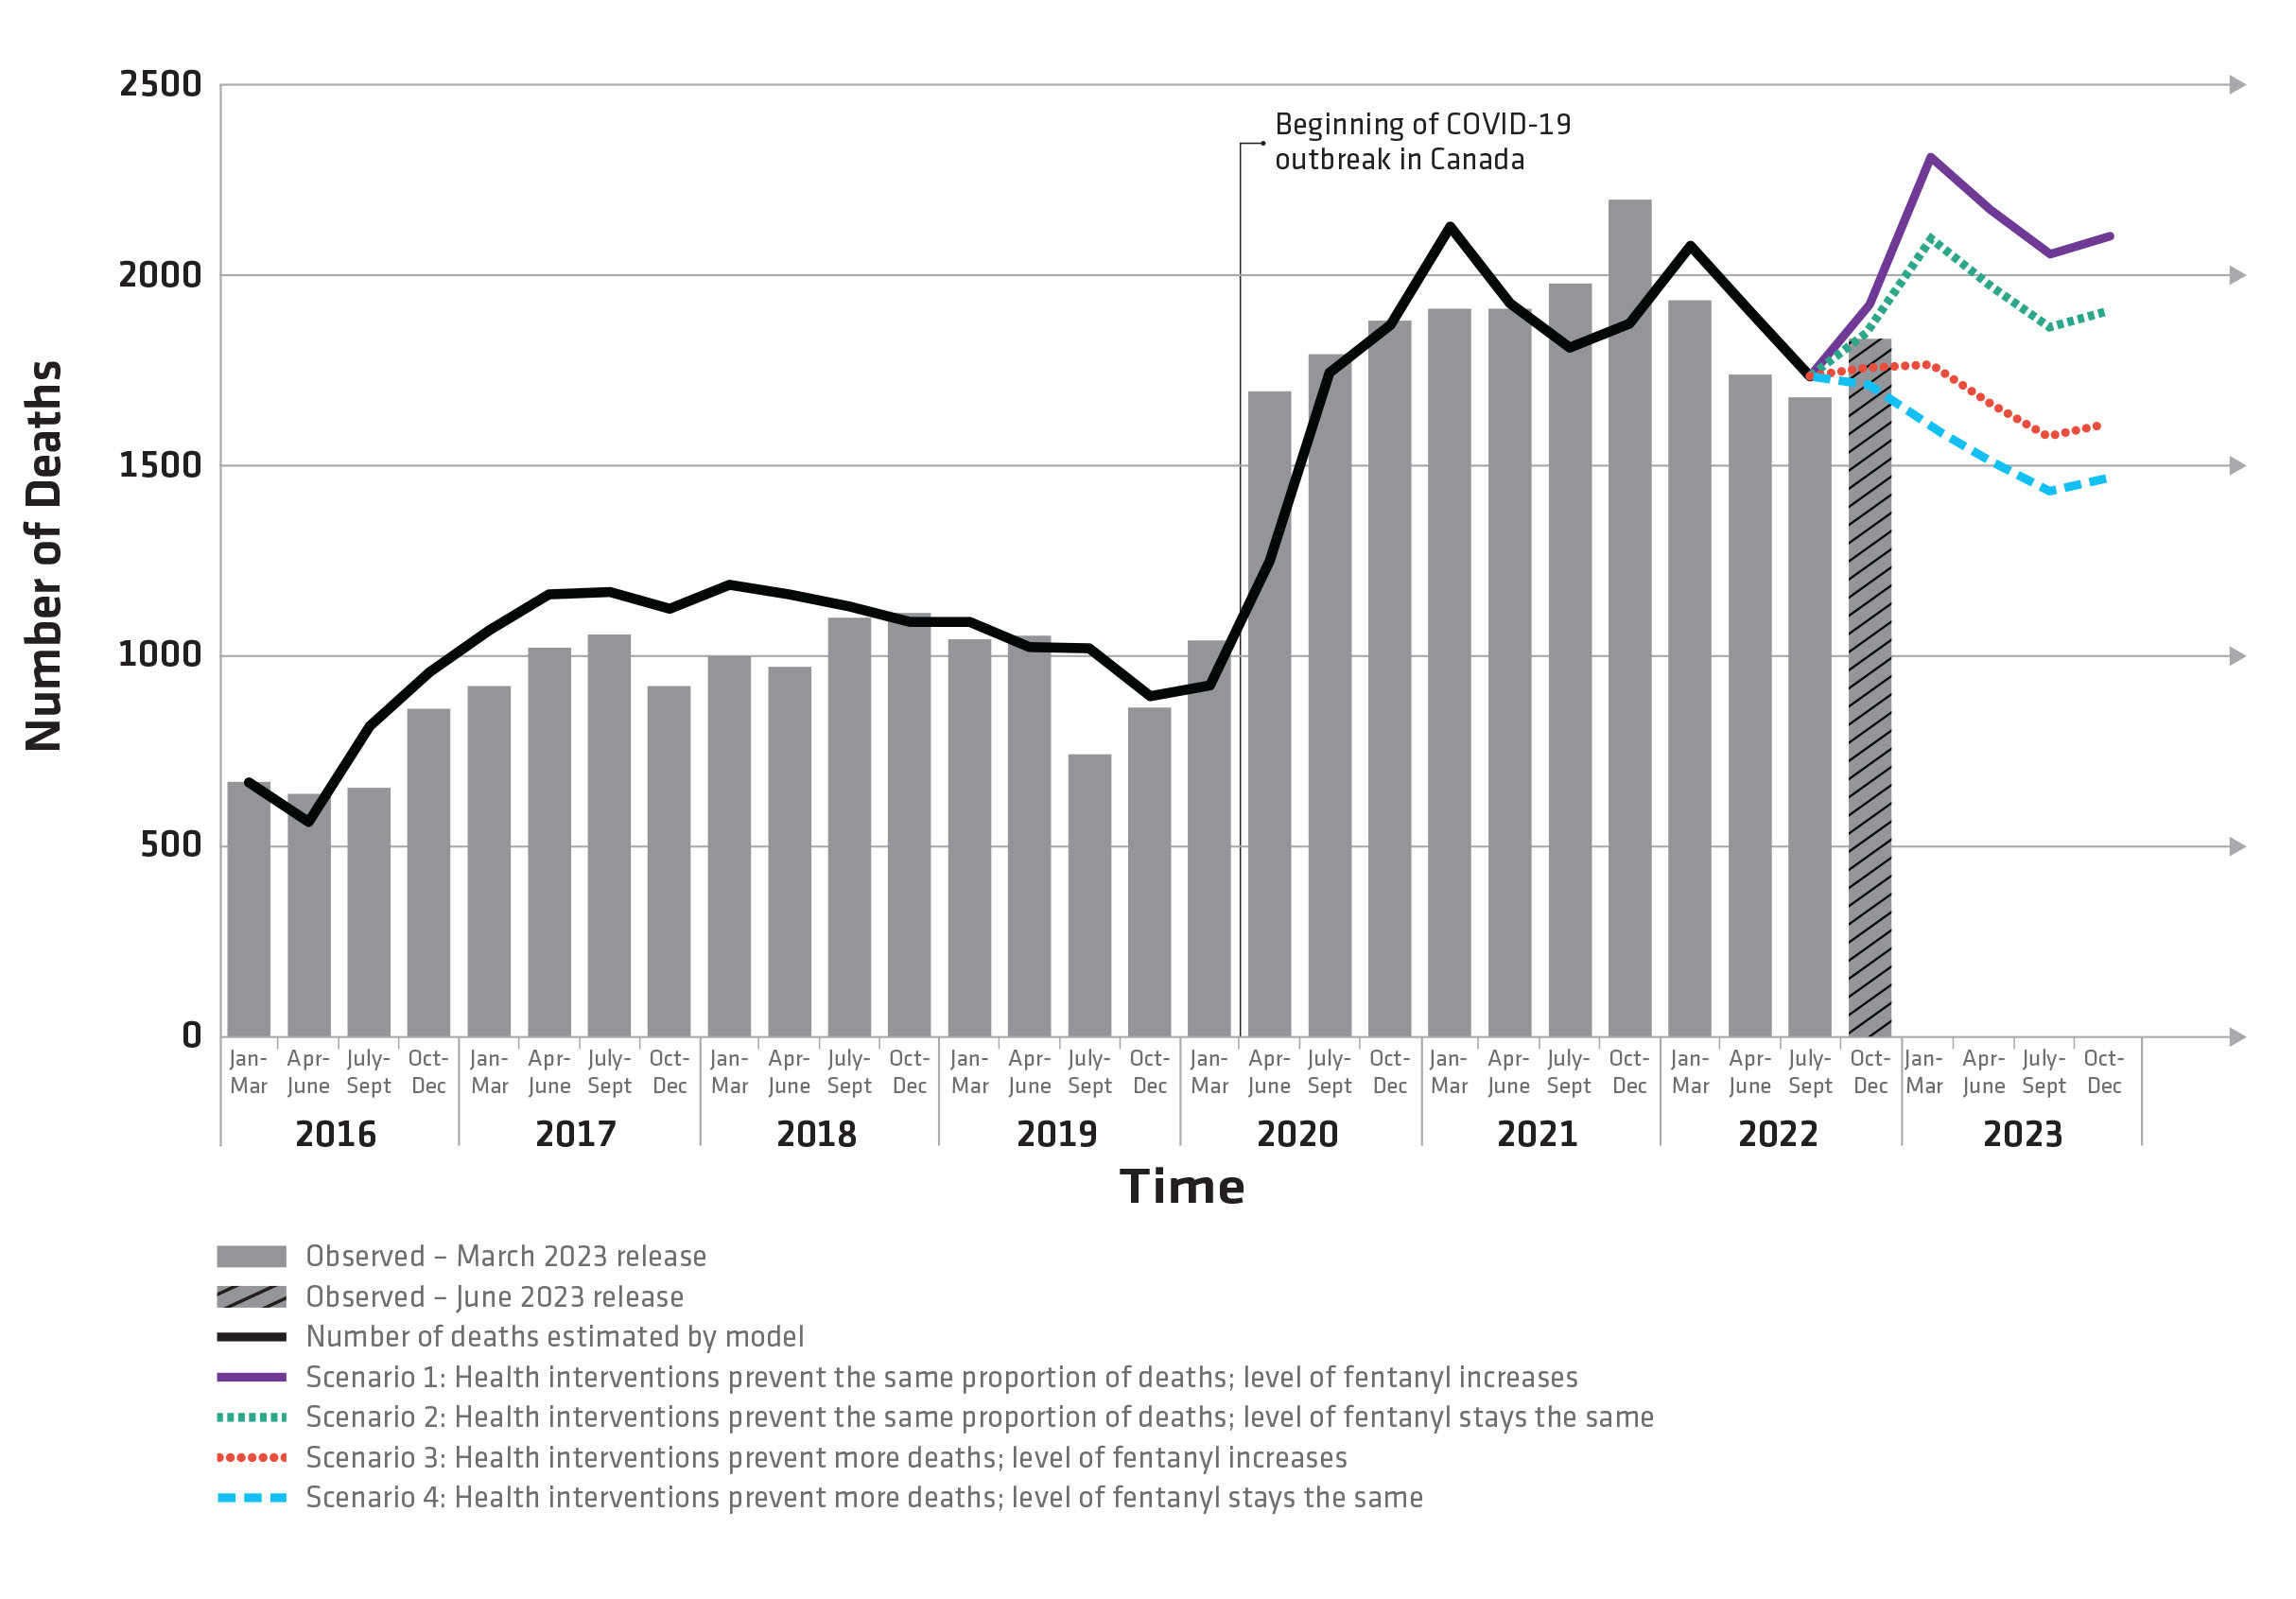
Figure 1 text description: Observed and projected opioid-related deaths, Canada, January 2016 to December 2023
| Time | Observed number of deaths based on March 2023 surveillance data release | Number of deaths estimated by the modelFootnote a | Scenario 1: Health interventions prevent the same proportion of deaths; level of fentanyl increases | Scenario 2: Health interventions prevent the same proportion of deaths; level of fentanyl stays the same | Scenario 3: Health interventions prevent more deaths; level of fentanyl increases | Scenario 4: Health interventions prevent more deaths; level of fentanyl stays the same | |
|---|---|---|---|---|---|---|---|
| 2016 | Jan - Mar | 668 | 668 | N/A | N/A | N/A | N/A |
| Apr - June | 636 | 565 | N/A | N/A | N/A | N/A | |
| July - Sept | 654 | 814 | N/A | N/A | N/A | N/A | |
| Oct - Dec | 862 | 958 | N/A | N/A | N/A | N/A | |
| 2017 | Jan - Mar | 921 | 1068 | N/A | N/A | N/A | N/A |
| Apr - June | 1021 | 1161 | N/A | N/A | N/A | N/A | |
| July - Sept | 1056 | 1167 | N/A | N/A | N/A | N/A | |
| Oct - Dec | 921 | 1122 | N/A | N/A | N/A | N/A | |
| 2018 | Jan - Mar | 999 | 1185 | N/A | N/A | N/A | N/A |
| Apr - June | 971 | 1160 | N/A | N/A | N/A | N/A | |
| July - Sept | 1100 | 1131 | N/A | N/A | N/A | N/A | |
| Oct - Dec | 1111 | 1088 | N/A | N/A | N/A | N/A | |
| 2019 | Jan - Mar | 1043 | 1089 | N/A | N/A | N/A | N/A |
| Apr - June | 1054 | 1022 | N/A | N/A | N/A | N/A | |
| July - Sept | 742 | 1021 | N/A | N/A | N/A | N/A | |
| Oct - Dec | 863 | 893 | N/A | N/A | N/A | N/A | |
| 2020 | Jan - Mar | 1041 | 921 | N/A | N/A | N/A | N/A |
| Apr - June | 1693 | 1249 | N/A | N/A | N/A | N/A | |
| July - Sept | 1793 | 1744 | N/A | N/A | N/A | N/A | |
| Oct - Dec | 1879 | 1870 | N/A | N/A | N/A | N/A | |
| 2021 | Jan - Mar | 1912 | 2126 | N/A | N/A | N/A | N/A |
| Apr - June | 1912 | 1927 | N/A | N/A | N/A | N/A | |
| July - Sept | 1977 | 1810 | N/A | N/A | N/A | N/A | |
| Oct - Dec | 2199 | 1872 | N/A | N/A | N/A | N/A | |
| 2022 | Jan - Mar | 1934 | 2076 | N/A | N/A | N/A | N/A |
| Apr - June | 1737 | 1903 | N/A | N/A | N/A | N/A | |
| July - Sept | 1678 | 1732 | N/A | N/A | N/A | N/A | |
| Oct - Dec | 1834Footnote b | N/A | 1922 | 1858 | 1761 | 1712 | |
| 2023 | Jan - Mar | N/A | N/A | 2311 | 2095 | 1765 | 1603 |
| Apr - June | N/A | N/A | 2170 | 1969 | 1661 | 1509 | |
| July - Sept | N/A | N/A | 2054 | 1864 | 1575 | 1432 | |
| Oct - Dec | N/A | N/A | 2102 | 1908 | 1612 | 1466 | |
|
|||||||
|
|||||||
Scenario 1 (solid purple line): If health interventions prevent the same proportion of opioid-related deaths as they did in September 2022 and the level of fentanyl and its analogues in the illegal drug supply increases after September 2022, then deaths may increase through to December 2023.
Scenario 2 (square hashed green line): If health interventions prevent the same proportion of opioid-related deaths as they did in September 2022, and the level of fentanyl and its analogues in the illegal drug supply remains the same as September 2022, then deaths through to December 2023 may be similar to levels observed in 2021 and early 2022.
Scenario 3 (dotted hashed red line): If health interventions prevent more opioid-related deaths after September 2022, and the level of fentanyl and its analogues in the illegal drug supply increases after September 2022, then deaths through to December 2023 may decrease.
Scenario 4 (rectangular hashed blue line): If health interventions prevent more opioid-related deaths after September 2022, and the level of fentanyl and its analogues in the illegal drug supply remains the same as September 2022, then deaths through to December 2023 may further decrease but not to levels seen before the onset of the COVID-19 pandemic.
Notes
PHAC developed a simulation model of opioid-related deaths using a method called system dynamics modelling.
The simulations presented in the model reflect a combination of:
- model structure
- assumptions about what may happen to the opioid drug supply and the proportion of opioid-related deaths that are prevented through health interventions, such as naloxone or supervised consumption sites
In the model, people using opioids medically or non-medically can die from an opioid-related overdose at different rates depending on the type of opioid use. Mortality rates for non-medical opioid use (the use of opioids without a prescription or in ways other than medically prescribed) are also affected by:
- the time of year
- the proportion of fentanyl and its analogues in the illegal drug supply
- the proportion of deaths prevented by health interventions designed to reduce opioid-related deaths
Values used in the model were identified from:
- Health Canada
- Statistics Canada
- Public Health Agency of Canada
- Canadian Institute for Health Information
- provinces and territories
- peer-reviewed literature
The 4 projected scenarios each had the following assumptions:
Scenario 1: Health interventions prevent 20% of opioid-related deaths and fentanyl and its analogues make up 80% of the opioid drug supply.
Scenario 2: Health interventions prevent 20% of opioid-related deaths and fentanyl and its analogues make up 71% of the opioid drug supply.
Scenario 3: Health interventions prevent 40% of opioid-related deaths and fentanyl and its analogues make up 80% of the opioid drug supply.
Scenario 4: Health interventions prevent 40% of opioid-related deaths and fentanyl and its analogues make up 71% of the opioid drug supply.
Considerations
When interpreting model results, it is important to recognize that:
- if the model structure, parameter values or assumptions are incorrect, the simulations may not accurately represent what may happen
- this model considers Canada as a whole and does not account for regional variation
- as with all models, if the projections result in the introduction of measures that reduce the number of opioid-related deaths, the projected numbers will be less accurate
- opioid-related deaths from October to December 2022 are not used to create the model but are included in Figure 1
- the model uses data from the March 2023 release, which may vary slightly from the surveillance data released in June 2023, and comparisons should be made with caution
Ongoing updates
As opioid use and related harms have changed significantly over the past few years, this model will be published twice a year. Changes between the previous model released in December 2022 and the current model released in June 2023 include:
- the measure of toxicity in the drug supply has been updated to represent the proportion of fentanyl and its analogues in the opioid drug supply
- other parameter values have been updated as more peer-reviewed literature and data has become available
- the model has been updated with the surveillance data on apparent opioid-related deaths through September 2022
PHAC will update the model as we learn more about the opioids overdose crisis.
Projections for 2023 (released December 2022)
The results of the model suggest that, under some scenarios, the number of opioid-related deaths through to June 2023 may remain high or may decrease, but not to levels seen before the onset of the COVID-19 pandemic.
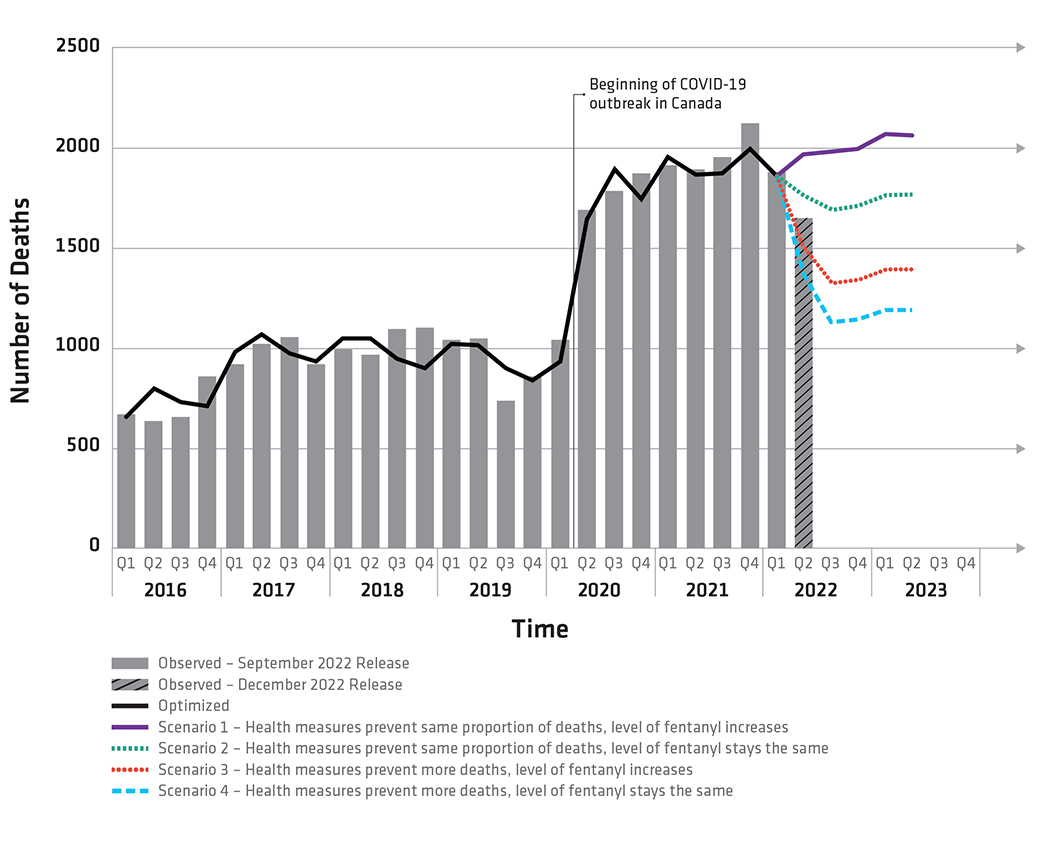
Figure 1 text description: Observed and projected opioid-related deaths, Canada, January 2016 to June 2023
- Scenario 1: Health interventions prevent the same proportion of deaths, level of fentanyl increases
- Scenario 2: Health interventions prevent the same proportion of deaths, level of fentanyl remains the same
- Scenario 3: Health interventions prevent more deaths, level of fentanyl increases
- Scenario 4: Health interventions prevent more deaths, level of fentanyl remains the same
- Solid black line: represents the model output for the period from January 2016 to March 2022, which was calibrated to observed data shown by the grey bars. Comparing the real data from the past to the simulated deaths from the model shows us that the model is well set up
- Scenario 1 (purple line): If health interventions prevent 40% of opioid-related deaths from April 2022 through June 2023 and the level of fentanyl in the drug supply increases after March 2022, then deaths may increase through to June 2023.
- Scenario 2 (green line): If health interventions prevent 40% of opioid-related deaths from April 2022 through June 2023, and the level of fentanyl in the drug supply remains the same as in March 2022, then deaths through June 2023 may decrease to levels seen at the onset of the COVID-19 pandemic.
- Scenario 3 (red line): If health interventions prevent 60% of opioid-related deaths from April 2022 through June 2023, and the level of fentanyl in the drug supply increases after March 2022, then deaths through to June 2023 may decrease but not to levels seen before the onset of the COVID-19 pandemic.
- Scenario 4 (blue line): If health interventions prevent 60% of opioid-related deaths from April 2022 through June 2023, and the level of fentanyl in the drug supply remains the same as in March 2022, then deaths through June 2023 may further decrease but not to levels seen before the onset of the COVID-19 pandemic.
Notes
PHAC's model simulates opioid-related deaths in a way that closely matches observed opioid-related deaths from 2016 through March 2022.
As opioid use and related harms have changed significantly over the past years, this model will be published twice a year. Changes between the previous model released on June 23, 2022 and the model released on December 14, 2022:
- The model has been updated with the surveillance data on apparent opioid-related deaths through March 2022
- The model assumes higher values for the proportion of deaths prevented by health interventions beginning in 2022 as availability and accessibility of services may have increased over the course of the COVID-19 pandemic
- Comparisons between modelling results and the most recent surveillance data released in December 2022 should be made with caution.
- The model uses data from the September 2022 release, which may vary slightly from the data released in December
Projections for 2022 (released June 2022)
The results of the model suggest that, under some scenarios, the number of opioid-related deaths may remain high or may even increase through to December 2022.
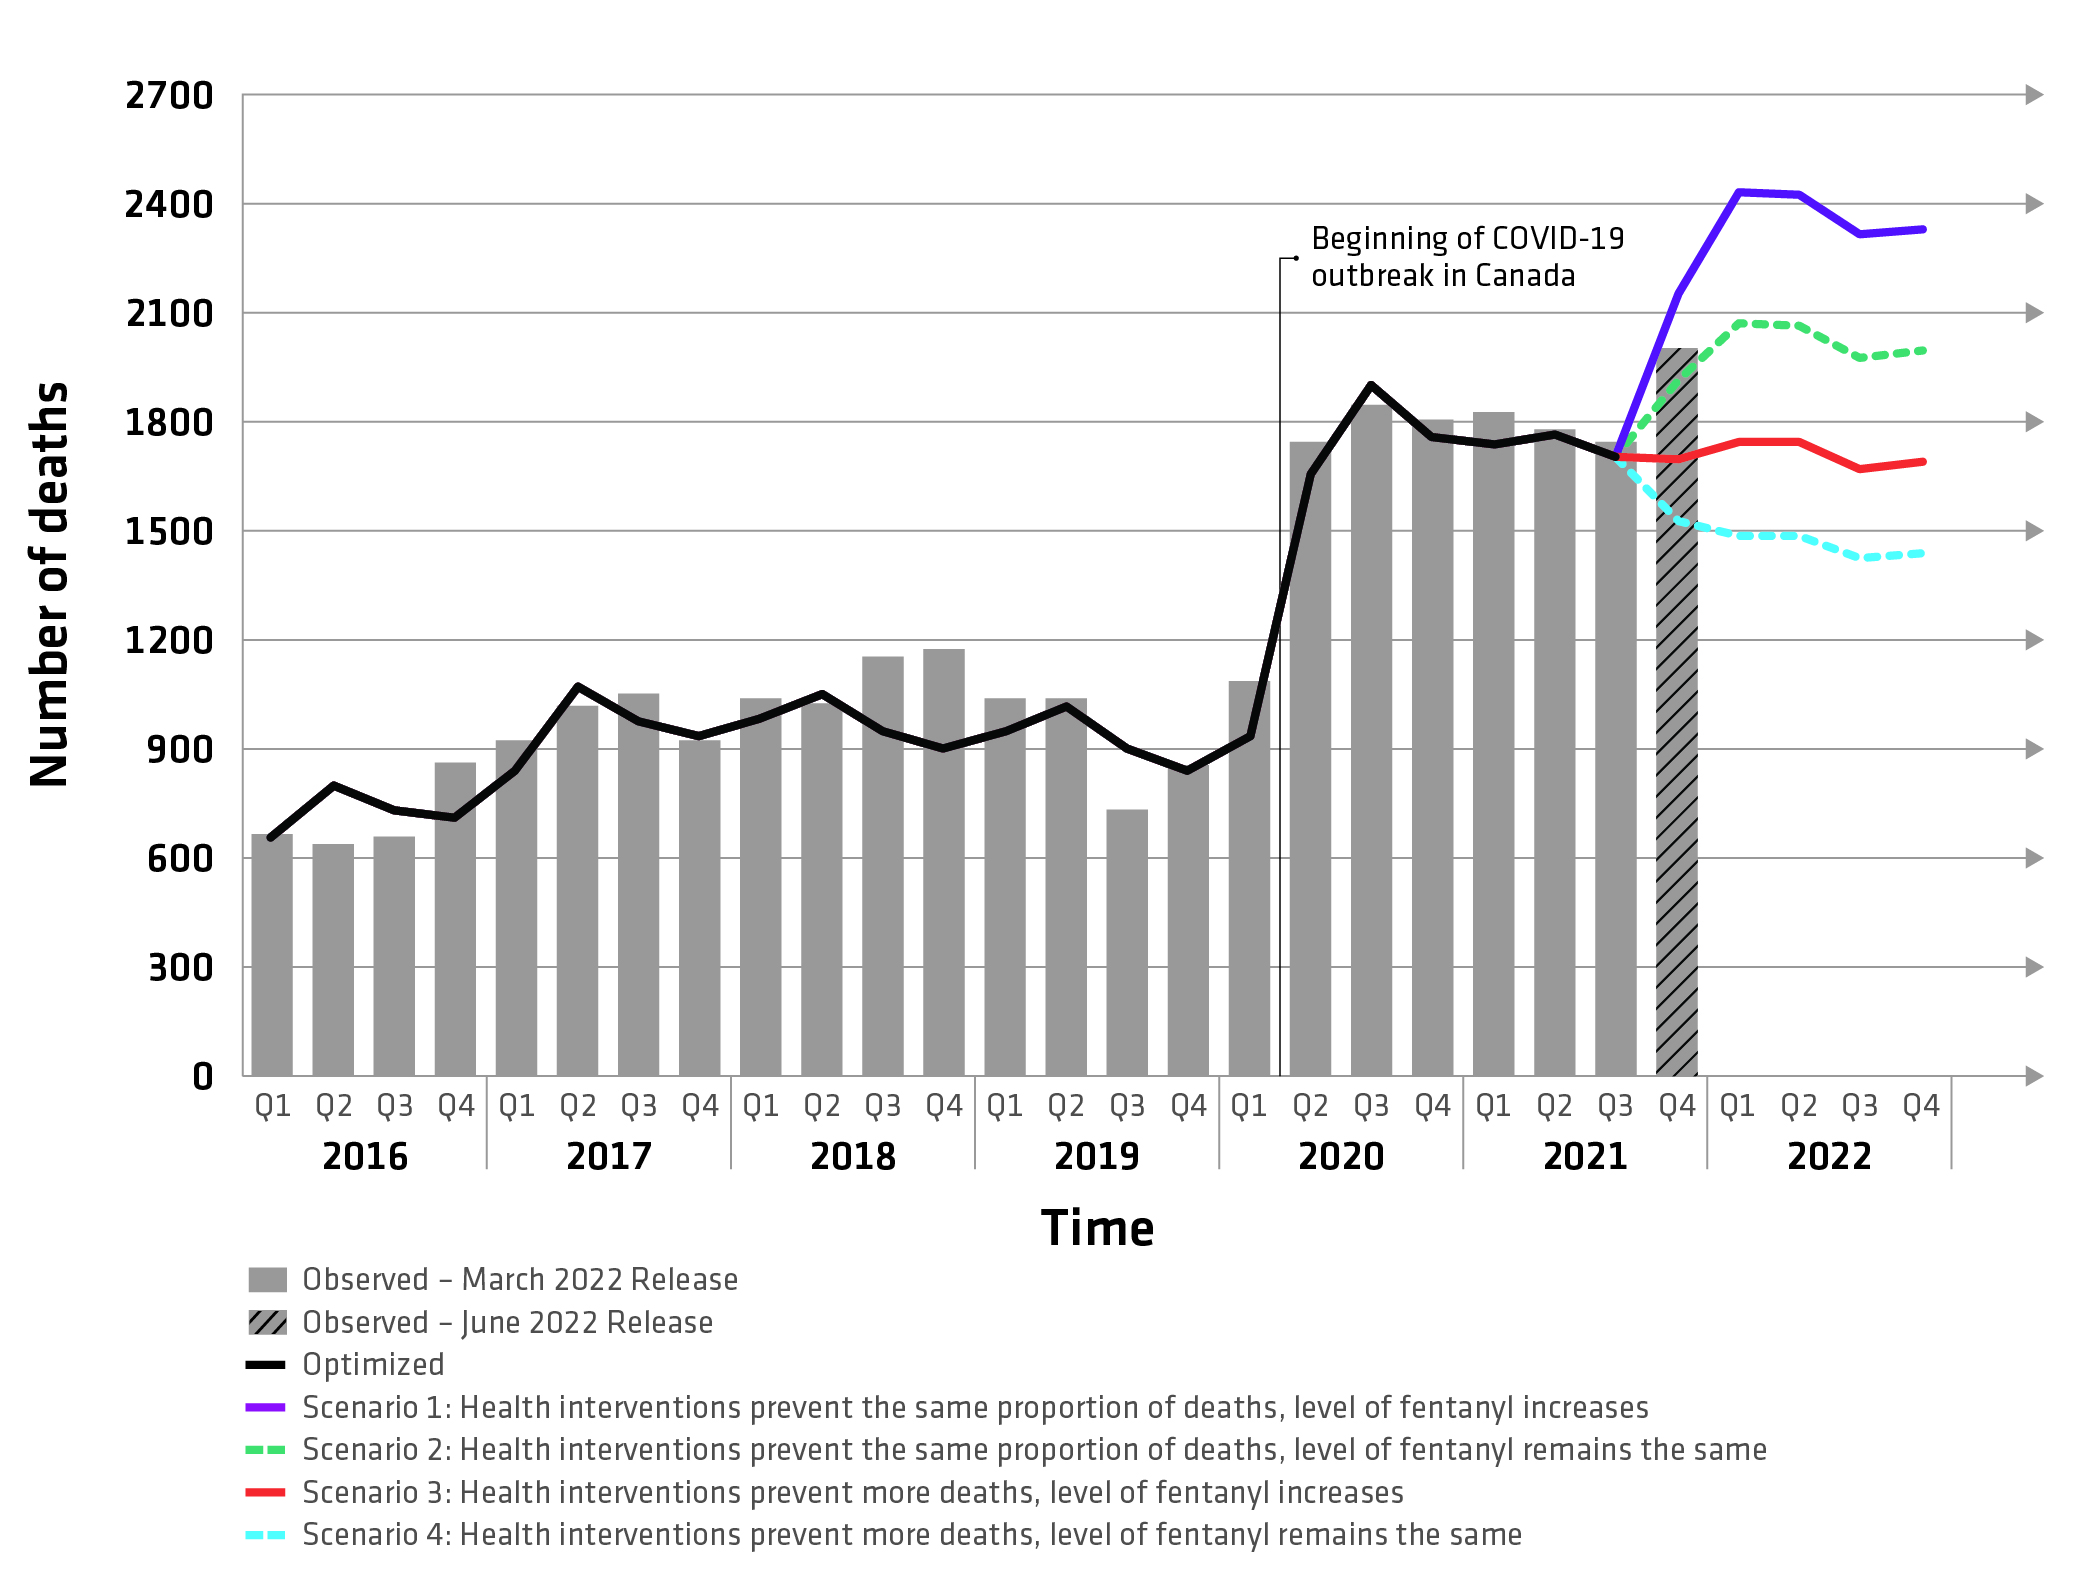
Figure 1 text description: Observed and projected opioid-related deaths, Canada, January 2016 to December 2022
- Scenario 1: Health interventions prevent the same proportion of deaths, level of fentanyl increases
- Scenario 2: Health interventions prevent the same proportion of deaths, level of fentanyl remains the same
- Scenario 3: Health interventions prevent more deaths, level of fentanyl increases
- Scenario 4: Health interventions prevent more deaths, level of fentanyl remains the same
- Solid black line: represents the model output for the period from January 2016 to September 2021, which was calibrated to observed data shown by the grey bars. Comparing the real data from the past to the simulated deaths from the model shows us that the model is well set up
- Scenario 1 (purple line): If health interventions prevent 30% of opioid-related deaths from October 2021 through December 2022 and the level of fentanyl in the drug supply increases after December 2021, then a further increase in deaths may occur through December 2022.
- Scenario 2 (green line): If health interventions prevent 30% of opioid-related deaths from October 2021 through December 2022, and the level of fentanyl in the drug supply remains the same as in December 2021, then deaths through December 2022 may remain high.
- Scenario 3 (red line): If health interventions improve after September 2021 to prevent 50% of opioid-related deaths, and the level of fentanyl in the drug supply increases after December 2021, then deaths through December 2022 may remain relatively consistent with levels observed from April 2020 through September 2021.
- Scenario 4 (blue line): If health interventions improve after September 2021 to prevent 50% of opioid-related deaths, and the level of fentanyl in the drug supply remains the same as in December 2021, then deaths through December 2022 may decrease but not to below levels seen at the peak of the opioid overdose crisis before the onset of COVID-19.
Notes
PHAC's model simulates opioid-related deaths in a way that closely matches observed opioid-related deaths from 2016 through September 2021.
As opioid use and related harms have changed significantly over the past years, this model will be published twice a year. Changes between the previous model released on December 15, 2021 and the model released on June 23, 2022:
- The model has been updated with the surveillance data on apparent opioid-related deaths through September 2021.
- Comparisons between modelling results and the most recent surveillance data released in June 2022 should be made with caution. The model uses data from the March 2022 release, which may vary slightly from the data released in June.
Projections for 2022 (released December 2021)
The results of the model suggest that, under some scenarios, the number of opioid-related deaths may remain high or may even increase through to June 2022.
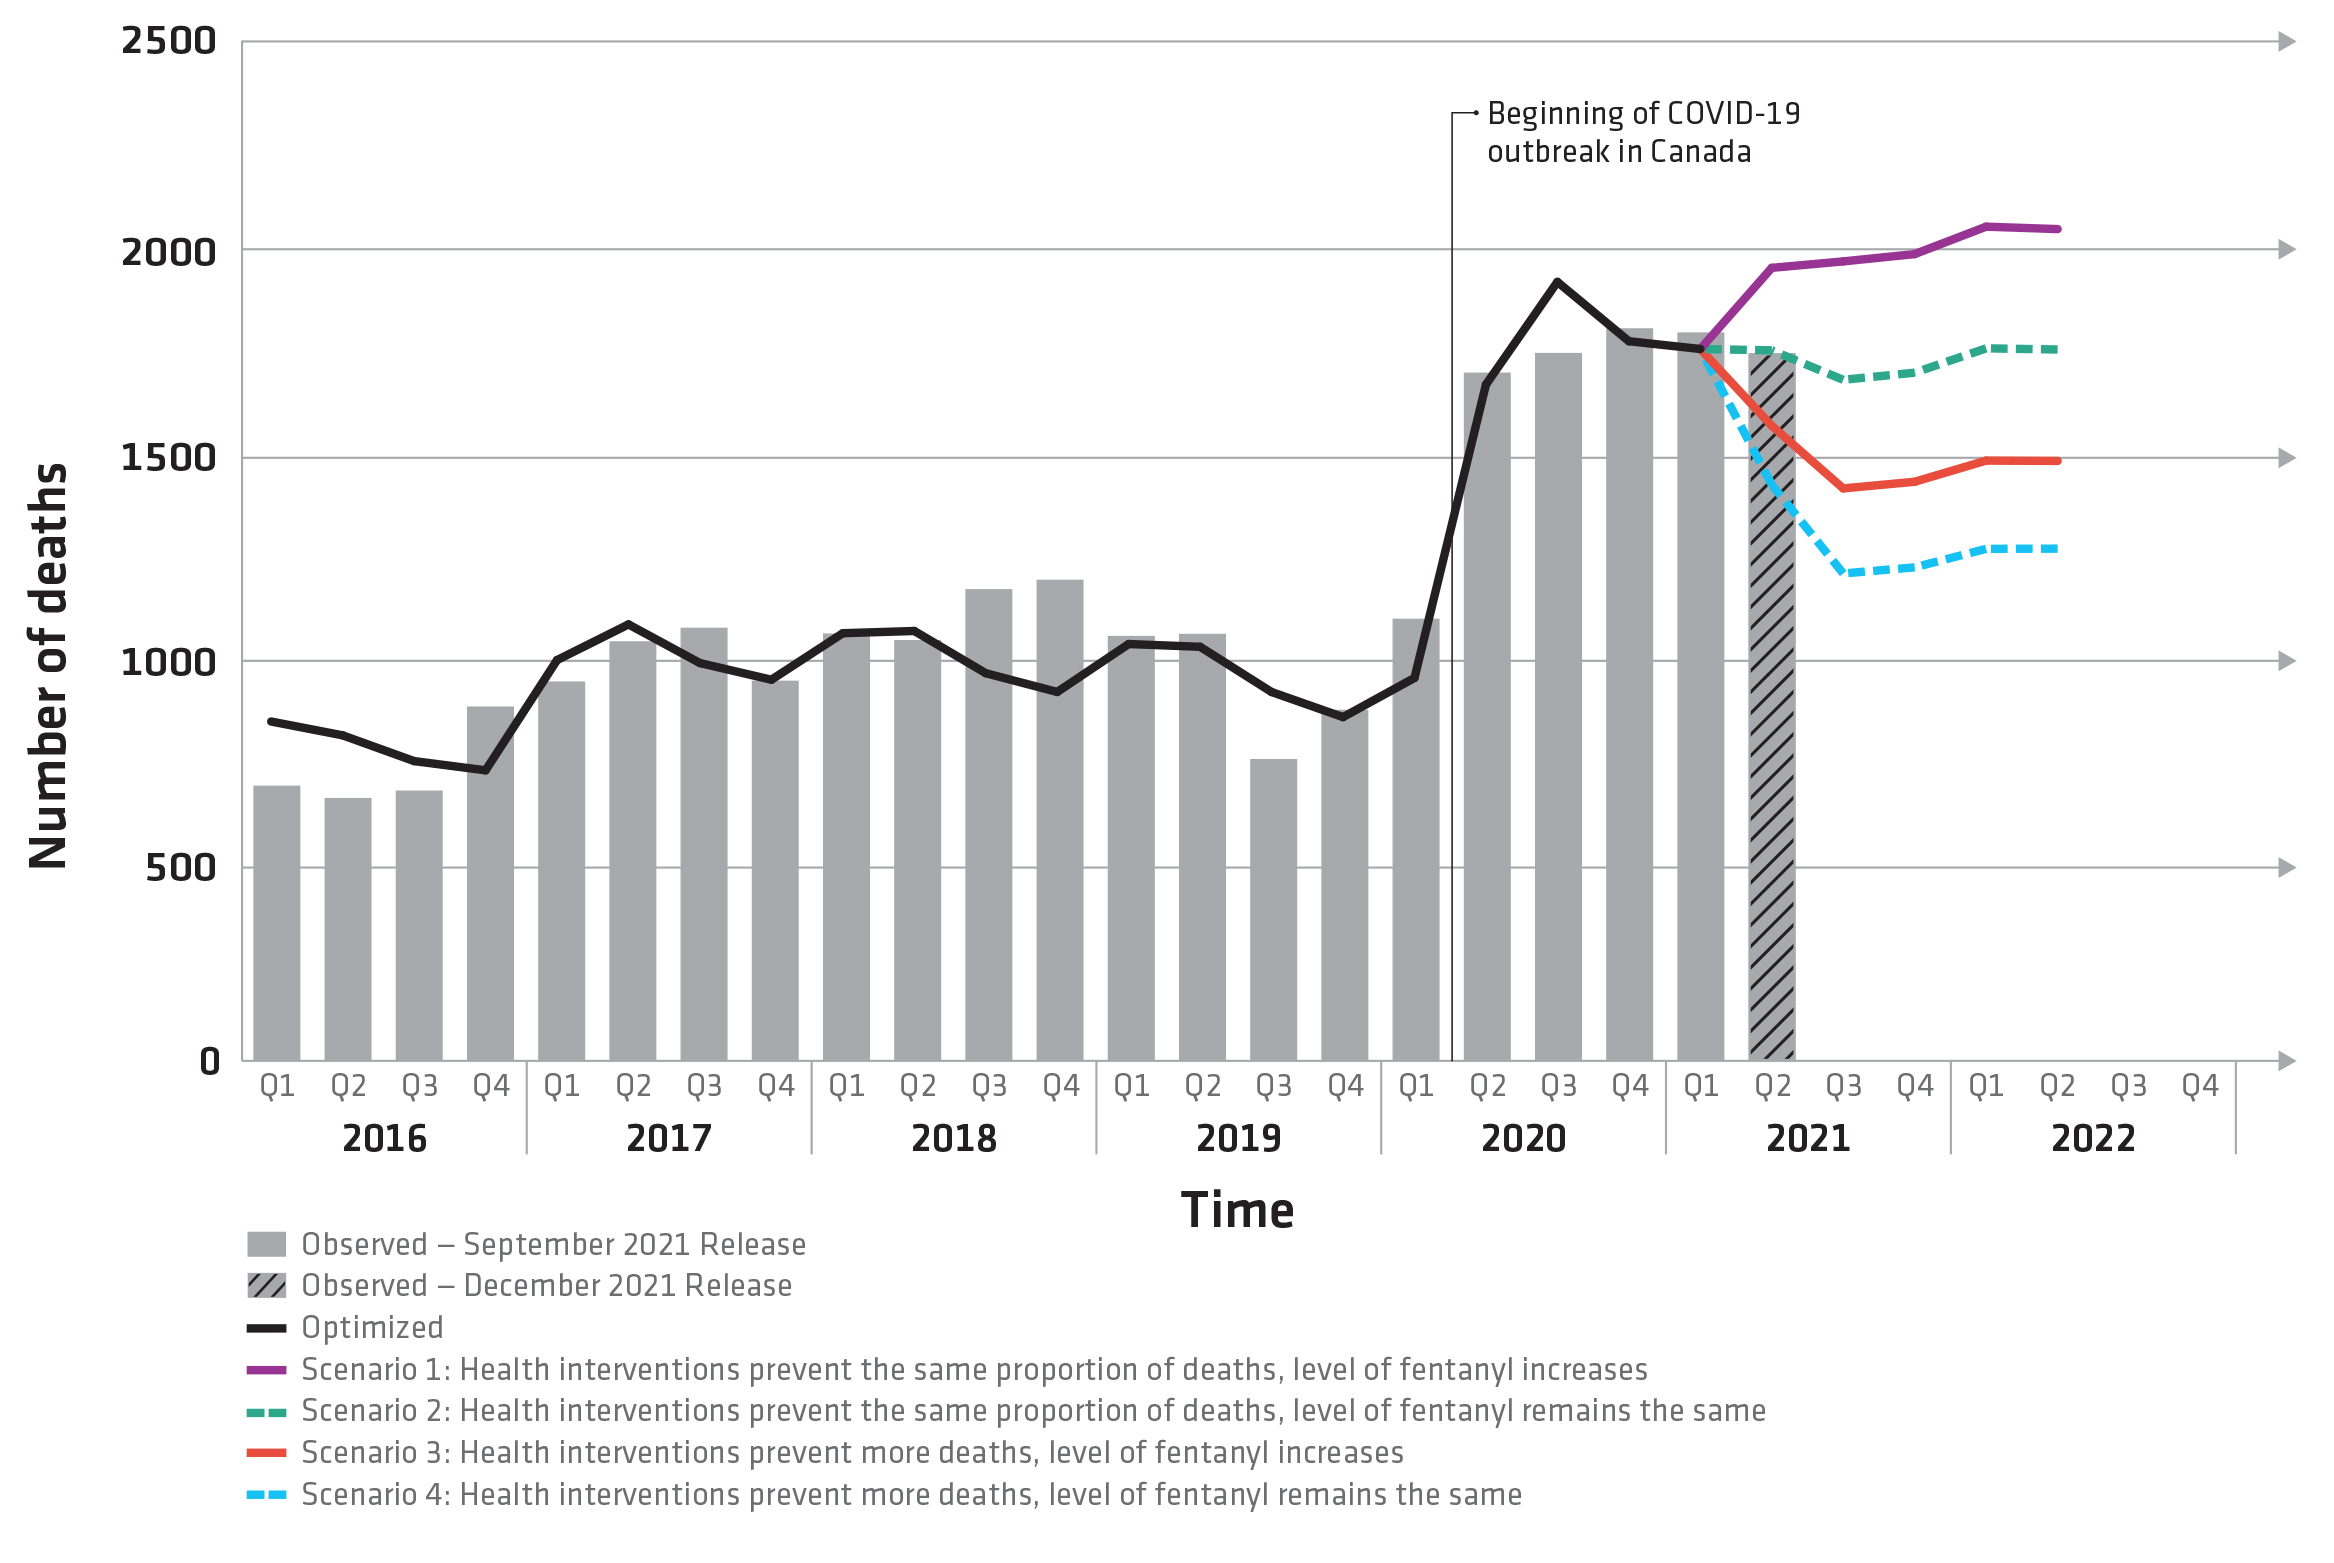
Figure 1 text description: Observed and projected opioid-related deaths, Canada, January 2016 to June 2022
- Scenario 1: Health interventions prevent the same proportion of deaths, level of fentanyl increases
- Scenario 2: Health interventions prevent the same proportion of deaths, level of fentanyl remains the same
- Scenario 3: Health interventions prevent more deaths, level of fentanyl increases
- Scenario 4: Health interventions prevent more deaths, level of fentanyl remains the same
- Solid black line: represents the model output for the period from January 2016 to March 2021, which was calibrated to observed data shown by the grey bars. Comparing the real data from the past to the simulated deaths from the model shows us that the model is well set up
- Scenario 1 (purple line): If health interventions prevent 30% of opioid-related deaths from October 2020 through June 2022 and the level of fentanyl in the drug supply increases after March 2021, then a further increase in deaths may occur through June 2022.
- Scenario 2 (green line): If health interventions prevent 30% of opioid-related deaths from October 2020 through June 2022, and the level of fentanyl in the drug supply remains the same as in March 2021, then deaths through June 2022 may remain high.
- Scenario 3 (red line): If health interventions improve after March 2021 to prevent 50% of opioid-related deaths, and the level of fentanyl in the drug supply increases after March 2021, then deaths through June 2022 may be lower than previous levels seen during the COVID-19 period from June 2020 through March 2021.
- Scenario 4 (blue line): If health interventions improve after March 2021 to prevent 50% of opioid-related deaths, and the level of fentanyl in the drug supply remains the same as in March 2021, then deaths through June 2022 may decrease but not to below levels seen at the peak of the opioid overdose crisis before the onset of COVID-19.
Notes
PHAC's model simulates opioid -related deaths in a way that closely matches observed opioid-related deaths from 2016 through March 2021.
Changes between the previous model released on June 23, 2021 and the model released on December 15, 2021:
- The model has been updated with the surveillance data on apparent opioid-related deaths through March 2021.
- Comparisons between modelling results and the most recent surveillance data released in December 2021 should be made with caution. The model uses data from the September 2021 release, which may vary slightly from the data released in December.
Projections for 2021 (released June 2021)
The model's projections to December 2021 suggest that, under some scenarios, the number of opioid-related deaths may remain high or may even increase through the remainder of 2021.
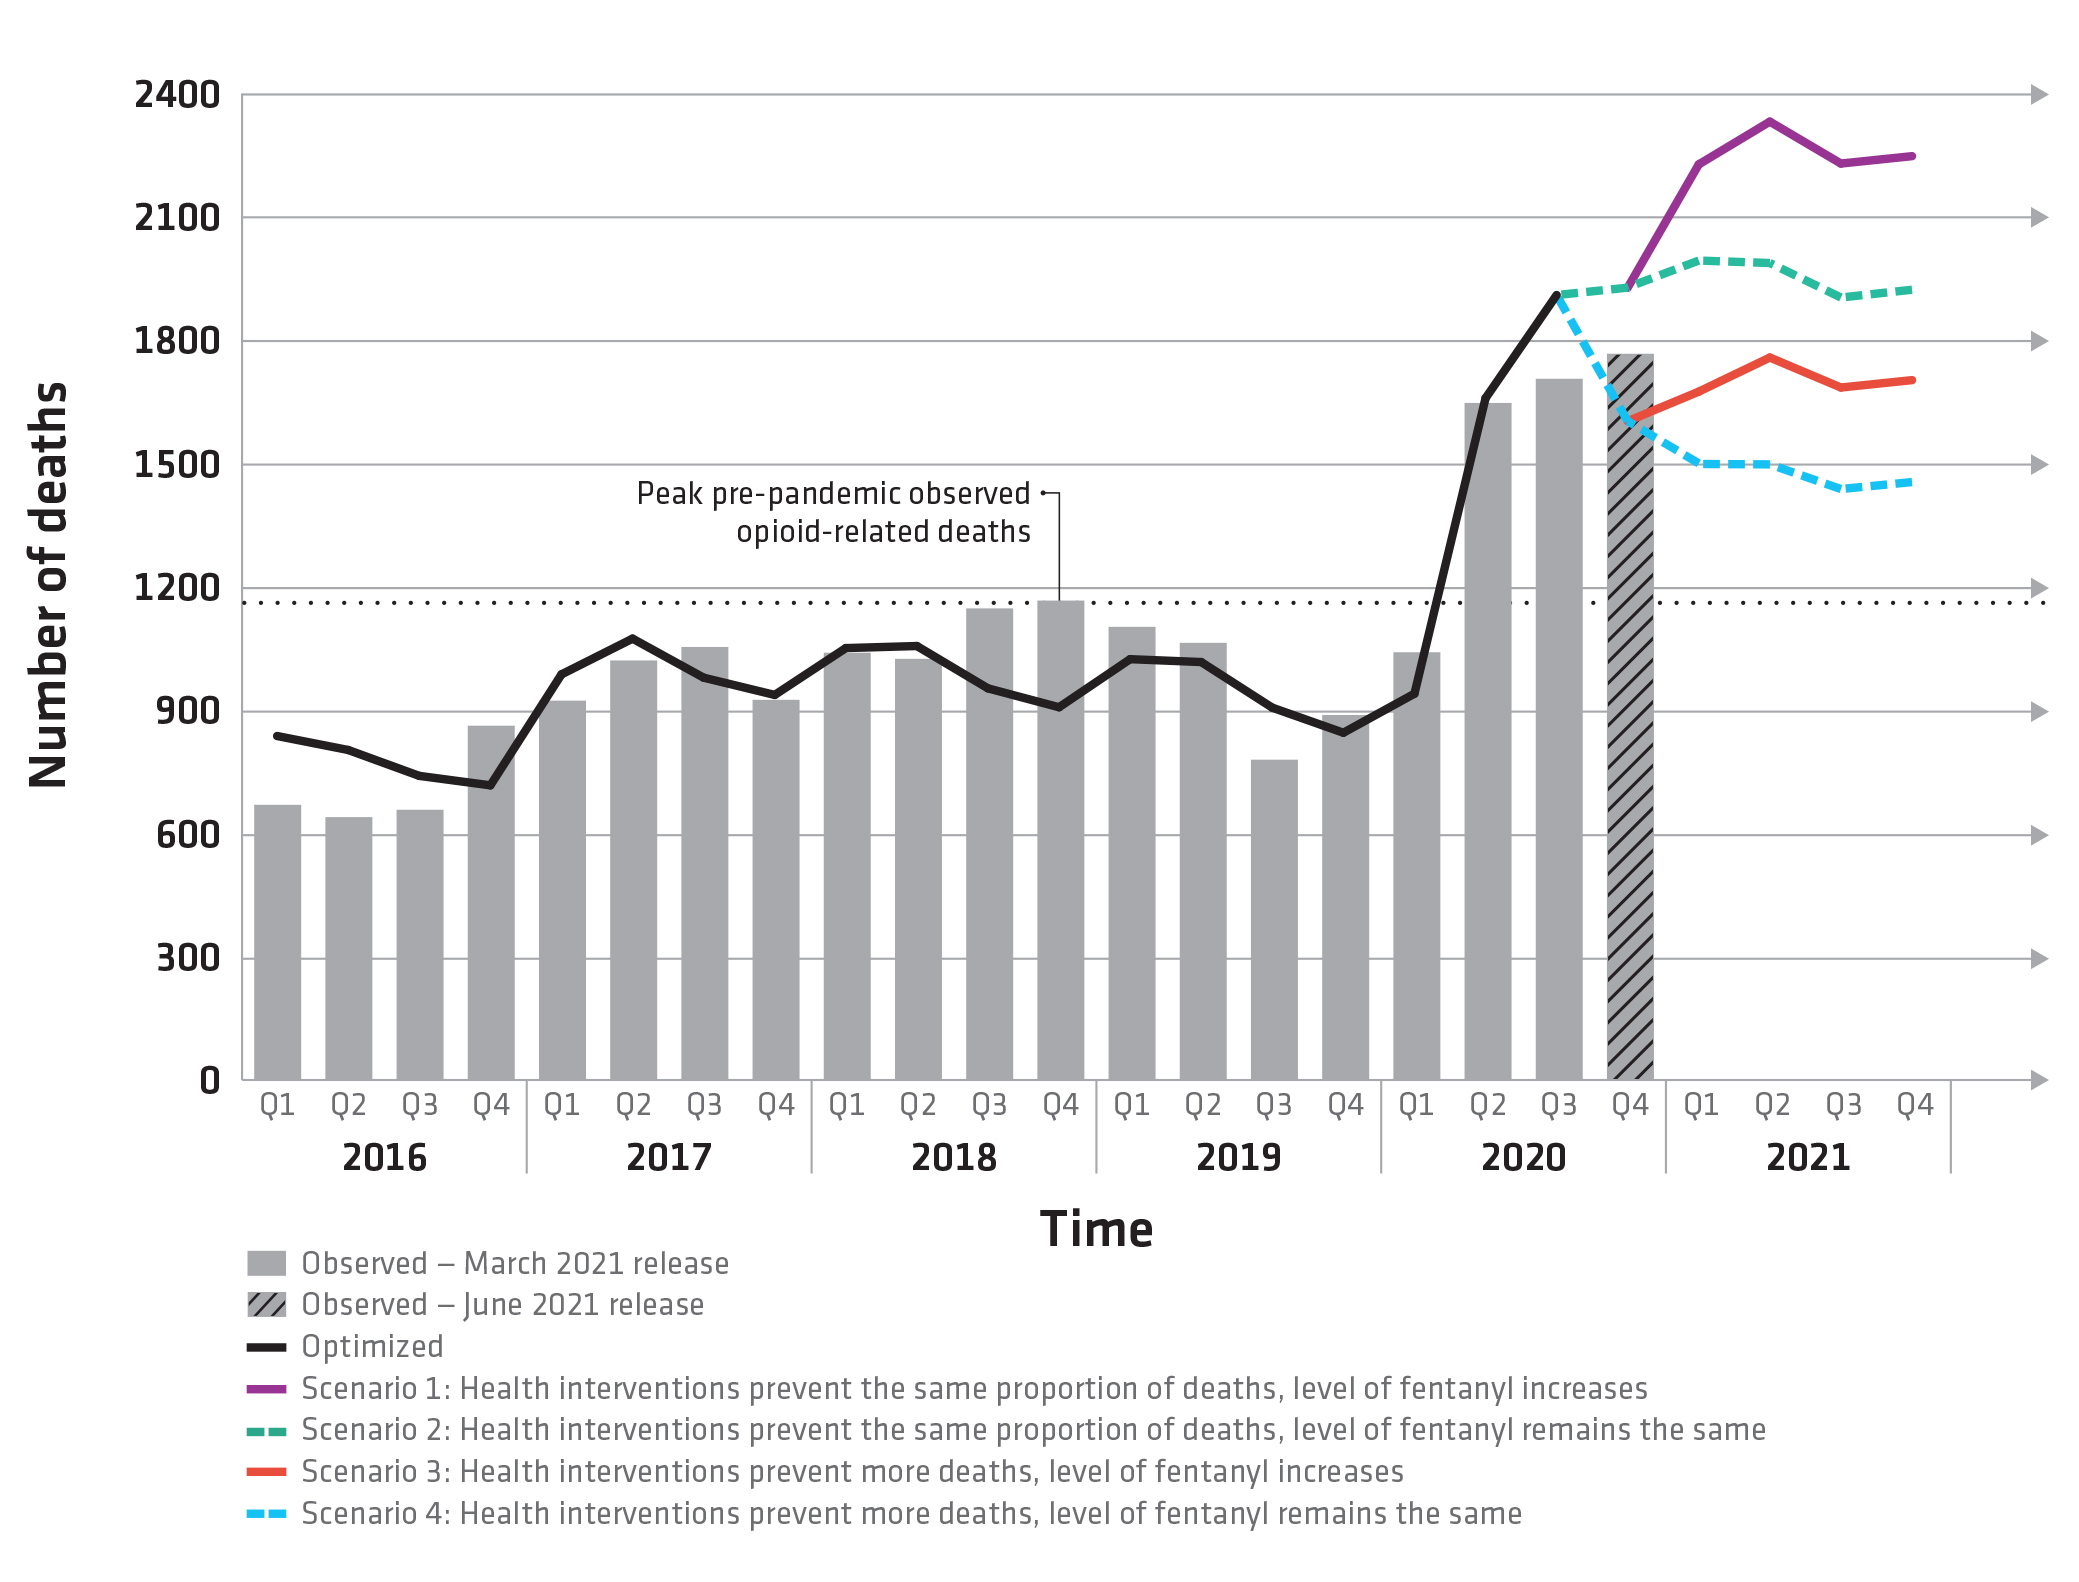
Figure 1 text description: Observed and projected opioid-related deaths, Canada, January 2016 to December 2021
- Scenario 1: health interventions prevent the same proportion of deaths, level of fentanyl increases
- Scenario 2: health interventions prevent the same proportion of deaths, level of fentanyl remains the same
- Scenario 3: health interventions prevent more deaths, level of fentanyl increases
- Scenario 4: health interventions prevent more deaths, level of fentanyl remains the same
- Solid black line: represents the model output for the period from January 2016 to September 2020, which was calibrated to observed data shown by the solid grey bars. Comparing the real data from the past to the simulated deaths from the model shows us that the model is well set up (i.e. properly calibrated).
- Scenario 1 (purple line): If health interventions prevent 20% of opioid-related deaths, as was estimated from June through September 2020 during the COVID-19 outbreak, and the level of fentanyl in the drug supply increases, then even further increases in deaths may occur through December 2021.
- Scenario 2 (green line): If health interventions prevent 20% of opioid-related deaths (starting in April 2020), and the level of fentanyl in the drug supply remains the same, then quarterly deaths are projected to meet or surpass the levels seen at the height of the opioid overdose crisis in 2018.
- Scenario 3 (red line): If health interventions improve after September 2020 to prevent 40% of opioid-related deaths, and the level of fentanyl in the drug supply increases, then deaths from October 2020 through December 2021 may remain similar to levels seen during the COVID-19 period from April through September 2020.
- Scenario 4 (blue line): If health interventions improve after September 2020 to prevent 40% of opioid overdose deaths, and the level of fentanyl in the drug supply remains the same, then deaths through December 2021 may decrease but not to levels seen before the onset of COVID-19.
Notes
PHAC's model simulates opioid-related deaths in a way that closely matches observed opioid-related deaths from 2016 through September 2020.
Changes between the model released on December 16, 2020 and the model released on June 23, 2021:
- The June model no longer uses data from the Public Health Agency of Canada's Opioid-and Stimulant-related Harms Surveillance for information on the level of fentanyl in the drug supply. Health Canada's Drug Analysis Service (DAS) data are used for this. DAS for 2019. The original October model used data from DAS for 2018 and applied these data to 2019.
- The June model incorporates data from Health Canada's Drug Analysis Service (DAS) for 2020. The December model used data from DAS for 2019 and applied these data to 2020.
- The June model has been updated with the surveillance data on apparent opioid-related deaths from April through September 2020.
- Comparisons between modelling results and the most recent surveillance data released in June 2021 should be made with caution. The model uses data from the March 2021 release, which may vary slightly from the data released in June.
Projections for 2021 (released December 2020)
The model's projections for April 2020 to June 2021 suggest that, under some scenarios, the opioid overdose crisis may resurge or surpass levels seen at the height of the opioid overdose crisis in late 2018.
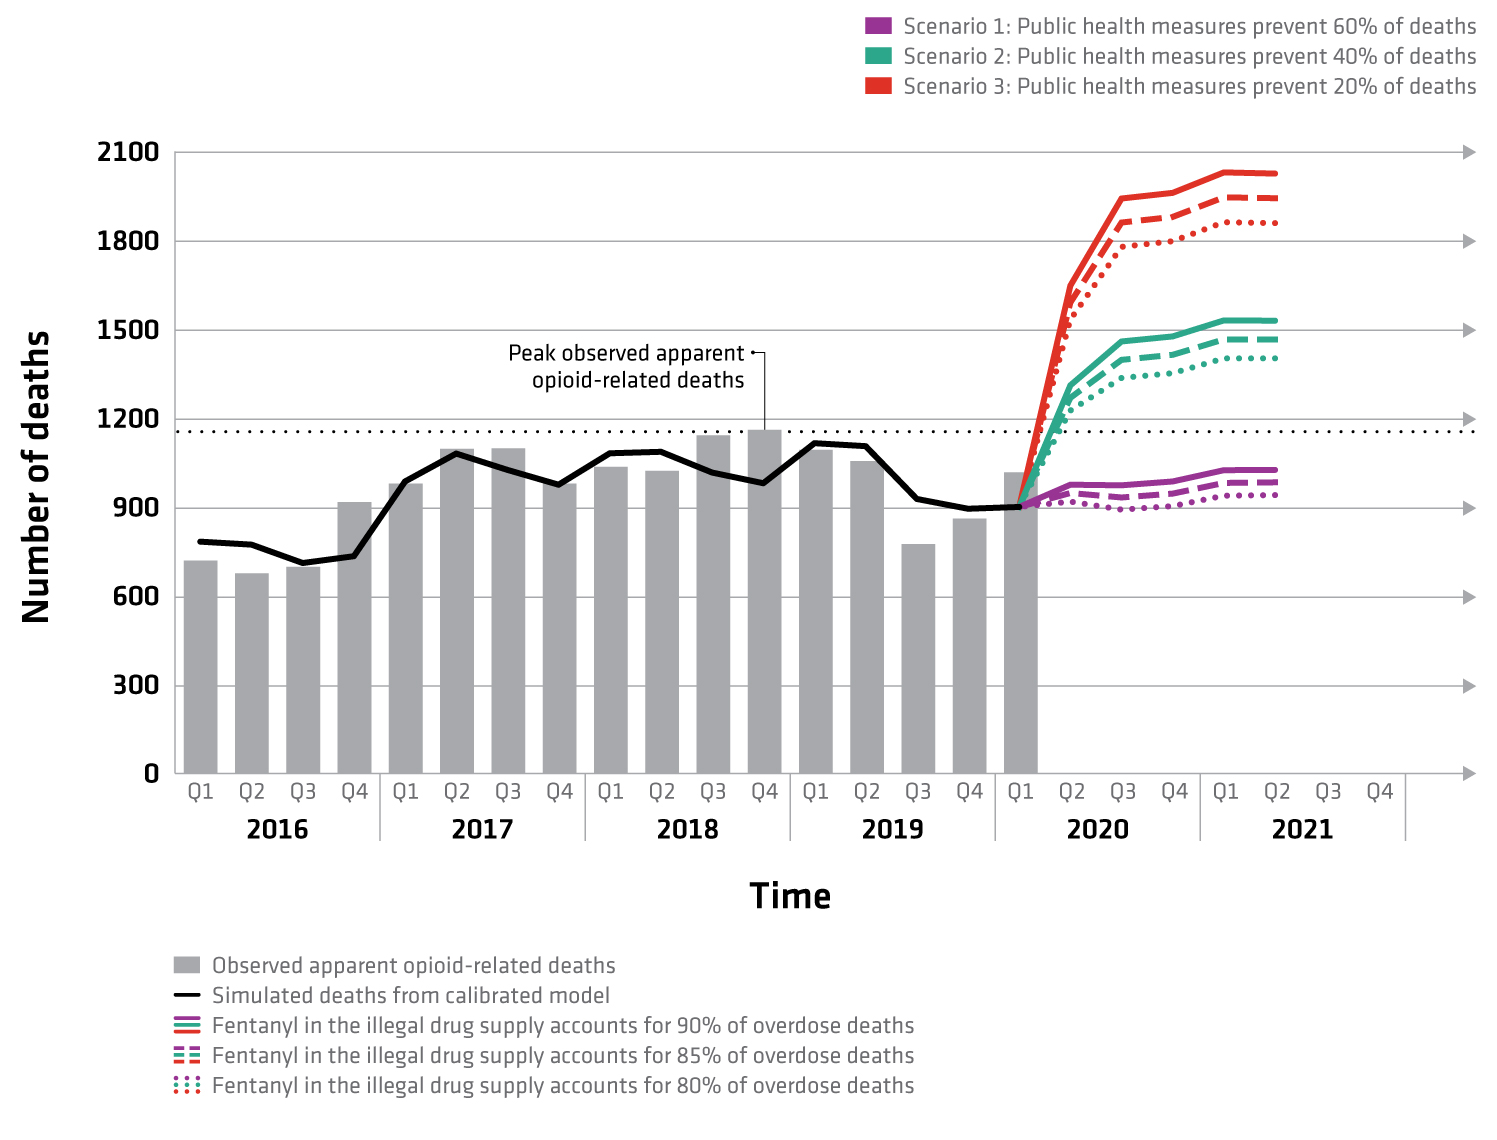
Figure 1 text description: Observed and projected opioids overdose deaths, Canada, 2016 to 2021
- Scenario 1: Public health measures prevent 60% of deaths
- Scenario 2: Public health measures prevent 40% of deaths
- Scenario 3: Public health measures prevent 20% of deaths
Within each scenario, there can be varying levels of fentanyl.
- Dotted line: reflects when fentanyl in the illegal drug supply accounts for 80% of overdose deaths
- Dashed line: reflects when fentanyl in the illegal drug supply accounts for 85% of overdose deaths
- Solid line: reflects when fentanyl in the illegal drug supply accounts for 90% of overdose deaths
- Solid black line: represents the model output for the period from January 2016 to December 2019, which was calibrated to observed data shown by the grey bars. Comparing the real data from the past to the simulated deaths from the model shows us that the model is well set up (i.e. properly calibrated).
- Scenario 1 (purple lines): If public health measures continue to prevent 60% of opioid overdose deaths, as was estimated in October to March 2020 before the onset of the COVID-19 outbreak, then deaths for April through June 2021 will remain similar to those observed at the end of 2019.
- Scenario 2 (green lines): If public health measures prevent 40% of opioid overdose deaths (starting in April 2020), then quarterly deaths are projected to meet or surpass the levels seen at the height of the opioid overdose crisis in 2018.
- Scenario 3 (red lines): If public health measures prevent only 20% of opioid overdose deaths (starting in April 2020), then quarterly deaths are projected to be substantially higher than observed in any previous quarter.
- The level of fentanyl in the illegal drug supply also has an effect on the number of deaths, as shown by the dotted, dashed and full lines.
Notes
PHAC's model simulates opioid overdose deaths in a way that closely matches observed opioid overdose deaths from 2016 through early 2020.
Changes between the model released on October 26, 2020 and the model released on December 16, 2020:
- The December model incorporates data from Health Canada's Drug Analysis Service (DAS) for 2019. The original October model used data from DAS for 2018 and applied these data to 2019.
- The December model has been updated with the statistics on apparent opioid-related deaths from January to March 2020.
- Comparisons between modelling results and the most recent surveillance data released in December 2020 should be made with caution due to changes in the way data are reported by some jurisdictions for the December 2020 release.
Suggested citation
Public Health Agency of Canada. Modelling apparent opioid toxicity deaths during the overdose crisis. Ottawa: Public Health Agency of Canada; December 23, 2024.
https://www.canada.ca/en/health-canada/services/opioids/data-surveillance-research/modelling.html