Chapter 10: The Health of Canada's Young People: a mental health focus – Substance use and risky behaviour
Substance use and risky behaviour
by Frank Elgar and William Pickett
Why are health risk behaviours important?
Adolescence is a formative stage of child development. During the adolescent years many lifelong health habits are established. It is also a period of experimentation with smoking, alcohol, drugs and other risky behaviours (Chassin, Pitts & Prost, 2002). For most adolescents, these behaviours are occasional in nature and a common part of growing up (Nell, 2002). However, for some adolescents these behaviours escalate and become serious problems. Several risky behaviours tend to co-occur with other health problems in youth, such as injuries (Collin, 2006), cognitive and psychomotor impairment (Squeglia, Jacobus & Tapert, 2009), social and emotional problems (Elgar, Knight, Worrall & Sherman, 2003), and academic difficulties (Suhrcke & de Paz Nieves, 2011).
Characteristics of the social environment affect the likelihood that youth choose to engage in substance use and risky behaviour. Risk factors include the quality of parenting and supervision in the home, peers who engage in risky behaviours, academic problems and negative perceptions of the school environment, social norms about smoking, alcohol, and drug use, and the availability of alcohol and drugs in the community (Hawkins, Catalano & Killer, 1992; Simons-Morton & Chen, 2006). The cumulative number of environmental risk factors and not any specific risk factor per se increases the likelihood that youth engage in these behaviours (Canadian Centre on Substance Abuse, 2007).
Early experimentation with alcohol and drugs, substance misuse, early sexual debut, and having unprotected sex might coexist with emotional or behavioural problems. These behaviours in turn might affect emotional well‑being (Deas & Thomas, 2002; Langille, Asbridge, Flowerdew & Allen, 2009; Reinherz, Giaconia, Hauf, Wasserman & Paradis, 2000). Education about the negative consequences of substance use and risky behaviours and strategies that delay their initiation among youth hold some promise to minimise their harm to public health (Canadian Centre on Substance Abuse, 2007).
Evidence surrounding the initiation and ongoing engagement in such risky behaviours is important, as it informs the development of prevention strategies. Similarly, it is important to examine trends in the occurrence of these behaviours over time. Substance use and risky behaviour prevention strategies must continually adapt to changing behavioural patterns and trends to stay relevant to populations of young people.
What are we reporting in this chapter?
The HBSC study contains modules that examine four major categories of risky behaviour: (1) smoking tobacco; (2) alcohol use; (3) substance use, and (4) sexual activity.
Students were asked how old they were when they first smoked a cigarette and how frequently they smoked presently. Next, they were asked when they first drank alcohol and how frequently they drank alcohol currently. They were asked about the kinds of alcohol that they drank and how often they recalled drinking so much that they "felt drunk." As well, they were asked about "binge drinking": boys were asked how often they recalled drinking five or more drinks on a single occasion in the past 12 months and girls how often they recalled drinking four or more drinks on a single occasion in the same time period. These commonly used measures of "binge drinking" take into account biological differences between the sexes in how the body reacts to alcohol.
Older students (Grade 9 and 10) were asked some additional questions about their use of cannabis and other illicit drugs. The latter included ecstasy, amphetamines (speed), methamphetamines/crystal methamphetamine (ice), opiates (heroin, junk, smack), cocaine (coke, crack), glue or solvents (e.g., gasoline, happy gas), LSD and other hallucinogens (e.g., PCP, magic mushrooms, mescaline, peyote), and salvia (Sally D, Divine Sage, Magic Mint). They were further asked about misusing three types of medical drugs to get high: pain relievers (e.g., Percodan, Demerol, Oxycontin, Codeine), stimulants (e.g., Ritalin, Concerta, Adderall), and sedatives/tranquillizers (e.g., Valium, Ativan, Xanax). Finally, Grade 9 and 10 students were asked whether or not they had ever had sexual intercourse, at what age they first had intercourse, and what form of contraception they used the last time they had intercourse.
In addition to reporting on the current levels of engagement in substance use and other risky behaviours, this chapter examines trends in these behaviours over different cycles of the HBSC surveys. The chapter also examines links between mental health and four of these risk-taking behaviours: smoking, binge drinking, cannabis use, and sexual activity. In each of these outcomes, the data indicate large differences in mental health between youth who engage in these behaviours and youth who do not.
Smoking
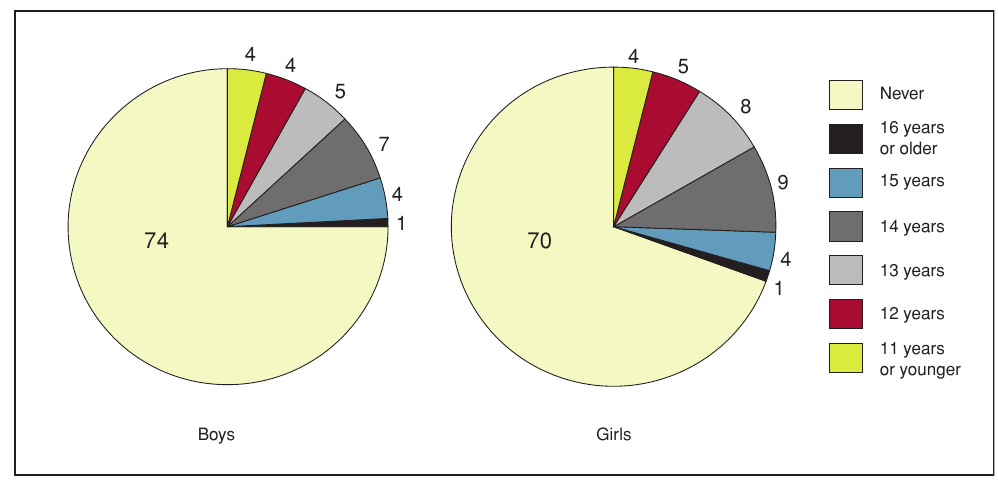
10.1 Age at which students in Grade 9 and 10 first tried smoking, by gender (%)
[Text Equivalent, Figure 10.1]
10.1 Age at which students in Grade 9 and 10 first tried smoking, by gender (%)
Figure 10.1 shows the age at which students in Grade 9 and 10 first tried smoking, by gender and expressed as a percentage. The graph shows that 74% of boys have never tried smoking, 1% first tried at 16 years of age or older, 4% first tried at 15 years old, 7% first tried at 14 years old, 5% first tried at 13 years old, 4% first tried at 12 years old, and 4% first tried at 11 years old or younger. On the same question, 70% of girls have never tried smoking, 1% first tried at 16 years of age or older, 4% first tried at 15 years old, 9% first tried 14 years old, 8% first tried at 13 years old, 5% first tried at 12 years old, and 4% first tried at 11 years old or younger.
Approximately three-quarters of Grade 9 and 10 students indicated that they have never smoked a cigarette (Figure 10.1). Of those who have ever smoked (26% of boys; 30% of girls), the median age for initiation of smoking was 13 years. (Note: this median should be interpreted with some caution as an unknown number of adolescents will start smoking after Grade 10). However, among students in Grade 9 and 10, 13% of boys and 17% of girls first smoked a cigarette at 13 years or younger.
[Text Equivalent, Figure 10.2]
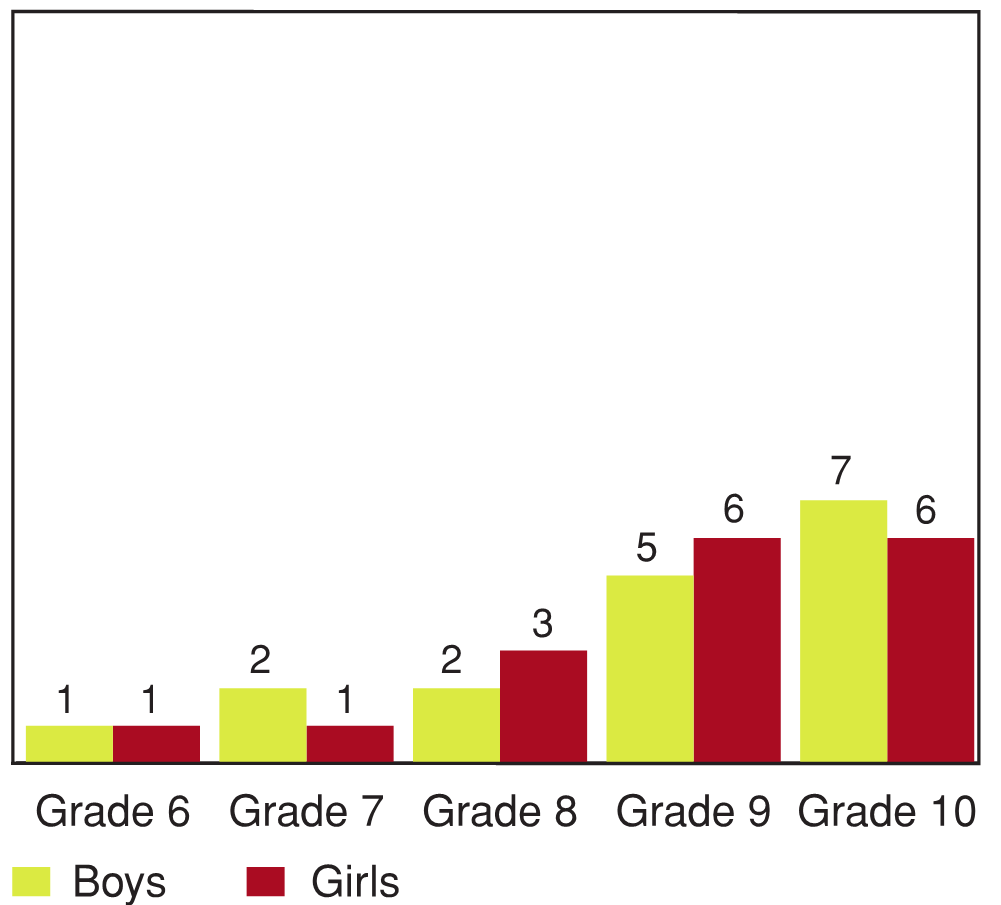
10.2 Smoking daily, by grade and gender (%)
Figure 10.2 looks at the percentage of students who smoke on a daily basis, by grade and gender. The graph shows that 1% of Grade 6 boys smoke on a daily basis, compared to 2% of Grade 7 boys, 2% of Grade 8 boys, 5% of Grade 9 boys, and 7% of Grade 10 boys. On the same question, 1% of Grade 6 girls smoke on a daily basis, compared to 1% of Grade 7 girls, 3% of Grade 8 girls, 6% of Grade 9 girls, and 6% of Grade 10 girls.
With regard to daily smoking, 1% of Grade 6 students smoke daily with the rate increasing to 6-7% in Grade 10. There are no important differences between boys and girls with respect to daily smoking.
10.3 Daily smoking, by grade, gender, and year of survey (%)
[Text Equivalent, Figure 10.3]
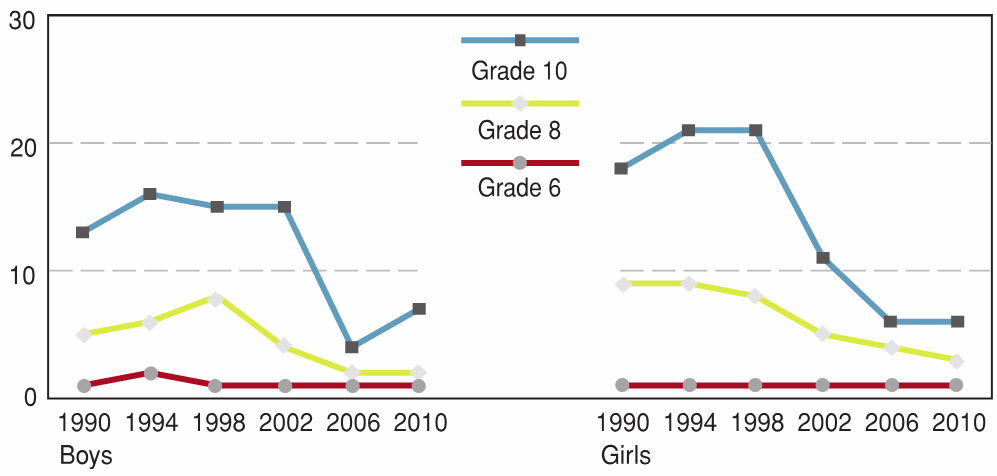
10.3 Daily smoking, by grade, gender, and year of survey (%)
Figure 10.3 is a line graph that shows the approximate percentage of students who smoke on a daily basis, by grade, gender and year of survey. The graph shows that approximately 1% of Grade 6 boys smoked on a daily basis in 1990, compared to approximately 2% in 1994, approximately 1% in 1998, approximately 1% in 2002, approximately 1% in 2006, and approximately 1% in 2010. Among Grade 8 boys, approximately 5% smoked on a daily basis in 1990, compared to approximately 6% in 1994, approximately 8% in 1998, approximately 4% in 2002, approximately 2% in 2006, and approximately 2% in 2010. Among Grade 10 boys, approximately 12% smoked on a daily basis in 1990, compared to approximately 16% in 1994, approximately 15% in 1998, approximately 15% in 2002, approximately 4% in 2006, and approximately 7% in 2010. On the same question, approximately 1% of Grade 6 girls smoked on a daily basis in 1990, compared to approximately 1% in 1994, approximately 1% in 1998, approximately 1% in 2002, approximately 1% in 2006, and approximately 1% in 2010. Among Grade 8 girls, approximately 9% smoked on a daily basis in 1990, compared to approximately 9% in 1994, approximately 8% in 1998, approximately 5% in 2002, approximately 4% in 2006, and approximately 3% in 2010. Among Grade 10 girls, approximately 18% smoked on a daily basis in 1990, compared to approximately 21% in 1994, approximately 21% in 1998, approximately 11% in 2002, approximately 6% in 2006, and approximately 6% in 2010.
Figure 10.3 shows the percentage of daily smokers by grade in the six Canadian HBSC cycles from 1990 to 2010. Overall there were downward trends in smoking for both boys and girls since 1990. In 2010, 7% of Grade 10 boys and 6% of Grade 10 girls reported smoking daily, as compared to 13% of boys and 18% of girls in 1990. These declines coincided with extensive public health interventions aimed at youth smoking in Canada implemented during that time period.
Alcohol
10.4 Age at which students in Grade 9 and 10 first tried alcohol, by gender (%)
[Text Equivalent, Figure 10.4]
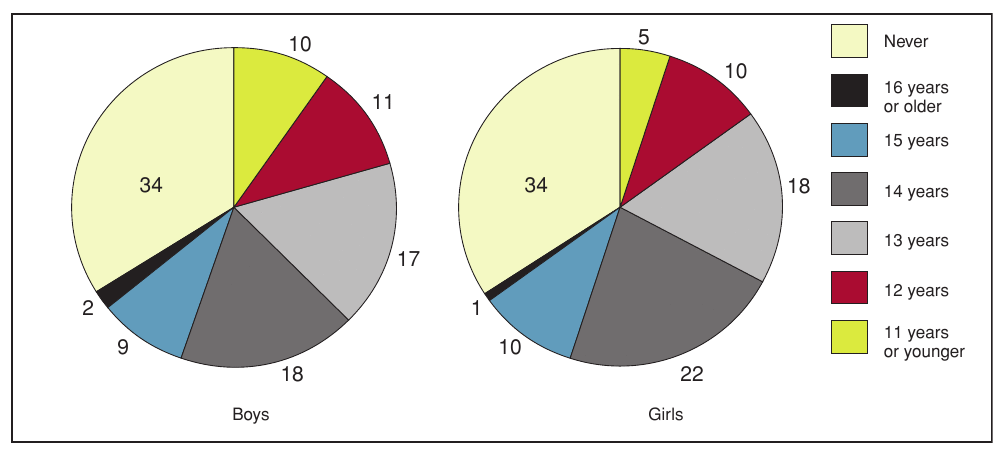
10.4 Age at which students in Grade 9 and 10 first tried alcohol, by gender (%)
Figure 10.4 shows the age at which students in Grade 9 and 10 first tried alcohol, by gender and expressed as a percentage. The graph shows that 34% of Grade 9 and 10 boys have never tried alcohol, 2% first tried it at 16 years of age or older, 9% first tried it at 15 years of age, 18% first tried it at 14 years of age, 17% first tried it at 13 years of age, 11% first tried it at 12 years of age, and 10% first tried it at 11 years of age or younger. On the same question, 34% of Grade 9 and 10 girls have never tried alcohol, 1% first tried it at 16 years of age or older, 10% first tried it at 15 years of age, 22% first tried it at 14 years of age, 18% first tried it at 13 years of age, 10% first tried it at 12 years of age, and 5% first tried it at 11 years of age or younger.
Alcohol remains the most commonly used substance reported by Canadian students. As shown in Figure 10.4, two-thirds of Grade 9 and 10 students (66%) reported having tried alcohol at least once. Twice as many boys as girls reported trying alcohol at 11 years of age or younger. About half (46% of boys and 50% of girls) reported trying alcohol for the first time between the ages of 12 and 14.
Trends in the reported use of alcohol are reported in the next series of figures. Overall, there was a decline in the percentage of students who reported drinking beer at least once a week between 1990 and 2010 (Figure 10.5). This decline was evident for all grade levels among boys, and in the older grades (Grade 8 and 10) for girls.
10.5 Drinking beer at least once a week, by grade, gender, and year of survey (%)

[Text Equivalent, Figure 10.5]
10.5 Drinking beer at least once a week, by grade, gender, and year of survey (%)
Figure 10.5 is a line graph that shows the approximate percentage of students who report drinking beer at least once a week, by grade, gender and year of survey. The graph shows that approximately 8% of Grade 6 boys reported drinking beer at least once a week in 1990, compared to approximately 4% in 1994, approximately 2% in 1998, approximately 4% in 2002, approximately 2% in 2006, and approximately 1% in 2010. Among Grade 8 boys, approximately 12% reported drinking beer at least once a week in 1990, compared to approximately 9% in 1994, approximately 8% in 1998, approximately 9% in 2002, approximately 7% in 2006, and approximately 4% in 2010. Among Grade 10 boys, approximately 30% reported drinking beer at least once a week in 1990, compared to approximately 22% in 1994, approximately 18% in 1998, approximately 28% in 2002, approximately 18% in 2006, and approximately 17% in 2010. On the same question, approximately 2% of Grade 6 girls reported drinking beer at least once a week in 1990, compared to approximately 1% in 1994, approximately 1% in 1998, approximately 1% in 2002, approximately 1% in 2006, and approximately 1% in 2010. Among Grade 8 girls, approximately 8% reported drinking beer at least once a week in 1990, compared to approximately 6% in 1994, approximately 3% in 1998, approximately 6% in 2002, approximately 4% in 2006, and approximately 2% in 2010. Among Grade 10 girls, approximately 19% reported drinking beer at least once a week in 1990, compared to approximately 13% in 1994, approximately 10% in 1998, approximately 9% in 2002, approximately 8% in 2006, and approximately 6% in 2010.
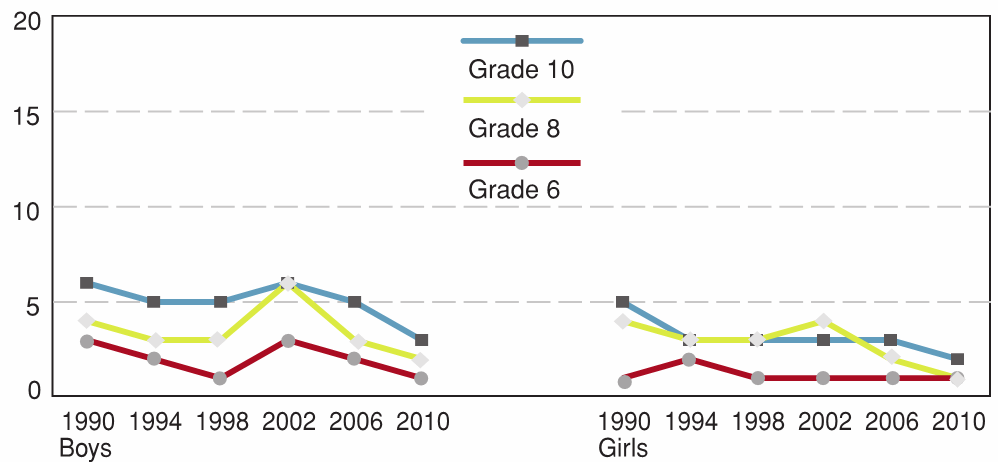
[Text Equivalent, Figure 10.6]
10.6 Drinking wine at least once a week, by grade, gender, and year of survey (%)
Figure 10.6 is a line graph that shows the percentage of students who report drinking wine at least once a week, by grade, gender and year of survey. The graph shows that approximately 3% of Grade 6 boys reported drinking wine at least once a week in 1990, compared to approximately 2% in 1994, approximately 1% in 1998, approximately 3% in 2002, approximately 2% in 2006, and approximately 1% in 2010. Among Grade 8 boys, approximately 4% reported drinking wine at least once a week in 1990, compared to approximately 3% in 1994, approximately 3% in 1998, approximately 6% in 2002, approximately 3% in 2006, and approximately 2% in 2010. Among Grade 10 boys, approximately 6% reported drinking wine at least once a week in 1990, compared to approximately 5% in 1994, approximately 5% in 1998, approximately 6% in 2002, approximately 5% in 2006, and approximately 3% in 2010. On the same question, approximately 1% of Grade 6 girls reported drinking wine at least once a week in 1990, compared to approximately 2% in 1994, approximately 1% in 1998, approximately 1% in 2002, approximately 1% in 2006, and approximately 1% in 2010. Among Grade 8 girls, approximately 4% reported drinking wine at least once a week in 1990, compared to approximately 3% in 1994, approximately 3% in 1998, approximately 4% in 2002, approximately 2% in 2006, and approximately 1% in 2010. Among Grade 10 girls, approximately 5% reported drinking wine at least once a week in 1990, compared to approximately 3% in 1994, approximately 3% in 1998, approximately 3% in 2002, approximately 3% in 2006, approximately 2% in 2010.
Drinking wine was less commonly reported than drinking beer in all six cycles of the HBSC. In 2010, the rates of drinking wine at least once a week were 3% in boys and 2% in girls (Figure 10.6).
10.7 Drinking liquor at least once a week, by grade, gender, and year of survey (%)
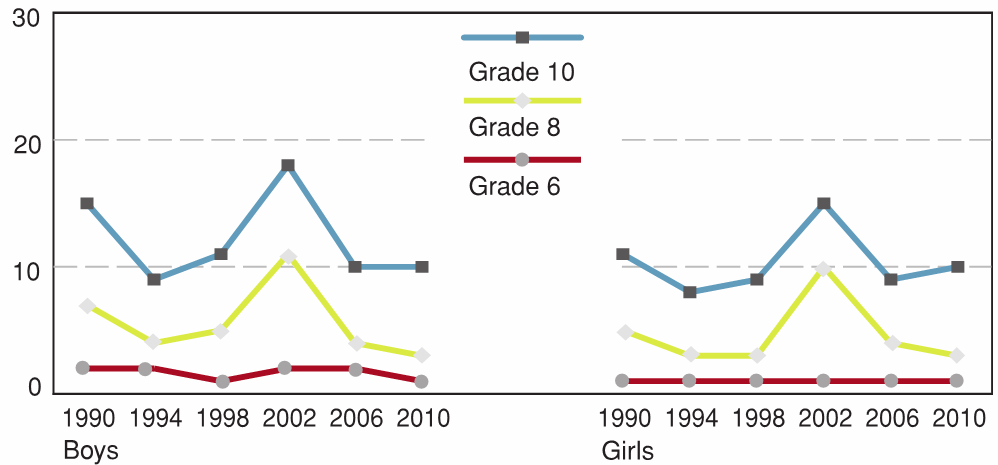
[Text Equivalent, Figure 10.7]
10.7 Drinking liquor at least once a week, by grade, gender, and year of survey (%)
Figure 10.7 is a line graph that shows the percentage of students who report drinking liquor at least once a week, by grade, gender and year of survey. The graph shows that approximately 2% of Grade 6 boys reported drinking liquor at least once a week in 1990, compared to approximately 2% in 1994, approximately 1% in 1998, approximately 2% in 2002, approximately 2% in 2006, and approximately 1% in 2010. Among Grade 8 boys, approximately 7% reported drinking liquor at least once a week in 1990, compared to approximately 4% in 1994, approximately 5% in 1998, approximately 11% in 2002, approximately 4% in 2006, and approximately 3% in 2010. Among Grade 10 boys, approximately 15% reported drinking liquor at least once a week in 1990, compared to approximately 9% in 1994, approximately 11% in 1998, approximately 18% in 2002, approximately 10% in 2006, and approximately 10% in 2010. On the same question, approximately 1% of Grade 6 girls reported drinking liquor at least once a week in 1990, compared to approximately 1% in 1994, approximately 1% in 1998, approximately 1% in 2002, approximately 1% in 2006, and approximately 1% in 2010. Among Grade 8 girls, approximately 4% reported drinking liquor at least once a week in 1990, compared to approximately 3% in 1994, approximately 3% in 1998, approximately 10% in 2002, approximately 4% in 2006, and approximately 3% in 2010. Among Grade 10 girls, approximately 11% reported drinking liquor at least once a week in 1990, compared to approximately 8% in 1994, approximately 9% in 1998, approximately 16% in 2002, approximately 9% in 2006, and approximately 10% in 2010.
Figure 10.7 describes rates of drinking liquor or spirits at least once a week by grade level and survey year. The reported percentages from the 2010 survey were among the lowest for liquor consumption since 1990. There does not appear to be either an upward or a downward trend in the use of these types of alcohol across the six HBSC cycles.
Drinking coolers was added to the HBSC survey in 2006. In 2010, similar percentages of girls and boys in Grade 6 and 8 reported drinking coolers at least once a week (Figure 10.8). In 2010, by Grade 10 there were 5% of boys and 8% of girls reporting drinking coolers on a weekly basis.
10.8 Drinking coolers at least once a week, by grade and gender in 2006 and 2010 (%)

[Text Equivalent, Figure 10.8]
10.8 Drinking coolers at least once a week, by grade and gender in 2006 and 2010 (%)
Figure 10.8 shows the percentage of students who report drinking coolers at least once a week, by grade, gender and year of survey. The graph shows that 2% of Grade 6 boys reported drinking coolers in 2006, compared to 1% in 2010. 5% of Grade 8 boys reported drinking coolers in 2006, compared to 3% in 2010. 6% of Grade 10 boys reported drinking coolers in 2006, compared to 5% in 2010. On the same question, 1% of Grade 6 girls reported drinking coolers in 2006, compared to 1% in 2010. 6% of Grade 8 girls reported drinking coolers in 2006, compared to 4% in 2010. 8% of Grade 10 girls reported drinking coolers in 2006, compared to 8% in 2010.
10.9 Students who have had 5 or more drinks (4 or more for females) in the past 12 months on one occasion, by grade and gender (%)
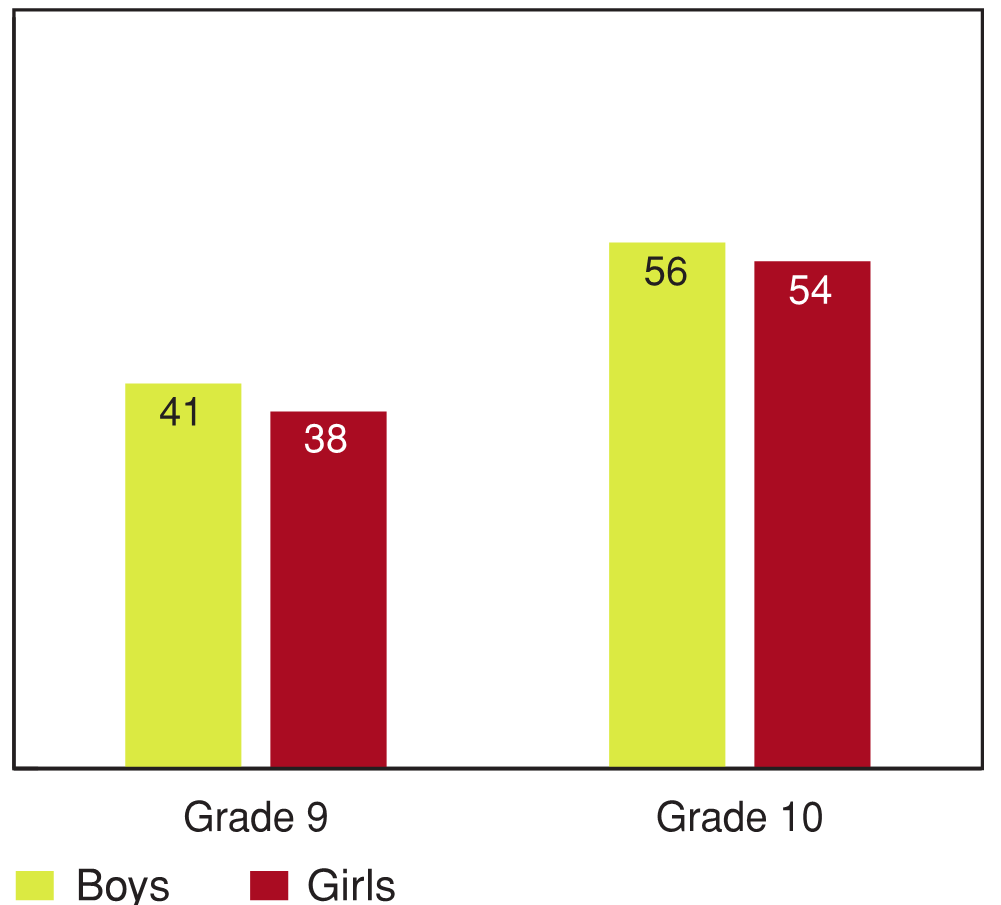
[Text Equivalent, Figure 10.9]
10.9 Students who have had 5 or more drinks (4 or more for females) in the past 12 months on one occasion, by grade and gender (%)
Figure 10.9 shows the percentage of students who have had 5 or more drinks (4 or more for females) in the past 12 months on one occasion, by grade and gender. The graph shows that 41% of Grade 9 boys reported having had 5 or more drinks in the past 12 months on one occasion, compared to 56% of Grade 10 boys. On the same question, 38% of Grade 9 girls reported having had 4 or more drinks in the past 12 months on one occasion, compared to 54% of Grade 10 girls.
In 2010, the HBSC study measured episodes of "binge drinking" as described earlier in the chapter. More than half of Grade 10 students reported such behaviour during the previous 12 months.
10.10 Students who report having ever been "really drunk" at least twice, by grade and gender (%)
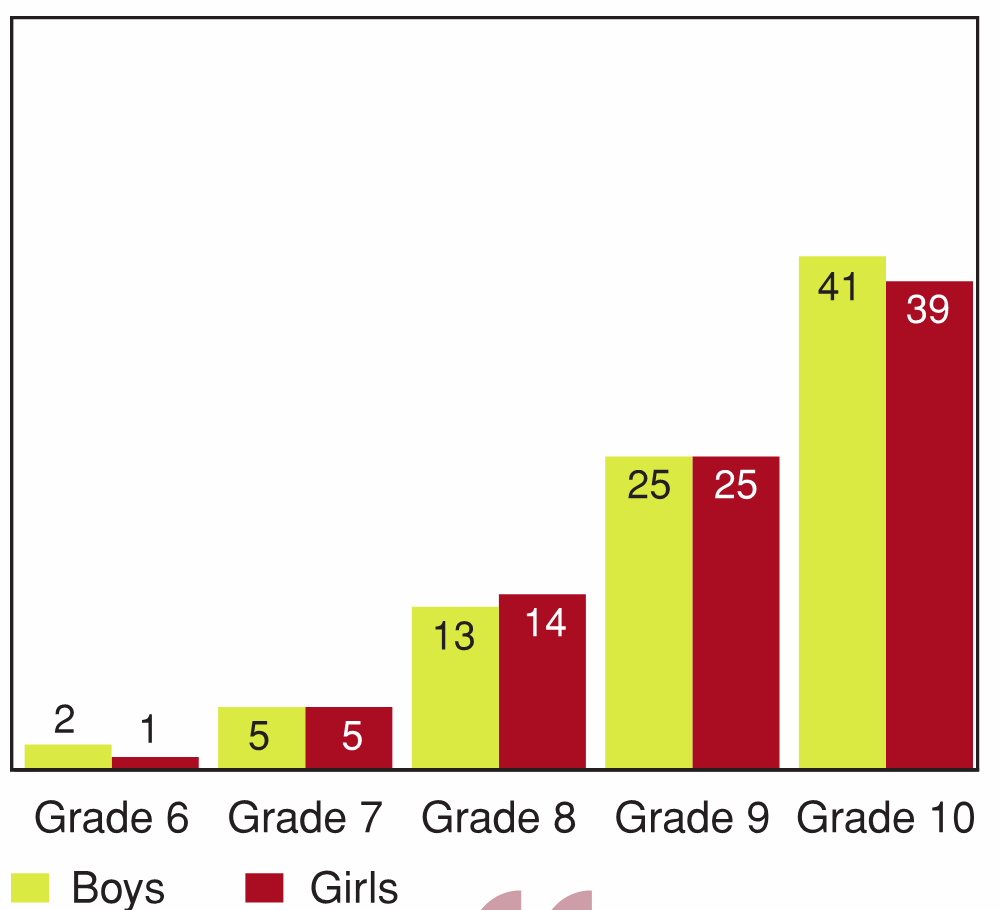
[Text Equivalent, Figure 10.10]
10.10 Students who report having ever been "really drunk" at least twice, by grade and gender (%)
Figure 10.10 shows the percentage of students who report having ever been "really drunk" at least twice, by grade and gender. The graph shows that 2% of Grade 6 boys report having been really drunk at least twice, compared to 5% of Grade 7 boys, 13% of Grade 8 boys, 25% of Grade 9 boys, and 41% of Grade 10 boys. On the same question, 1% of Grade 6 girls report having been really drunk at least twice, compared to 5% of Grade 7 girls, 14% of Grade 8 girls, 25% of Grade 9 girls, and 39% of Grade 10 girls.
Next, the percentage of students who reported having been "really drunk" on two or more occasions is shown. This indicator of alcohol misuse has been used in international HBSC reports (Currie et al., 2006) because it is thought to represent a behaviour that moves beyond simple experimentation on a single occasion. In 2010, the percentage of students who reported having been "really drunk" at least twice in their lifetime was similar for both boys and girls and increased steadily by grade (Figure 10.10).
Drinking seems to be more socially acceptable than smoking cannabis.
—Youth, Healthy Advice Workshop
10.11 Students who report having been "really drunk" at least twice, by grade, gender, and year of survey (%)

[Text Equivalent, Figure 10.11]
10.11 Students who report having been "really drunk" at least twice, by grade, gender, and year of survey (%)
Figure 10.11 is a line graph that shows the approximate percentage of students who report having been "really drunk" at least twice, by grade, gender and year of survey. The graph shows that approximately 7% of Grade 6 boys reported having been really drunk at least twice in 1990, compared to approximately 4% in 1994, approximately 3% in 1998, approximately 4% in 2002, approximately 3% in 2006, and approximately 1% in 2010. Among Grade 8 boys, approximately 22% reported having been really drunk at least twice in 1990, compared to approximately 15% in 1994, approximately 17% in 1998, approximately 16% in 2002, approximately 15% in 2006, and approximately 14% in 2010. Among Grade 10 boys, approximately 47% reported having been really drunk at least twice in 1990, compared to approximately 40% in 1994, approximately 44% in 1998, approximately 45% in 2002, approximately 37% in 2006, and approximately 38% in 2010. On the same question, approximately 1% of Grade 6 girls reported having been really drunk at least twice in 1990, compared to approximately 1% in 1994, approximately 1% in 1998, approximately 1% in 2002, approximately 1% in 2006, and approximately 1% in 2010. Among Grade 8 girls, approximately 19% reported having been really drunk at least twice in 1990, compared to approximately 13% in 1994, approximately 15% in 1998, approximately 16% in 2002, approximately 16% in 2006, and approximately 15% in 2010. Among Grade 10 girls, approximately 45% reported having been really drunk at least twice in 1990, compared to approximately 37% in 1994, approximately 44% in 1998, approximately 43% in 2002, approximately 38% in 2006, and approximately 38% in 2010.
Because this item has been included in every HBSC cycle since 1990, it is possible to explore trends in this indicator of perceived "drunkenness" between 1990 and 2010 (Figure 10.11). Percentages of students reporting this indicator of perceived "drunkenness" were relatively consistent between 1990 and 2010. Among Grade 10 students, for instance, having been really drunk on two or more occasions was most common in 1990, and then was stable between 1994 and 2010.
Cannabis use
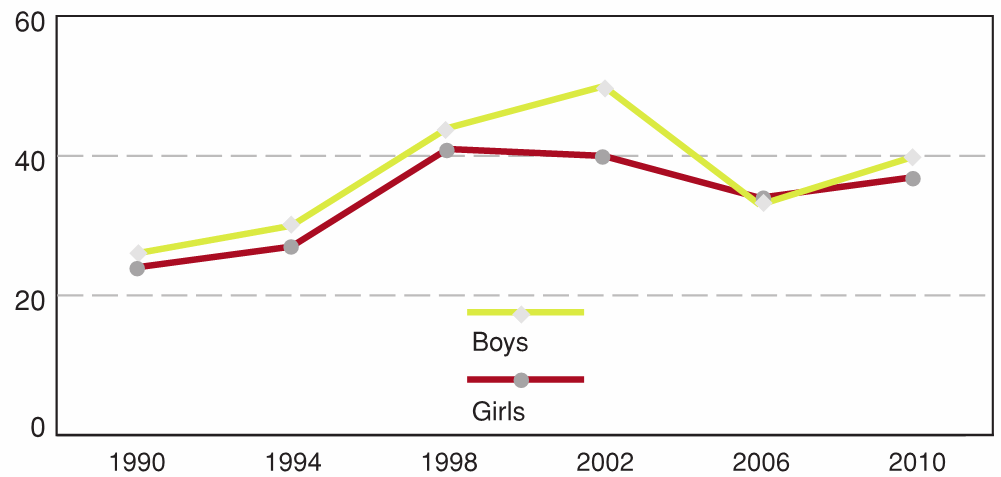
10.12 Grade 10 students who have ever tried cannabis, by gender and year of survey (%)
[Text Equivalent, Figure 10.12]
10.12 Grade 10 students who have ever tried cannabis, by gender and year of survey (%)
Figure 10.12 is a line graph that shows the approximate percentage of Grade 10 students who have ever tried cannabis, by gender and year of survey. The graph shows that approximately 25% of Grade 10 boys had tried cannabis in 1990, compared to approximately 30% in 1994, approximately 43% in 1998, approximately 50% in 2002, approximately 35% in 2006, and approximately 40% in 2010. On the same question, approximately 23% of Grade 10 girls had tried cannabis in 1990, compared to approximately 26% in 1994, approximately 40% in 1998, approximately 40% in 2002, approximately 35% in 2006, and approximately 37% in 2010.
The percentages of students reporting ever using cannabis have increased between 1990 and 2002, with slightly lower rates from the 2002 peak reported in the last two HBSC cycles (Figure 10.12). In 1990, approximately one in four students in Grade 10 had used cannabis at some point in their lifetime. By 2002, the rate of cannabis use doubled in boys and increased to two-fifths of girls. Rates of cannabis use have since declined to 40% in boys and 37% of girls in 2010.
10.13 Grade 9 and 10 students using cannabis in the past 12 months, by gender (%)

[Text Equivalent, Figure 10.13]
10.13 Grade 9 and 10 students using cannabis in the past 12 months, by gender (%)
Figure 10.13 shows the frequency of cannabis use in the past 12 months among Grade 9 and 10 students, by gender and expressed as a percentage. The graph shows that 72% of boys did not use cannabis in the past 12 months, 8% used it once or twice, 11% used it 3 to 19 times, and 10% used it 20 times or more. On the same question, 74% of girls did not use cannabis in the past 12 months, 8% used it once or twice, 11% used it 3 to 19 times, and 8% used it 20 times or more.

[Text Equivalent, Figure 10.14]
10.14 Grade 9 and 10 students using cannabis in the past 30 days, by gender (%)
Figure 10.14 shows the frequency with which Grade 9 and 10 students used cannabis in the past 30 days, by gender. The graph shows that 81% of boys did not use cannabis in the past 30 days, 6% used it once or twice, 8% used it 3 to 19 times, and 4% used it 20 times or more. On the same question, 83% of girls did not use cannabis in the past 30 days, 7% used it once or twice, 7% used it 3 to 19 times, and 3% used it 20 times or more.
Approximately one in four students in Grade 9 and 10 reported using cannabis in the past 12 months (Figure 10.13) with no significant differences between boys and girls. Frequent cannabis use was measured by asking students how often they used the drug in the past 30 days (Figure 10.14). In 2010, fewer than one in five students reported using cannabis during this time interval. Of these, 12% of boys and 10% of girls reported using cannabis three or more times in the past 30 days, indicative of regular consumption.
10.15 Percentages of Grade 9 and 10 students using illicit drugs and misusing medical drugs to get high in the last 12 months by gender (%)

[Text Equivalent, Figure 10.15]
10.15 Percentages of Grade 9 and 10 students using illicit drugs and misusing medical drugs to get high in the last 12 months by gender (%)
Figure 10.15 shows the percentages of Grade 9 and 10 students using illicit drugs and misusing medical drugs to get high in the last 12 months, by gender. The graph shows that 5% of boys and 6% of girls had used pain relievers such as Percodan, Demoral, Oxycontin, or Codeine in the past 12 months, compared to 4% of boys and 4% of girls who had used Ecstasy or MDMA (also known as E, Xtc, Adam, and X), 4% of boys and 3% of girls who had used LSD or other hallucinogens including PCP, magic mushrooms, mescaline, and peyote, 4% of boys and 2% of girls who had used Salvia (also known as Sally D, Divine Sage, and Magic Mint), 2% of boys and 2% of girls who had used Cocaine (also known as coke and crack), 2% of boys and 2% of girls who had used stimulants such as Ritalin, Concerta, or Adderall, 1% of boys and 2% of girls who had used glue or solvents such as gasoline and happy gas, 1% of boys and 1% of girls who had used sedatives or tranquillizers such as Valium, Ativan, or Xanax, 1% of boys and 1% of girls who used Amphetamine (also known as speed), 1% of boys and 1% of girls who used Opiates (also known as heroin, junk and smack), and 1% of boys and 1% of girls who had used Methamphetamine or Crystal methamphetamine (also known as ice).
Figure 10.15 describes the percentages of Grade 9 and 10 English speaking students reporting use of illicit drugs or taking medical drugs to get high (note: these figures represent approximately 88% of the 10,000 Grade 9 and 10 students in the 2010 HBSC sample; the wording in the French surveys was altered slightly and thus the results are not comparable).
Reported percentages of illicit drug use were lower than reported levels of cannabis use. Substances for which the highest proportions of Grade 9 and 10 students reported use were: pain relievers, ecstasy, LSD and other hallucinogens, and salvia. The least commonly used substances were amphetamine, methamphetamine, opiates, glue or solvent sniffing, and sedatives.
Perceived risks of substance use
The 2010 HBSC questionnaire also requested student perceptions about potential health risks associated with smoking, alcohol use, and substance use. As shown in Table 10.1, when asked about occasional use of these substances ("once in a while"), substantial portions of the students reported that they believed there were "slight or no risks" to the use of these substances. For example, two in five students indicated that smoking cigarettes once in a while posed "no risk" or "only a slight risk" to health, with some variations observed by grade level and gender. Among Grade 9 and 10 students, 39% of boys and 31% of girls reported slight risks of occasional cannabis use. For the alcohol measures, about two-thirds of students perceived slight or no risks to health associated with occasional alcohol use. Perceptions of "slight or no risks" to health for regularly smoking cigarettes, smoking cannabis, and consuming alcohol were much lower than perceptions of "slight or no risks" for occasional use of the same substances.
Perceptions surrounding the health risks associated with the use of illicit drugs other than cannabis, or misusing medical drugs to get high, were also measured in Grade 9 and 10 students. Percentages of students who perceived "slight or no health risks" of occasional use of Ecstasy, LSD or other hallucinogens, glue or solvents, or pain relievers, tranquilizers or stimulants were modest (Table 10.1). Few students (<10%) suggested that regular use of these substances had minimal risks to health.
| Grades | Male | Female | |
|---|---|---|---|
| Smoking cigarettes once in a while | 6 to 8 | 39 | 37 |
| 9 and 10 | 44 | 43 | |
| Smoking cigarettes on a regular basis | 6 to 8 | 11 | 9 |
| 9 and 10 | 9 | 6 | |
| Smoking marijuana once in a while | 6 to 8 | 23 | 18 |
| 9 and 10 | 39 | 31 | |
| Smoking marijuana on a regular basis | 6 to 8 | 12 | 9 |
| 9 and 10 | 19 | 11 | |
| Drinking alcohol once in a while | 6 to 8 | 62 | 59 |
| 9 and 10 | 64 | 66 | |
| Drinking alcohol on a regular basis | 6 to 8 | 20 | 13 |
| 9 and 10 | 19 | 12 | |
| Use Ecstasy once in a while | 9 and 10 | 15 | 13 |
| Use Ecstasy on a regular basis | 9 and 10 | 7 | 4 |
| Use hallucinogens, LSD or PCP once in a while | 9 and 10 | 12 | 9 |
| Use hallucinogens, LSD or PCP on a regular basis | 9 and 10 | 7 | 4 |
| Use glue or solvents once in a while | 9 and 10 | 16 | 13 |
| Use glue or solvents on a regular basis | 9 and 10 | 8 | 5 |
| Use pain relievers, tranquilizers or stimulants once in a while | 9 and 10 | 15 | 13 |
| Use pain relievers, tranquilizers or stimulants on a regular basis | 9 and 10 | 8 | 5 |
Sexual activity
We had permission to ask the following general question on sexual intercourse: "Have you ever had sexual intercourse (sometimes this is called "making love," "having sex," or "going all the way")?" In answering subsequent items related to sexual intercourse, students were expected to consider this definition. We were precluded from asking more specific detail on sexual practices (e.g., oral sex, anal intercourse, vaginal intercourse). These limits to HBSC questions were caused by international protocol requirements, and realities surrounding gaining permission to survey students in classrooms across the country.
Sometimes the harder they enforce... the more kids want to do it.
—Youth, Healthy Advice Workshop
[Text Equivalent, Figure 10.16]
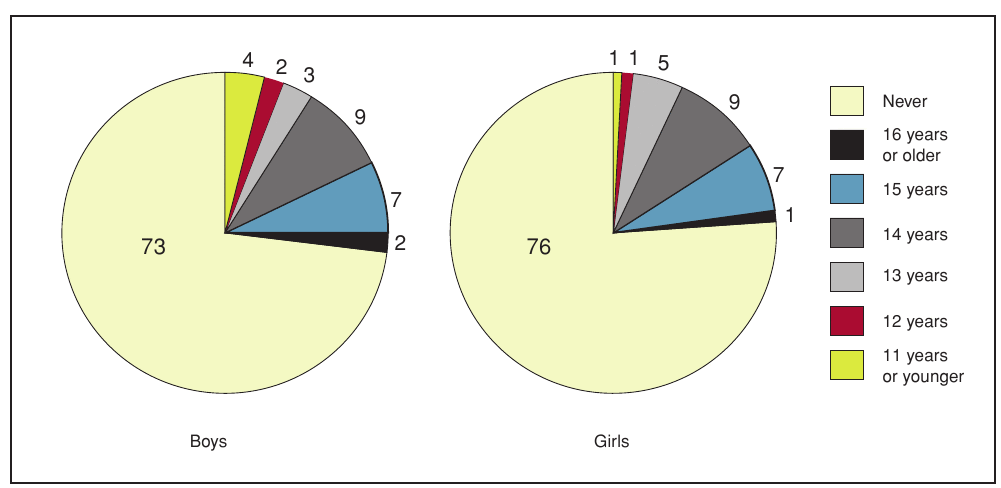
10.16 Age at which students in Grade 9 and 10 first had sexual intercourse, by gender (%)
Figure 10.16 shows the age at which students in Grade 9 and 10 first had sexual intercourse, by gender and expressed as a percentage. The graph shows that 73% of Grade 9 and 10 boys have never had sexual intercourse, 2% were 16 years of age or older when they first had sexual intercourse, 7% were 15 years old, 9% were 14 years old, 3% were 13 years old, 2% were 12 years old, and 4% were 11 years old or younger. On the same question, 76% of Grade 9 and 10 girls have never had sexual intercourse, 1% were 16 years of age or older when they first had sexual intercourse, 7% were 15 years old, 9% were 14 years old, 5% were 13 years old, 1% were 12 years old, and 1% were 11 years old or younger.
Twenty-seven per cent of boys and 24% of girls in Grade 9 and 10 reported ever having had sexual intercourse (Figure 10.16). Among these Grade 9 and 10 students, 6% percent of boys and 2% of girls reported first having sexual intercourse when they were 12 years old or younger.
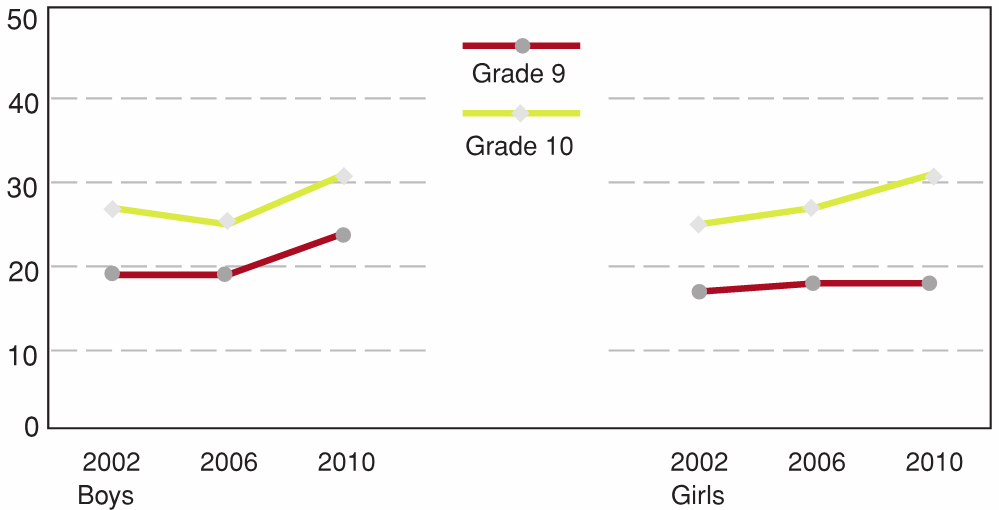
10.17 Grade 9 and 10 students who report having had sexual intercourse, by gender in 2002, 2006 and 2010 (%)
[Text Equivalent, Figure 10.17]
10.17 Grade 9 and 10 students who report having had sexual intercourse, by gender in 2002, 2006 and 2010 (%)
Figure 10.17 is a line graph that shows the percentage of Grade 9 and 10 students who report having had sexual intercourse, by gender, in 2002, 2006, and 2010. The graph shows that approximately 20% of Grade 9 boys reported having had sexual intercourse in 2002, compared to approximately 20% in 2006, and approximately 24% in 2010. Among Grade 10 boys, approximately 27% reported having had sexual intercourse in 2002, compared to approximately 25% in 2006, and approximately 31% in 2010. On the same question, approximately 18% of Grade 9 girls reported having had sexual intercourse in 2002, compared to approximately 19% in 2006, and approximately 19% in 2010. Among Grade 10 girls, approximately 25% reported having had sexual intercourse in 2002, compared to approximately 27% in 2006, and approximately 31% in 2010.
The percentage of students in Grade 9 and 10 who reported engaging in sexual intercourse increased slightly from 2002 to 2010 (Figure 10.17). Among Grade 10 students, the percentage of boys who reported having had sexual intercourse was 27% in 2002 and 31% in 2010, with the percentage of girls being 25% in 2002 and 31% in 2010.
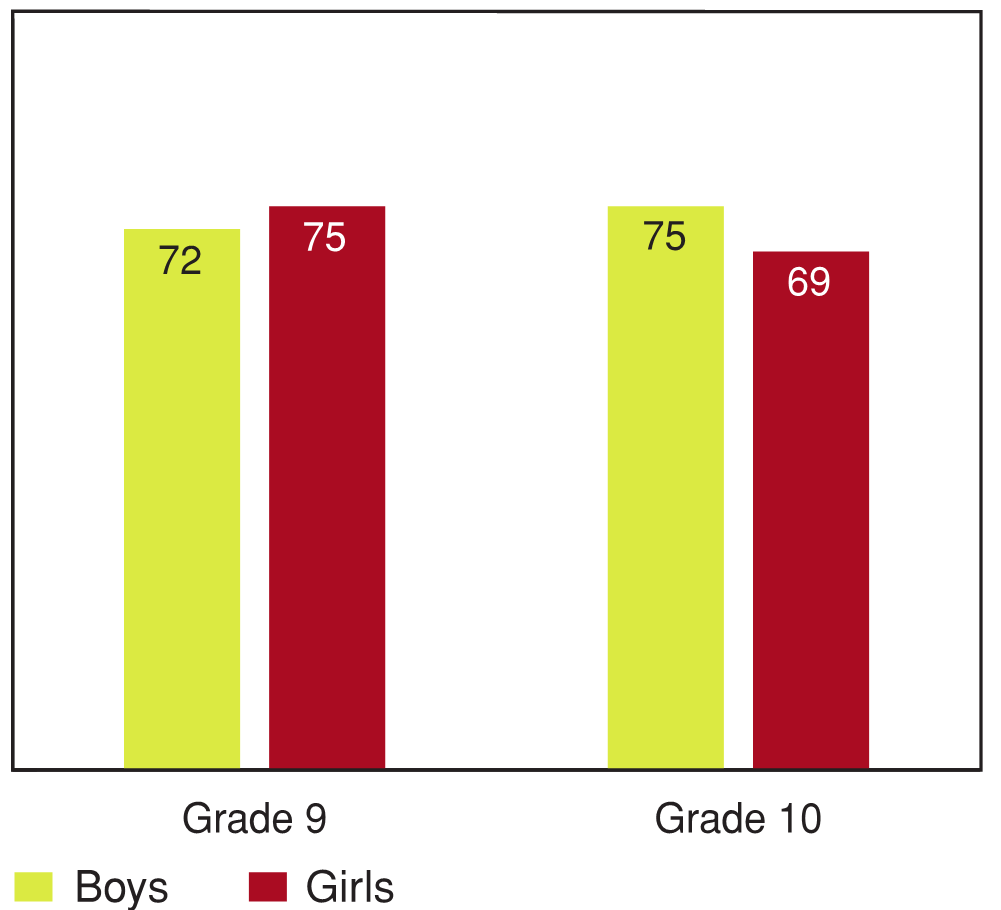
10.18 Grade 9 and 10 students who report they or their partner used a condom the last time they had sexual intercourse, by gender (%)
[Text Equivalent, Figure 10.18]
10.18 Grade 9 and 10 students who report they or their partner used a condom the last time they had sexual intercourse, by gender (%)
Figure 10.18 shows the percentage of Grade 9 and 10 students who report that they or their partners used a condom the last time they had sexual intercourse, by gender. The graph shows that 72% of Grade 9 boys report that they used a condom the last time they had sexual intercourse, compared to 75% of Grade 10 boys. On the same question, 75% of Grade 9 girls report that their partner used a condom the last time they had sexual intercourse, compared to 69% of Grade 10 girls.
Within the minority of students who reported sexual intercourse, approximately three in every four students in Grade 9 and 10 reported that they or their partner used a condom when they last had sexual intercourse (Figure 10.18). Slightly lower percentages were reported for Grade 10 versus Grade 9 girls.
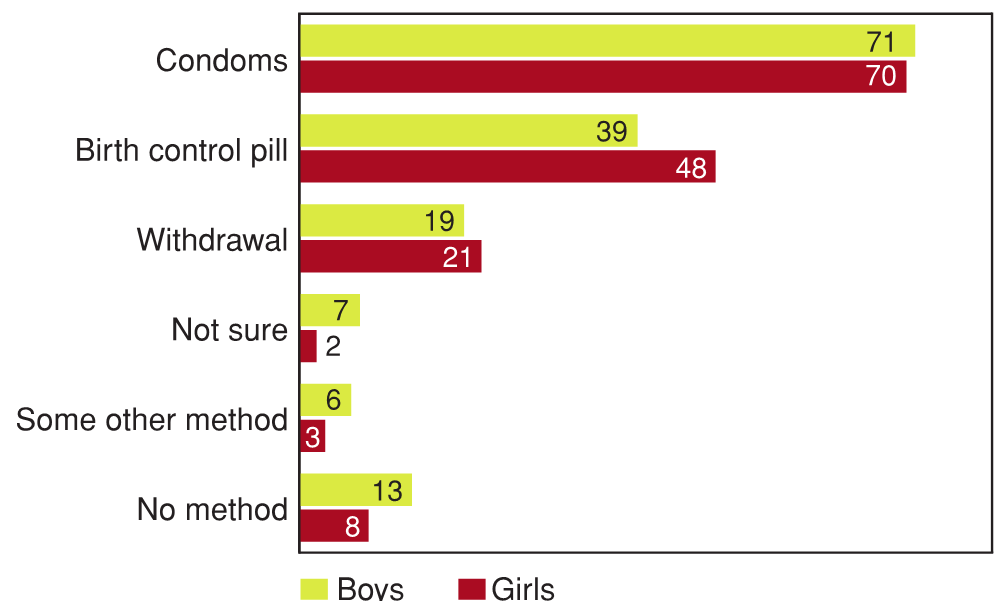
10.19 Contraceptive measures used by sexually active Grade 9 and 10 students the last time they had intercourse, by gender (%)
[Text Equivalent, Figure 10.19]
10.19 Contraceptive measures used by sexually active Grade 9 and 10 students the last time they had intercourse, by gender (%)
Figure 10.19 shows the contraceptive measures used by sexually active Grade 9 and 10 students the last time they had intercourse, by gender and expressed as a percentage. The graph shows that 71% of boys and 70% of girls had used condoms as contraception the last time they had intercourse, compared to 39% of boys and 48% who used the birth control pill, 19% of boys and 21% of girls who used withdrawal, 7% of boys and 2% of girls who were not sure, 6% of boys and 3% of girls who used some other method, and 13% of boys and 8% of girls who used no method.
Students in Grade 9 and 10 were asked to indicate the methods of contraception they and their partner used the last time they had sexual intercourse. Substantial numbers of respondents indicated they used more than one method. Condoms were the most commonly used contraceptive method, with 71% of boys and 70% of girls indicating that a condom was used the last time they had sexual intercourse (Figure 10.19). The use of birth control pills was the second most commonly used method of contraceptive, with 39% of boys and 48% of girls reporting that they or their partner used birth control pills the last time they had intercourse. As was found in the 2002 and 2006 surveys (not shown), withdrawal was practiced by students in both grades, with 19% of boys and 21% of girls reporting the use of this method.
Substance use and risky behaviours in relation to mental health
Smoking
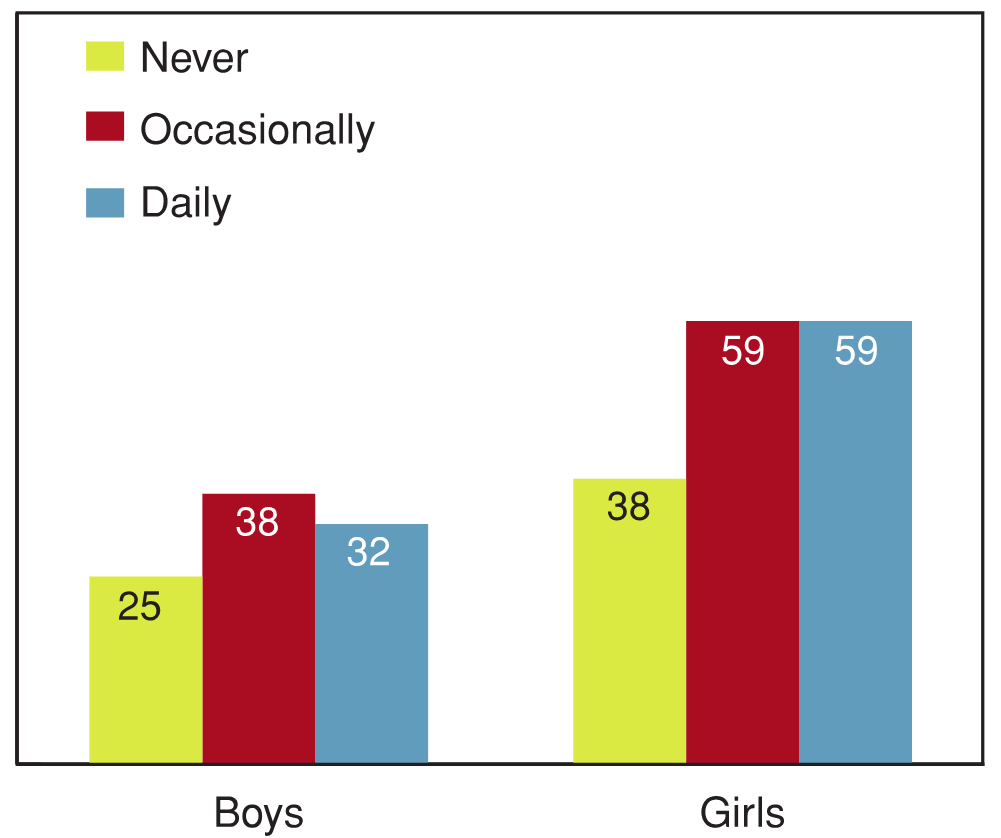
10.20 Students reporting high levels of emotional problems, by how often they smoke cigarettes, by gender (%) Footnote 1
[Text Equivalent, Figure 10.20]
10.20 Students reporting high levels of emotional problems, by how often they smoke cigarettes, by gender (%) *
Figure 10.20 shows the percentage of students reporting high levels of emotional problems by how often they smoke cigarettes, by gender. The graph shows that 25% of boys who never smoke cigarettes report high levels of emotional problems, compared to 38% of boys who smoke cigarettes occasionally and 32% of boys who smoke cigarettes on a daily basis. On the same question, 38% of girls who never smoke cigarettes report high levels of emotional problems, compared to 59% of girls who smoke cigarettes occasionally, and 59% of girls who smoke cigarettes on a daily basis.
* 25% of boys who never smoke cigarettes report relatively high levels of emotional health problems, compared with 38% of boys who smoke occasionally. A full explanation of how to interpret the figures that relate to mental health is provided in Chapter 1.
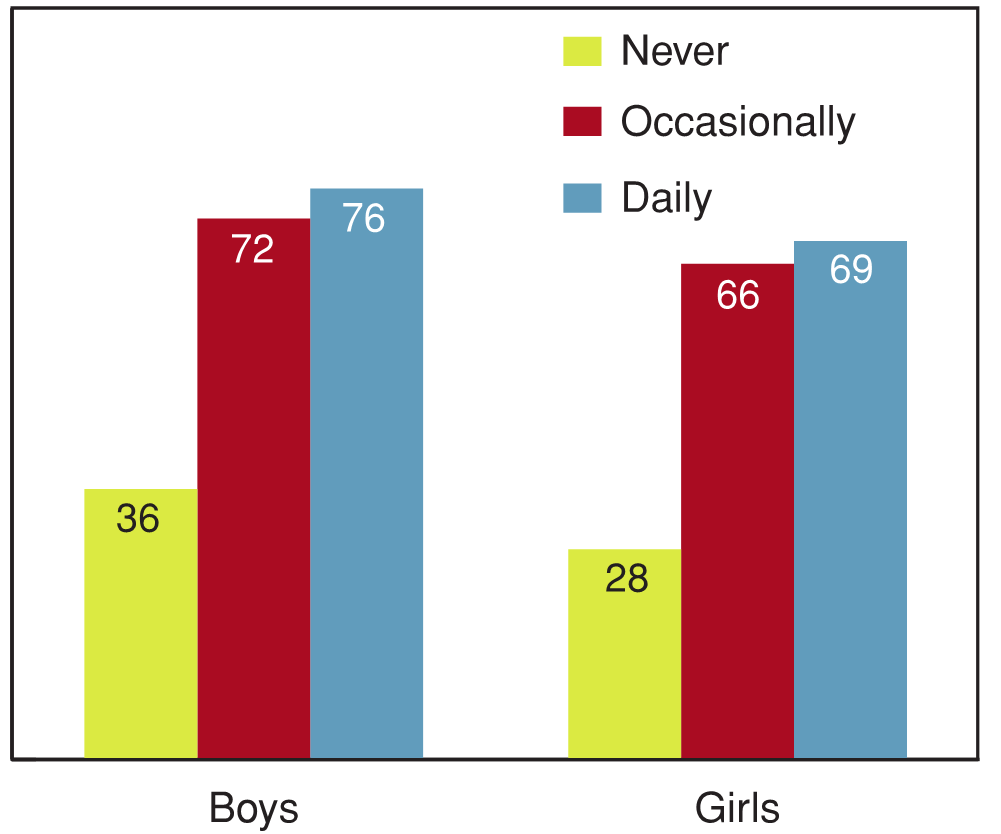
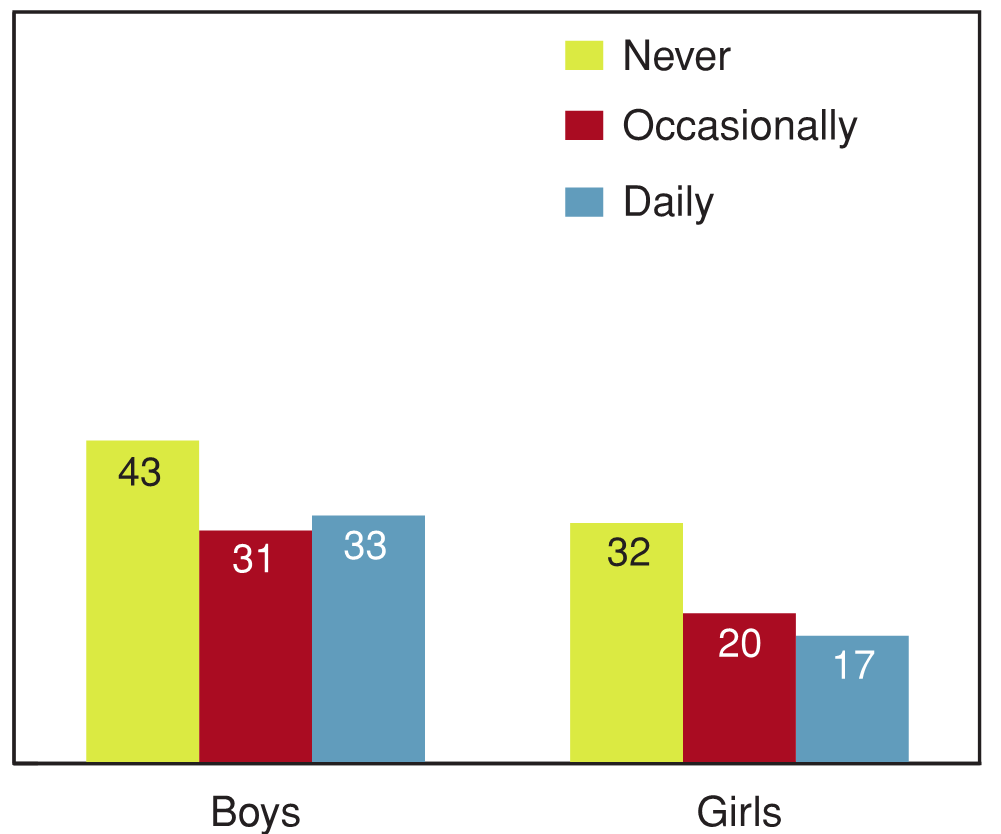
For both boys and girls, reports of occasional and daily smoking were related to higher levels of emotional problems (Figure 10.20) and also higher levels of behavioural problems (Figure 10.21). The percentage of young people reporting high levels of behavioural problems was more than twice the rate among smokers than among non-smokers. These findings correspond with research that has found that smoking has both emotional and behavioural effects (Kollins, McClernon & Fuemmeler, 2005). In Figure 10.22, we see an expected relationship between not smoking and positive emotional well‑being.
10.21 Students reporting high levels of behavioural problems, by how often they smoke cigarettes, by gender (%)
[Text Equivalent, Figure 10.21]
10.21 Students reporting high levels of behavioural problems, by how often they smoke cigarettes, by gender (%)
Figure 10.21 shows the percentage of students reporting high levels of behavioural problems by how often they smoke cigarettes, by gender. The graph shows that 36% of boys who never smoke cigarettes report high levels of behavioural problems, compared to 72% of boys who smoke cigarettes occasionally, and 76% of boys who smoke cigarettes on a daily basis. On the same question, 28% of girls who never smoke cigarettes report high levels of behavioural problems, compared to 66% of girls who smoke cigarettes occasionally, and 69% of girls who smoke cigarettes on a daily basis.
10.22 Young people reporting high levels of emotional well‑being by how often they smoke cigarettes, by gender (%)
[Text Equivalent, Figure 10.22]
10.22 Young people reporting high levels of emotional well‑being by how often they smoke cigarettes, by gender (%)
Figure 10.22 shows the percentage of young people reporting high levels of emotional well‑being by how often they smoke cigarettes, by gender. The graph shows that 43% of boys who never smoke cigarettes report high levels of emotional well‑being, compared to 31% of boys who smoke cigarettes occasionally, and 33% of boys who smoke cigarettes on a daily basis. On the question, 32% of girls who never smoke cigarettes report high levels of emotional well‑being, compared to 20% of girls who smoke cigarettes occasionally, and 17% of girls who smoke cigarettes on a daily basis.
Binge drinking
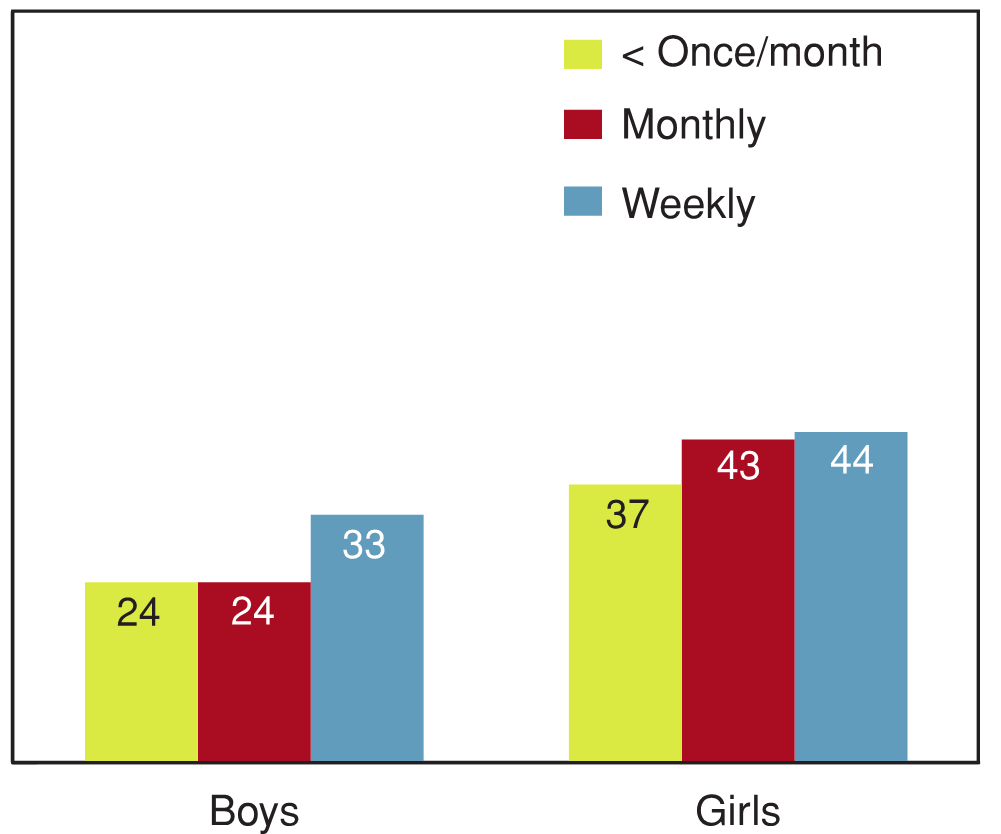
10.23 Students reporting high levels of emotional problems, by binge drinking in the past 12 months, by gender (%)
[Text Equivalent, Figure 10.23]
10.23 Students reporting high levels of emotional problems, by binge drinking in the past 12 months, by gender (%)
Figure 10.23 shows the percentage of students reporting high levels of emotional problems, by binge drinking behaviour in the past 12 months, by gender. The graph shows that 24% of boys who binge drink less than once a month report high levels of emotional problems, compared to 24% of boys who binge drink on a monthly basis, and 33% of boys who binge drink on a weekly basis. On the same question, 37% of girls who binge drink less than once a month report high levels of emotional problems, compared to 43% of girls who binge drink on a monthly basis, and 44% of girls who binge drink on a weekly basis.
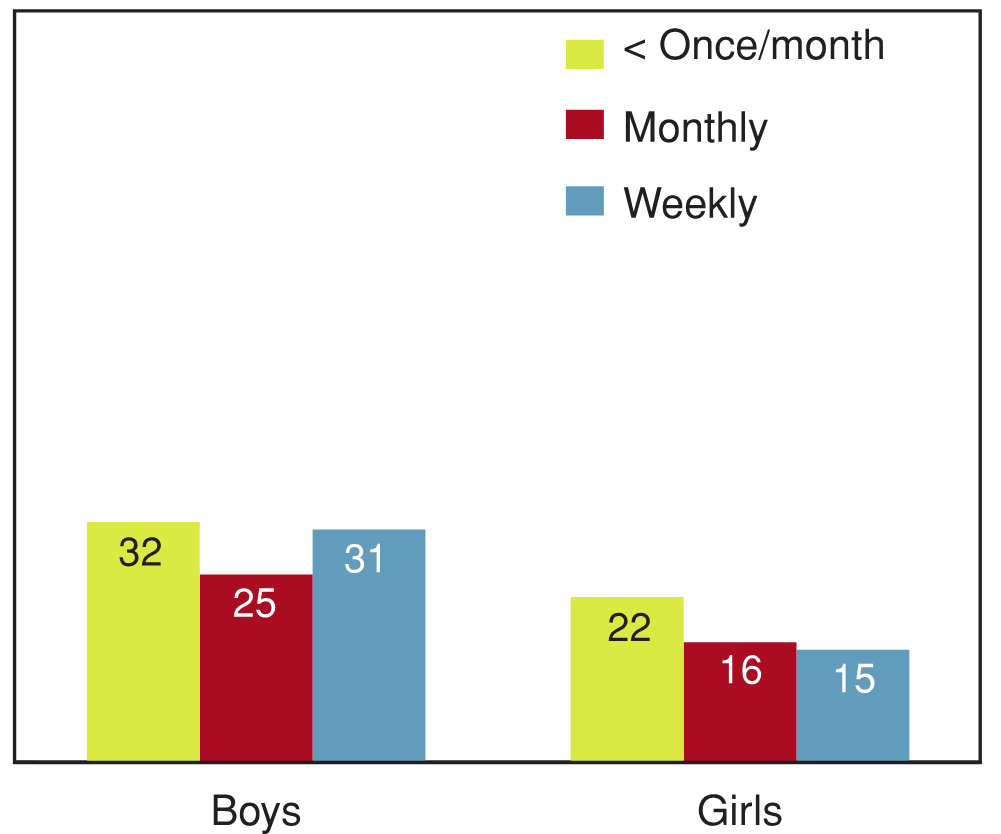
As is the case with smoking, binge drinking during the previous 12 months corresponded with high levels of both emotional (Figure 10.23) and behavioural problems (Figure 10.24). Students who reported binge drinking every week were more likely to report emotional problems and about twice as likely to report behavioural problems as compared to students who binge drank less than once a month or not at all. Binge drinking was negatively related to high emotional well‑being in girls but not in boys (Figure 10.25), which is consistent with research that has found that excessive drinking as a means to cope with negative feelings is more common with girls than boys (Chalder, Elgar & Bennett, 2006).
10.24 Students reporting high levels of behavioural problems by binge drinking in the past 12 months, by gender (%)

[Text Equivalent, Figure 10.24]
10.24 Students reporting high levels of behavioural problems by binge drinking in the past 12 months, by gender (%)
Figure 10.24 shows the percentage of students reporting high levels of behavioural problems, by binge drinking behaviour in the past 12 months, by gender. The graph shows that 32% of boys who binge drink less than once a month report high levels of behavioural problems, compared to 57% of boys who binge drink on a monthly basis, and 72% of boys who binge drink on a weekly basis. On the same question, 22% of girls who binge drink less than once a month report high levels of behavioural problems, compared to 51% of girls who binge drink on a monthly basis, and 66% of girls who binge drink on a weekly basis.
10.25 Students reporting high levels of emotional well‑being by binge drinking in the past 12 months, by gender (%)
[Text Equivalent, Figure 10.25]
10.25 Students reporting high levels of emotional well‑being by binge drinking in the past 12 months, by gender (%)
Figure 10.25 shows the percentage of students reporting high levels of emotional well‑being, by binge drinking behaviour in the past 12 months, by gender. The graph shows that 32% of boys who binge drink less than once a month report high levels of emotional well‑being, compared to 25% of boys who binge drink on a monthly basis, and 31% of boys who binge drink on a weekly basis. On the same question, 22% of girls who binge drink less than once a month report high levels of emotional well‑being, compared to 16% of girls who binge drink on a monthly basis, and 15% of girls who binge drink on a weekly basis.
Cannabis use
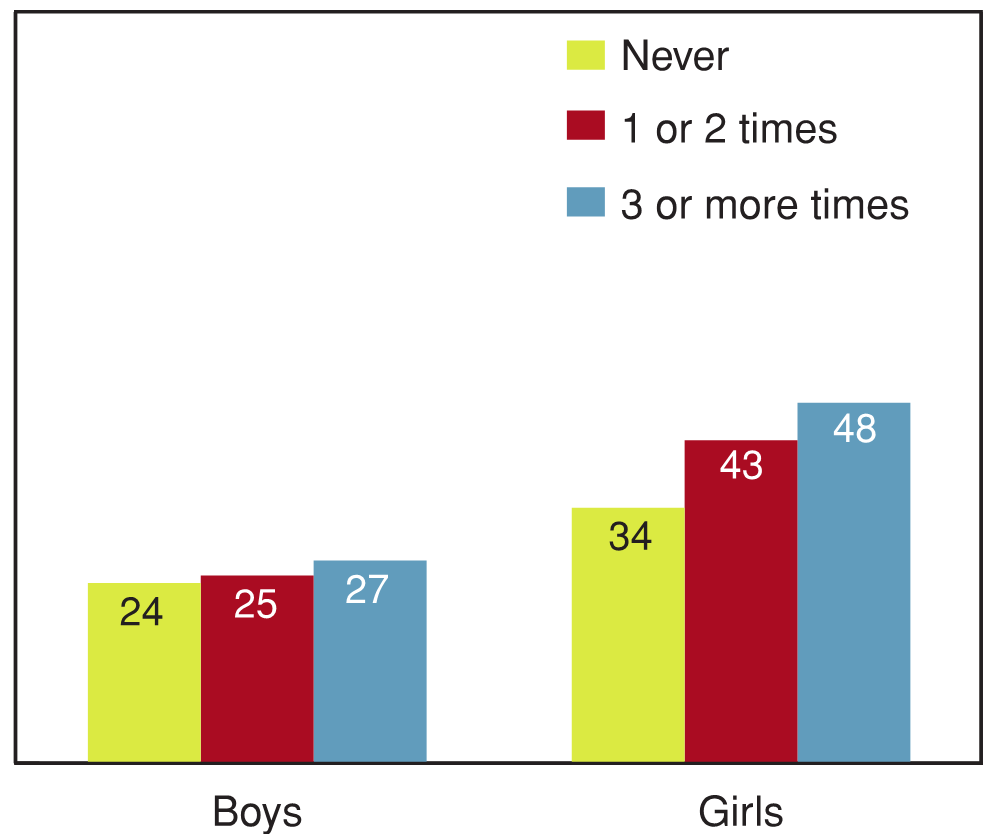
10.26 Students reporting high levels of emotional problems, by frequency of cannabis use during lifetime, by gender (%)
[Text Equivalent, Figure 10.26]
10.26 Students reporting high levels of emotional problems, by frequency of cannabis use during lifetime, by gender (%)
Figure 10.26 shows the percentage of students reporting high levels of emotional problems by frequency of cannabis use during lifetime, by gender. The graph shows that 24% of boys who have never used cannabis report high levels of emotional problems, compared to 25% of boys who have used cannabis one or two times, and 27% of boys who have used cannabis three or more times. On the same questions, 34% of girls who have never used cannabis report high levels of emotional problems, compared to 43% of girls who have used cannabis once or twice, and 48% of boys who have used cannabis three or more times.
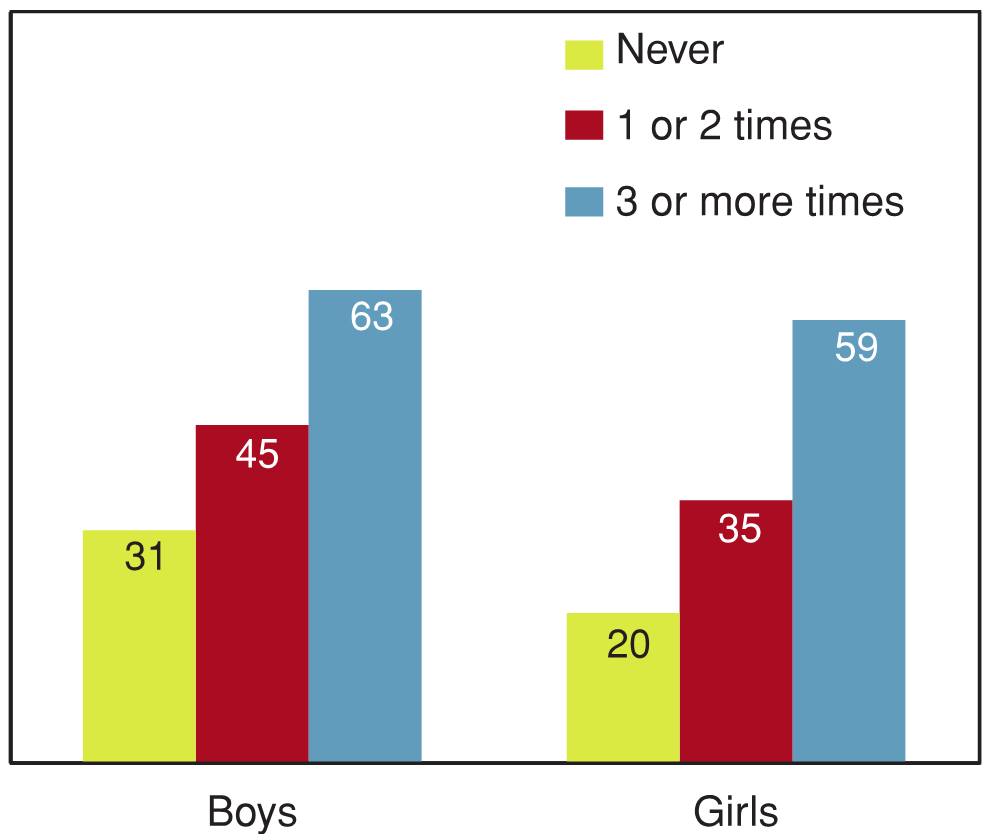
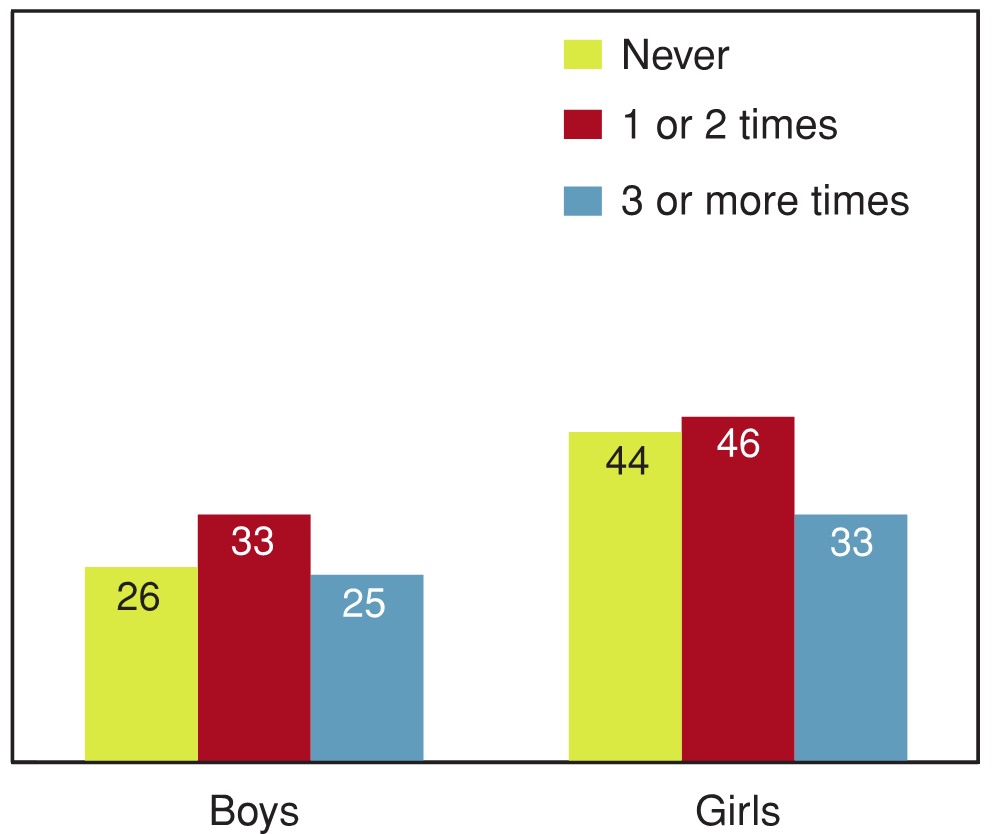
Associations between youth's lifetime use of cannabis and each of the four mental health indicators (Figures 10.26 to 10.29) suggest that the frequency of cannabis use is associated with high emotional problems in girls and with behavioural problems in both genders. Figure 10.26 shows associations with emotional problems and frequency of cannabis use in both genders, although differences are slight in boys. It is unclear whether cannabis use is an antecedent or a consequence of emotional problems in girls or whether they tend to co-occur due to other factors. Figure 10.29 shows an association between cannabis use and prosocial behaviour in girls but not in boys.
10.27 Students reporting high levels of behavioural problems, by frequency of cannabis use during lifetime, by gender (%)
[Text Equivalent, Figure 10.27]
10.27 Students reporting high levels of behavioural problems, by frequency of cannabis use during lifetime, by gender (%)
Figure 10.27 shows the percentage of students reporting high levels of behavioural problems by frequency of cannabis use during their lifetime, by gender. The graph shows that 31% of boys who have never used cannabis report high levels of behavioural problems, compared to 45% of boys who have used cannabis one or two times, and 63% of boys who have used cannabis three or more times. On the same question, 20% of girls who have never used cannabis report high levels of emotional problems, compared to 35% of girls who have used cannabis one or two times, and 59% of girls who have used cannabis 3 or more times.
[Cannabis] is everywhere — even being rolled and smoked on the bus.
—Youth, Healthy Advice Workshop
10.28 Students reporting high levels of emotional well‑being, by frequency of cannabis use during lifetime, by gender (%)

[Text Equivalent, Figure 10.28]
10.28 Students reporting high levels of emotional well‑being, by frequency of cannabis use during lifetime, by gender (%)
Figure 10.28 shows the percentage of students reporting high levels of emotional well‑being based on frequency of cannabis use during their lifetime, by gender. The graph shows that 32% of boys who have never used cannabis report high levels of emotional well‑being, compared to 29% of boys who have used cannabis one or two times, and 26% of boys who have used cannabis three or more times. On the same question, 22% of girls who have never used cannabis report high levels of emotional well‑being, compared to 19% of girls who have used cannabis one or two times, and 13% of girls who have used cannabis three or more times.
10.29 Students reporting high levels of prosocial behaviour, by frequency of cannabis use during lifetime, by gender (%)
[Text Equivalent, Figure 10.29]
10.29 Students reporting high levels of prosocial behaviour, by frequency of cannabis use during lifetime, by gender (%)
Figure 10.29 shows the percentage of students reporting high levels of prosocial behaviour by frequency of cannabis use during their lifetime, by gender. The graph shows that 26% of boys who have never used cannabis report high levels of prosocial behaviour, compared to 33% of boys who have used cannabis one or two times, and 25% of boys who have used cannabis three or more times. On the same question, 44% of girls who have never used cannabis report high levels of prosocial behaviour, compared to 46% of girls who have used cannabis one or two times, and 33% of girls who have used cannabis 3 or more times.
Sexual activity
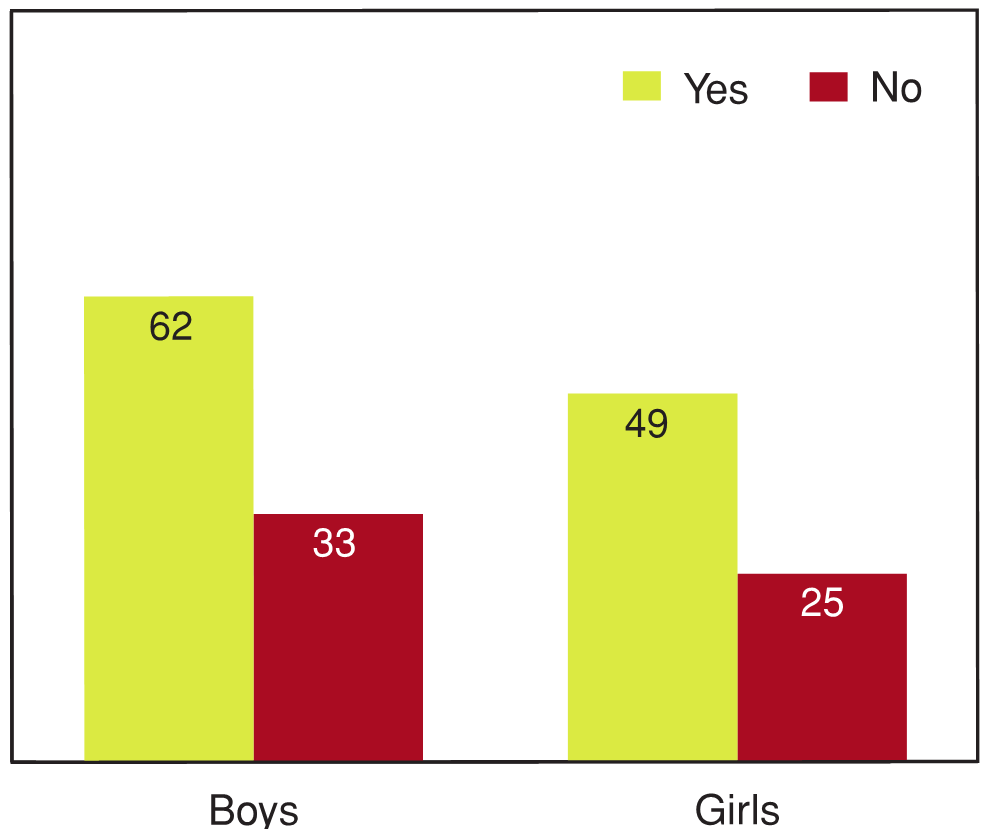
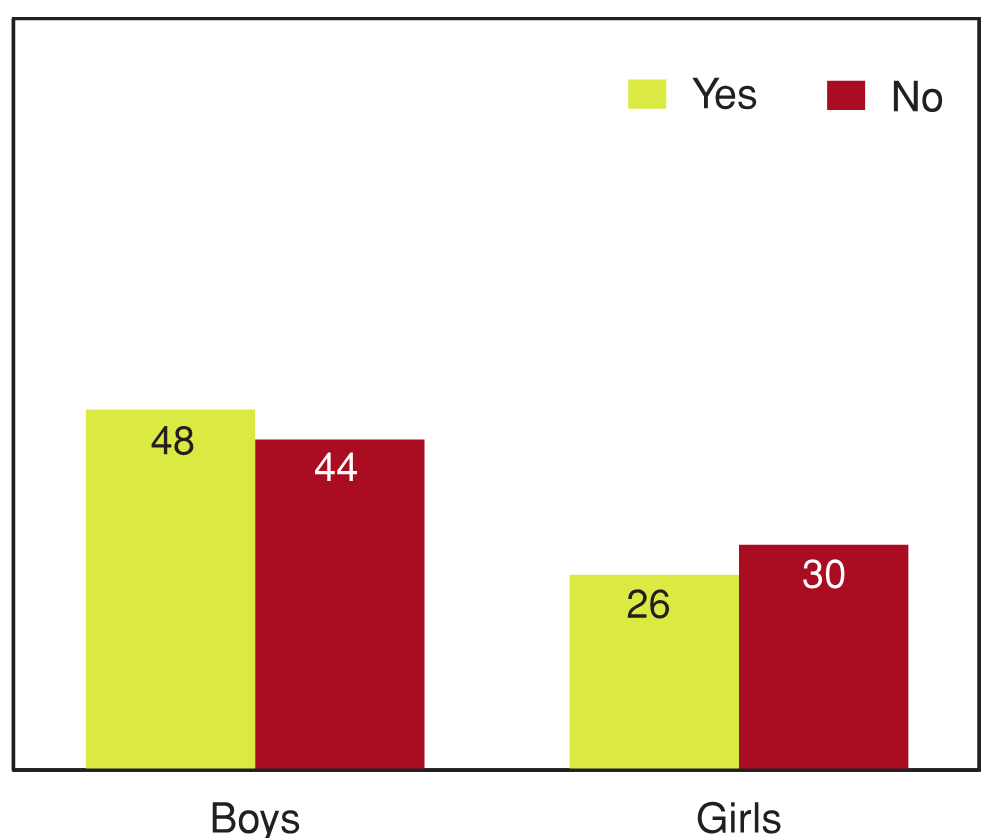
Having ever had sexual intercourse relates to behavioural problems in the same pattern seen on the three other risky behaviour measures. Although most boys and girls have not had sexual intercourse, those who have are much more likely to report high levels of behavioural problems (Figure 10.30). Boys who have had sex, however, are also more likely to show high levels of emotional well‑being compared to boys who have not had sex (Figure 10.31). This pattern is reversed for girls, for whom having had sex has a negative impact on emotional well‑being. Though these differences are not large, the inverse pattern for boys and girls is noteworthy.
10.30 Students reporting high levels of behavioural problems by whether or not they have had sex, by gender (%)
[Text Equivalent, Figure 10.30]
10.30 Students reporting high levels of behavioural problems by whether or not they have had sex, by gender (%)
Figure 10.30 shows the percentage of students reporting high levels of behavioural problems by whether or not they have had sex, by gender. The graph shows that 62% of boys who have had sex report high levels of behavioural problems, compared to 33% of boys who have not. On the same question, 49% of girls who have had sex report high levels of behavioural problems, compared to 25% of girls who have not.
10.31 Students reporting high levels of emotional well‑being by whether or not they have had sex, by gender (%)
[Text Equivalent, Figure 10.31]
10.31 Students reporting high levels of emotional well‑being by whether or not they have had sex, by gender (%)
Figure 10.31 shows the percentage of students reporting high levels of emotional well‑being based on whether or not they have had sex, by gender. The graph shows that 48% of boys who have had sex report high levels of emotional well‑being, compared to 44% of boys who have not. On the same question, 26% of girls who have had sex report high levels of emotional well‑being, compared to 30% of girls who have not.
What young people thought about these findings
The youth engagement workshop was used to gain perspective from a diverse group of young Canadians on the issues that affect young people positively and negatively with respect to mental health. The students examined patterns of risk-taking reported by young people, and then interpreted how those patterns related to the four standard indicators of mental health.
The young people who were present spoke openly about their exposures to risk-taking, whether that was smoking, use of cannabis or other drugs, or alcohol use or misuse. It was clear that they understood that such behaviours were commonplace in their schools and communities.
It was also clear that the young people at the workshop understood the potential links between these behaviours and mental health outcomes, including the higher levels of both emotional and behavioural problems reported in this chapter among youth who smoke, use cannabis, and engage in binge drinking. They appreciated the apparent positive associations between choosing not to engage in such risk-taking behaviours and positive measures of emotional well‑being. However, it was less clear whether they viewed these behaviours as positive or negative, as an inevitable part of growing up, or whether such behaviours were solely a product of the social influences that surrounded them.
The implications of the workshop observations for families, schools, and communities point to the importance of educating young people about the consequences of smoking, alcohol misuse, illicit drug use, misusing medical drugs, and unsafe sexual behaviours. Left unchecked, these behaviours may form part of a trajectory that leads to many negative consequences later in life (Due et al., 2011). Strategies to minimize active engagement in adolescent risk-taking behaviours should be coupled with positive information. This information would emphasize opportunities that promote positive mental health and social skills training that empower youth to avoid engaging in these risky behaviours.
Summary and implications
Key issues of concern
- Alcohol and cannabis are the most commonly used substances among Canadian youth. A significant percentage of students have used alcohol and cannabis at least once by the time they reach Grade 10.
- Between 1990 and 2010, the lifetime prevalence of cannabis use among Grade 9 and 10 students increased from 25% to 38%.
- Engagement in substance use and risky behaviours relates to emotional and behavioural problems.
Key issues to celebrate
- Rates of smoking among Canadian youth are at historical lows. In 2010, only 7% of boys and 6% of girls in Grade 10 reported smoking cigarettes every day.
- Most young people appreciate the health risks associated with substance use and risky behaviour.
- Although many youth have tried using cannabis, less than 20% of students in Grade 9 and 10 reported using cannabis in the last 30 days.
Commentary
The reported decline in the prevalence of smoking among Canadian youth is a very positive finding. Reductions in rates of daily smoking may reflect a change in attitudes towards smoking among young people. This attitudinal shift may be attributable in large part to aggressive policy initiatives (e.g., banning smoking from public spaces) and anti-smoking campaigns targeting youth, including interventions developed in school environments (Thomas, 2002).
While weekly consumption of beer and wine has declined since 1990, approximately two-thirds of students in Grades 9 and 10 still reported having tried alcohol. Additionally, 25% of Grade 9 students and 40% of Grade 10 students indicated they had been really drunk at least twice. Although the decrease in weekly consumption provides some indication that health promotion efforts have had an effect on youth drinking, there clearly is a need for continued work in this area, especially given the significant minority of students who have been drunk on more than one occasion.
Cannabis use is also reported by a significant minority of students with approximately two in five students stating they had tried cannabis and one in four using it in the past year. These levels have remained fairly consistent since 1998 after having increased from 1990 to 1998. Equally troubling from a health promotion perspective is that many Canadian adolescents, especially in Grades 9-10 as compared to Grades 6-8, believed that smoking cannabis on an occasional basis posed only a "slight risk" or "no risk" to their health. These adolescents also saw regular smoking of cannabis as less risky than regular smoking of cigarettes. These figures suggest that the same cross-sectoral attention that has been paid to tobacco must now be applied equally to cannabis.
Approximately one-quarter of the respondents to the survey indicated they had had sexual intercourse. Of these students, about one-quarter did not use a condom the last time they had sexual intercourse. While having sex is not unhealthy in and of itself, early onset of sexual activity has been connected to negative consequences in adulthood including increased number of recent sexual partners, increased number of recent risky sexual partners, greater history of sexually transmitted infections (STIs), having sex while intoxicated, and (for males) increased sexual dysfunction (Sandfort, Orr, Hirsch, & Santelli, 2008). Furthermore, adolescents are at relatively high risk for STIs (Weinstock, Berman, & Cates, 2004), which could be greatly lessened through consistent use of condoms.
References
- Canadian Centre on Substance Abuse. (2007). Substance abuse in action: Focus on Youth. Ottawa: Canadian Centre on Substance Abuse.
- Chalder, M., Elgar, F.J. & Bennett, P. (2006). Drinking and motivations to drink among adolescent children of parents with alcohol problems. Alcohol and Alcoholism, 41:107-113.
- Chassin, L., Pitts, S. & Prost J. (2002). Binge drinking trajectories from adolescence to emerging adulthood in a high-risk sample: Predictors and substance abuse outcomes. Journal of Consulting and Clinical Psychology, 70:67-78.
- Collin, C. (2006). Substance abuse and public policy in Canada: V. Alcohol and related harms. Ottawa: Library of Parliament.
- Currie C., Gabhainn, N., Godeau, E., Roberts, C., Smith, R., Currie. D., et al. (2008). Inequalities in young people's health: HBSC international report from the 2005/2006 Survey. In Health Policy Series: Health Policy for Children and Adolescents Issue 5. Copenhagen, WHO Regional Office for Europe.
- Deas, D. & Thomas, S. (2002). Comorbid psychiatric factors contributing to adolescent alcohol and other drug use. Alcohol Research and Health, 26:116-121.
- Due, P., Krølner, R., Rasmussen, M., Andersen, A., Trab Damsgaard, M., Graham, H. & Holstein, B.E. (2011). Pathways and mechanisms in adolescence contribute to adult health inequalities. Scandinavia Journal of Public Health, 39(6 Suppl):62-78.
- Elgar, F.J., Knight, J., Worrall, G.J. & Sherman, G. (2003). Behavioural and substance use problems in rural and urban delinquent males. Canadian Journal of Psychiatry, 48:633-636.
- Hawkins, J.D., Catalano, R.F. & Miller, J.Y. (1992). Risk and protective factors for alcohol and other drug problems in adolescence and early adulthood: Implications for substance use prevention. Psychological Bulletin, 112:64-105.
- Kollins, S.H., McClernon, F.J. & Fuemmeler, B.F. (2005). Association between smoking and attention-deficit/hyperactivity disorder symptoms in a population-based sample of young adults. Archives of General Psychiatry, 62:1142-1147.
- Langille, D.B., Asbridge, M., Flowerdew, G. & Allen, M. (2009). Associations of sexual risk-taking with having intercourse before 15 years in adolescent females in Cape Breton, Nova Scotia, Canada. Sexual Health, 7:199-204.
- Nell, V. (2002). Why young men drive dangerously: Implications for injury prevention. Current Directions in Psychological Science, 11:75-79.
- Reinherz, H.Z., Giaconia, R.M., Hauf, A.M., Wasserman, M.S. & Paradis, A.D. (2000). General and specific childhood risk factors for depression and drug disorders by early adulthood. Journal of the American Academy of Child and Adolescent Psychiatry, 39:223-231.
- Sandfort, T.G.M., Orr, M., Hirsch, J.S. & Santelli, J. (2008). Long-term correlates of timing of sexual debut: Results from a national US study. American Journal of Public Health, 98:155-161.
- Simons-Morton, B. & Chen, R.S. (2006). Over time relationships between early adolescent and peer substance use. Addictive Behaviors, 31:1211-1223.
- Squeglia, L.M., Jacobus, J. & Tapert, S.F. (2009). The influence of substance use on adolescent brain development. Clinical EEG and Neuroscience, 40:31-38.
- Suhrcke, M. & de Paz Nieves, C. (2011). The impact of health and health behaviours on educational outcomes in high-income countries: a review of the evidence. Copenhagen, WHO Regional Office for Europe.
- Thomas, R. (2002). School-based programmes for preventing smoking. Cochrane Database of Systematic Reviews, 4, CD001293.
- Weinstock, H., Berman, S. & Cates, W. (2004). Sexually transmitted diseases among American youth: Incidence and prevalence estimates 2000. Perspectives on Sexual and Reproductive Health, 36:6–10.
Page details
- Date modified: