
ARCHIVED - At a Glance - HIV and AIDS in Canada: Surveillance Report to December 31st, 2012
HIV/AIDS Surveillance in Canada
HIV and AIDS in Canada: Surveillance Report to December 31, 2012 presents an overview of the HIV/AIDS situation in Canada based on case reports of HIV and AIDS submitted by all provinces and territories (P/T). This report is published on an annual basis as part of the Public Health Agency of Canada's (PHAC) mandate to collect and analyze surveillance data at the national level. The report assesses the epidemiology of HIV and AIDS in Canada by identifying trends by sex, age group, race/ethnicity, exposure category and geographic location.
Technical note
Surveillance data are critical for understanding the ways in which HIV and AIDS affect a given population; however, they tend to understate the magnitude of the HIV epidemic. Surveillance data do not represent the total number of people infected with HIV (prevalence) or the number of people newly infected each year (incidence); surveillance data can only tell us about people who have been tested and diagnosed with HIV or AIDS. Furthermore, because HIV is a chronic infection with a long latency period, many individuals who are newly infected in a given year may not receive a diagnosis until much later. As well, surveillance data are subject to delays in reporting, to underreporting and to changing patterns in HIV testing behaviours.
One of the ways in which to improve understanding of the incidence and prevalence of HIV infection is through estimation. Estimates allow for an improved analysis of the epidemic in Canada and guide the work undertaken by PHAC and other federal departments under the Federal Initiative to Address HIV/AIDS in Canada. In 2012, PHAC published estimates of incidence and prevalence to the end of 2011Footnote 1 , in which it was estimated that there were approximately 71,300 (range: 58,600 to 84,000) people living with HIV (including AIDS) in Canada in 2011, 25% of whom were unaware of their infection (because of a lack of testing and/or diagnosis). The estimated number of new HIV infections in 2011 was 3,175 (range: 2,250 to 4,100), which was similar to the estimate for 2008.
Inclusion of new exposure category and race/ethnicity data from Ontario
Of the HIV case reports submitted to PHAC, the majority are reported from a few provinces; Ontario, Quebec, British Columbia and Alberta together have contributed 93% of the total HIV cases reported to PHAC since 1985; Ontario and Quebec alone account for 66% of cases. The completeness of epidemiologic information collected and submitted to PHAC varies by jurisdiction, however, and exposure category information is incomplete in many case reports. Most significantly, Quebec does not submit exposure category or race/ethnicity information to PHAC. This has implications for the representativeness of data at the national level, particularly with regards to identification and interpretation of trends. Provincial-level surveillance programs in Ontario and other provinces (including QuebecFootnote 2 ) publish reports that include information on exposure category and race/ethnicity.
In 2013, in partnership with Public Health OntarioFootnote 3 , PHAC included data collected through the Laboratory Enhancement Program (LEP) into the national HIV surveillance dataset; for the first time, LEP data from Ontario are incorporated into all tables in this report. The LEP is an enhanced surveillance system collecting supplemental data on risk factors and HIV testing history for HIV-positive reports. While the number of case reports did not change, the completeness and proportions changed with this new information on exposure category and race/ethnicity. In terms of exposure category, the inclusion of the LEP data increased the overall proportion of cases that could be classified by exposure category. For example, for 2012, the proportion of cases with known exposure category increased from 52.4% to 64.3% after the addition of the LEP data. Similarly, the proportion of cases with known race/ethnicity increased from 34.8% to 62.2%.
This surveillance report includes data provided by provincial/territorial surveillance programs to PHAC as of June 2013. As more information is received by provincial/territorial HIV surveillance programs on diagnosed cases, there may be differences between the data published in this report and the data in provincial reports published using finalized data. Where such differences are noted, we recommend that the provincial/territorial report be used as the data source. For more information on provincial trends, please refer to provincial reports (see Appendix 5).
HIV Surveillance
Number of cases
Since HIV reporting began in Canada in 1985, a cumulative total of 76,275 positive HIV test reports have been reported to PHAC. In 2012 alone, 2,062 HIV cases were reported up to December 31st, which represents a 7.8% decrease from the 2011 reports (2,237 cases) and is the lowest number of annual HIV cases since reporting began in 1985.
Figure 1 illustrates the trend in annual HIV case reports since 1996, highlighting a steady decrease in the number of reported cases up until the year 2000. During the period 2002 through 2008, the annual number of HIV case reports fluctuated between 2,440 and 2,619, and since 2008 there has been a steady decrease.
Figure 1. Number of positive HIV test reports by year of diagnosis – Canada: 1996-2012

Text Equivalent - Figure 1
| Year of diagnosis | 1996 | 1997 | 1998 | 1999 | 2000 | 2001 | 2002 | 2003 | 2004 | 2005 | 2006 | 2007 | 2008 | 2009 | 2010 | 2011 | 2012 |
|---|---|---|---|---|---|---|---|---|---|---|---|---|---|---|---|---|---|
| Number | 2729 | 2460 | 2290 | 2184 | 2092 | 2216 | 2460 | 2461 | 2520 | 2479 | 2536 | 2440 | 2619 | 2395 | 2328 | 2237 | 2062 |
This graph shows the number of positive HIV test reports in Canada by year of diagnosis for the period 1996 to 2012, which were as follows: 2729 cases in 1996; 2460 cases in 1997; 2290 cases in 1998; 2184 cases in 1999; 2092 cases in 2000; 2216 cases in 2001; 2460 cases in 2002; 2461 cases in 2003; 2520 cases in 2004; 2479 cases in 2005; 2536 cases in 2006; 2440 cases in 2007; 2619 cases in 2008; 2395 cases in 2009; 2328 cases in 2010; 2237 cases in 2011; and 2062 cases in 2012.
Geographic distribution
In 2012, as in previous years, Ontario accounted for the highest number of cases (843) followed by Quebec (450), Alberta (239), British Columbia (238) and Saskatchewan (184). Both Ontario and British Columbia noted a decrease in their annual number of cases from 2011 to 2012 – a 10.8% decrease in Ontario and a 17.4% decrease in British Columbia.
The rate per population highlights unique aspects of the HIV epidemic. The national rate for positive HIV test reports (all ages) in Canada for 2012 was 5.9 per 100,000 population; however, provincial and territorial rates reveal notable variation across the country. There has been a significant increase in the rate of positive HIV test reports (all ages) in Saskatchewan in recent years, reaching a high of 19.4 per 100,000 in 2009. The rate in Saskatchewan decreased to 16.6 in 2010 and was 17.0 in 2012, a rate nearly three times the national 2012 rate (5.9). The next highest provincial rates in 2012 were reported in Alberta and Ontario (both at 6.2 per 100,000 population). Figure 2 illustrates these regional differences. See also Table 6D.
Figure 2. Rate (per 100,000 population) of positive HIV test reports (all ages) by province/territory – Canada: 2012

Text Equivalent - Figure 2
| Province/territory | 2012 |
|---|---|
| British Columbia | 5.1 |
| Yukon | 2.8 |
| Alberta | 6.2 |
| Northwest Territories | 2.3 |
| Nunavut | 0.0 |
| Saskatchewan | 17.0 |
| Manitoba | 5.8 |
| Ontario | 6.2 |
| Quebec | 5.6 |
| New Brunswick | 0.5 |
| PEI & NS | 1.7 |
| Nfld and Labrador | 1.8 |
| Total | 5.9 |
This graphic is a map of Canada showing the all age rate (per 100,000 population) of positive HIV test reports, by province/territory, for the year 2012. The rates were: 5.1 per 100,000 population in British Columbia; 2.8 per 100,000 population in Yukon; 6.2 per 100,000 population in Alberta; 2.3 per 100,000 population in Northwest Territories; 0.0 per 100,000 population in Nunavut; 17.0 per 100,000 population in Saskatchewan; 5.8 per 100,000 population in Manitoba; 6.2 per 100,000 population in Ontario; 5.6 per 100,000 population in Quebec; 0.5 per 100,000 population in New Brunswick; 1.7 per 100,000 population for Prince Edward Island and Nova Scotia (combined rate); and 1.8 per 100,000 population in Newfoundland and Labrador.
Age and sex distribution
In 2012, 23.1% of all cases were females. Over the past decade, the proportion of female cases has remained generally stable at approximately one-quarter, with only slight fluctuations since 2001 and a peak of 27.8% in 2006. It is important to note that, overall, the age distribution of positive HIV case reports for females varies from that for males, the diagnosis generally being made at a younger age in females. From 1985 to 2012, the proportion of case reports attributed to the three youngest age groups was higher among female than male cases: 1.9% of female cases versus 0.6% of male cases were within the 0 to 14 years age group; 3.9% of females versus 1.1% of males were within the 15 to 19 years age group; and 31.3% of females versus 23.7% of males were within the 20 to 29 years age group. In contrast, among males there was a higher proportion of case reports attributed to the three oldest age groups: 39.0% of male cases versus 36.8% of female cases were within the 30 to 39 years age group; 24.3% of males versus 17.7% of females were within the 40 to 49 years age group; and 11.3% of males versus 8.5% of females were within the 50 years and older age group (See Figure 3).
Figure 3. Age group distribution of positive HIV test reports by sex – Canada: 1985-2012

Text Equivalent - Figure 3
| Age | Males | Females |
|---|---|---|
| < 15 years | 340 | 249 |
| 15 to 19 years | 649 | 504 |
| 20 to 29 years | 13,636 | 4,086 |
| 30 to 39 years | 22,456 | 4,805 |
| 40 to 49 years | 13,976 | 2,310 |
| ≥ 50 years | 6,477 | 1,105 |
| Total | 57,534 | 13,059 |
| Age | Males | Females |
|---|---|---|
| < 15 years | 0.6% | 1.9% |
| 15 to 19 years | 1.1% | 3.9% |
| 20 to 29 years | 23.7% | 31.3% |
| 30 to 39 years | 39.0% | 36.8% |
| 40 to 49 years | 24.3% | 17.7% |
| ≥ 50 years | 11.3% | 8.5% |
| Total | 100.0% | 100.0% |
This graph shows the age group distribution of positive HIV test reports by biological sex, for all cases diagnosed for the period 1985 to 2012.
For males, 0.6% of positive HIV test reports were individuals younger than 15 years old; 1.1% were in the age group 15 to 19 years; 23.7% were in the age group 20 to 29 years; 39.0% were in the age group 30 to 39 years; 24.3% were in the age group 40 to 49 years; and 11.3% were 50 years old or older.
For females, 1.9% of positive HIV test reports were for individuals younger than 15 years old; 3.9% were in the age group 15 to 19 years; 31.3% were in the age group 20 to 29 years; 36.8% were in the age group 30 to 39 years; 17.7% were in the age group 40 to 49 years; and 8.5% were 50 years old or older.
Exposure category distributionFootnote 4
Trends in exposure category have shifted since HIV reporting began in 1985. In the early stages of the epidemic, over 80% of all cases with known exposure category were attributed to the men who have sex with men (MSM) exposure category. Although this exposure category is still the predominant one in Canada, the proportion has decreased significantly over the years. In 2012, 50.3% of all adult (≥15 years) positive HIV test reports with known exposure category were attributed to the MSM exposure category; in adult males alone, the MSM exposure category accounted for 65.1% of positive HIV test reports.
The second most reported exposure category among adults in 2012 was heterosexual contact, at 32.6% of case reports; 13.2% were attributed to heterosexual contact among people born in a country where HIV is endemic (Het-Endemic), 9.9% were attributed to heterosexual contact with a person at risk (Het-Risk), and 9.6% were attributed to having heterosexual contact with someone with no identified risk (NIR-Het). These proportions varied by sex, heterosexual contact being the most reported exposure category among adult females at 73.2% versus 20.7% among adult males. The Het-Endemic exposure sub-category showed the biggest difference between the sexes, accounting for 51.8% of heterosexual contact cases among females and 28.6% among males.
The third most frequently reported exposure category among adults in 2012 was injection drug use (IDU), accounting for 14.0% of positive HIV test reports. Overall, a higher proportion of adult females than adult males acquired HIV through IDU exposure (24.5% versus 10.9%). See Figures 4 and 5 for complete exposure category breakdowns by sex.
Figure 4. Proportion of positive HIV test reports among adult males (≥15 years) by exposure category – Canada: 2012

Text Equivalent - Figure 4
| Males | Percentage |
|---|---|
| MSM | 63.6% |
| MSM/IDU | 1.8% |
| IDU | 11.9% |
| Blood/blood products | 0.1% |
| Het-Endemic | 3.3%% |
| Het-Risk | 6.4% |
| NIR-Het | 10.3% |
| Other | 2.6% |
| Total | 100% |
This pie chart shows the proportion of positive HIV test reports in 2012 among adult males (≥15 years) by exposure category.
63.6% of positive HIV test reports were attributed to the “men who have sex with men” (MSM) exposure category; 11.9% were attributed to injection drug use (IDU) exposure; 1.8% were attributed to exposure amongst people who reported male-to-male sex and use of injection drugs (the MSM/IDU exposure category); 3.3% were attributed to heterosexual contact among people born in a country where HIV is endemic (Het-endemic); 6.4% were attributed to heterosexual contact with a person at risk (Het-risk); 10.3% were attributed to having heterosexual contact with someone with no identified risk (NIR-Het); 0.1% were attributed to exposure via infected blood or blood products; and 2.6% is attributed other exposure categories.
Figure 5. Proportion of positive HIV test reports among adult females (≥15 years) by exposure category – Canada: 2012

Text Equivalent - Figure 5
| Females | Percentage |
|---|---|
| IDU | 29.8% |
| Blood/blood products | 0.9% |
| Het-Endemic | 18.1% |
| Het-Risk | 28.8% |
| NIR-Het | 18.6% |
| Other | 3.7% |
| Total | 100% |
This pie chart shows the proportion of positive HIV test reports in 2012 among adult females (≥15 years) by exposure category.
29.8% were attributed to injection drug use (IDU) exposure; 18.1% were attributed to heterosexual contact among people born in a country where HIV is endemic (Het-endemic); 28.8% were attributed to heterosexual contact with a person at risk (Het-risk); 18.6% were attributed to having heterosexual contact with someone with no identified risk (NIR-Het); 0.9% were attributed to exposure via infected blood or blood products; and 3.7% were attributed to other exposures.
Some variations were also observed in exposure category breakdowns across the provinces. Specifically, MSM was the most frequently reported exposure category in 2012 in Ontario, British Columbia and the Atlantic provinces. By contrast, IDU was the most frequently reported exposure category in Saskatchewan and heterosexual contact the most frequently reported category in Alberta and Manitoba.
Race/ethnicity distribution
HIV reporting in Canada has included a race/ethnicity component since 1998Footnote 5 . The LEP program in Ontario began collecting race/ethnicity data in 2009. In 2012, nearly two-thirds (62.2%) of positive HIV test reports included race/ethnicity information. While this is an improvement over previous years' completion rates, the national trends presented herein must still be interpreted with caution given the large proportion of cases that are not included in the race/ethnicity analysis. Of the HIV case reports with race/ethnicity information, 52.7% were attributed to the White category, and 23.3% to the Aboriginal categoryFootnote 6 . This was followed by the BlackFootnote 7 category (at 13.1%) and Asian (4.3%), Latin American (3.1%) and South Asian/West Asian/Arab (2.5%) categories. An additional 1.0% were identified as Other.
AIDS Surveillance
Number of cases
Since AIDS reporting began in 1979, there has been a cumulative total of 22,702 AIDS cases reported to PHAC through December 31, 2012. The annual number of reported AIDS cases in Canada has decreased steadily since 1993, largely as a result of the introduction of highly active antiretroviral therapy (HAART) in 1996. In more recent years, there has also been a decrease in reporting due to certain provinces having ceased AIDS reporting for various reasons.
In 2012Footnote 8 , 172 AIDS cases were reported to PHAC, representing an 18.1% decrease from 2011 and a 90.6% decrease since 1993, when 1,833 AIDS cases were reported (the highest number ever in Canada in a single year). See Figure 6.
Figure 6. Number of reported AIDS cases by year of diagnosis – Canada: 1979-2012
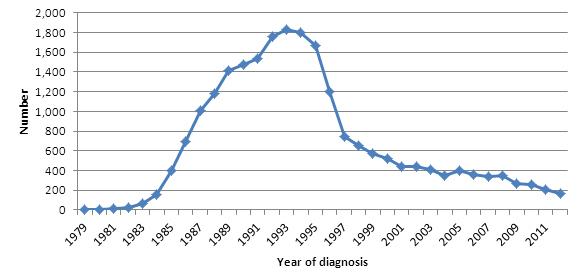
Text Equivalent - Figure 6
| Year of diagnosis | 1979 | 1980 | 1981 | 1982 | 1983 | 1984 | 1985 | 1986 | 1987 | 1988 | 1989 | 1990 | 1991 | 1992 | 1993 | 1994 | 1995 | 1996 | 1997 | 1998 | 1999 | 2000 | 2001 | 2002 | 2003 | 2004 | 2005 | 2006 | 2007 | 2008 | 2009 | 2010 | 2011 | 2012 |
|---|---|---|---|---|---|---|---|---|---|---|---|---|---|---|---|---|---|---|---|---|---|---|---|---|---|---|---|---|---|---|---|---|---|---|
| Number of AIDS Cases | 2 | 3 | 10 | 26 | 64 | 162 | 403 | 690 | 1014 | 1179 | 1411 | 1473 | 1533 | 1759 | 1833 | 1796 | 1665 | 1201 | 743 | 652 | 568 | 523 | 436 | 436 | 408 | 354 | 400 | 355 | 344 | 349 | 270 | 258 | 210 | 172 |
This graph shows the number of reported AIDS cases in Canada by year of diagnosis for the period 1979 to 2012, which were as follows: 2 cases in 1979; 3 cases in 1980; 10 cases in 1981; 26 cases in 1982; 64 cases in 1983; 162 cases in 1984; 403 cases in 1985; 690 cases in 1986; 1014 cases in 1987; 1179 cases in 1988; 1411 cases in 1989; 1473 cases in 1990, 1533 cases in 1991; 1759 cases in 1992; 1833 cases in 1993; 1796 cases in 1994; 1665 cases in 1995; 1201 cases in 1996; 743 cases in 1997; 652 cases in 1998; 568 cases in 1999; 523 cases in 2000; 436 cases in 2001; 436 cases in 2002; 408 cases in 2003; 354 cases in 2004; 400 cases in 2005; 355 cases in 2006; 344 cases in 2007; 349 cases in 2008; 270 cases in 2009; 258 cases in 2010; 210 cases in 2011; 172 cases in 2012.
Geographic distribution
In 2012, the largest proportion of AIDS cases were reported in Ontario (33.7%), followed by British Columbia (24.4%), Saskatchewan (19.2%) and Alberta (16.9%).
Age and sex distribution
In 2012, the majority of AIDS cases were among those aged 40 to 49 years (34.9%), followed by 30 to 39 years (25.6%), and 50 years and over (18.0%).
In 2012, there was one reported pediatric AIDS case. Adult (≥15 years) AIDS diagnoses occurred predominantly among males: 137 cases (83.0% of all reported cases) compared with 28 female cases (17.0%). As with HIV trends, the age distribution of female AIDS cases varied significantly from that of male cases. Females had a higher proportion of AIDS case reports in the younger age groups, i.e. those aged 20 to 29 years (females 14.3% versus males 6.6%) and 30 to 39 years (females 32.1% versus males 24.8%). By contrast, males had a higher proportion of AIDS case reports in the oldest age groups, those in the 40 to 49 year age category accounting for the highest proportion (33.4% of male cases versus 32.1% of female cases), followed by those aged 50 years and over (males 32.8 % versus females 17.9%). See Figure 7.
Figure 7. Proportion of reported AIDS cases by sex and age group – Canada: 2012

Text Equivalent - Figure 7
| Age Group | 0-19 | 20-29 | 30-39 | 40-49 | ≥ 50 | Total |
|---|---|---|---|---|---|---|
| Males | 2.2% | 6.5% | 24.6% | 34.1% | 32.6% | 100.0% |
| Females | 3.6% | 14.3% | 32.1% | 32.1% | 17.9% | 100.0% |
This graph shows the age group distribution of reported AIDS cases by biological sex, for cases reported in 2012.
For males, 2.2% of reported AIDS cases were in the age group 0 to 19 years; 6.5% were in the age group 20 to 29 years; 24.6% were in the age group 30 to 39 years; 34.1% were in the age group 40 to 49 years; and 32.6% were 50 years old or older.
For females, 3.6% of reported AIDS cases were in the age group 0 to 19 years; 14.3% were in the age group 20 to 29 years; 32.1% were in the age group 30 to 39 years; 32.1% were in the age group 40 to 49 years; and 17.9% were 50 years old or older.
Exposure category
In 2012, 57.9% of all reported adult (≥15 years) AIDS cases included information on exposure category. The largest proportion of AIDS cases among adult males was attributed to the heterosexual contact exposure category (42.1%). This was followed by the MSM (31.6%) and the IDU (23.7%) exposure categories. In 2012, the majority of adult female AIDS cases were attributed to the IDU exposure category (56.5%), followed by the heterosexual contact exposure category (39.1%). See Figure 8.
Figure 8. Proportion of reported AIDS cases among adults (≥15 years) by sex and exposure category – Canada: 2012

Text Equivalent - Figure 8
| Exposure Category | Adult Males | Adult Females |
|---|---|---|
| MSM | 31.6% | 0.0% |
| MSM/IDU | 2.6% | 0.0% |
| IDU | 23.7% | 56.5% |
| Heterosexual Contact | 42.1% | 39.1% |
| Others | 0.0% | 4.3% |
| Total | 100.0% | 100.0% |
This graph shows the proportion of reported AIDS cases among males and females aged 15 years or older, in 2012, by sex and exposure category.
Among males, 31.6% of reported AIDS cases were attributed to the “men who have sex with men” (MSM) exposure category; 23.7% were attributed to injection drug use (IDU) exposure; 2.6% were attributed to exposure amongst people who reported male-to-male sex and use of injection drugs (the MSM/IDU exposure category); 42.1% were attributed heterosexual contact.
Among females, 56.5% of reported AIDS cases were attributed to injection drug use (IDU) exposure; 39.1% was attributed heterosexual contact; and 4.3% was attributed to other exposures.
Race/ethnicity
In 2012, 59.3% of all reported AIDS cases included information on race/ethnicity. Of these, 49.0% of AIDS cases identified themselves as White, 34.3% as Aboriginal and 8.8% as Black. See Figure 9.
Figure 9. Proportion of reported AIDS cases among adults (≥15 years) by race/ethnicity – Canada: 2007-2012
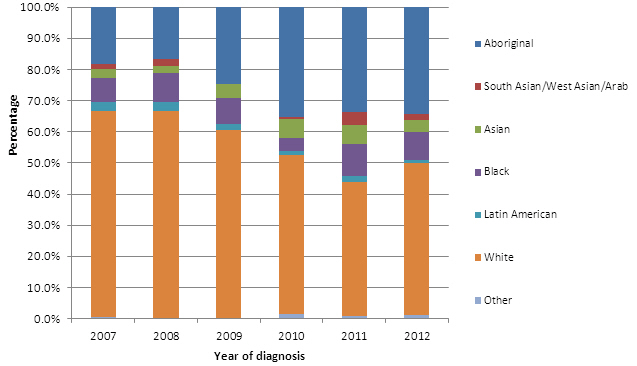
Text Equivalent - Figure 9
| Ethnicity | 2007 | 2008 | 2009 | 2010 | 2011 | 2012 |
|---|---|---|---|---|---|---|
| Aboriginal | 18.4% | 16.7% | 24.6% | 35.2% | 33.6% | 34.3% |
| South Asian/West Asian/Arab | 1.7% | 2.2% | 0.0% | 0.7% | 4.3% | 2.0% |
| Asian | 2.9% | 2.2% | 4.5% | 6.2% | 6.0% | 3.9% |
| Black | 7.5% | 9.4% | 8.2% | 4.1% | 10.3% | 8.8% |
| Latin American | 2.9% | 2.8% | 2.2% | 1.4% | 1.7% | 1.0% |
| White | 66.1% | 66.7% | 60.4% | 51.0% | 43.1% | 49.0% |
| Other | 0.6% | 0.0% | 0.0% | 1.4% | 0.9% | 1.0% |
This graph shows the proportion of annually reported AIDS cases among adults (=15 years old) by race/ethnicity categories, for the period 2007 to 2012.
In 2007, 66.1% of reported AIDS cases were categorized in the “White” category; 18.4% were categorized as Aboriginal; 7.5% as Black; 2.9% as Asian; 2.9% as Latin American; and 1.7% as South Asian, West Asian or Arab.
In 2008, 66.7% of reported AIDS cases were categorized in the “White” category; 16.7% were categorized as Aboriginal; 9.4% as Black; 2.8% as Latin American; 2.2% as Asian; and 2.2% as South Asian, West Asian or Arab.
In 2009, 60.4% of reported AIDS cases were categorized in the “White” category; 24.6% were categorized as Aboriginal; 8.2% as Black; 4.5% as Asian; 2.2% as Latin American.
In 2010, 51.0% of reported AIDS cases were categorized in the “White” category; 35.2% were categorized as Aboriginal; 6.2% as Asian; 4.1% as Black; 1.4% as Latin American; 1.4% as Other; and 0.7% South Asian, West Asian or Arab.
In 2011, 43.1% of reported AIDS cases were categorized in the “White” category; 33.6% were categorized as Aboriginal; 10.3% as Black; 6.0% as Asian; 4.3% as South Asian, West Asian or Arab; 1.7% as Latin American; and 0.9% as Other.
In 2012, 49.0% of reported AIDS cases were categorized in the “White” category; 34.3% were categorized as Aboriginal; 8.8% as Black; 3.9% as Asian; 2.0% as South Asian, West Asian or Arab; 1.0% as Latin American; and 1.0% as Other.
Immigration
On January 15, 2002, Citizenship and Immigration Canada (CIC) added routine HIV screening to the Immigration Medical Examination (IME)Footnote 9 . IME HIV testing undertaken in Canada is managed and reported in the same manner as all other positive HIV tests among Canadians. As well, since September 2004 CIC has been reporting positive HIV test reports for immigrants tested overseas to provincial/territorial health authorities.
Between January 15, 2002, and December 31, 2012, 5,777 applicants who underwent an IME tested positive for HIVFootnote 10 . In 2012 alone, 534 applicants who underwent an IME tested HIV positive. Of these, 231 were identified through HIV testing in Canada, and 303 were identified outside of Canada.
Of the 534 HIV-positive diagnoses in 2012, 312 (58.4%) were born in Africa and the Middle East, 139 (26.0%) in the Americas, 58 (10.9%) in Asia and Oceania, and 25 (4.7%) in Europe.
Canadian Perinatal HIV Surveillance Program
The Canadian Perinatal HIV Surveillance Program is administered by the Canadian Pediatric AIDS Research Group (CPARG) and provides data on perinatal HIV to PHAC for national reporting. The surveillance program collects data on all identified infants and children born to mothers who are known to be infected with HIV in Canada. The program includes infants identified as exposed to HIV during pregnancy, older infants and children not identified in the perinatal period, and those born outside Canada who are receiving care for HIV infection.
Between 1984 and 2012, there were 3,805 infants in Canada who were identified as being perinatally exposed to HIV. The number of HIV-exposed infants reported per birth year increased between 2005 and 2008 (from 191 to 241), and has fluctuated in recent years. In 2012, there were 225 reported cases of infants who were perinatally exposed to HIV, down from 234 in 2011.
Although the number of infants perinatally exposed to HIV has increased over time, the proportion of infants born in Canada and confirmed to be HIV infected has decreased gradually from greater than 25% before the advent of antiretroviral treatment during pregnancy (AZT monotherapy after 1994, HAART after 1996) to less than 2% in 2011. At the time this report was prepared, there were no confirmed HIV transmissions in the 225 perinatally exposed infants born in 2012. Correspondingly, the proportion of HIV-positive mothers receiving antiretroviral therapy has increased over time and was 94.2% in 2012Footnote 11 .
Between 1984 and 2012, 74.0% of HIV-exposed infants were born to mothers whose HIV status was attributed to the heterosexual contact exposure category, and 23.7% were attributed to IDU exposure.
On examination of the racial/ethnic distribution of perinatally HIV-exposed infants, it was found that the highest proportion were reported as Black and represented nearly half (49.0%) of all cases for the period 1984 to 2012. This was followed by 25.8% of cases reported as White and 16.7 % reported as Aboriginal. The remainder were reported as Asian (3.3%), Latin American (1.2%) and Other (1.7%).
Interpretation
The annual number of HIV cases reported to PHAC for the year 2012 was the lowest reported since HIV reporting began in 1985. At 5.9 per 100,000, the 2012 rate of positive HIV test reports is the lowest reported to date. PHAC will continue to monitor HIV case report data to see whether this decreasing trend continues.
Overall, when the different risk exposure categories for HIV are examined, the MSM category is still the leading reported exposure category in Canada, followed by heterosexual contact and IDU exposures. However, the pattern of risk exposure differed by province/territory as well as by race/ethnicity.
Positive HIV test report rates in Saskatchewan continued to exceed the national average in recent years, although the annual number of cases in Saskatchewan was lower in 2010, 2011 and 2012 than in 2009. The majority of HIV cases in Saskatchewan have been identified as Aboriginal, and IDU has been the most common exposure category, in contrast to declining numbers attributed to IDU at the national level. In response to this situation, Saskatchewan Health continues to implement its provincial HIV strategy to further investigate these case reports.
At the national level, distinct differences were observed between the sexes in terms of age at diagnosis of HIV and of AIDS, whereby diagnosis tended to be made at a younger age in females than males. In addition, the proportion of HIV cases among older Canadians (50 years and older) has been gradually increasing since reporting began in 1985, and males outnumber females in the older age groups, particularly in the 30 to 39 and the 40 to 49 year age groups.
Given the variations in the HIV and AIDS case reports across different P/T, as well as variations in demographic information (e.g. race/ethnicity, age and sex), the data presented in this surveillance report highlight the need for population-specific interventions.
To obtain a copy of the report, send your request to:
Centre for Communicable Diseases and Infection Control
Public Health Agency of Canada
Room 1375, 100 Eglantine Driveway, Health Canada Building
A.L. 0601A, Tunney's Pasture
Ottawa, ON K1A 0K9
E-Mail: ccdic-clmti@phac-aspc.gc.ca