
Chapter 2: Population-specific status report: HIV/AIDS and other sexually transmitted and blood borne infections among youth in Canada – Demographic profile
Chapter 2 – Demographic Profile
2.1 Introduction
This chapter presents a demographic profile of youth in Canada and examines data on their physical and mental health to provide context on issues related to HIV and other sexually transmitted and blood borne infections (STBBIs). It considers various health issues associated with young people's vulnerability to HIV and other STBBIs, including substance use, mental illness, mental health, sexual risk behaviours, abuse, physical health and chronic physical conditions.
Health and illness are not evenly distributed among youth in Canada. As with other health issues, social, cultural, economic and physical contexts create conditions for vulnerability to HIV and other STBBIs that are experienced differently across the youth population. For this reason, where data permit, this chapter will compare data by gender, age and race/ethnicity. As much as possible, the chapter relies on nationally representative data on youth aged 10-24 years, although data sources cited frequently report data in different age ranges. Where applicable, these differences are noted in the text.
2.2 Social demographics of youth in Canada
The proportion of youth in Canada aged 10 to 24 years has remained relatively stable since the mid-1990s. According to the 2011 National Household Survey, of the roughly 32.9 million people in Canada, 19% were youth aged 10-24 years, which is a slight decrease from 20.3% the decade prior. Between 1996 and 2011, the total number of youth in Canada aged 10 to 24 years increased 5.8%, from about 5.9 million to 6.24 million. The overall population of Canada increased 13.9% in the same time period.Footnote 1 The relative distribution of younger (10-14 years) and older youth (15-24 years) remained relatively stable between 1996 and 2001. Youth aged 10-14 years comprised 30.7% of the total youth population in 2011, compared to 34% the decade before (Figure 1).
Figure 1: Distribution of youth by age range by years in Canada in 1996, 2001, 2011

Source: Public Health Agency of Canada using data from 2011 National Household Survey and 2006 Census of the Population, Statistics Canada.Footnote 2
Text Equivalent - Figure 1
Figure 1 shows the relative number of youth in two age ranges, 10 to 14 and 15 to 24, in Canada by year. The graph contains 3 bars representing the years 1996, 2001, and 2011. The graph shows that in 1996 there were 1,993,440 youth in the 10 to 14 year age category, compared to 2,053,120 in 2001 and 1,915,685 in 2011. There were 3,857,170 youth in the 15 to 24 year age category in 1996, compared to 4,009,140 in 2001 and 4,324,065 in 2011.
2.2.1 Geographical distribution
Distribution of the youth population across Canada varies significantly (Figure 2). In 2011, the region of the country with the youngest population was found in the North (Yukon, the Northwest Territories and Nunavut) where about one-quarter of the population was under 15 years of age and only 5.8% of the population was aged 65 years or older. In part, this can be explained by the high fertility rate in the North, particularly among the Inuit population, coupled with lower life expectancy than in the southern provinces.Footnote 4 In 2011, Nunavut had the highest proportion of youth aged 10-24 years in Canada, accounting for 28.6% of that territory’s population. By comparison, the region of the country with the oldest population is found in the east where youth make up between 17% of the population of Newfoundland and Labrador and 19.3% of the population of PEI.
Figure 2: Geographical distribution of population counts and youth aged 10 to 24 years old in Canada in 2011

Source: Public Health Agency of Canada using data from 2011 National Household Survey, Statistics Canada.Footnote 3
Text Equivalent - Figure 2
Figure 2 shows a map of Canada with total population count and the population of youth aged 10 to 24 years for each province and territory in 2011. In the Yukon, the total population count for the territory was 33,320, among which 6,385 were youth aged 10 to 24 years, accounting for 19.2% of the territory's total population. In the Northwest Territories, the total population count was 40,795 among which 9,420 were youth aged 10 to 24 years accounting for 23.1% of the territory's total population. In Nunavut, the total population count was 31,700 among which 9,080 were youth aged 10 to 24 years accounting for 28.6% of the territory's total population. In British Columbia, the total population count for the province was 4,324,455 among which 788,860 were youth aged 10 to 24 years, accounting for 18.2% of the province's total population. In Alberta, the total population count was 3,567,975, among which 708,710 were youth aged 10 to 24 years, accounting for 19.9% of the province's total population. In Saskatchewan, the total population count was 1,008,760 among which 207,010 were youth aged 10 to 24 years, accounting for 20.5% of the province's total population. In Manitoba, the total population count was 1,174,345 among which 243,525 were youth aged 10 to 24 years, accounting for 20.7% of the province's total population. In Ontario, the total population count was 12,651,790 among which 2,466,680 were youth aged 10 to 24 years, accounting for 19.5% of the province's total population. In Quebec, the total population count was 7,732,520 among which 1,392,060 were youth aged 10 to 24 years, accounting for 18.0% of the province's total population. In New Brunswick, the total population count was 735,835 among which 129,470 were youth aged 10 to 24 years, accounting for 17.6% of the province's total population. In Nova Scotia, the total population count was 906,170 among which 165,690 were youth aged 10 to 24 years, accounting for 18.3% of the province's total population. In Prince Edward Island, the total population count was 137,375 among which 26,555 were youth aged 10 to 24 years, accounting for 19.3% of the province's total population. In Newfoundland, the total population count was 507,270 among which 86,330 were youth aged 10 to 24 years, accounting for 17.0% of the province's total population.
In 2006, the majority (80.1%) of youth aged 10-24 years lived in urban areas.Footnote i Among this age group, there was an increase in the proportion living in urban areas with increasing age (Table 1). Just over three-quarters of youth aged 10-14 (77.8%) and 15-19 years (78.3%) lived in urban areas in 2006, compared to more than 84% of youth aged 20-24. This trend is not surprising since youth in their late teens and early twenties often leave their homes in rural areas to pursue post-secondary education or employment in urban areas.Footnote 5
The distribution of rural and urban residence differs among sub-groups of youth. For example, according to the 2006 Census, far fewer Aboriginal youth aged 10 to 24 lived in urban areas (52.6%) than among the total youth population. Urbanization among Aboriginal youth increases with age, much as it does for the total youth population. In 2006, about half of Aboriginal youth aged 10-14 (49.9%) and 15-19 years (51.3%) lived in urban areas, compared to about 58% of Aboriginal youth aged 20-24 years (Table 1). Despite urbanization, the proportion of Aboriginal youth living on reserve remains relatively stable as youth progress into young adulthood. In 2006, just over one-quarter of Aboriginal youth aged 10-14 (28.8%); 15-19 years (27.6%) and 20-24 years (26%) reported living on reserve.
| Rural n (%) |
Urban n (%) |
TotalFootnote 1.2 n |
|
|---|---|---|---|
| Total Youth Population | |||
| 10-14 years | 423,320 (20.4) | 1,617,325 (77.8) | 2,078,130 |
| 15-19 years | 429, 805 (20.1) | 1,672,020 (78.3) | 2,135,920 |
| 20-24 years | 299, 150 (14.4) | 1,746,850 (84.3) | 2,071,895 |
| Total | 1,152,275 (18.3) | 5,036,195 (80.1) | 6,285,945 |
| Aboriginal Youth<Footnote 1.1 | |||
| 10-14 years | 26,560 (21.2) | 62,500 (49.9) | 125,230 |
| 15-19 years | 24,820 (21.0) | 60,640 (51.3) | 118,105 |
| 20-24 years | 15,350 (16.4) | 54,150 (57.7) | 93,900 |
| Total | 66,730 | 177,290 | 337,235 |
Source: The Public Health Agency of Canada using data from Statistics Canada.Footnote 6
2.2.2 Sex and gender
In 2006, there were slightly more young men than young women in the Canadian population. The proportions of young men aged 10-14 (51.2%) and 15-24 (50.8%) were slightly higher than those of young women in these age groups (48.8% and 49.2% respectively).Footnote 7 Among the general population in Canada, this trend is reversed; in 2006, there were slightly more women (51.1%) than men (49%).Footnote 8 While more boys than girls are born in Canada, men generally have a higher mortality rate than women. As a result, males outnumber females among youth in Canada, and females outnumber males among older populations.Footnote 9
While the Canadian Census only acknowledges two genders (male and female), it is increasingly understood that some individuals experience a gender identity that does not match their biological sex at birth and others that experience a gender identity that is not "male" or "female". The term "transgender" refers to individuals whose gender identity does not match their biological sex at birth. The term "gender-variant" is used to describe other individuals whose gender expression and gender identity do not fit either the traditional male or female categories, either through their dress, behaviour (gender roles), biology (having reproductive organs or genitals that are neither totally male nor totally female), or their feelings and experiences of masculinity and femininity. There is no source of nationally representative data to indicate the size of the population in Canada that is transgender or gender variant, but pan-Canadian or regional studies have attempted to fill this data gap. For example, a study of more than 3,700 high school students across Canada found that about 3% of the sample identified as transgender. A smaller survey of youth living in Toronto, Ontario found that 1% of youth surveyed identified as transgender. While these studies are not representative of the entire population of Canadian youth, they help us begin to understand what proportion does not identify as either male or female.
2.2.3 Marital status
According to the 2006 Census, the majority of youth aged 15-19 (99.3%) and 20-24 years (93.6%) were single and had never been legally married. Among this group, about 13% of youth between the ages of 20 and 24 reported being in a common-law relationship.
2.2.4 Sexual orientation
There is little national data to describe the sexual orientations of youth in Canada. Gathering such data is difficult for a variety of reasons. One major difficulty is that national surveys rely on self-report data. Survey respondents may not feel comfortable disclosing their sexual orientation in a self-report survey for fear of stigma and discrimination, or fear of being 'outed' to their families or local authorities.Footnote 10 Youth in particular may be reluctant to disclose their sexual orientation or gender identity for fear of bullying from their peers in school.Footnote 11
Analyses of data from a nationally representative sample in the Canadian Community Health Survey found that a large majority (96.2%) of youth aged 18-24 years identify as heterosexual, with the remainder identifying as homosexual (1.2%) or bisexual (2.6%). These proportions do not differ significantly from those among adults in the 25-59 age group.Footnote 12
Data from smaller national or regional studies depict similar profiles. A 2008 study in British Columbia reports that, among a sample of 29,000 youth in grades 7 through 12, 86% identified as heterosexual, 7% as mostly heterosexual, 2% as bisexual, and less than 1% as either mostly homosexual or homosexual (gay or lesbian).Footnote 13 In a separate study of more than 3,700 high school students across Canada, 14% of students identified as non-heterosexual.Footnote 14
2.2.5 Ethnic diversity, immigration and linguistic diversity
Canada is one of the world's most ethnically diverse countries. Its ethno-cultural composition has been shaped over time by immigration, as well as by Aboriginal Peoples. The term 'Aboriginal Peoples' refers to the original inhabitants of North America and their descendants. In 2011, more than 1.4 million people self-identified as Aboriginal, comprising 4.3% of the general Canadian population.Footnote 15 The proportions of youth aged 10-14 and 15-24 who self-identified as Aboriginal were higher than the general population (6.8% and 5.9% respectively). Among Aboriginal youth aged 10-24 years, the majority (62.7%) identified as First Nations; just under one-third (30.4%) identified as Métis; and 4.7% identified as Inuk (Inuit).Footnote 16 The proportion of the population that identifies as Aboriginal is growing rapidly, particularly among youth. Between 2001 and 2011, the proportion of youth aged 10-24 that identified as Aboriginal increased by 34.8%, compared to 30.7% in the general population.Footnote 17
While Aboriginal Peoples were the first inhabitants of Canada, immigration has greatly increased the ethnic diversity of Canada with each wave of immigration adding to the ethnic diversity of the population. In fact, over 200 ethnic origins were reported among the population of Canada in the 2011 National Household Survey. In contrast, the 1901 Census enumerated 25 ethnic origins, the majority of which were Aboriginal, British or French origins.Footnote 18
European origins (e.g. English, French, Scottish, Irish, German, Italian) were still among the most frequently cited ethnic origins in the 2011 National Household Survey, with over 20.2 million people reporting European origins. The remaining origins reflect changing patterns among immigrants from non-European countries.Footnote 19 According to the 2011 National Household Survey, 19.1% of Canada's general population was made up of visible minorities, compared to 16.2% in the 2006 Census. The visible minority population of Canada was younger in 2011 than the general population. According to the 2011 National Household Survey, the median age of visible minority populations was 33.4 compared with 40.1 among the population as a whole.Footnote 20 Among visible minority youth aged 15-24 years, South Asian (23.2%), Chinese (21.5%) and Black (16.4%) ethnic groups were cited most frequently.Footnote 21
In 2011, 20.6% of the population was born outside of Canada, the highest proportion among the G8 countries.Footnote 22 The majority of those born outside of Canada were immigrants to Canada.Footnote ii Youth between the ages of 15 and 24 comprised 8.4% of the total immigrant population.Footnote 23 Among immigrant youth in Canada, about 30% were 'newcomer' youth, or those that had immigrated within the last five years. Newcomer youth represented 14.5% of the total 1.16 million newcomers who came to Canada between 2006 and 2011.Footnote 24 The largest proportion of immigrant youth living in Canada in 2011 were born in Asia and the Middle East (58.0%), followed by Europe (16.3%), Africa (9.5%) and South America (4.8) (Figure 3).Footnote 25
Figure 3: Distribution of place of birth for immigrant youth (aged 15-24 years) in Canada in 2011

Source: Public Health Agency of Canada using data from 2011 National Household Survey, Statistics Canada.Footnote 26
Text Equivalent - Figure 3
Figure 3 is a circle with different sized segments shaded in different patterns to correspond to the relative proportions of immigrant youth living in Canada in 2011 aged 15 to 24 years, who were born in various regions of the world. There is one segment of the circle for each of 8 regions of the world. The figure shows that 58.0% of immigrant youth living in Canada were born in Asia and the Middle East, compared to 16.3% in Europe, 9.5% in Africa, 4.8% in South America, 4.3% in Caribbean and Bermuda, 3.6% in North America, 3% in Central America and 0.5% in Oceania.
Canada’s ethnic diversity is matched by its linguistic diversity. More than 200 languages were reported as either a language spoken in the home or a mother tongueFootnote iii in the 2011 Census of Population. In 2011, more than three-quarters (78.3%) of the population reported either of the two official languages as a single mother tongue (57% English, 21.3% French). The proportion of youth who reported a mother tongue of English only was significantly higher than the total population. About two-thirds of youth aged 10-14 (64.3%) and 15-24 years (62.2%) reported a mother tongue of English. The proportion of youth who reported a mother of tongue of French only was lower than the total population. Less than one in five youth in 2011 aged 10-14 years (18.8%) and aged 15 to 24 years (19.6%) reported a mother tongue of French.
Among the general Canadian population, only 6.2% report a single mother tongue other than English or French. However, among youth aged 10-24 years, the percentage is more than double that of the general population. In 2011, 14.3% of youth aged 10-14 and 16% of those 15-24 years old reported a mother tongue other than English or French.
In the 2011 Census, more than 60 Aboriginal languages, grouped into 12 language families, were enumerated. In total, less than 1% of the Canadian population reported an Aboriginal mother tongue. The proportion of youth aged 10-24 years who reported an Aboriginal mother tongue was similar to that of the general population at less than 1%, despite the fact that about 5% of the youth population identify as Aboriginal. Among those who reported an Aboriginal mother tongue in 2011, Algonquin languages were the most frequently reported family of Aboriginal languages.
2.2.6 Residence
In the Canadian Community Health Survey in 2011, among a nationally representative sample, nearly three-quarters (71.5%) of youth aged 12-19 years were living with their parents. Of these, more than three-quarters (78.8%) were living with two parents, while 21.4% were living in single-parent households. The remaining youth were either living alone (12.5%), with a spouse or partner (5.5%) or as a single parent (0.7%).Footnote 27 According to the 2009-2010 Health Behaviour in School-aged Children (HBSC) study, the majority of young people in Canada reported having a happy home life, although this is true for a greater proportion of boys than girls. Reports of a happy home life decreased with increasing age among both males and females. Nevertheless, even among the oldest age group (Grade 10), 75% of boys and 66% of girls reported having a happy home life.Footnote 28
Figure 4: Canadian youth (aged 12-19 years) living arrangements in 2011

Source: Public Health Agency of Canada using data from Statistics Canada Canadian Community Health Survey, 2011.
Text Equivalent - Figure 4
Figure 4 is a circle with different sized segments shaded in different colours to correspond to the relative proportions of youth in 2011 aged 12 to 19 years living in different arrangements. The circle is divided into four pieces in total. The figure shows that in 2011, 71.5% lived with one or more parents, compared to 12.5% who were living alone, 5.5% who lived with a spouse or partner and 0.7% who lived as a single parent.
While the number of youth living on the street in Canada is difficult to estimate because of the transient nature of street-involvement, some estimates suggest that there are roughly 150,000 homeless or street-involved youth in Canada, representing one-third of the country's homeless population.Footnote 29 Youth leave their homes and become street-involved for many reasons, but most leave homes or are thrown out of their homes due to family conflict, including abuse, homophobia and transphobia.Footnote 30
These experiences may explain why sexually diverse and gender-variant youth are overrepresented among the street-involved population.Footnote 31 A 2003 report on Winnipeg street-involved youth estimated that as much as one-third identified as sexually diverse or gender variant.Footnote 32 In a study of 500 street-involved youth in Vancouver, 13% of participants considered themselves sexually diverse.Footnote 33 Aboriginal youth are also over-represented in street-involved and homeless populations.Footnote 34 Data from the Enhanced Street Youth Surveillance Study suggest that between 24.0% and 35% of street-involved youth self-identify as Aboriginal.Footnote 35
2.3 Education, employment and income
2.3.1 Education
Various indicators of educational status and experiences are important to provide context for the vulnerability of youth in Canada to HIV and other STBBIs. These include: education levels of parents or guardians in the home; school achievement and school status of youth themselves; attachment to and experiences at school; drop-out rates; and participation in post-secondary education.
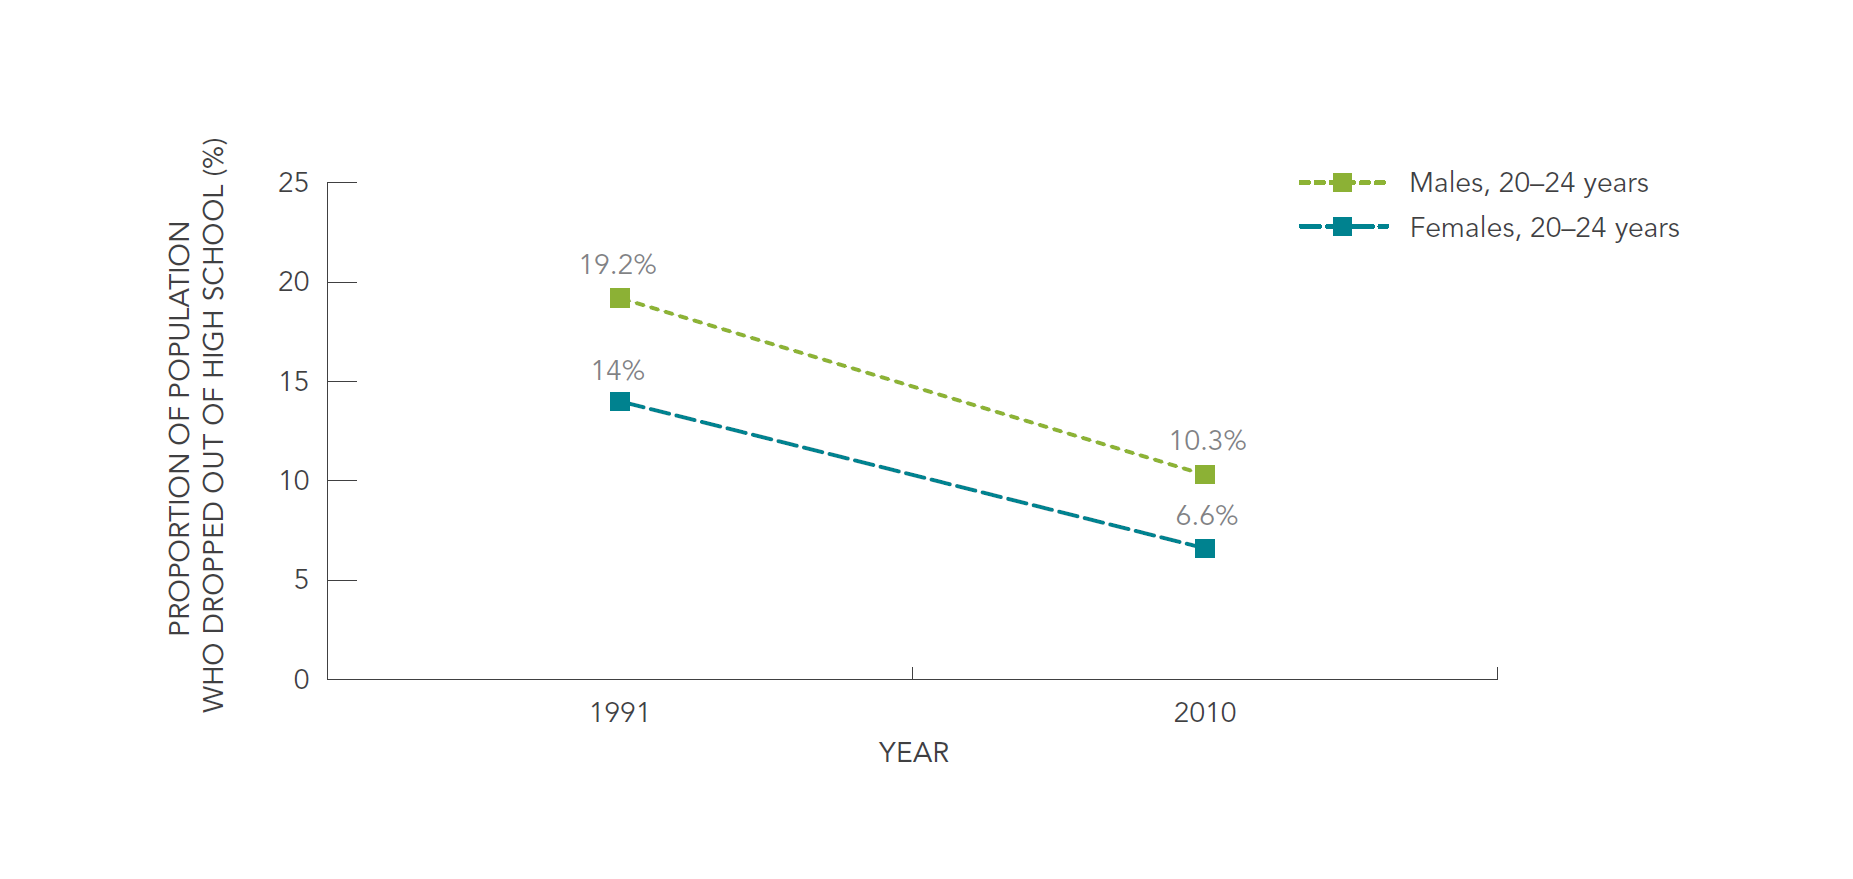
In 2006, over 86% of Canada's youth aged 20-24 had earned a high school diploma. A larger proportion of females (88.5%) than males (83.9%) reported having earned at least a high school diploma. High school drop-out rates among this age group have also declined over the past two decades.Footnote 36 In the 1990-1991 academic year, 16.6% of Canada's youth aged 20-24 years had not completed high school and were not currently enrolled in school. By the 2009-2010 academic year, this percentage had dropped to 8.5%.Footnote 37 High school drop-out rates have historically been higher among males than among females (Figure 5). In the 2009-2010 academic year, 10.3% of males had dropped out of high school, compared to 6.6% of females.Footnote 38
Figure 5: High school dropout rates among youth aged 20-24 years, by gender, in Canada

Source: Public Health Agency of Canada using data from Labour Force Survey, Statistics Canada.Footnote 39
Text Equivalent - Figure 5
Figure 5 is a line graph that shows the proportion of youth aged 20 to 24 years, by gender, who report having dropped out of high school. There are two lines in the graph, one for males and one for females. The graph shows the trend that high school drop-out rates among this age group have declined over the past two decades. The graph shows that in the 1990 to 1991 academic year, 19.2% of males had dropped out of high school, compared to 10.3% in the 2009 to 2010 academic year. Among females, 14% had dropped out of high school in the 1990 to 1991 academic year compared to 6.6% of females in the 2009 to 2010 academic year.
High school drop-out rates also differ between Aboriginal and non-Aboriginal, and immigrant and non-immigrant populations. Over the 2007-2008 and 2009-2010 academic years, about 23% of off-reserve First Nations, Métis, and Inuit populations aged 20-24 dropped out of high school, more than double the rate among the non-Aboriginal population over the same period (Figure 6).Footnote 40 High school drop-out rates are lowest among immigrant populations in Canada. In the 2009-2010 academic year, the high school drop-out rate was 6.2% among immigrant and newcomer youth aged 20-24, compared to 9.1% among the non-immigrant population (Figure 7).Footnote 41
Figure 6: Proportions of Aboriginal youth and non-Aboriginal youth in Canada aged 20-24 years who dropped out of high school, 2007 and 2010

Source: Public Health Agency of Canada using data from Labour Force Survey, Statistics Canada.Footnote 42
Text Equivalent - Figure 6
Figure 6 is a bar graph that shows the proportions of Aboriginal and non-Aboriginal youth aged 20 to 24 years who dropped out of high school between 2007 and 2010. The graph shows that over this period, 22.6% of off-reserve First Nations, Métis, and Inuit youth dropped out of high school, compared to 8.5% of non-Aboriginal youth over the same period.
Figure 7: Proportions of immigrant youth and Canadian-born youth in Canada aged 20-24 years who dropped out of high school, 2009-10

Source: Public Health Agency of Canada using data from Labour Force Survey, Statistics Canada.Footnote 43
Text Equivalent - Figure 7
Figure 7 is a bar graph that shows the proportions of immigrant and Canadian-born youth aged 20 to 24 years who dropped out of high school between 2009 and 2010. The graph shows that over this period, 6.2% of immigrant youth aged 20 to 24 had dropped out of high school, compared to 9.1% among the non-immigrant youth population.
Post-secondary education is becoming increasingly important for both personal growth opportunities and the competitiveness of Canada’s economy. Since 1997, there has been a significant increase in enrolment in post-secondary education in Canada, including registered apprenticeships, colleges and universities. During the 2005-2006 and 2007-2008 academic years, nearly 360,000 registered apprentices, more than 530,000 full- and part-time college students, and nearly 980,000 university students enrolled in undergraduate and graduate programs.
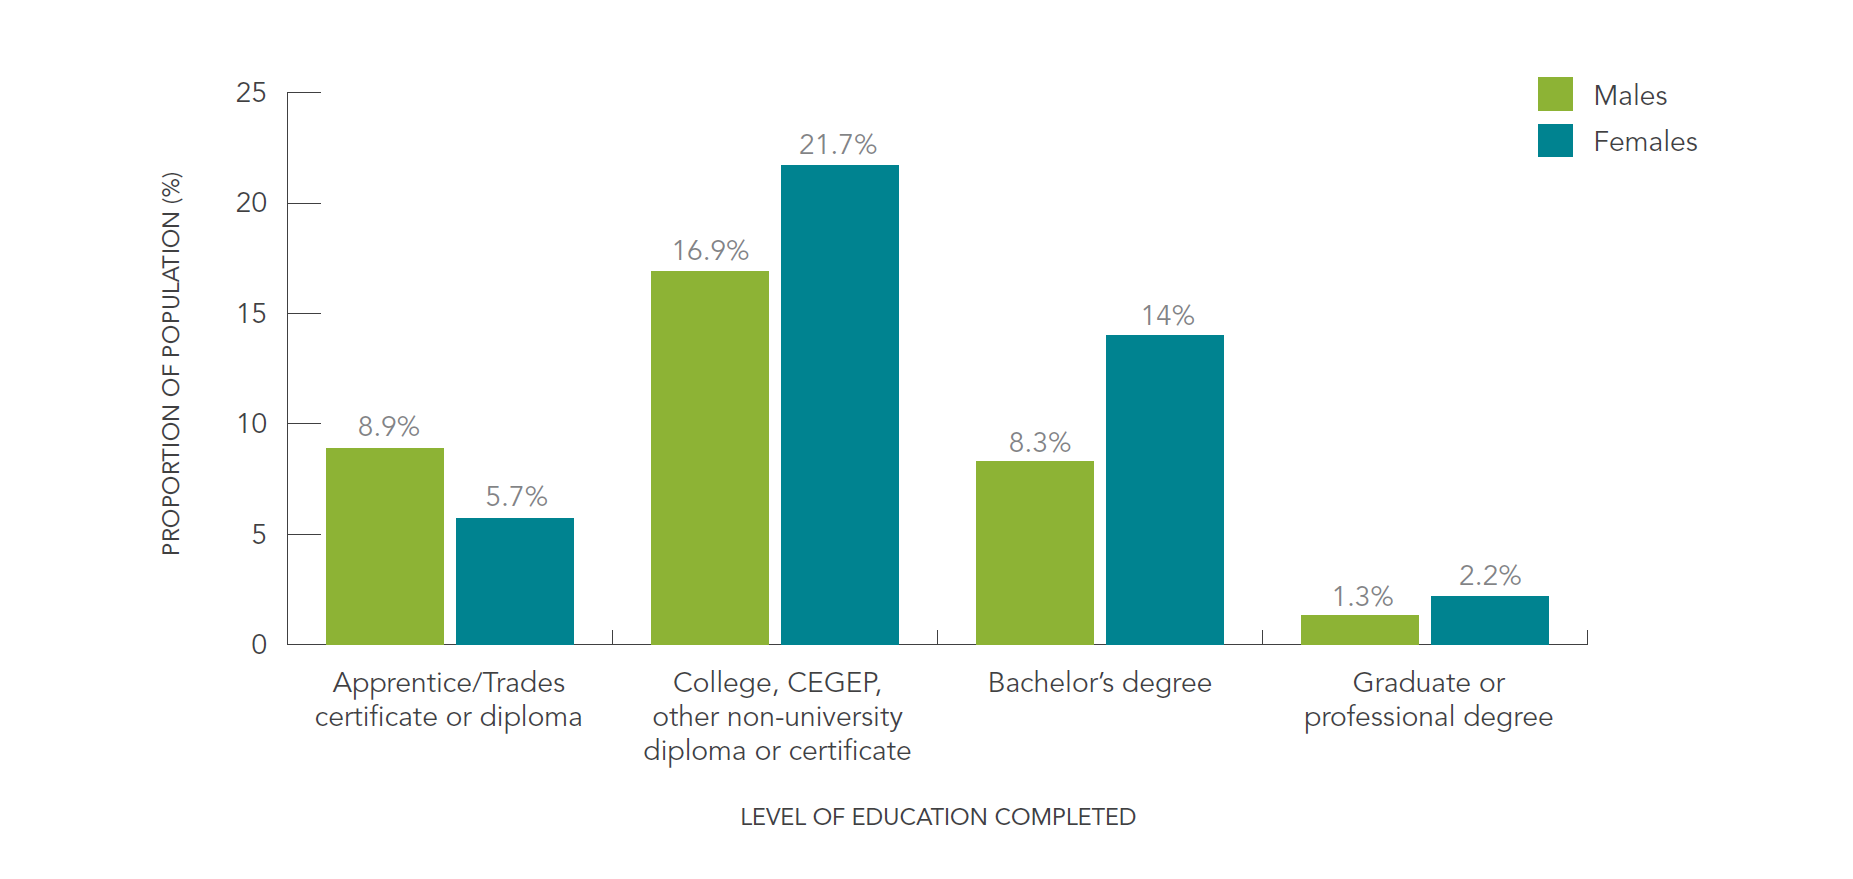
By 2006, 7.4% of youth aged 20-24 years had completed apprentice or trades certificates or diploma; 19.3% had completed college or CEGEP; 11.1% had completed a Bachelor’s degree; and 1.7% had completed a graduate or professional degree. Although more males had completed apprentice or trades programs (8.9%) than females (5.7%), females outnumbered males in all other education categories (Figure 8).
Figure 8. Proportions of males and females aged 20-24 years by highest level of education completed, 2006

Source: Public Health Agency of Canada using data from 2006 Census, Statistics Canada. Footnote 44
Text Equivalent - Figure 8
Figure 8 is a clustered bar graph that shows the proportion of youth aged 20 to 24 years who had completed various levels of education by 2006. The graph includes bars for each of males and females across four levels of education. The graph shows that by 2006, among males 8.9% reported apprentice or trades certificate or diploma as their highest level of education completed, compared to 5.7% of females. Among males, 16.9% reported college or CEGEP as their highest level of education completed, compared to 21.7% of females. Among males, 8.3% reported a bachelor’s degree as their highest level of education completed, compared to 14% of females. Among males, 1.3% reported a graduate or professional degree as their highest level of education completed, compared to 2.2% of females. With the exception of apprentice or trades programs, females outnumbered males in all other education categories.
The Youth in Transition Survey (YIT) followed a cohort of more than 22,000 youth aged 18-20 years from 2000 to 2008.Footnote 45 Survey data showed that completion of post-secondary education varied by province and territory, as well as urban versus rural residency, ethnicity and immigration status. The Atlantic provinces and Ontario had the highest proportion of youth who completed university degrees. During the eight-year study period, more youth from urban areas completed some form of post-secondary education (66%) than youth from rural areas (57%). Less than 10% of off-reserve Aboriginal youth had obtained a university degree by 2008, compared to over 30% of non-Aboriginal youth in the sample. A higher proportion of visible minority youth born outside of Canada had obtained a university degree by 2008, compared to Canadian-born and non-visible minority youth.
In addition to school status, the quality of school experiences has a significant impact on the physical, emotional and mental wellbeing of youth. Besides offering young people the knowledge they need to succeed in life, gain employment and make good decisions about their health, schools also provide an opportunity for youth to develop self-esteem and acquire skills for healthy relationships. For this reason, the school environment, including the sense of belonging at school, and quality of relationships with teachers and peers, has been the focus of many studies on the health and wellbeing of youth over the past decade or so.
According to data from the Health Behaviours in School Children study, the majority of youth in grades 6 through 10 felt a sense of belonging and connection to their school. Nevertheless, as youth move from elementary to high school, their sense of school attachment declines. A larger proportion of males and females in grade 6 (71% and 74% respectively) reported a sense of belonging and attachment at school, compared to males and females in grade 10 (57% and 55% respectively).
Relationships with teachers and peers can also have a significant impact on the health behaviours, knowledge and attitudes of youth related to HIV and STBBI vulnerability. In the 2009-2010 academic year, the older the students, the less likely they were to believe their teachers cared about them as people. By grade 10, just over half of males (52%) and females (55%) believed their teachers cared about them personally, compared to about three-quarters of students in grade 6 (71% and 78% respectively). Similar downward trends across grade levels were observed for perceptions of teachers' encouragement of students' work.
By contrast, young people had much more stable perceptions of their relationships with school peers. More than two-thirds of youth in all grade levels felt that other students accepted them as they were. While these were positive findings, the fact remains that about one-third of students in all grades (about 33%) did not feel accepted.
The 2007-2009 First National Climate Survey focused on whether particular groups of youth were more likely to experience a negative school climate than others. In particular, the study examined school environments for sexually diverse and transgender youth compared to heterosexual youth.Footnote 46Verbal harassment about gender expression was experienced by 74% of transgender students, 55% of sexually diverse students and 26% of heterosexual students.Footnote 47 The study also found that physical harassment due to sexual orientation, perceived sexual orientation and gender expression is prevalent in Canadian schools. Nearly one-quarter (21%) of sexually diverse youth reported being physically harassed or assaulted because of their sexual orientation, or perceived sexual orientation, compared to 10% of heterosexual youth.Footnote 48 More than one-third (37%) of transgender students experienced physical harassment or assault due to gender expression. In addition, transgender students were much more likely than either sexually diverse students or heterosexual students to have been physically harassed or assaulted.Footnote 49
Chapter 4 explores how negative school experiences such as feeling isolated or being bullied affects the vulnerability of youth to poorer health outcomes such as HIV and other STBBIs.
2.3.2 Employment
According to the 2006 Census, almost half (43.5%) of youth aged 15-19 and nearly three-quarters (71.2%) of those aged 20-24 years were employed that year. Among the 15-19 age group, slightly more females (44.9%) than males (42.3%) were employed, but this trend was reversed among older youth. Among 20-24 year-olds, more males were employed in 2006 than females (72.3% and 70.2% respectively). Jobs in the sales and services industry were the most common employment, accounting for about 72% of jobs held by youth aged 15-19 years and about 41% of jobs held by those aged 20-24. While data on employment type was not available for 2006, figures from the 2011 Labour Force Survey suggest that youth aged 15-24 who were employed in that year comprised more than one-third of the total part-time labour force (35.4%) and about 9% of the full-time labour force.
In 2006, the unemployment ratesFootnote iv for youth aged 15-19 and 20-24 years were 7.5% and 9.2% respectively. Rates of unemployment were highest that year for males aged 20-24 years (9.9%), followed by females in the same age group (8.6%). Visible minority youth had higher rates of unemployment than non-visible minority youth. Among youth aged 15-24 years, the unemployment rate among visible minorities was 15.7% compared to 12.3% among non-visible minorities.
2.3.3 Income
Family income can influence various developmental, health and life transition outcomes among youth living with parents. In 2007, 11% of youth between 5 and 24 years of age lived in low-income circumstances, compared to 15% in 2003.v Children living with one parent were three times more likely than youth living with both parents to be living in low-income circumstances.
In 2007, youth who did not live with their parents were at highest risk of living in low-income circumstances, compared with those who lived with one or more of their parents. In fact, one-third (33%) of youth not living with their parents lived in low-income circumstances that year. While more data are needed to explain this, it is reasonable to assume that young people who have left home and are trying to move into the work force are more likely to have low incomes.
In 2006, more than one-third of youth aged 15-19 years did not have personal income, compared with only 2.5% of youth aged 20-24. The average personal income for youth aged 20-24 was roughly three times higher than the personal income of youth aged 15-19 years ($15,665 and $5,960 respectively).
2.4 Youth and the criminal justice system
Although data reported by the Canadian police services suggests that youth crime increased 3% between 2005 and 2006, the overall youth crime rate has shown a downward trend since the early 1990s.Footnote 50 The youth crime rate in 2006 was 25% lower than in 1991.Footnote 51 This general downward trend can be attributed to decreases in youth crime rates in four provinces during that period: British Columbia (-49%), Alberta (-41%), Ontario (-34%), and Quebec (-25%).Footnote 52 Increases in youth crime were reported for Prince Edward Island (+38%), Newfoundland and Labrador (+22%), Nova Scotia (+17%), and Manitoba (+14%).Footnote 53
Since implementation of the Youth Criminal Justice Act, the average number of youth aged 12 to 17 in federal-, provincial- or territorial sentenced custody and on probation has declined.Footnote 54 In 2008-2009, there were on average 1,898 youth in some form of custody each day, approximately half (47%) of whom were in sentenced custody.Footnote 55 Nevertheless, youth are in custody at much lower rates than the adult population. The rate of custody among youth aged 12-17 was 7 per 10,000 compared to 141 per 100,000 among the adult population.Footnote 56 Males make up a larger proportion of youth in custody than females. Among young males, the incarceration rate was seven times higher than that of young females (15 per 10,000 and 2 per 10,000 respectively).Footnote 57
Not unlike the adult population, Aboriginal youth are disproportionately represented in correctional facilities in Canada. Although Aboriginal youth make up 5% of all youth in Canada, they represent 27% of youth admitted to remand, 36% of youth admitted to sentenced custody, and 24% of youth admitted to probation.Footnote 58
2.5 Physical health
2.5.1 Mortality
Deaths among youth in Canada are rare. In 2009, deaths among youth aged 10-24 accounted for approximately 1% of all deaths recorded that year. Male youth make up a larger proportion of deaths among all Canadian males than is the case for their female counterparts. In 2009, deaths among males aged 10-24 years accounted for about 1.4% of deaths among males in Canada. The corresponding proportion for female youth was 0.6%. In the same year, accidents (unintentional injuries) and suicide (intentional self-harm) were the two leading causes of death among youth aged 10-24, accounting for about two-thirds of deaths among those aged 15-19 (63%) and 20-24 (61.1%).
2.5.2 Obesity and physical illness
Obesity in childhood and young adulthood has significant short- and long-term consequences for the physical, emotional and mental wellbeing of youth in Canada. Being overweight or obese can negatively impact self-esteem, relationships with others and self-confidence, and can increase the risk of negative coping mechanisms and health-compromising behaviours. The prevalence of obesity among youth in Canada has risen significantly over the past 25 years. According data presented in the Canadian Health Measures Survey (CHMS), just over 30% of youth aged 12-17 years were overweight or obese between 2009 and 2011. Among this age group, slightly more males than females were classified as obese (10.7% and 9.6% respectively), while a slightly larger proportion of females than males were classified as overweight (20.9% and 18.9% respectively). Data from the 2009 CHMS suggest that fewer immigrant youth and more off-reserve Aboriginal youth are overweight and obese, compared to the total youth population.
A number of other health conditions have short-term and long-term effects on the health and wellbeing of young people. Certain chronic conditions can develop as a result of a sexually transmitted infection, while others can impact the progression of STBBIs, including HIV, among those already infected.
Cervical cancer is the second most common cancer in women worldwide. Virtually all cervical cancer is caused by human papillomavirus (HPV), which is a sexually transmitted infection. Incidence of and mortality from cervical cancer are declining in Canada. Incidence of cervical cancer has declined steadily by about 1.4% per year since 1998, and mortality from cervical cancer has fallen nearly 3% per year since that time. This is likely due to the introduction of vaccines against HPV in provincial and territorial publicly funded vaccine programs for school-aged children, as well as to widespread screening through Papanicolaou (PAP) tests.
Tuberculosis (TB) is an infectious disease caused by bacteria that are spread through the air from person to person. Globally, TB is the most common cause of death in HIV-infected individuals. In Canada, co-infection is likely to become more important, particularly in immigrants and refugees from TB- and HIV-endemic countries and in Aboriginal peoples. In Canada, the rate of TB is generally very low. In 2011, there were 1,607 active and re-treatment TB cases reported in Canada for a reported incidence rate of 4.7 per 100,000 population. Together, British Columbia, Ontario and Quebec accounted for 70% of the total number of reported cases; however, Nunavut reported the highest incidence rate (222.1 per 100,000 population).
Although the overall rate in Canada is one of lowest in the world, the TB burden is not shared equally. Approximately 13% of cases in 2011 were reported among youth aged 15-24 years, a rate of 4.6 per 100,000 people. TB infections are disproportionately high among immigrants to Canada and Aboriginal populations. In 2011, 64.8% of tuberculosis cases among 15-24 year-olds in Canada were among immigrants and 27.7% were among Aboriginals. Together, these two sub-groups accounted for more than 90% of all reported cases of tuberculosis in 2011 among youth aged 15-24 years.
2.5.3 Child abuse, maltreatment and neglect
Childhood sexual, physical and emotional abuse, maltreatment and neglect have direct and indirect impacts on vulnerability to HIV and other STBBIs. In 2009, the Family Violence in Canada report cites more than 54,000 police-reported cases of child and youth sexual offence and physical assault.Footnote 59 In the case of sexual offences, the majority of victims were young females (81.9%). This trend is reversed when we consider physical assault, of which young males are victims in more than half of all reported cases (58.5%) (Figure9).Footnote 60
Figure 9: Proportion of police-reported offences by type and by sex among child and youth victims (aged 0-17 years) in Canada, 2009

Source: Public Health Agency of Canada using data from Canadian Centre for Justice Statistics, Statistics Canada.Footnote 61
Text Equivalent - Figure 9
Figure 9 is a stacked bar graph that shows the proportion of police-reported offences in Canada by type and sex among child and youth victims aged 0 to 17 years for 2009. There are three bars representing each of total assaults reported, total sexual offences reported and total physical assaults reported. Each bar displays the relative proportion of females and males victimized by that type of assault in 2009. The graph shows that in 2009, of the total assaults reported to police, 51.7% had female victims, compared to 48.3% which had male victims. Of the total police-reported cases of sexual offences, 81.9% had female victims, compared to 18.1% which had male victims. Among the total physical assaults, 58.5% had male victims, compared to 41.5% which had female victims.
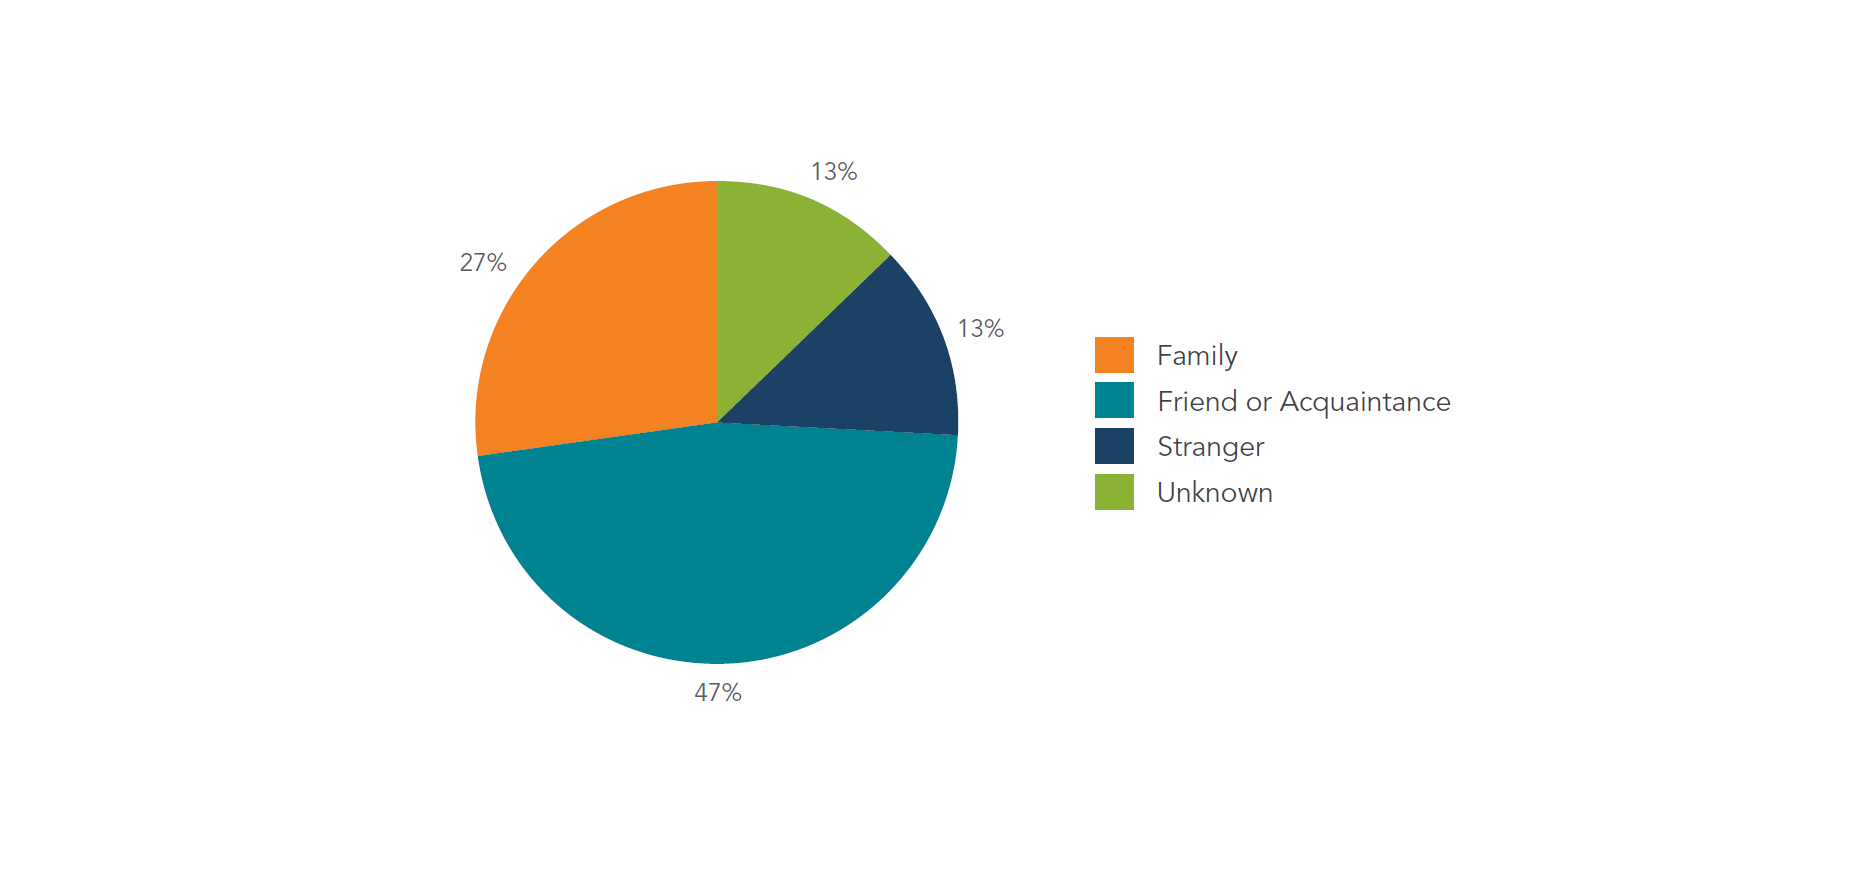
Youth are more likely to be assaulted by someone they know. About 74% of youth were victimized by a family member (e.g. parents, siblings, and other blood, marriage, or adoptive relatives), friend or acquaintance. Of these cases, nearly two-thirds (60%) were perpetrated by parents or guardians (Figure 10).Footnote 62 Young females were victims of a greater proportion of family-related sexual offences than young males.Footnote 63
Figure 10: Distribution of accused-victim relationship in Canada in 2009

Source: Public Health Agency of Canada using data from Canadian Centre for Justice Statistics, Statistics Canada.Footnote 64
Text Equivalent - Figure 10
Figure 10 is a circle with different sized segments shaded in different colours, corresponding to the relative proportion of offences reported to police where the accused had a different relationship to the victim. In total, there are four segments in the circle representing cases where the accused was a family member, friend or acquaintance, stranger, or the relationship to the victim was unknown. The figure shows that in 2009, 47% of youth were victimized by a friend or acquaintance, compared to 27% who were victimized by a family member, 13% who were victimized by a stranger, and 13% whose accused-victim relationship was unknown.
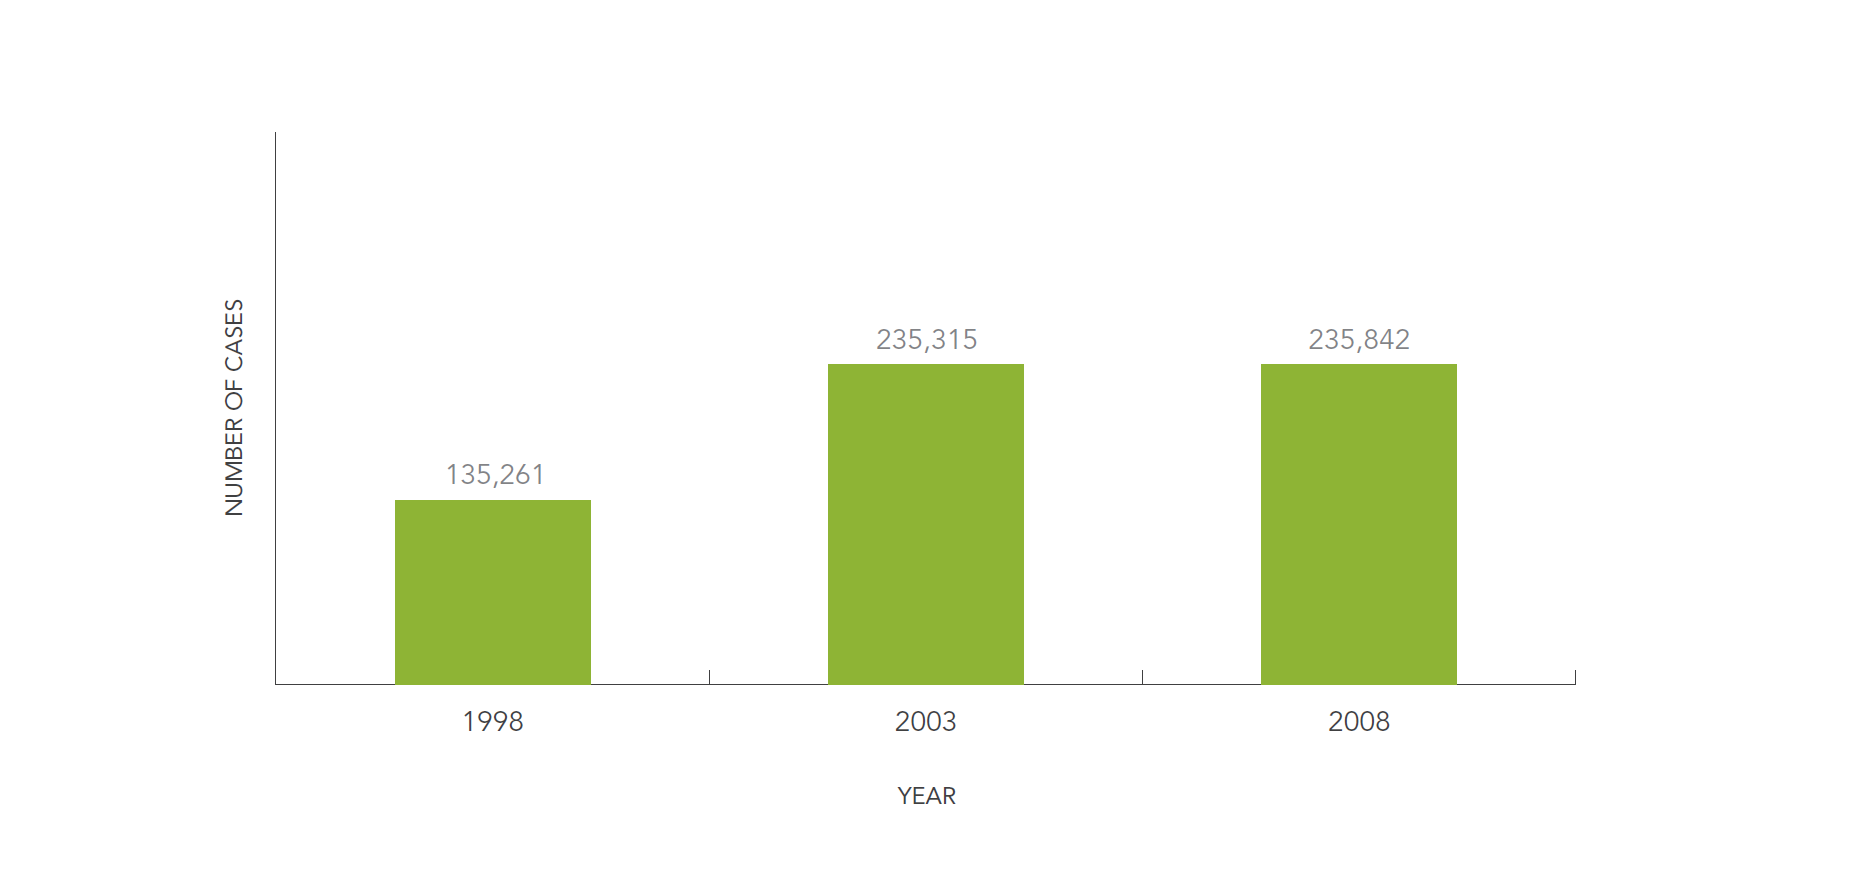
Youth are victims of other forms of maltreatment (e.g., neglect) that are not as easily recognized as physical or sexual assault.Footnote 65 The Canadian Incidence Study of Reported Child Abuse and Neglect (CIS) reported close to 16,000 child maltreatment investigations in 2008.Footnote 66 However, the number of reported cases represents only a fraction of all cases of maltreated youth in Canada. Based on the cases investigated, the total estimated cases of child maltreatment in 2008 was 235,842, a slight increase from 235,315 in 2003 and a significant increase from 135,261 in 1998 (Figure 11).Footnote 67
Figure 11: Estimated numbers of child maltreatment investigation cases in Canada in 1998, 2003, 2008

Source: Public Health Agency of Canada, 2010.Footnote 68
Text Equivalent - Figure 11
Figure 11 is a bar graph that shows the estimated numbers of child maltreatment investigation cases in Canada in the years 1998, 2003 and 2008. The graph shows that in 1998, an estimated 135,261 investigations were conducted in Canada, compared to 235,315 in 2003 and 235,842 in 2008.
Maltreatment investigations involving Aboriginal youth were five times more likely to be substantiated as neglect than investigations involving non-Aboriginal youth.Footnote 69 Aboriginal youth are also more likely to be removed from home and placed in the care of the child welfare system than non-Aboriginal youth.Footnote 70 Among Aboriginal youth, neglect was the main basis for the initiation of the maltreatment investigation, including failure to provide basic necessities, adequate educational resources or adequate access to medical services. The ability to provide for the basic necessities of a child is often determined by structural factors, like poverty, that are beyond the control of the parents.Footnote 71 The complex interaction of structural factors may in part explain the overrepresentation of Aboriginal children in investigation cases.Footnote 72
2.6 Health behaviours
2.6.1 Substance use
Adolescence is a life stage in which many health-supporting habits are formed. For some it is also a period of experimentation with health-compromising behaviours such as smoking, drinking, and drug use. In the 2009-2010 national HBSC study of young people in grades 6 through 10, about three-quarters of students in grades 9 and 10 reported having never smoked a cigarette. Among students who did report smoking, very few reported doing so daily. However, proportions of daily smokers increased with grade level, from 1% in grade 6 to 6-7% in grade 10.
National studies among youth in Canada suggest that alcohol is the most commonly used substance. In 2009-2010, about two-thirds (66%) of students in the HBSC study reported having tried alcohol at least once. In 2007-2008, more than half (52.6%) of students from the Youth Smoking Survey (YSS) aged 12 to 18 reported drinking alcohol at least once in the previous year. Reports were similar for males (54.1%) and females (51.1%).Footnote 73 While alcohol is the most commonly used substance among youth in Canada, rates of weekly drinking among youth are very low and have declined over the past two decades. According to longitudinal data from the HBSC study, the numbers of young people drinking beer and wine at least once per week have fallen since 1990 to less than 5% in each grade level.
Figure 12: Proportion of students in Canada reporting past-year alcohol use, by grade, 2007-08

Source: Public Health Agency of Canada using data from Young, et al. Footnote 74
Text Equivalent - Figure 12
Figure 12 is a bar graph that shows the proportion of students who report having used alcohol in the past year, by grade in the 2007 to 2008 academic year. The graph contains four bars representing grades 7, 9, 10 and 12. The graph shows that, 13.4% of students in grade 7 reported having used alcohol in the past year, compared to 49.9% of students in grade 9, 61.2% of students in grade 10, and 82.1% of students in grade 12.
Episodes of “binge drinking” are particularly concerning for the health and wellbeing of youth. Binge drinking is typically defined as having five or more drinks on one occasion for males, and four or more drinks on one occasion for females.Footnote 75 Reports of binge drinking increased with age in the HBSC study, with 56% of boys and 54% of girls in grade 10 reporting binge drinking in the past year, compared to 41% and 38% respectively in grade 9.
Standard definitions of binge drinking have their limitations and do not necessarily reflect instances of alcohol misuse or cases in which an individual has been “drunk”. In 2009-2010, the proportions of students in the HBSC study who reported having been “really drunk” on at least two occasions in their lives increased with age and were similar for both males and females in each grade level. The proportions of youth who reported having been “really drunk” at least twice in their lives ranged from 2% and 1% for males and females respectively in grade 6, to 41% and 39% respectively in grade 10. These trends are similar to those found in the YSS study in 2007-2008.Footnote 76
Figure 13: Proportion of students who report having ever been "really drunk" at least twice, by grade and gender (%)Footnote 77

Source: Currie, C., et al. eds. (2012). Social determinants of health and wellbeing among young people. Health Behaviour in School-aged Children (HBSC) study: international report from the 2009/2010 survey. Copenhagen, WHO Regional Office for Europe, (Health Policy for Children and Adolescents, No. 6)
Text Equivalent - Figure 13
Figure 13 is a clustered bar graph that shows the proportion of students who report having ever been "really drunk" at least twice, by grade and gender. The graph contains two vertical bars, representing males and females, for each of grades 6, 7, 8, 9 and 10. The graph shows that 2% of Grade 6 boys report having been really drunk at least twice, compared to 5% of Grade 7 boys, 13% of Grade 8 boys, 25% of Grade 9 boys, and 41% of Grade 10 boys. The graph also shows that 1% of Grade 6 girls report having been really drunk at least twice, compared to 5% of Grade 7 girls, 14% of Grade 8 girls, 25% of Grade 9 girls, and 39% of Grade 10 girls.
Longitudinal data from the HBSC study suggest that while smoking and alcohol consumption declined among youth between 1990 and 2010, cannabis use increased over that period. In 2009-2010, 40% of boys and 37% of girls in grade 10 reported having tried cannabis, and one-quarter of both boys and girls reported cannabis use in the past 12 months. Similar trends in past year cannabis use were noted in the 2007-2008 YSS study, along with regional differences in cannabis use. The proportions of males and females reporting cannabis use in the past year were lowest in Alberta (16.7%) and highest in Nova Scotia (32.4%).Footnote 78
Figure 14: Proportion of students reporting past-year cannabis use by grade in 2007-2008

Source: Public Health Agency of Canada using data from Young, et al.Footnote 79
Text Equivalent - Figure 14
Figure 14 is a bar graph that shows the percentage of students during the 2007 and 2008 academic year who reported having used cannabis in the past year, by grade. The graph contains 4 vertical bars representing grades 7, 9, 10 and 12. The graph shows that 4.6% of students in grade 7 reported having used alcohol in the past year, compared to 25.0% of students in grade 9, 32.1% of students in grade 10, and 44.4% of students in grade 12.
Limited data are available on usage of drugs other than cannabis. The 2009-2010 HBSC findings suggest that the percentage of youth in grades 9 and 10 who report using illicit drugs or prescription medications to get high were lower than those for cannabis use. The most frequently reported substances among grade 9 and grade 10 students were pain relievers, ecstasy, LSD and other hallucinogens, and salvia. The least frequently reported substances were amphetamines, methamphetamines, opiates, glue or solvent sniffing and sedatives.
Illicit drug use may be more common among certain groups. For example, among a cross-sectional convenience sample of street-involved youth aged 15-24 from the Enhanced Street Youth Surveillance (E-SYS) system, 19.2% of females reported injecting drugs more than once in their lifetimes, compared to 17.5% of males. An additional 4.2% of females and 4.5% of males reported having injected drugs only once in their lifetimes.Footnote 80
I-Track is the national enhanced (behavioural and biological) surveillance system that collects information on HIV and hepatitis C (HCV) risk behaviours among people who inject drugs in sentinel sites across Canada. Among I-Track youth participants, 41.4% reported initiation into drug injection at 16 years of age or younger, as well as a progression from "soft" drugs to "hard" drug use.Footnote 81 A 2006 study of more than 1,000 street-involved youth in Montreal reported that having consumed at least four different types of drugs was a strong predictor of injection drug initiation.Footnote 82
Sharing needles and other drug injection equipment can also put youth at high risk for HIV and HCV, and is more likely to happen when injecting with others.Footnote 83 Among I-Track youth participants, more than 25% reported borrowing used needles or syringes in the previous six months, while nearly 50% reported borrowing used injection equipment, such as cookers, water, filters, tourniquets, swabs or acidifiers over the same period of time.Footnote 84 Among those who borrowed used needles or syringes, respondents reported borrowing most frequently from close friends (47.8%) and regular sex partners (44.6%), while fewer reported borrowing from people they did not know well (14.1%).Footnote 85 Males were more likely to borrow from close friends (69.4%) and people they did not know well (25.0%), compared to females (33.9% and 7.1%, respectively). Results from both the Cedar Project and Enhanced Street Youth Surveillance study showed that young females had higher rates of sharing injection drug equipment than their male counterparts, because there were often "second on the needle" (second to inject with a same needle), relying on their male partners for drug acquisition, preparation and injection.Footnote 86 Females borrowed most frequently from regular sex partners (60.7%) and family (19.4%), compared to males (7.1% and 0%, respectively).Footnote 87 Subsequently, females also reported having higher rates of infection with HIV and HCV.Footnote 88
2.6.2 Sexual behaviour
Adolescence is a period during which the majority of people begin to explore their sexuality and initiate sexual relationships. The behaviours and sexual practices developed during this period have a significant impact on sexual relationships and health outcomes throughout life. Nationally representative data in Canada suggest that the average age at first sexual intercourse has been between 16 and 18 years for the past decade.Footnote 89 In addition, the proportion of youth aged 15-24 who report ever having engaged in sexual intercourse has remained stable at about 66% since 2003 (the earliest year for which comparable national data are available).Footnote 90
Some sexual behaviour, including having multiple partners and inconsistent condom use, put youth at increased risk for HIV and other STBBIs. According to nationally representative data, the percentage of youth reporting multiple (more than one) partners in the past 12 months remained stable between 2003 and 2009-2010.Footnote 91 In 2009-2010, about one-third (30.9%) of youth aged 15-24 reported having had sexual intercourse with more than one partner in the past 12 months, with a larger proportion of males (39%) than females (25%) reporting this behaviour. Among youth who reported having sex in the past 12 months, those who reported using condoms the last time they had intercourse increased 6% between 2003 and 2009-2010, from 62% to 68%. In 2009-10, more males (73%) than females (63%) said they had used condoms the last time they had intercourse. Numbers were similar among those who reported having had only one partner (67%) or more than one partner in the past 12 months (69%).Footnote 92 While data is not comparable across studies, data from surveys among specific groups of youth suggest that there may be patterns of behaviour among them that differ from the general youth population. Data in the E-SYS enhanced surveillance system, collected among youth aged 15-24 in six urban centres (Vancouver, Edmonton, Saskatoon, Toronto, Ottawa and Halifax), showed that the vast majority (96.8%) reported having engaged in sexual activities with a male or female partner. Approximately one-third (29.7%) of participants reported having more than 10 female sexual partners while 18.2% reported having more than 10 male sexual partners in their lifetime. More than half (58.8%) of males and about one-quarter (22.6%) of females reported using some form of barrier protection, such as condoms, at their last intercourse with a female partner. A similar proportion of males (54.5%) and more than twice the proportion of females (46.6%) reported using barrier protection at their last intercourse with a male partner.Footnote 93
M-Track is an enhanced surveillance system that tracks HIV, STBBIs and associated risk behaviours among men who have sex with men (MSM) in Canada by combining behavioural and biological surveillance. In a cross-sectional M-Track sample, the majority (64%) of youth aged 15-24 reported having two or more male sexual partners (oral or anal sex) in the six months preceding the survey. Among youth who had engaged in oral or anal sex in the past six months, more than half (55%) reported having had more than one sexual partner. More than three-quarters (77%) of the sample who had engaged in sex with a male partner reported having had sex with a casualvi male partner, while about half of those who had had anal sex with a casual male partner reported consistent (always) condom use during receptive or insertive anal sex.Footnote 94
In the I-Track study, more than half (57.4%) of youth reported having more than one sexual partner in the six months before the survey. More males than females reported having more than one sexual partner (62.2% and 52.9% respectively). About one-third of the total sample (35.3%) reported using a condom at last intercourse, with more males than females reporting it (50.4% and 23.1%, respectively).Footnote 95
2.7 Mental health and mental Illness
2.7.1 Mental health
Measures to describe the mental health of youth in Canada include "positive" measures such as: individuals' perception of their overall mental health; sense of satisfaction with life; frequency of feeling happy; frequency of feeling interested in life; and confidence in oneself. "Negative" measures include individuals' perception of general life stress.
According to the 2011 CCHS, approximately three-quarters (76.5%) of youth aged 12 to 24 reported their overall mental health to be very good or excellent. Males and females did not differ significantly in their perceptions. Compared to the overall youth population, more immigrant youth (82.1%) and fewer Aboriginal youth (66.5%) reported their overall mental health to be very good or excellent.Footnote 96 Findings were similar from the 2008-2010 First Nations Regional Longitudinal Health Survey (RHS) in which approximately 65% of on-reserve Aboriginal youth (aged 12-17) described their mental health as very good or excellent.Footnote 97
In the 2011 CCHS, most (95.9%) youth aged 12 to 24 reported that they were either satisfied or very satisfied with life in general, compared to 92.8% of immigrant youth. While the majority said that they felt happy (85.8%) and interested in life almost every day or every day in the previous month (88.7%), proportions differed by age, Aboriginal identity and immigration status. For example, more Canadians aged 12 to 15 (90.4%) and fewer of those aged 20 to 24 (82.9%) and Aboriginal youth (83.5%) reported such feelings. Among immigrant youth, 79.7% reported feeling happy while 84.8% said they felt interested in life every day or almost every day in the previous month.
Compared to 18.4% of the total population aged 12 to 24 years, more females (22.5%) and immigrant youth (21.1%) reported most days as being "quite a bit" or "extremely" stressful. Stress levels also increased with age. More youth aged 16 to 19 (20.4%) and 20 to 24 years (21.9%) described most days as being "quite a bit" or "extremely" stressful in 2011. Of all youth, the smallest proportions reporting these stress levels were among males (14.4%) and youth aged 12 to 15 (11%).
In the 2009-2010 Health Behaviours in School Children study, less than 50% of boys and girls in grades 6 through 10 reported having confidence in themselves. While self-confidence decreased across grade levels, more boys than girls in each grade reported feeling self-confidence. About half of boys in grade 6 reported feeling self-confident, compared to 26% by grade 10. Among girls, 40% in grade 6 reported feeling self-confident compared to 18% in grade 10.
2.7.2 Mental illness
Mental illness can develop in adolescence and young adulthood and continue to affect the development, health and wellbeing of individuals throughout their lives. Depression among youth can lead to high blood pressure, increase the burden of chronic health conditions, hinder productivity and academic success, and make it harder to get or maintain a job, and damage social relationships. Depression is also very closely associated with suicide, the second leading cause of death for youth in Canada.
While most people have occasional periods of feeling sad or distressed, these feelings are usually short-lived. Depression is defined as persistent feelings of sadness or distress that interfere with normal day-to-day life. People with depression may have feelings of anxiety, emptiness, pessimism, guilt, hopelessness, helplessness, worthlessness and irritability. They may also experience lack of energy, disturbed sleep, changes in appetite and thoughts of suicide.
According to the 2011 Canadian Community Health Survey, 7.1% of those aged 12 or older reported being diagnosed with a mood disorder such as depression or bipolar disease, a percentage that increased with age. Youth aged 12 to 15 had the lowest proportion (1.8%) of diagnosed mood disorders, but this rose to 4.4% among youth aged 16 to 19. Over 6% (6.1%) of youth aged 20 to 24 years reported ever having been diagnosed with a mood disorder such as depression.
Given the persistent stigma around mental illness and the reluctance to seek care that may result, it should be noted that reports of diagnoses do not reflect the true burden of mental illness in Canada. In a 2011 Canadian study of students in grades 5 through 10, a significant proportion reported emotional problems over the previous six months, including feeling low (depressed), sad, helpless, lonely, left out or wishing they were someone else. The numbers of males reporting such problems was relatively stable across grade levels, ranging from 25% in grade 8 to 29% in grade 9. A significantly larger proportion of girls reported emotional problems, with the levels increasing by grade. About 35% of girls in grade 5 reported emotional problems, compared to 27% of boys. By grade 10, the proportion of girls reporting emotional problems rose to 44%.
Endnotes
Page details
- Date modified: