
Injury in review, 2020 edition: Spotlight on traumatic brain injuries across the life course
Download the alternative format
(PDF format, 4.2 MB, 168 pages)
Organization: Public Health Agency of Canada
Date published: August 2020
Table of contents
- List of abbreviations
- Acknowledgements
- Foreword
- Executive summary
- 1. Introduction/Background
- 2. Methods part I: Mortality, hospitalization, and emergency department visits (ICD-10/ICD-10-CA coded databases)
- 3. Methods part II: Sentinel surveillance of emergency department visits, Canadian hospitals injury reporting and prevention program (CHIRPP/eCHIRPP)
- 4. Results: Mortality, hospitalization and emergency department visits (ICD-10/ICD-10-CA coded databases)
- 5. Results: Sentinel surveillance of emergency department visits for traumatic brain injuries and all head injuries: Canadian hospitals injury reporting and prevention program (CHIRPP/eCHIRPP)
- 6. Sentinel surveillance of emergency department visits for traumatic brain injuries and all head injuries associated with sports and recreation
- 7. Sentinel surveillance of emergency department visits for traumatic brain injuries and all head injuries associated with male organized ice hockey, comparing legal versus penalizable play
- 8. Sentinel surveillance of emergency department visits for traumatic brain injuries and all head injuries associated with female organized ice hockey
- 9. Sentinel surveillance of emergency department visits for traumatic brain injuries and all head injuries associated with female organized rugby
- 10. Sentinel surveillance of emergency department visits for traumatic brain injuries and all head injuries associated with bleachers and grandstands
- 11. Sentinel surveillance of emergency department visits for traumatic brain injuries and all head injuries associated with television tip-overs
- 12. Sentinel surveillance of emergency department visits for traumatic brain injuries and all head injuries associated with strollers
- 13. Sentinel surveillance of emergency department visits for traumatic brain injuries and all head injuries occurring in schools
- 14. Sentinel surveillance of emergency department visits for traumatic brain injuries and all head injuries associated with seniors' falls
- 15. Sentinel surveillance of emergency department visits for traumatic brain injuries and all head injuries associated with motor vehicle-pedestrian collisions
- 16. Sentinel surveillance of emergency department visits for traumatic brain injuries and all head injuries associated with intentional injury
- Discussion and concluding remarks
- Appendix A: Breakdown of ICD-10/ICD10-CA sports and recreation codes
- Appendix B: Mortality tables (ICD-10/ICD-10-CA coded data)
- Appendix C: Hospitalization tables (ICD-10/ICD-10-CA coded data)
- Appendix D: Emergency department visit tables (ICD-10/ICD-10-CA coded data)
- References
List of abbreviations
- AAPC
- Average Annual Percent Change
- APC
- Annual Percent Change
- ATV
- All-terrain vehicle
- BP
- Body part
- CATT
- Concussion Awareness Training Tool
- CCHS
- Canadian Community Health Survey
- CDC
- Centers for Disease Control and Prevention
- CHIRPP
- Canadian Hospitals Injury Reporting and Prevention Program
- CIHI
- Canadian Institute for Health Information
- CNPHI
- Canadian Network for Public Health Intelligence
- CRT
- Cathode-ray tube
- CT
- Computerized tomography scan
- CTE
- Chronic traumatic encephalopathy
- CVS:D
- Canadian Vital Statistics Death Database
- DAD
- Discharge Abstract Database
- CI
- Confidence intervals
- EC
- External cause
- eCHIRPP
- Electronic Canadian Hospitals Injury Reporting and Prevention Program
- ED
- Emergency department
- HMDB
- Hospital Morbidity Database
- ICD-10
- 10th revision of the International Statistical Classification of Diseases and Related Health Problems
- ICD-10-CA
- The Canadian Enhancement of the International Statistical Classification of Diseases and Related Health Problems
- ICECI
- International Classification of External Causes of Injury
- IPV
- Intimate partner violence
- IQR
- Interquartile Range
- LCD
- Liquid crystal display television
- MMA
- Mixed martial arts
- mTBI
- Mild Traumatic Brain Injury
- NACRS
- National Ambulatory Care Reporting System
- NEISS
- National Electronic Injury Surveillance System
- NFS
- Not further specified
- NHL
- National Hockey League
- NI
- Nature of injury
- NSOs
- National sporting organizations
- OECD
- Organisation for Economic Co-operation and Development
- PE
- Physical education
- PGE
- Playground equipment
- PHAC
- Public Health Agency of Canada
- PIR
- Proportionate Injury Ratios
- RTBI
- Repeated Traumatic Brain Injuries
- SD
- Standard deviation
- SIS
- Second Impact Syndrome
- SPAR
- Sports and recreation
- SRC
- Sport-related concussion
- TBI
- Traumatic brain injuries
- TV
- Television
Acknowledgements
The Public Health Agency of Canada (PHAC) would like to express thanks to the following individuals for their contributions to this report:
Thank you to Owen Phillips and Baudelaire Augustin of Statistics Canada for providing the Mortality data (CVS:D); Jenini Subaskaran for her assistance with the analysis of Canadian Institute for Health Information data, from the Hospital Morbidity Database and the Discharge Abstract Database; and Margaret Herbert for her thorough review, keen observations, and written contributions to the report.
We would also like to acknowledge the following PHAC and Health Canada staff and associates who were dedicated to data analysis, writing, review and production:
- Francine Boucher, Publishing Advisor, Health Canada
- Aimée Campeau, Research Analyst, PHAC
- Andre Champagne, Epidemiologist, PHAC
- Dr. Bernard Choi, Senior Research Scientist, PHAC
- Jennifer Crain, Epidemiologist, PHAC
- Jasminka Draca, Policy Analyst, PHAC
- Fanny Gallot, Administrative Officer, PHAC
- Meghan Grainger, Manager, Products and Services, PHAC
- Dr. Howard Morrison, Consultant, PHAC
- Dr. Andrew Mackenzie, Director, Behaviours, Environments and Lifespan Division, PHAC
- Steven McFaull, Senior Epidemiologist, PHAC
- Lynn O'Connor, Graphic Designer, Health Canada
- Dr. Deepa P. Rao, Epidemiologist, PHAC
- JoAnne Sim, Creative Services, Health Canada
- Wendy Thompson, Manager, Injury and Healthy Living Surveillance, PHAC
- Dr. Anne-Marie Ugnat, Executive Director, Centre for Surveillance and Applied Research, PHAC
- Xiaoquan Yao, Epidemiologist, PHAC
Foreword
Message from Canada's Chief Public Health Officer

I am pleased to introduce the Injury in Review, 2020 Edition: Spotlight on Traumatic Brain Injuries Across the Life Course. This is the third report of the Public Health Agency of Canada's (PHAC) Injury in Review series, providing important national surveillance statistics on the causes of traumatic brain injuries (TBI) across the life course, including sports, seniors' falls, assaults, consumer products, and more.
Each year in Canada, over 20,000 people are hospitalized for TBI, which can range from mild to severe and include concussions. Much work has been done in recent years across governments, stakeholders, and health care professionals to improve education and awareness of TBI and, in particular, concussions.
In the last two years, Parachute released the Canadian Guideline on Concussion in Sport as well as sport concussion protocols with support from PHAC. The Guideline and protocols include harmonized best practices to recognize, prevent and reduce the impacts of concussion in sport, health and school sectors. And in 2018, the province of Ontario enacted Rowan's Law—named in honour of Rowan Stringer, who at just 17 years of age died after suffering a concussion during a high school rugby game. The law, a first in Canada, requires sports organizations to address concussion safety, including a remove-from-sport protocol for athletes.
The breadth of topics covered in this report helps to tell the story of how TBI, including concussions, are affecting Canadians of all ages. Knowing how these injuries occur is critical to understanding the impact of TBI on Canadians.
It will also enable us to enhance targeted prevention strategies, set priorities for research, and better support individuals living with TBI.
By continuing to work together with governments, stakeholders, and dedicated injury prevention partners, we can help protect Canadians from TBI.
Dr. Theresa Tam
Chief Public Health Officer
Public Health Agency of Canada
Executive summary
Injuries are a leading cause of death, disability and illness in Canada. Among the many types, injuries to the head and brain are of special public health concern. Severe traumatic brain injuries (TBI) are often fatal and those surviving may be subject to permanent impairments.
In recent years there has been a growing concern for less severe TBI including subconcussions, and increased awareness of the dangers of multiple concussions and second impact syndrome. TBI causes and severity vary widely. High energy, high impact events such as motor vehicle collisions or falls from heights often result in serious head injuries, whereas frequent but generally minor brain injuries arise from less precarious activities such as sports and recreation (SPAR).
The wide variation in causes and mechanisms of head injuries and TBI presents challenges for prevention efforts; clearly this is not a situation for a single approach to prevention. A wide-ranging study of the specific activities and circumstances leading to head injuries that are frequent or severe can help target prevention. Efforts can then focus on these target circumstances and may then be strengthened by reinforcing established programs and developing, testing and evaluating new prevention initiatives.
Injury surveillance is a cornerstone of public health and important to understanding the burden, identifying risk and protective factors, and later assessing the progress and success of prevention efforts by following trends over time. This report reviews Canadian health surveillance systems with respect to the information they can provide on head injuries and TBI. The report summarizes findings from various surveillance systems reporting on:
- Deaths—from the Canadian Vital Statistics Death Database (CVS:D) of Statistics Canada,
- Hospitalizations—from the Hospital Morbidity Database (HMDB) and the Discharge Abstract Database (DAD) of the Canadian Institute for Health Information (CIHI),
- Emergency department visits—from the National Ambulatory Care Reporting System (NACRS) (CIHI) and,
- Emergency department visits—from the Public Health Agency of Canada's electronic Canadian Hospitals Injury Reporting and Prevention Program (eCHIRPP).
Each data source provides different elements to the overall understanding of head injuries and TBI including different levels of injury severity (from deaths to minor injuries treated in emergency departments). Vital statistics and some of the administrative data sources from CIHI provide population based data from which standard injury rates may be calculated. Information from these population-based sources is classified according to the World Health Organization's International Statistical Classification of Diseases and Related Health Problems. Chapter 4 of this report presents findings about head injuries, particularly TBI from these sources.
Between 2002 and 2016 there were approximately 235,471 injury deaths and of those 53,200 (22.6%) were associated with a TBI diagnosis. TBI mortality rates were highest for the oldest Canadians rising sharply among those 65 years of age and older. Between 2002 and 2016, trends for males decreased slightly while female rates slightly increased. Some of the leading causes of TBI deaths were transportation collisions, falls among the elderly and suicide among males.
Between 2006/07 and 2017/18 there were 399,376 hospitalizations for head injuries, 63% (251,504) of which involved males. Over this period head injury trends for females showed a slight increase and for males a slight decrease. The leading cause of hospitalization for head injury was falls, with the lowest rates among older adolescents and adults (15 to 49 years), and slightly higher rates among infants (137/100,000 population among males and 113.5/100,000 for females). Rates rose sharply among seniors with the highest rates for those over 85 years of age (897/100,000 males and 750/100,000 females).
Between 2002/03 and 2017/18 there were 5,074,239 emergency department (ED) visits for head injuries in Ontario and Alberta. For both males and females, TBI ED visits have been increasing since 2009/10. Falls and SPAR incidents are the leading causes of ED visits for TBI. The highest rates of TBI occur among adolescents and young adults for causes such as transportation collisions and SPAR injuries. Similar to hospitalizations, fall rates are high among infants and young children, decline during adult years and rise to very high levels for the elderly. Hockey, football/rugby, soccer and other ball sports were SPAR activities that frequently resulted in concussions treated in EDs, with equestrian incidents also frequent among females and cycling among males, during this time.
Unlike these population-based sources, the CHIRPP surveillance program has a different system of coding and gathers descriptions of injury events through a narrative summary provided by patients and/or caregivers. It was developed to focus on gathering information on the circumstances of injury with a view to prevention. CHIRPP is a sentinel surveillance system, collecting data from select emergency departments across Canada and does not support population-based rates. This report presents the results of a series of studies of injury types associated with head injuries and TBI using CHIRPP data. Some of these short reports focus on types of injury that affect people at different points in the life span including injuries associated with baby strollers and televisions (TVs) that tip over, injuries that occur in the school environment and head injuries caused by falls among seniors. Several others report on head injuries and TBI associated with sports overall and with specific sports including men's and women's hockey, and women's rugby. There are also reports of head injuries that occurred on bleachers and grandstands and head injuries related to intentional injuries.
For SPAR-related activities among children and adolescents 5 to 19 years of age, hockey consistently showed the highest proportion of TBI relative to all injuries. Rugby also emerges as a sport with a high percentage of TBI for both males and females aged 10 to 19 years. Other high ranking sports included sledding/tobogganing and equestrian activities among females.
In male organized hockey among 10 to 19 year olds, the highest proportions of TBI are seen among 13 and 14 year olds in the Bantam level although the trends over time show a decrease after the 2013 rule change to ban body checking for Bantam players. The percentage of TBI associated with penalizable actions (mainly illegal checking) was greatest among 13 to 16 year olds at the Bantam and Midget levels of play. Among female organized hockey the greatest proportion of TBI are also seen at the Bantam level. For women's hockey the vast majority of TBI are associated with penalizable actions, again mainly illegal checking. This is likely because all body checking is illegal (penalizable) in women's leagues.
With respect to rugby-related injuries among females aged between 14 and 19 years, the highest proportions of TBI and head injuries are seen among 16 and 17 year olds. Nearly all cases of head injuries were classified as TBI, and over half of the injuries were caused by tackles.
There was a large proportion of head injuries among children 2 to 10 years of age associated with bleachers and grandstands located at schools, stadiums and arenas; over half of these head injuries were TBI. Young children, particularly 2 to 4 year olds sustained head injuries (mostly TBI) related to televisions tipping over. The occurrence has been decreasing since 2011 and is thought to be due to older and heavier televisions being replaced by flat screens. Strollers were also associated with TBI among very young children, with the greatest proportion among infants less than one year old. Fortunately, stroller related head injuries and TBI have been decreasing since 2011.
Children and youth spend much of their time engaged in educational activities, and reports of head injuries occurring in school settings have increased since 2007. A small percentage of these injuries are intentional injuries (physical assaults or self-harm) but most are unintentional injuries, which include falls and collisions with other people, structural elements, furnishings or equipment. Not unexpectedly, the majority of incidents happen in the school yard or gym.
Among older Canadians, falls cause many head injuries with TBI accounting for about half of all head injuries. Although more women than men seek treatment at EDs for head injuries, men sustain a greater proportion of head injuries among all injuries in their age group. The trends have increased slightly since 2011; most happen in the senior's own home and about half are falls on the same level (not from a height) and about 20% happen on steps and stairs.
Collisions between pedestrians and motor vehicles cause head injuries and TBI among all age groups. The proportions of pedestrians are especially high among those aged 5 to 30 years and those older than 50 years of age. Over half of these injuries (55%) were associated with crossing roads and another 36% when the pedestrian was walking or running on a roadway.
Among head injuries related to intentional injuries more than 90% were due to assaults, 6% were self-inflicted. Trends for all head injuries and TBI decreased between 2011 and 2015 and increased in 2016. The highest proportions were among 20 to 29 year olds for both males and females.
Figures 1.1 and 1.2 which conclude the Executive Summary provide a visual snapshot of TBI causes over the life course for males and females, for which detailed statistics are presented throughout this report. For deaths, hospitalizations and ED visits, the external causes of TBI displayed are the leading causes based on the age and sex-specific rates. The causes in relation to sentinel ED visits, which are detailed in chapters 5–16, are not necessarily leading causes, but were chosen as broad contexts or hidden hazards which can be analyzed in further detail than with the other data sources.
This report only includes information from select areas of the health care system, but that is nonetheless valuable for better understanding TBI and other head injuries in Canada. Collating information collected in other domains such as clinics, schools, and sports organizations would also be valuable for a more complete picture of the burden of TBI and other head injuries in Canada. Comprehensive information on the burden of head injuries and their risk and protective factors, together with an understanding of trends over time, are helpful for planning and optimizing treatment and services, and most importantly, for developing and evaluating prevention programs and public policies for the safety of the Canadian public.
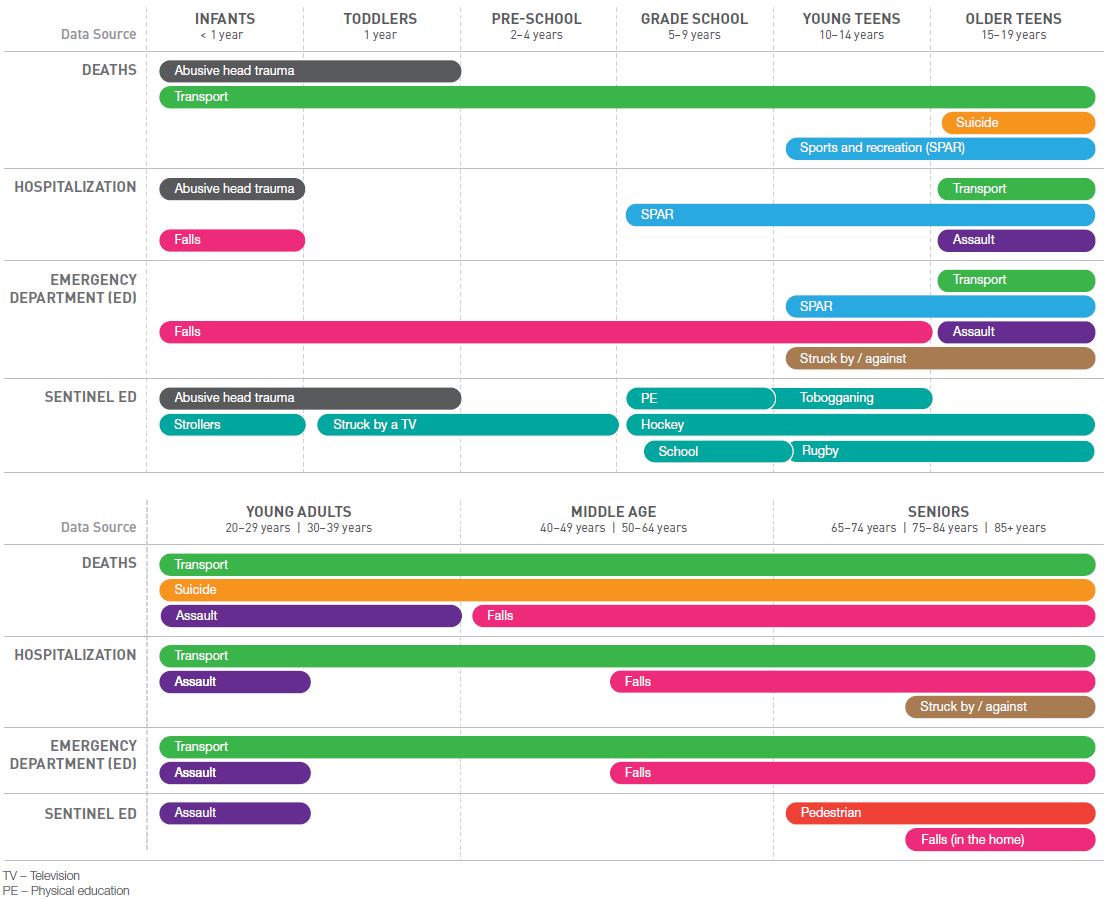
Figure 1.1: Causes of TBI over the life course, by data source and age group – males
Text description
This figure is a visual representation of the leading causes of deaths, hospitalizations and emergency department visits in relation traumatic brain injuries across the lifespan among males. A sentinel surveillance component is also provided in the figure, though the causes presented were chosen to highlight hazards that were identified in the Canadian Hospitals Injury Reporting and Prevention Program (CHIRPP) database.
On the left hand side of the figure are the four data sources used in this report. Each data source is presented as a row. From top to bottom, the order of the data sources are as follows: deaths, hospitalizations, emergency department visits and sentinel emergency departments. Corresponding to all data sources are nine columns, each representing a specific age group: Infants (<1 year), toddlers (1 year), pre-school (2-4 years), grade-school (5-9 years), young teens (10-14 years), older teens (15-19 years), young adults (20-39 years), middle age (40-64 years), seniors (65 years and over). A summary description is presented below:
Under the death category, abusive head trauma was one of the leading causes among infants aged less than one year and toddlers aged one year. Transportation was one of the leading causes among infants aged less than one year, toddlers aged one year, pre-school children aged between two and four years, grade school aged between five and nine years, young teens aged between 10 and 14 years, older teens aged 15 to 19 years, young adults aged 20 to 39 years, middle age males between 40 and 64 years and seniors aged 65 years or older. Suicide was one of the leading causes among older teens aged 15 to 19 years, young adults aged 20 to 39 years, middle aged males between 40 and 64 years and seniors aged 65 years or older. Sports and recreational activities were one of the leading causes among young teens aged between 10 and 14 years and older teens aged 15 to 19 years. Assault was one of the leading causes among young adults aged 20 to 39 years. Falls were one the leading causes among middle aged males between 40 and 64 years and seniors aged 65 years or older.
Under the hospitalization category, abusive head trauma was one of the leading causes among infants aged less than one year. Falls were one of the leading causes among infants aged less than one year, middle aged males aged between 50 and 64 years and seniors aged 65 years or older. Sports and recreational activities were one of the leading causes among grade school males aged between five and nine years, young teens aged between 10 and 14 years and older teens aged 15 to 19 years. Transportation was one of the leading causes among older teens aged 15 to 19 years, young adults aged 20 to 39 years, middle aged males between 40 and 64 years and seniors aged 65 years or older. Assault was one of the leading causes among older teens aged 15 to 19 years and young adults aged 20 to 29 years. Struck by or against was one of the leading causes among seniors aged 75 years or older.
Under the emergency department category, falls were one of the leading causes among infants aged less than one year, toddlers aged one year, pre-school children aged between two and four years, grade school aged between five and nine years, young teens aged between 10 and 14 years, middle aged males between 50 and 64 years and seniors aged 65 years or older. Transportation was one of the leading causes among older teens aged 15 to 19 years, young adults aged 20 to 39 years, middle age males between 40 and 64 years and seniors aged 65 years or older. Sports and recreational activities were one of the leading causes among young teens aged between 10 and 14 years and older teens aged 15 to 19 years. Assault was one of the leading causes among older teens aged 15 to 19 years and young adults aged 20 to 29 years. Struck by or against was one of the leading causes among young teens aged between 10 and 14 years and older teens aged 15 to 19 years.
Under the sentinel emergency department category, abusive head trauma was one of the noted causes among infants aged less than one year and toddlers aged one year. Injuries involving strollers were one the noted causes among infants aged less than one year. Injuries involving individuals being struck by a television were noted among toddlers aged one year and pre-school children aged between two and four years. Injuries occurring at schools or during physical education were noted among grade school males aged between five and nine years. Hockey injuries were noted among grade school aged males between five and nine years, young teens aged between 10 and 14 years and older teens aged 15 to 19 years. Rugby injuries were noted among young teens aged between 10 and 14 years and older teens aged 15 to 19 years. Tobogganing injuries were noted among young teens aged between 10 and 14 years. Assaults were noted among young adults aged 20 to 29 years. Pedestrian-related injuries were noted among seniors aged 65 years or older. Falls occurring at home were noted among seniors aged 75 years or older.
| Data source | Cause of Traumatic Brain Injury | Age group |
|---|---|---|
Deaths |
Abusive head trauma |
|
Transport |
|
|
Suicide |
|
|
Sports and recreation (SPAR) |
|
|
Assault |
|
|
Falls |
|
|
Hospitalization |
Abusive head trauma |
|
Transport |
|
|
SPAR |
|
|
Falls |
|
|
Assault |
|
|
Struck by or against |
|
|
Emergency Department |
Falls |
|
Transport |
|
|
SPAR |
|
|
Assault |
|
|
Struck by or against |
|
|
Sentinel Emergency Department |
Abusive head trauma |
|
Strollers |
|
|
Struck by a television |
|
|
Physical education |
|
|
School |
|
|
Hockey |
|
|
Tobogganing |
|
|
Rugby |
|
|
Assault |
|
|
Pedestrian |
|
|
Falls (in home) |
|
Figure 1.2: Causes of TBI over the life course, by data source and age group – females

Text description
This figure is a visual representation of the leading causes of deaths, hospitalizations and emergency department visits in relation traumatic brain injuries across the lifespan among females. A sentinel surveillance component is also provided in the figure, though the causes presented were chosen to highlight hazards that were identified in the Canadian Hospitals Injury Reporting and Prevention Program (CHIRPP) database.
On the left hand side of the figure are the four data sources used in this report. Each data source is presented as a row. From top to bottom, the order of the data sources are as follows: deaths, hospitalizations, emergency department visits and sentinel emergency departments. Corresponding to all data sources are nine columns, each representing a specific age group: Infants (<1 year), toddlers (1 year), pre-school (2-4 years), grade-school (5-9 years), young teens (10-14 years), older teens (15-19 years), young adults (20-39 years), middle age (40-64 years), seniors (65 years and over). A summary description is presented below:
Under the death category, abusive head trauma was one of the leading causes among infants aged less than one year, toddlers aged one year and pre-school children aged between two and four years. Transportation was one of the leading causes among infants aged less than one year, toddlers aged one year, pre-school children aged between two and four years, grade school aged between five and nine years, young teens aged between 10 and 14 years, older teens aged 15 to 19 years, young adults aged 20 to 39 years, middle age females between 40 and 64 years and seniors aged 65 years or older. Suicide was one of the leading causes among older teens aged 15 to 19 years, young adults aged 20 to 39 years, middle aged females between 40 and 64 years and seniors aged 65 years or older. Sports and recreational activities were one of the leading causes among young teens aged between 10 and 14 years and older teens aged 15 to 19 years. Assault was one of the leading causes among young adults aged 20 to 39 years. Falls were one of the leading causes among middle aged females between 40 and 64 years and seniors aged 65 years or older.
Under the hospitalization category, abusive head trauma was one of the leading causes among infants aged less than one year. Falls were one of the leading causes among infants aged less than one year, middle aged females aged between 50 and 64 years and seniors aged 65 years or older. Struck by or against was one of the leading causes among infants aged less than one year. Sports and recreational activities were one of the leading causes among grade school females aged between five and nine years, young teens aged between 10 and 14 years and older teens aged 15 to 19 years. Transportation was one of the leading causes among older teens aged 15 to 19 years, young adults aged 20 to 39 years, middle aged females between 40 and 64 years and seniors aged 65 years or older. Assault was one of the leading causes among older teens aged 15 to 19 years and young adults aged 20 to 29 years.
Under the emergency department category, falls were one of the leading causes among infants aged less than one year, toddlers aged one year, pre-school children aged between two and four years, grade school aged between five and nine years, young teens aged between 10 and 14 years, middle aged females between 50 and 64 years and seniors aged 65 years or older. Transportation was one of the leading causes among older teens aged 15 to 19 years, young adults aged 20 to 39 years, middle age females between 40 and 64 years and seniors aged 65 years or older. Sports and recreational activities were one of the leading causes among young teens aged between 10 and 14 years and older teens aged 15 to 19 years. Assault was one of the leading causes among older teens aged 15 to 19 years and young adults aged 20 to 29 years. Struck by or against was one of the leading causes among young teens aged between 10 and 14 years and older teens aged 15 to 19 years.
Under the sentinel emergency department category, abusive head trauma was one of the noted causes among infants aged less than one year and toddlers aged one year. Injuries involving strollers were one the noted causes among infants aged less than one year. Injuries involving individuals being struck by a television were noted among toddlers aged one year and pre-school children aged between two and four years. Injuries occurring during physical education and tobogganing were noted among grade school children aged between 5 and 9 years. Equestrian injuries were noted among young teens aged between 10 and 14 years. Hockey and ringette injuries were noted among young teens aged between 10 and 14 years, and older teens aged 15 to 19 years. Injuries occurring at school were noted among older teens aged 15 to 19 years. Rugby injuries were noted among older teens aged 15 to 19 years. Assaults were noted among young adults aged 20 to 39 years. Pedestrian-related injuries were noted among seniors aged 65 years or older. Falls occurring at home were noted among seniors aged 75 years or older.
| Data source | Cause of Traumatic Brain Injury | Age group |
|---|---|---|
Deaths |
Abusive head trauma |
|
Transport |
|
|
Suicide |
|
|
Sports and recreation (SPAR) |
|
|
Assault |
|
|
Falls |
|
|
Hospitalization |
Abusive head trauma |
|
Transport |
|
|
SPAR |
|
|
Falls |
|
|
Assault |
|
|
Struck by or against |
|
|
Emergency Department |
Falls |
|
Transport |
|
|
SPAR |
|
|
Assault |
|
|
Struck by or against |
|
|
Sentinel Emergency Department |
Abusive head trauma |
|
Strollers |
|
|
Struck by a television |
|
|
Physical education |
|
|
School |
|
|
Hockey |
|
|
Tobogganing |
|
|
Rugby |
|
|
Ringette |
|
|
Equestrian |
|
|
Assault |
|
|
Pedestrian |
|
|
Falls (in home) |
|
1. Introduction/Background
About this report
This report is the third in the Injury in Review series, with the first being Child and Youth Injury in Review, 2009 Edition: Spotlight on Consumer Product SafetyFootnote 1 and the second being Injury in Review, 2012 Edition: Spotlight on Road and Transport SafetyFootnote 2. Injury in Review, 2020 Edition: Spotlight on Traumatic Brain Injuries Across the Life Course presents current statistics on head injuries, with a focus on traumatic brain injuries (TBI), among Canadians from childhood and adolescence, to adulthood and the senior years.
The report is presented as follows: Introduction/background contains a summary of the burden of injury and provides a definition of TBI as well as a brief overview of current and classic literature on key topics such as repeat TBI (subconcussion, multiple concussions and second impact syndrome), sports-related concussion, recovery, postconcussion syndrome and differences between males and females. Methods and Appendices provide an overview of data sources and surveillance definitions. Data sources include:
- Statistics Canada’s Canadian Vital Statistics Death Database (CVS:D)
- The Canadian Institute for Health Information’s Hospital Morbidity Database (HMDB)
- The Canadian Institute for Health Information’s Discharge Abstract Database (DAD)
- The Canadian Institute for Health Information’s National Ambulatory Care Reporting System (NACRS)
- The Public Health Agency of Canada’s Electronic Canadian Hospitals Injury Reporting and Prevention Program (eCHIRPP)
Analyses of Statistics Canada and Canadian Institute for Health Information (CIHI) data are presented by sex, age and external cause (falls, suicide and self-harm, transport, sports and recreation, abusive head trauma, assaults, struck by/against, other).
Chapters 5–16 highlight the utility of sentinel surveillance in eCHIRPP to inform of injury prevention initiatives. Each chapter highlights a study focusing on a specific mechanism of head injuries and TBI. The mechanisms selected affect people at various points throughout the life course. The following topics are covered:
- TBI overall trends, 1990 to 2018
- Five most common sports and recreational activities leading to TBI/head injury
- Male organized ice hockey, legality of play
- Female organized ice hockey, legality of play
- Female organized rugby
- Bleachers and grandstands
- Television tip-overs
- Strollers
- TBI/head injury occurring in schools
- Seniors’ falls leading to TBI/head injury
- Motor vehicle-pedestrian collisions
- TBI/head injury associated with intentional injuries (self-harm and assault)
Finally, the report concludes with a discussion related to the overall patterns described, the gaps in current surveillance and how it might be improved moving forward.
The burden of injury
Injury is the leading cause of death among Canadians 1 to 44 years of age. In 2016 17,361 Canadians (47.9/100,000 population) died from their injuries. Of these, 72.1% (12,524 or 34.5/100,000) were unintentional injuries. Falls (12.9/100,000), poisonings (8.6/100,000) and motor vehicle collisions (5.7/100,000) were the leading causes of unintentional injury deathsFootnote 3. In the fiscal year (April 1 to March 31) 2017/18, 223,314 (784.7/100,000) Canadians (excluding those in Quebec) were hospitalized for their injuries, and of these, 199,784 (702.0/100,000) were unintentional injuries. Among unintentional injury hospitalizations, falls, suffocation and motor vehicle crashes were the most frequent causes at 396.8/100,000, 81.1/100,000 and 46.2/100,000, respectivelyFootnote 4. Preventable injuries cost Canadians more than $26.8 billion a year in direct and indirect costsFootnote 5.
Traumatic brain injury (TBI)
Traumatic brain injuries in particular are of special concern. If not fatal, TBI, even a mild form, can have serious long term consequencesFootnote 6Footnote 7Footnote 8. TBI ranges on a continuum of severity. Moderate to severe TBI can be diagnosed with objective tools (e.g. CT scan), while mild TBI cannot be similarly assessedFootnote 9. There is some ambiguity in the definition/classification at the mild end of the severity spectrumFootnote 9Footnote 10. Mild TBI (mTBI) has been defined by Belanger et alFootnote 9 as “disrupted brain functioning from any force to the head as evidenced by altered or lost consciousness, with various severity indices (length of coma, posttraumatic amnesia, or Glasgow Coma Scale score) that are of shorter duration or milder than more severe TBI”. The term concussion has been used to refer to a milder form of mTBI, but it is more often used interchangeably with mild TBI. In the most recent consensus statement on concussion in sportFootnote 12 a detailed sport-related concussion (SRC) definition is presented. In summary, a sports-related concussion is defined as “a traumatic brain injury induced by biomechanical forces caused by a direct blow to the head, face, neck or elsewhere on the body with an impulsive force transmitted to the head, resulting in rapid onset of short-lived impairment of neurologic function that resolves spontaneously”Footnote 12. The definition includes other features related to signs and symptoms, functional disturbance versus structural injury and loss of consciousness.
Repeat TBI (RTBI)
There are a number of related issues under the umbrella of repeat TBI: Subconcussion, multiple concussions and second impact syndrome.
Subconcussion
Although still a theoretical issue, subconcussive impacts (direct or inertial) are not associated with a known or diagnosed concussion and have been hypothesized to have possible negative effects long-term, particularly via cumulative impacts (as in the sports environment)Footnote 9Footnote 13Footnote 14Footnote 15. Broglio et al.Footnote 16, using instrumented helmets, have reported that males (16.7 ± 0.8 years) playing high school football received averages of between 372 and 868 head impacts (depending on position) over a 14-week season (one lineman received 2,235 head impacts). Wilcox et al.Footnote 17 similarly studied male and female ice hockey players. They found males sustained a median of 287 head impacts (interquartile range (IQR): 201.5-444.6) per season, while females received 170 (IQR: 119-230). Subconcussive impacts may also be an issue in assault-related TBI, abusive head trauma in infants, intimate partner violence (IPV) in older youth and adultsFootnote 18Footnote 19Footnote 20Footnote 21, and among military and prison populationsFootnote 22Footnote 23.
Multiple concussions
Multiple concussions can occur in many scenarios: abusive head trauma in infantsFootnote 19, intimate partner violence in adultsFootnote 20, seniors’ fallsFootnote 25, military and prison populationsFootnote 22Footnote 23 but much of the literature lies in the area of sports and recreational injuriesFootnote 24. Prins and GhizaFootnote 19 have indicated that the brain continues to develop into young adulthood (23 to 25 years) and have defined six “paediatric” age groups up to 25 years of age. They cite the statistic from the US Centers for Disease ControlFootnote 26 that there are an estimated 1.7 million brain injuries annually in the United States and that 51% of them occur to individuals whose brains are still developing. Many of these young people are at risk for repeat TBI. Anatomical and mechanical properties of the body and brain differ between developing and mature individuals27. In some cases the immature brain can confer resilience, in other instances the underlying physiological mechanisms of the developing brain make it more vulnerableFootnote 19Footnote 28. Research has shown that athletes with a history of concussion are susceptible to re-injuryFootnote 28Footnote 29. The long term effects of repetitive head injury in athletes have shown an increased risk of longer-term neurobehavioral and neuropathic sequelaeFootnote 28Footnote 30Footnote 31. The possible long-term negative effects of repeat TBI speaks to the importance of concussion management and return-to-play/return-to-learn guidelines, particularly for young athletesFootnote 12Footnote 24. The 2017 release of the evidence-based Canadian Guideline on Concussion in Sport which “…aims to ensure that athletes with a suspected concussion receive timely and appropriate care, and proper management to allow them to return to their sport”Footnote 32, is a step in this direction. Other important Canadian developments and legislation for enhancing concussion knowledge and practice are described below, and by Damji and BabulFootnote 33.
Second impact syndrome (SIS)
Second impact syndrome is a special case of multiple concussions whereby the concussions occur over a very short time period. Second impact syndrome occurs when a second concussion occurs before symptoms of a prior concussion have resolved. Diffuse and sometimes fatal cerebral edema is the outcome. It is a rare phenomenon and there is still some controversy as to its existence. Second impact syndrome mainly involves athletic children and young adultsFootnote 24Footnote 34.
The issue of second impact syndrome has recently been highlighted in the tragic 2013 death of 17 year old Rowan Stringer in Ottawa, OntarioFootnote 35Footnote 36Footnote 37Footnote 38. Rowan passed away following a concussion she received during a rugby match for her high school team. A Coroners’ Inquest into her death held in May 2015 concluded that the cause of death was malignant cerebral edema due to second impact syndrome, due to traumatic brain injury. She had likely suffered two previous concussions in two games within five days preceding the match during which she suffered the fatal injury. Her death and the results of the Inquest motivated her family to campaign for “Rowan’s Law” in Ontario. In 2016 in Ontario, Bill 149 Rowan’s Law Advisory Committee Act was enacted in the provincial legislature. It is “An Act to establish an advisory committee to make recommendations on the jury recommendations made in the inquest into the death of Rowan Stringer”Footnote 36. On March 7, 2018, Ontario’s Bill 193, Rowan’s Law (Concussion Safety) was passed, requiring sports organizations to address concussion safety in terms of a code of conduct, removal-from-sport protocol for athletes with suspected concussion, and a return-to-sport protocolFootnote 39.
Sport-related concussions and other external causes of TBI
Although TBI occur via other mechanisms as wellFootnote 26Footnote 40 incidents such as the death of Rowan Stringer, and other high profile cases involving concussions in the National Hockey League (NHL) (Sydney Crosby in particular) and the National Football League, have influenced the recent prioritization of sports-related brain injuries, particularly among children and youthFootnote 41Footnote 42Footnote 43Footnote 44Footnote 45Footnote 46Footnote 47. Although not frequent in all age groups, sports-related concussions are of special concern because the preponderance involves young people and the sports environment exposes these young people to repeated impactsFootnote 13Footnote 16. Other causes such as motor vehicle crashes or non-sport falls, while important, do not carry the same level of exposure to repeat impacts. Current research into sports-related concussions has looked at all sports and recreational activitiesFootnote 24Footnote 45Footnote 46 with a particular focus on high-impact team sports such as football and ice hockeyFootnote 24Footnote 47Footnote 48.
Recovery and post-concussion syndrome
The majority of individuals will recover fairly rapidly after mild TBIFootnote 49. However, Zemek et al. and othersFootnote 50Footnote 51 have found that almost one-third (31%) of children and adolescents will experience physical, cognitive or emotional symptoms more than 1 month after injury (post-concussion syndrome).
Differences between males and females
There is some evidence that females have an increased rate of concussion, may be more vulnerable to concussion and have more difficulty recovering after sustaining a concussion, compared to malesFootnote 50Footnote 51Footnote 52Footnote 53Footnote 54Footnote 55Footnote 56Footnote 57Footnote 58Footnote 59Footnote 60. The increasing participation of females in sportsFootnote 61Footnote 62 is likely driving some of the increase; however, this is still being investigated and reported in the literature, with different lines of research assessing differing biomechanical toleranceFootnote 17Footnote 53, anthropometry and neck strengthFootnote 55Footnote 57 and females being more likely to seek medical helpFootnote 52.
Overview and purpose
While sports-related concussions have recently made the headlines, TBI occurs more frequently by other mechanisms depending on age and sex. The range of severity of TBI varies across the different mechanisms—motor vehicle crashes and falls from significant heights can produce more severe TBI than sports due to the higher energies involved. At the same time, young people are disproportionately involved at the mild end of the severity spectrum, especially related to sports and recreation, where the risk of repeat impacts is higher.
The purpose of this report is to use multiple data sources to provide an overview of TBI among Canadians over the life course for all mechanisms of injury. Results from this report may be used to generate hypotheses for other studies, to highlight gaps in TBI/concussion surveillance and to help improve research and surveillance moving forward.
2. Methods part I: Mortality, hospitalization, and emergency department visits (ICD-10/ICD-10-CA coded databases)
This section provides an overview of the data sources used, surveillance definitions, external cause groupings, limitations and parameters for the analyses. Data sources will be described in two main sections based on coding structure. The first section presents analyses of data coded according to the International Statistical Classification of Diseases and Related Health Problems, Tenth Revision (ICD-10)Footnote 63 and the Canadian enhancement (ICD-10-CA)Footnote 64; the second on analyses of data coded from narrative injury descriptions in a sentinel surveillance system. In Canada, ICD-10 is the standard for reporting mortality data and ICD-10-CA is the standard for reporting morbidity data. ICD-10/ ICD-10-CA based analyses are presented in three sections: mortality, hospitalizations, and emergency department visits. In ICD-10, an injury case includes a code(s) for the external cause of injury (often called an E-code) and one or more diagnosis codes (N-codes). For example, a patient may have fallen and broken their hip and sustained a concussion. In this event the record would contain an E-code for a fall (W00-W19) and two N-codes, one for a hip fracture (S72) and one for the concussion (S06.0). The Canadian Hospitals Injury Reporting and Prevention Program (CHIRPP) database also captures emergency department visits, but is a sentinel system and is coded using a different structure, which includes narrative fields.
ICD-10/ICD-10-CA coded databases
External cause (EC)
Table 2.1 shows the external cause groupings used for this report. These groupings are clusters of specific causes related to leading traumatic brain injury (TBI) settings such as transportation or sports. Because sports and recreation (SPAR) is a special area of interest, all codes related to SPAR are grouped together (see Table A1 in Appendix A for a detailed listing of codes). For example, falls related to SPAR are grouped in the SPAR variable and not the general falls group, and bicycling and off-road vehicles are removed from the transport grouping and included in the SPAR grouping instead. This should be kept in mind when comparing findings from this report to other studies using the same data sources. All diagnoses fields in the databases were searched for any of these external cause codes. In the case of multiple external causes, a priority system was developed and is summarized Table 2.2.
| External cause | Variable name | ICD-10/ICD-10-CA codes |
|---|---|---|
| Assault | ASSAULT | X85-X99, Y00-Y09 |
| Other Intentional (self-harm) | OTH_INT | X60-X84 |
| Sports and Recreation (SPAR) | SPAR | See Table A1 in Appendix A for expanded detail |
| Transport (non-SPAR) | TRANSPORT | V01-V09; V20-V29; V30-V39; V40-V49; V50-V59; V60-V69; V70-V79; V80.1-V80.7; V81-V85; V87-V89; V90.0; V90.1; V91.0; V91.1; V92.0,V92.1; V93.0,V93.1; V94.0,V94.1; V95; V97.0, V97.1,V97.3,V97.8; V99 |
| Falls (non-SPAR) | FALLS | W00; W01; W03-W08; W10-W15Table 2.1 Footnote a; W17-W19 |
| Struck by/against (non-SPAR) | STRUCK | W20; W22.08,W22.09; W50; W51.08,W51.09; W52 |
| Other unintentional (non-SPAR) | ALLOTH_UI | W23-W46, W49; W53-W60; W64; W65-W66; W75-W84; W85-W99; X00-X09; X10-X19; X20-X29; X30-X39; X40-X49; X51-X57; X58-X59 |
| Event of undetermined intent | INT_UNDET | Y10-Y34 |
| Other External Cause | OTHEC | Y35-Y36 (legal interventions and operations of war) Y40-Y84 (Complications of medical and surgical care) |
| Sequelae and supplementary factors | SEQSUPP | Y85-Y89 (Sequelae of external causes of morbidity and mortality) Y90-Y98 (Supplementary factors related to causes of morbidity and mortality classified elsewhere) |
|
||
| Priority rank | External cause | Variable name | Comments |
|---|---|---|---|
| 1 | Assault | ASSAULT | N/A |
| 2 | Other intentional (self-harm) | OTH_INT | N/A |
| 3 | Sports and Recreation (SPAR) | SPAR | After intentional injuries, SPAR is the priority |
| 4 | Transport (non-SPAR) | TRANSPORT | N/A |
| 5 | Falls (non-SPAR) | FALLS | N/A |
| 6 | Struck by/against (non-SPAR) | STRUCK | N/A |
| 7 | All other Unintentional (non-SPAR) | ALLOTH_UI | N/A |
| 8 | Other External Cause/Sequelae and supplementary factors | OTHEC / SEQSUPP | N/A |
| 9 | Event of undetermined intent | INT_UNDET | N/A |
TBI surveillance definitions
I. Mortality
The TBI mortality surveillance definition chosen for this report is that used by the U.S. Centers for Disease Control and Prevention (CDC) as described by FaulFootnote 26 and is summarized in Table 2.3.
| Description | ICD-10 (Deaths) |
|---|---|
| Open wound of head | S01.0-S01.9 |
| Fracture of skull and facial bones | S02.0, S02.1, S02.3, S02.7-S02.9 |
| Injury of optic nerve and pathways | S04.0 |
| Intracranial injury | S06.0-S06.9 |
| Crushing injury of head | S07.0, S07.1, S07.8, S07.9 |
| Other and unspecified injuries of head | S09.7-S09.9 |
| Open wound involving head with neck | T01.0 |
| Fractures involving head with neck | T02.0 |
| Crushing injuries involving head with neck | T04.0 |
| Injuries of brain and cranial nerves with injuries of nerves and spinal cord at neck level | T06.0 |
| Sequelae of injuries of head | T90.1, T90.2, T90.4, T90.5, T90.8, T90.9 |
II. Morbidity
A number of options for TBI morbidity surveillance definitions were available. Table 2.4 provides detailed information on the definitions and differences between them; they are identified by their respective origins/authors as TBI_CDC (Centers for Disease Control and Prevention)Footnote 65, TBI_ON (developed for Ontario data)Footnote 66, TBI_AB (developed for Alberta data)Footnote 67, and TBI_FU (developed by Fu et al. using Ontario data)Footnote 68. In a test analysis of the first three options, all showed similar results and counts. The TBI_ON definition is the only one that includes F07.2 (postconcussal syndrome) and TBI_CDC is the only definition that includes injuries to the optic chiasm, optic tract and pathways and the visual cortex. The largest difference is the inclusion of the open wound of head and unspecified injury of head code sets in the TBI_FU definition. This results in much larger counts, particularly for ED visits. Figure 2.1 shows the components of the TBI_FU definition which are not included in the other definitions along with TBI_ON for comparison. It is possible that a proportion of the open wound and unspecified head injury cases were TBI. The differences are more apparent in the ED data compared to hospitalizations, likely because the majority of the open wound of head and unspecified injury of head cases were not admitted to hospital. The authors of the Fu et al. studyFootnote 68 justify the definition based on 30+ years of clinical experience. A validation study is currently underway, but since the validation was not completed prior to analyses for this report, TBI_ONFootnote 66 was chosen as the reporting definition.
| TBI definition | Variable | ICD-10 codes included |
|---|---|---|
| Hedegaard H, et al. (2016)Footnote 4 | TBI_CDC | S02.0, S02.1, S02.8, S02.91, S04.02, S04.03, S04.04, S06.0-S06.9, S07.1, T74.4 |
| Chen AY & Colantonio A (2011)Footnote 5 | TBI_ON | F07.2, S02.0, S02.1, S02.3, S02.7, S02.8, S02.9, S06.0-S06.9, S07.1, T90.2, T90.5 |
| Drul C (2017)Footnote 6 | TBI_AB | S02.0-S02.101, S02.7-S02.701, S02.890-S02.901, S06.0-S06.99, S07.1-S07.9, T02.00-T02.01, S06.000-S06.099 |
| Fu T, et al. (2016)Footnote 7 | TBI_FU | S01.7, S01.8, S01.9, S02.0, S02.1, S02.7, S02.8, S02.9, S06.0-S06.9, S07.1, S07.8, S07.9, S09.7, S09.8, S09.9, T02.0, T04.0, T06.0, T90.2, T90.5, T90.8, T90.9 |
Figure 2.1: Frequency of TBI emergency department presentations based on components of the case definition by Fu et alFootnote 68 (TBI_FU), compared to the definition used in this report (TBI_ON)Footnote 66, 2016/17, both sexes
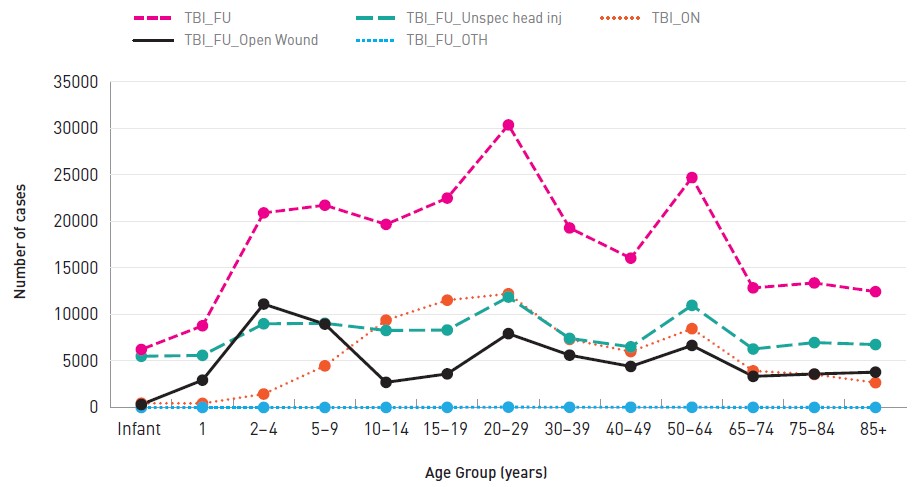
Source: Public Health Agency of Canada analysis of Canadian Institute for Health Information data (NACRS).
Text description
| Age Group | TBI_FU | TBI_FU_Open Wound | TBI_FU_Unspec head inj | TBI_FU_OTH | TBI_ON |
|---|---|---|---|---|---|
| <1 | 6,235 | 317 | 5,502 | 0 | 459 |
| 1 | 8,781 | 2,937 | 5,605 | 3 | 436 |
| 2-4 | 20,914 | 11,118 | 8,997 | 3 | 1,445 |
| 5-9 | 21,741 | 8,963 | 9,047 | 2 | 4,475 |
| 10-14 | 19,681 | 2,700 | 8,278 | 4 | 9,384 |
| 15-19 | 22,507 | 3,611 | 8,326 | 12 | 11,533 |
| 20-29 | 30,372 | 7,937 | 11,870 | 37 | 12,218 |
| 30-39 | 19,298 | 5,624 | 7,425 | 24 | 7,322 |
| 40-49 | 16,050 | 4,408 | 6,517 | 25 | 6,012 |
| 50-64 | 24,717 | 6,668 | 10,976 | 24 | 8,471 |
| 65-74 | 12,855 | 3,345 | 6,283 | 9 | 3,932 |
| 75-84 | 13,385 | 3,598 | 6,977 | 6 | 3,556 |
| 85+ | 12,451 | 3,799 | 6,764 | 4 | 2,668 |
Data sources and extraction
I. Mortality
The most recent 15 calendar years (2002 to 2016) of mortality data were obtained from the Canadian Vital Statistics Death Database (CVS:D, Statistics Canada)Footnote 69. The CVS:D is an administrative survey that collects demographic and medical (cause of death) information annually from all provincial and territorial vital statistics registries on all deaths in Canada. From 2000 to present, data are coded in ICD-10. It should be noted that CVS:D does not incorporate the Canadian enhancement of ICD-10 (ICD-10-CA) and therefore some forth digit Canadian codes required grouping.
Cases where any of the 20 diagnosis fields contained an external cause code from Chapter XX (external causes of morbidity and mortality, V01-Y98)Footnote 63Footnote 64 were considered an injury death regardless of the cause of death. The TBI surveillance definition was applied to this extracted dataset. In compliance with the Statistics Canada disclosure control strategyFootnote 70, the counts have been rounded using a controlled rounding process.
II. Hospitalizations
Throughout this report, hospitalization statistics are presented according to a 12-month fiscal year beginning April 1 and ending March 31 the following year. The data source is part of an administrative system that reports on this fiscal year rather than the calendar year. Hospitalizations in Canada are traditionally reported based on fiscal year.
For the fiscal years 2006/07 to 2010/11, hospitalization data were obtained from the Public Health Agency of Canada's holdings of the Hospital Morbidity Database (HMDB, Canadian Institute for Health InformationFootnote 71), launched in 1994/95. The HMDB is a national data holding that captures administrative, clinical and demographic information on inpatient separations from acute care hospitals. The HMDB also contains pan-Canadian acute care data, Quebec day surgery data as of 2012/13 and provides national discharge statistics from Canadian health care institutions by diagnoses and procedures. For fiscal years 2011/12 to 2017/18 hospitalization data were obtained from the Discharge Abstract Database (DAD, Canadian Institute for Health InformationFootnote 72). Originally developed in 1963, the DAD captures administrative, clinical and demographic information on hospital discharges (including deaths, sign-outs and transfers). Some provinces and territories also use the DAD to capture day surgery. Data are received directly from acute care facilities or from their respective health/regional authority or ministry/department of health. Facilities in all provinces and territories except Quebec are required to report to the DAD.
Cases were extracted if any of the 25 diagnosis fields contained an external cause from Chapter XX (external causes of morbidity and mortality, V01-Y98)Footnote 63Footnote 64. From this extracted set, all head injuries were identified (codes S00-S09) and then the TBI_ON surveillance definition was applied to the extracted dataset (for patients with any head injury). Counts between 1 and 9 are suppressed and other counts which would allow calculation of the suppressed counts are also not reportedFootnote 73. Due to the large level of stratification for the analysis in this report, cases where sex is coded as other or unknown are excluded for the relevant tables and figures.
III. Emergency department visits
Throughout this report, emergency department statistics (from CIHI) are presented according to a 12-month fiscal year beginning April 1 and ending March 31 the following year; CIHI's emergency department statistics are traditionally reported as such. Emergency Department data were obtained from The National Ambulatory Care Reporting System (NACRS)Footnote 74Footnote 75. NACRS contains data for all hospital-based and community-based ambulatory care: day surgery, outpatient and community-based clinics and emergency departments. Currently only Ontario, Alberta and Yukon have complete coverage. For this report only Ontario and Alberta data were analysed. Cases were extracted if any of the 10 diagnosis fields contained an external cause from Chapter XX (external causes of morbidity and mortality, V01-Y98)Footnote 1Footnote 2. From this extracted set, all head injuries were identified (codes S00-S09) and then the TBI_ON surveillance definition was applied to the extracted dataset (for patients with any head injury). Counts between 1 and 9 are suppressed and other counts which would allow calculation of the suppressed counts are also not reportedFootnote 73. Due to the large level of stratification for the analysis in this report, cases where sex is coded as other or unknown are excluded for the relevant tables and figures.
Limitations
CVS:D
The CVS:D mortality database has about a two to three year reporting lag. TBI-related deaths are usually due to higher energy mechanisms and are not useful for studying the mild end of the TBI severity spectrum. The CVS:D does not use the Canadian version of ICD-10 (ICD-10-CA) and thus some fourth digit codes are not available (as they are with HMDB/ DAD and NACRS data). Since Statistics Canada provides rounded counts, there can be a large relative maximum error associated with low countsFootnote 70.
HMDB/DAD/NACRS
The DAD does not contain Quebec data beyond 2010/11 and NACRS only contains full coverage for Ontario, Alberta and Yukon. Although all external causes with a SPAR code were isolated (Table A1), an unknown proportion of true SPAR cases are not identifiable and are likely contained in the non-SPAR codes. Refer to the footnotes in Appendix A (Table A1) for more details on limitations with some codes. Also, some cases of off-road vehicle use coded as a SPAR are actually non-recreational (occupational or transport).
Concussions and other mild TBI are not fully captured in hospitalization and ED data (and some injured persons do not seek medical care and go unreported) and thus the data sources used in this report do not provide the complete picture. As was recently shown by Zemek et al.Footnote 76 physician office visits for concussion have risen sharply since 2010 and some data have shown a trend towards individuals seeking primary care at other pointsFootnote 77. Continued improvements in surveillance will be required to more accurately track TBI cases to assess burden and cause.
Statistics and analysis
CVS:D
The main variables analyzed are age, sex, year, external cause (EC) and TBI Deaths. The life course will be represented by 13 age groups (years): infants (<1), 1, 2 to 4, 5 to 9, 10 to 14, 15 to 19, 20 to 29, 30 to 39, 40 to 49, 50 to 64, 65 to 74, 75 to 84 and 85+. Results are presented descriptively as rates and proportions. Statistics Canada population estimates (October 1) are used to calculate age-specific rates per 100,000 population. For trend analysis, rates are standardized to the 2011 Canadian population (direct method) and are quantified using average annual percent change (AAPC) or annual percent change (APC)Footnote 78. Rates are calculated based on the rounded counts and 95% confidence intervals are calculated assuming a Poisson distribution. The coefficient of variation (CV) is calculated based on a Poisson distribution and rates based on a CV > 33.3% (N<10) are not reported (#); those with a CV between 16.6% and 33.3% (10<=N<=36) are reported but flagged to interpret with caution (E) in Tables B1 and B2 (Appendix B)Footnote 70Footnote 73Footnote 79Footnote 80Footnote 81.
HMDB/DAD/NACRS
The main variables analyzed are age, sex, year, external cause (EC), TBI (TBI_ON), all head injuries and concussion only. The life course will be represented by 13 age groups (years): infants (<1), 1, 2 to 4, 5 to 9, 10 to 14, 15 to 19, 20 to 29, 30 to 39, 40 to 49, 50 to 64, 65 to 74, 75 to 84 and 85+. Results are presented descriptively as rates and proportions. Statistics Canada population estimates (October 1) are used to calculate age-specific rates per 100,000 population. For trend analysis, rates are standardized to the 2011 Canadian population (direct method). Denominators for rate calculations are adjusted for the differing provincial participation in the morbidity data. Trends are quantified using annual percent change (APC)Footnote 78. Since the data contain multiple admissions for the same person, confidence intervals are not calculatedFootnote 73Footnote 80Footnote 81.
3. Methods part II: Sentinel surveillance of emergency department visits, Canadian hospitals injury reporting and prevention program (CHIRPP/eCHIRPP)
CHIRPP: Background and TBI surveillance methodology
CHIRPP description
The Canadian Hospitals Injury Reporting and Prevention Program (CHIRPP) is a sentinel surveillance system which captures cases of injuries and poisonings presenting to select emergency departments across Canada. The system was established as a paediatric system in 1990 and is currently (as of 2019) operating in a network of eleven paediatric and eight general hospitals. The network was designed as a sentinel system to fill the gaps in injury surveillance by capturing details about the injury event, via narrative fields and other variables, that were not available in population- based, ICD-coded systems at the time (Canadian Vital Statistics Death Database, CVS:D and Hospital Morbidity Database/Discharge Abstract Database; HMDB/DAD). This information is useful to inform injury prevention and mitigation initiativesFootnote 82Footnote 83Footnote 84. The eCHIRPP is funded and administered by the Public Health Agency of Canada (PHAC).
Historical changes
In 1996/97 the system underwent a conversion to an Oracle® platform along with the rolling up and addition/deletion of numerous codes. The system was evaluated in 2001Footnote 85 and in 2010/11 CHIRPP underwent a modernization to its current, more electronic formFootnote 84. The current CHIRPP is a web-based system developed and supported by PHAC’s Canadian Network for Public Health Intelligence (CNPHI)Footnote 86Footnote 87 which allows for more efficient and timely data collection along with the availability of various communications and analysis tools. In this report, data from the period following this electronic conversion are referred to as eCHIRPP data while earlier data are designated as CHIRPP data.
A number of enhancements are currently (as of 2019) being incorporated into the eCHIRPP system. Injury syndromics or early warnings are a system of built-in rules to signal rare events or to detect deviations from historically expected values. Due to the high frequency of sports and recreation (SPAR) injuries among children and youth, an expanded code set of such injuries, based on the International Classification of External Causes of Injury (ICECI) Sports ModuleFootnote 88, has also been implemented.
Limitations and methodological issues
Representativeness
Although the CHIRPP was not designed to be population-based, and has often been misinterpretedFootnote 89, a number of investigators have nevertheless been interested in its representativeness, sensitivity and qualityFootnote 90Footnote 91Footnote 92Footnote 93Footnote 94Footnote 95Footnote 96Footnote 97. Pickett et al.Footnote 91 compared CHIRPP to the results of a population-based survey (Health Behavior in School-aged Children) with two subsets of CHIRPP data and found that the three datasets identified similar priorities for youth injury prevention. Macpherson et al.Footnote 92 compared data from the Ottawa CHIRPP site (Children’s Hospital of Eastern Ontario) to those from six temporary expansion sites in the Ottawa region (one-year population-based collection). The overall sensitivity of CHIRPP was 43% of all treated injuries and 57% of injuries treated at emergency departments. The CHIRPP was less likely to be representative for older children and more likely to capture children with more severe injuries. The limitations related to using CHIRPP for representing population-based injury remain fairly stable over time. Kang et al.Footnote 93 compared regional health administrative data in Calgary, Alberta to CHIRPP and found that CHIRPP was representative of sports and recreational injuries in Calgary. Butler et al.Footnote 97 found that seriously injured patients and incidents of self-harm or drugs were under-represented at the CHIRPP Halifax, Nova Scotia site (IWK Health Centre).
Another characteristic of the CHIRPP is that it operates as a surveillance system on two levels—nationally and locally. In the case of the two CHIRPP Kingston (Ontario) sites, complete community emergency department coverage is achieved and rates can be calculated using census dataFootnote 98.
Because most of the CHIRPP hospitals are paediatric (usually located in major cities), certain groups are under- represented in the data, including rural inhabitants (including some Aboriginal peoples), older teens and adults. Also, while CHIRPP captures information on people who are dead-on-arrival at the hospital, those who died at the scene or later in hospital are not included. Patients who bypass the ED registration desk for immediate treatment may not be captured as well as those who do not complete an Injury/Poisoning Reporting form. The median CHIRPP capture rate is 83% [interquartile range (IQR) 66% to 98%].
Normalization and internal comparisons
Due to the above limitations, CHIRPP analyses do not include population rates (e.g., injury rates/100,000 persons in the general population). Instead, relative comparisons are made within the systemFootnote 89Footnote 99Footnote 100. For example, if studying sports-related traumatic brain injury (TBI), rugby-related brain injuries as a proportion of all rugby injuries can be compared to the same ratio for other team sports (for a given age range and sex over the same time period) within the CHIRPP or eCHIRPP database. This way the results are not dependent on having a sports participation denominator. Age, sex and trend data are expressed as a normalized frequency relative to system denominators (not population denominators). Proportionate Injury Ratios (PIR) have also been used to compare CHIRPP data internallyFootnote 101Footnote 102.
Sentinel surveillance of head injuries and traumatic brain injuries
Methods
Overview of studies
This report presents findings from a series of brief studies using CHIRPP and/or eCHIRPP data; the topics of these studies are shown in (Table 3.1). The studies highlight a variety of TBI injury mechanisms across the life course. Each study brings to light the extra level of detail that is provided by the CHIRPP sentinel system compared to ICD-coded sources. CHIRPP studies, when used alone or in combination with information from other sources can be used to inform injury prevention initiatives.
| Study | Years | Age range (years) | Sex |
|---|---|---|---|
| TBI overall trends, 1990 to 2018 | 1990 to 2018 | All ages | Both |
| Five most common sports and recreational activities leading to TBI/head injury | 2011 to 2017 | 5 to 19 | Both |
| Male organized ice hockey, legality of play | 2011 to 2017 | 10 to 19 | Males |
| Female organized ice hockey, legality of play | 2011 to 2017 | 10 to 19 | Females |
| Female organized rugby | 2011 to 2017 | 14 to 19 | Females |
| Bleachers and grandstands | 2007 to 2017 | All ages | Both |
| Television tip-overs | 2011 to 2017 | 0 to 9 | Both |
| Strollers | 2011 to 2017 | < 5 | Both |
| Occurring in schools | 2007 to 2017 | 5 to 17 | Both |
| Seniors’ falls | 2011 to 2017 | 65+ | Both |
| Motor vehicle-pedestrian collisions | 2011 to 2017 | All Ages | Both |
| Intentional injuries (self-harm and assaults) | 2011 to 2017 | All ages | Both |
CHIRPP surveillance definition for traumatic brain injury (TBI_CHIRPP)
Similar to the previous sections with respect to mortality (CVS:D), hospitalizations (HMDB/DAD) and ambulatory care (NACRS), a surveillance definition was developed to capture all potential TBI cases. Since the diagnosis codes in CHIRPP are much less specific than ICD-10 codes, a separate TBI surveillance definition for CHIRPP (TBI_CHIRPP) was developed. Table 3.2 contains the codes used to create the definition. CHIRPP contains a set of codes (of increasing severity) for brain injury: minor (closed) head injury, concussion and intracranial injury. The nature of injury code NI42 captures diagnosed concussions while NI43, intracranial injuries, identifies more serious (structural damage) brain injuries. Minor closed head injury (or minor head injury, NI41) is a code that was added to CHIRPP in 1996. Prior to that date these cases were coded as concussions (which many likely were). In these incidents there was a mechanism which could have produced a concussion and some symptoms of concussion but in the opinion of diagnosing physicians, was insufficient (at the time) to be classified as a concussionFootnote 98Footnote 103Footnote 104Footnote 105Footnote 106.
| CHIRPP codeTable 3.2 Footnote a | Description | Details |
|---|---|---|
| NI41 | Minor (Closed) Head Injury | Composed of undiagnosed concussions and subconcussive mechanisms |
| NI42 | Concussion | Diagnosed in ED |
| NI43 | Intracranial | Moderate to severe brain injuries |
| NI12 | Fractures | N/A |
| NI18 | Crushing injury | N/A |
| BP110 | Skull and scalp | N/A |
| BP120 | Face | N/A |
|
||
Analysis at PHAC has shown that the use of code NI41 has changed over time and varies by CHIRPP centre. Thus for the purposes of the present analysis the three codes for brain injuries are combined in the surveillance definition to increase sensitivity. CHIRPP allows for the capture of three distinct injuries per patient record, with the first reported injury being the most serious. The CHIRPP TBI surveillance definition is defined as one of the following injuries in any of the three injury fields:
TBI_CHIRPP: minor closed head injury (NI41) or concussion (NI42) or intracranial injury (NI43) or skull fracture (BP110*NI12) or crushing injury to the skull (BP110*NI18) or a facial fracture (BP120*NI12) or crushing injury to the face (BP120*NI18)
All head injuries
For comparison and context purposes all head injuries are also reported. A head injury case was one where any of the three body part fields contained a code for the head as the body part injured (between BP100 and BP199).
Analyses
All analyses were conducted using SAS Enterprise Guide version 5.1, SAS PC version 9.3 (SAS Institute Inc., Cary, NC, USA) and Microsoft Excel 2010 (Redmond, WA).
Normalization
Age, sex and trend data were normalized using proportions relative to the total number of records in the database for the given age, sex or year. In general:
Proportion = (injury N / total eCHIRPP N) *100,000
presented as the number per 100,000 CHIRPP/eCHIRPP casesFootnote 89Footnote 99Footnote 100.
APC
Where applicable, time trends were quantified using Annual Percent Change (APC)Footnote 107. Confidence intervals (CI) are calculated and the trend is described as increasing (or rising) if the CI is positive and does not contain zero, stable if the CI contains zero, and decreasing (or falling) if the CI is negative and does not contain zero.
Narrative analysis
Data mining syntax (PERL regular expressions)Footnote 108 or the SAS INDEX function was used when assessing narrative text.
Week number
Where applicable, week number was calculated using the SAS WEEK functionFootnote 109 using the ‘U’ option (week starts on a Sunday).
4. Results: Mortality, hospitalization and emergency department visits (ICD-10/ICD-10-CA coded databases)
Mortality
Overview, age and sex distribution and annual trend
Overall, between 2002 and 2016 there were 235,471 injury deaths and of those 53,200 (22.6%) were associated with a traumatic brain injury (TBI) diagnosis. Of the 53,200 TBI deaths, 37,070 (69.7%) were males. Figure 4.1 shows the percentage of all injury deaths that were TBI-related by age group and sex. Among males, percent TBI ranged from 16.9% for those 30–39 years of age to 36.3% among 75–84 year olds (with an overall average of 27.1%). The widest age span with the highest proportion occurs among males 65 years and older with an average of 33% (SD = 3.9).
For females percent TBI ranged from 12.1% among those 40–49 years to 36.4% for 5 to 9 year olds, with an overall average of 22.5%. The age range with the highest span was from 1 to 9 years, with an average of 36.1% (SD = 0.3).
Figure 4.1: Percentage of all injury deaths with an associated traumatic brain injury diagnosis, by age and sex, all external causes, Canada, 2002 to 2016
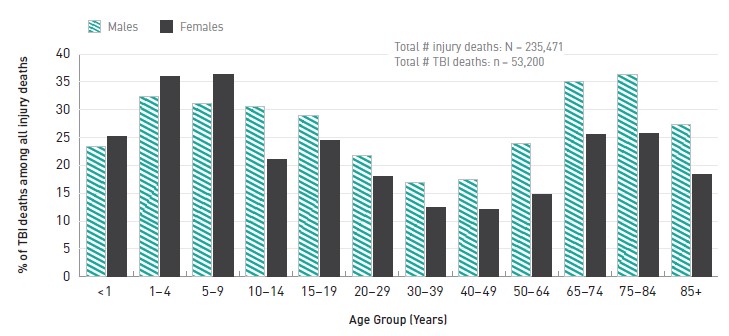
Source: Public Health Agency of Canada analysis of Statistics Canada mortality data (CVS:D).
Note: Only 12 age groups were available when extracting data presented in Figure 4.1.
Text description
| Age Group | Males | Females |
|---|---|---|
| <1 | 23.4 | 25.2 |
| 1-4 | 32.4 | 35.9 |
| 5-9 | 31.1 | 36.4 |
| 10-14 | 30.5 | 21.0 |
| 15-19 | 29.0 | 24.5 |
| 20-29 | 21.7 | 18.1 |
| 30-39 | 16.9 | 12.5 |
| 40-49 | 17.4 | 12.1 |
| 50-64 | 24.0 | 14.8 |
| 65-74 | 35.1 | 25.5 |
| 75-84 | 36.3 | 25.8 |
| 85+ | 27.4 | 18.3 |
|
||
Figure 4.2 shows the age-standardized annual trend for TBI deaths for both males and females. Overall, for males there was a slight annual decrease of 1.1% while for females there was a slight increase of 0.5% per year.
Figure 4.2: Traumatic brain injury-related mortality in Canada, 2002 to 2016, by sex, all external causes, standardized rates/100,000 persons
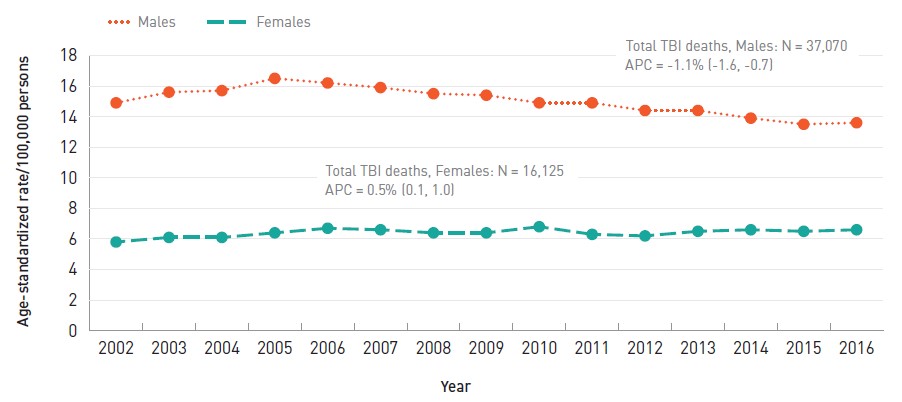
Source: Public Health Agency of Canada analysis of Statistics Canada mortality data (CVS:D).
Note: Rates are standardized to the 2011 Canadian population.
Text description
| Year | Males | Females |
|---|---|---|
| 2002 | 14.9 | 5.8 |
| 2003 | 15.6 | 6.1 |
| 2004 | 15.7 | 6.1 |
| 2005 | 16.5 | 6.4 |
| 2006 | 16.2 | 6.7 |
| 2007 | 15.9 | 6.6 |
| 2008 | 15.5 | 6.4 |
| 2009 | 15.4 | 6.4 |
| 2010 | 14.9 | 6.8 |
| 2011 | 14.9 | 6.3 |
| 2012 | 14.4 | 6.2 |
| 2013 | 14.4 | 6.5 |
| 2014 | 13.9 | 6.6 |
| 2015 | 13.5 | 6.5 |
| 2016 | 13.6 | 6.6 |
APC: Annual percent change
|
||
Figure 4.3 shows the age-specific rates of TBI deaths for both males and females over the life course. Rates began to rise slightly after age 14 and then rise sharply among those 65 years and older, and increased to the highest rate among those 85 years and older (155.7/100,000 for males and 84.8/100,000 for females).
Figure 4.3: Traumatic brain injury-related mortality in Canada, 2002 to 2016, by age group and sex, all external causes, age-specific rates/100,000 persons
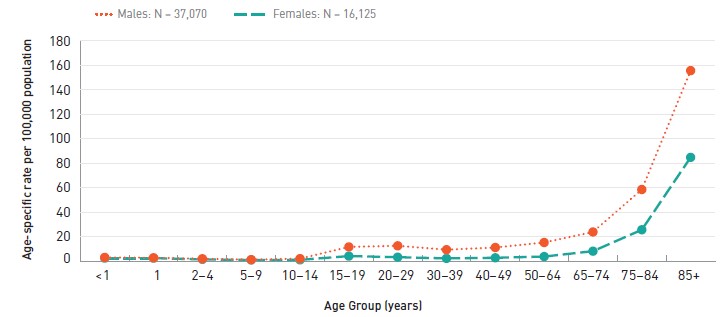
Source: Public Health Agency of Canada analysis of Statistics Canada mortality data (CVS:D).
Text description
| Age Group | Males | Females |
|---|---|---|
| <1 | 3.0 | 2.4 |
| 1 | 2.7 | 2.4 |
| 2-4 | 1.9 | 1.4 |
| 5-9 | 1.2 | 0.9 |
| 10-14 | 2.0 | 1.0 |
| 15-19 | 11.6 | 4.1 |
| 20-29 | 12.5 | 3.2 |
| 30-39 | 9.3 | 2.2 |
| 40-49 | 11.1 | 2.7 |
| 50-64 | 15.2 | 3.7 |
| 65-74 | 23.8 | 8.1 |
| 75-84 | 58.5 | 25.6 |
| 85+ | 155.7 | 84.8 |
|
||
External cause
Figures 4.4 and 4.5 show the rates of TBI-associated deaths by age group and five external causes for males and females, respectively (data for all causes can be found in Appendix B). Note that due to higher rates, falls are shown on a secondary panel for both figures 4.4 and 4.5.
For males (Figure 4.4) the TBI-associated age-specific death rates for assaults and sports and recreation (SPAR) remained below 1.5/100,000 throughout the life course. The rates for transport showed a first peak among 15 to 19 year old males at 6.6/100,000, a drop to 2.7/100,000 among adults aged 50 to 64 years and then they rose again to 7.3/100,000 for those aged 85 years and older. The rates for suicide rose linearly from those for adolescents aged 15 to 19 years (2.3/100,000) to a high for 75 to 84 year olds (6.0/100,000). The fall rate among males began to rise at age 50 and climbed to 118.7/100,000 among those aged 85 years and older.
Figure 4.4: Traumatic brain injury-related mortality in Canada, by age group and external cause, 2002 to 2016, males, age-specific rates/100,000 persons
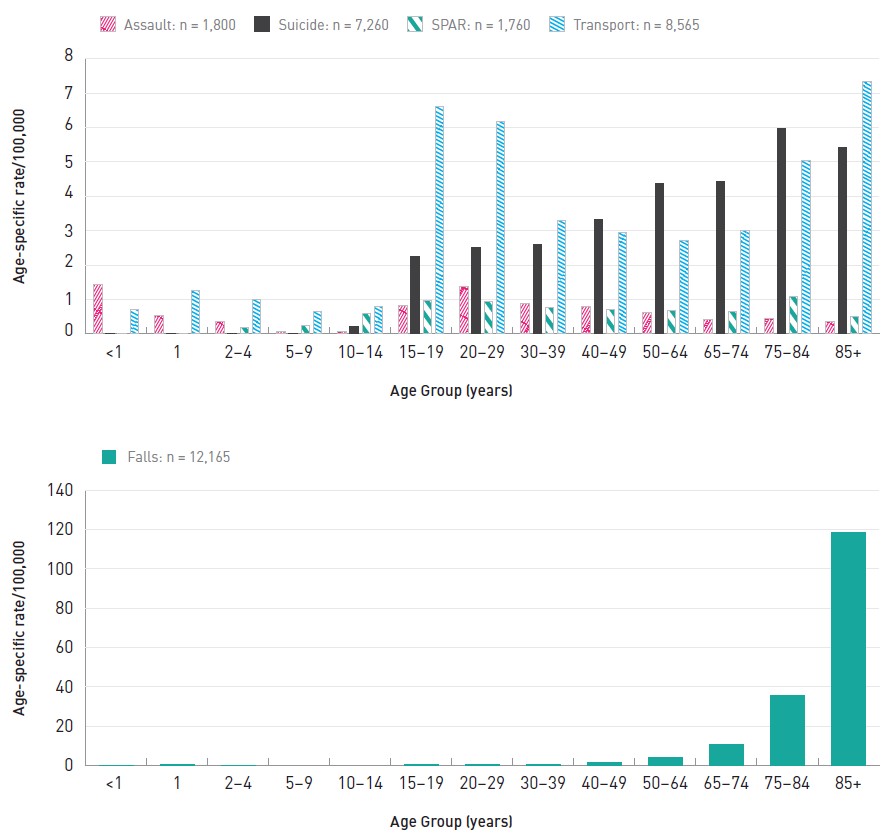
Source: Public Health Agency of Canada analysis of Statistics Canada mortality data (CVS:D).
Note: Some rates are not reported. See Chapter 2 and Appendix B for further detail.
SPAR: Sports and recreation
Text description
| Age Group | Assault | Suicide | Sports and recreation | Transport | Age Group | Falls |
|---|---|---|---|---|---|---|
| <1 | 1.43 | 0.00 | 0.00 | 0.71 | <1 | - |
| 1 | 0.54 | 0.00 | 0.00 | 1.25 | 1 | 0.36 |
| 2-4 | 0.36 | 0.00 | 0.18 | 1.01 | 2-4 | 0.12 |
| 5-9 | 0.07 | 0.00 | 0.24 | 0.66 | 5-9 | - |
| 10-14 | 0.07 | 0.23 | 0.59 | 0.81 | 10-14 | - |
| 15-19 | 0.83 | 2.26 | 0.98 | 6.61 | 15-19 | 0.30 |
| 20-29 | 1.38 | 2.52 | 0.94 | 6.18 | 20-29 | 0.57 |
| 30-39 | 0.88 | 2.61 | 0.76 | 3.29 | 30-39 | 0.63 |
| 40-49 | 0.81 | 3.34 | 0.71 | 2.96 | 40-49 | 1.69 |
| 50-64 | 0.63 | 4.38 | 0.68 | 2.72 | 50-64 | 4.07 |
| 65-74 | 0.43 | 4.44 | 0.66 | 3.01 | 65-74 | 10.48 |
| 75-84 | 0.44 | 5.98 | 1.08 | 5.05 | 75-84 | 35.63 |
| 85+ | 0.35 | 5.42 | 0.52 | 7.34 | 85+ | 118.68 |
For females (Figure 4.5) the TBI-associated age-specific death rates for assaults, SPAR and suicide remained at 1.3/100,000 or lower across the life course. Similar to males, the rates for transport deaths among females first peaked at 15 to 19 years (3.0/100,000) and then again at 75 years and older (2.4-2.5/100,000). The rate of deaths resulting from falls among females began to rise at age 65 and climbed to a maximum of 69.9/100,000 among those 85 years and older.
Figure 4.5: Traumatic brain injury-related mortality in Canada, by age group and external cause, 2002 to 2016, females, age-specific rates/100,000 persons
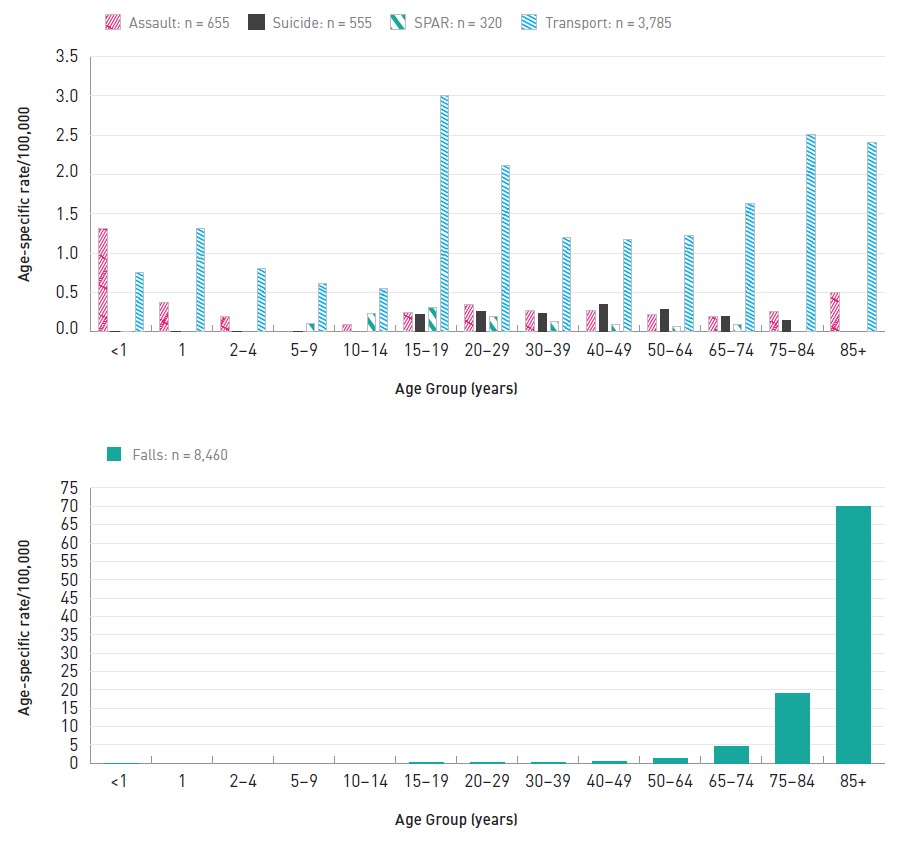
Source: Public Health Agency of Canada analysis of Statistics Canada mortality data (CVS:D).
Note: Some rates are not reported. See Chapter 2 and Appendix B for further detail.
SPAR: Sports and recreation
Text description
| Age Group | Assault | Suicide | Sports and recreation | Transport | Age Group | Falls |
|---|---|---|---|---|---|---|
| <1 | 1.32 | 0.00 | 0.00 | 0.75 | <1 | 0.00 |
| 1 | 0.38 | 0.00 | - | 1.32 | 1 | - |
| 2-4 | 0.19 | 0.00 | - | 0.81 | 2-4 | - |
| 5-9 | - | 0.00 | 0.11 | 0.62 | 5-9 | - |
| 10-14 | 0.10 | - | 0.24 | 0.55 | 10-14 | - |
| 15-19 | 0.25 | 0.22 | 0.31 | 3.01 | 15-19 | 0.13 |
| 20-29 | 0.35 | 0.26 | 0.19 | 2.11 | 20-29 | 0.10 |
| 30-39 | 0.27 | 0.24 | 0.13 | 1.20 | 30-39 | 0.14 |
| 40-49 | 0.27 | 0.35 | 0.09 | 1.17 | 40-49 | 0.40 |
| 50-64 | 0.22 | 0.28 | 0.07 | 1.22 | 50-64 | 1.22 |
| 65-74 | 0.20 | 0.20 | 0.10 | 1.63 | 65-74 | 4.63 |
| 75-84 | 0.26 | 0.15 | - | 2.51 | 75-84 | 19.10 |
| 85+ | 0.50 | - | - | 2.41 | 85+ | 69.88 |
Hospitalizations (HMDB/DAD)
Overview and annual trend
Overall, between 2006/07 and 2017/18 there were 399,376 hospitalizations for head injuries (excluding Quebec for 2011/12 to 2017/18), 63% (251,504) were for males. Among these 251,504 head injuries, 58.2% were TBI and of those, 14.9% had a concussion diagnosis. Of the 147,872 head injuries among females, 52.5% were TBI and of those, 16.8% had a concussion diagnosis.
Figures 4.6 and 4.7 show the trend in hospitalizations for TBI, concussions and all head injuries between 2006/07 and 2017/18.
For females, all head injuries and TBI showed a slight increase of 0.5% and 2.0%, per year, respectively while concussions have remained stable. Over the 12 year period all head injury rates ranged from 77.3/100,000 to 85.6/100,000, TBI from 38.6/100,000 to 47.8/100,000, and concussions from 6.3/100,000 to 7.7/100,000.
For males, all head injuries showed a slight falling trend of 0.9% per year while TBI remained stable and concussions showed a slight falling trend of 1.9% per year. Over the 12 year period all head injury rates ranged from 133.7/100,000 to 149.6/100,000, TBI from 80.0/100,000 to 84.2/100,000 and concussions from 10.5/100,000 to 15.4/100,000.
Figure 4.6: Head injury-related hospitalization in Canada, 2006/07 to 2017/18, females, standardized rates/ 100,000 persons
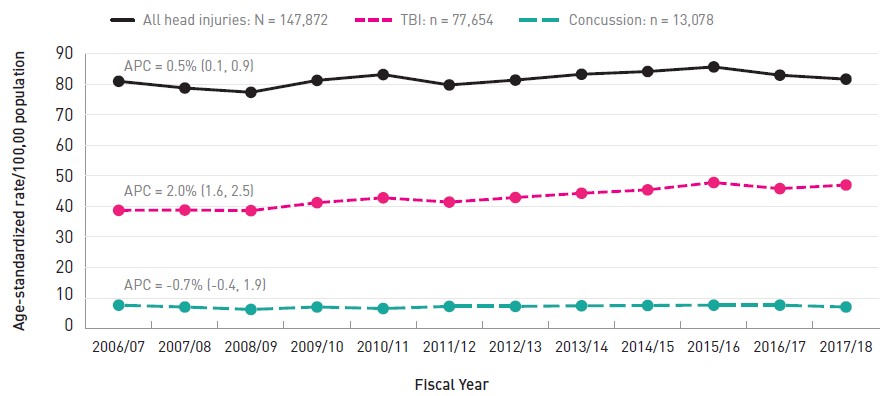
Source: Public Health Agency of Canada analysis of Canadian Institute for Health Information data (HMDB: Canada, 2006/07 to 2010/11; DAD: Canada, excluding Quebec, 2011/12 to 2017/18).
Note: Rates are standardized to the 2011 Canadian population.
Text description
| Fiscal Year | All head injuries | TBI | Concussion |
|---|---|---|---|
| 2006/07 | 80.9 | 38.7 | 7.7 |
| 2007/08 | 78.7 | 38.8 | 7.1 |
| 2008/09 | 77.3 | 38.6 | 6.3 |
| 2009/10 | 81.2 | 41.2 | 7.1 |
| 2010/11 | 83.1 | 42.8 | 6.6 |
| 2011/12 | 79.7 | 41.4 | 7.3 |
| 2012/13 | 81.3 | 42.9 | 7.3 |
| 2013/14 | 83.2 | 44.3 | 7.5 |
| 2014/15 | 84.1 | 45.4 | 7.6 |
| 2015/16 | 85.6 | 47.8 | 7.7 |
| 2016/17 | 82.9 | 45.8 | 7.7 |
| 2017/18 | 81.6 | 47.0 | 7.1 |
APC: Annual percent change
|
|||
Figure 4.7: Head injury-related hospitalization in Canada, 2006/07 to 2017/18, males, standardized rates/ 100,000 persons
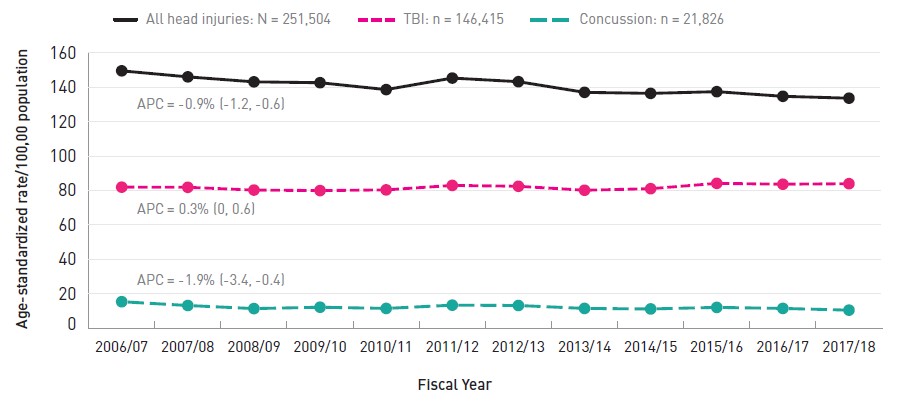
Source: Public Health Agency of Canada analysis of Canadian Institute for Health Information data (HMDB: Canada, 2006/07 to 2010/11; DAD: Canada, excluding Quebec, 2011/12 to 2017/18).
Note: Rates are standardized to the 2011 Canadian population.
Text description
| Fiscal Year | All head injuries | TBI | Concussion |
|---|---|---|---|
| 2006/07 | 149.6 | 82.0 | 15.4 |
| 2007/08 | 146.1 | 81.9 | 13.2 |
| 2008/09 | 143.2 | 80.3 | 11.4 |
| 2009/10 | 142.7 | 80.0 | 12.2 |
| 2010/11 | 138.7 | 80.4 | 11.5 |
| 2011/12 | 145.4 | 83.0 | 13.4 |
| 2012/13 | 143.3 | 82.5 | 13.2 |
| 2013/14 | 137.1 | 80.2 | 11.5 |
| 2014/15 | 136.5 | 81.1 | 11.2 |
| 2015/16 | 137.5 | 84.2 | 12.1 |
| 2016/17 | 134.8 | 83.7 | 11.5 |
| 2017/18 | 133.7 | 84.0 | 10.5 |
APC: Annual percent change
|
|||
Life course
Figures 4.8 to 4.11 show the age-specific rates of hospitalization by sex for all head injuries, TBI and concussions over the life course for 4 select external causes (assault, sports and recreation, transport and falls). Tables C1 to C6 in Appendix C contain detail for all external causes.
Figure 4.8 shows assault-related head injuries. There was a relative peak among infants of both sexes. Of all of the assault-related hospitalizations for TBI among females, 15.5% were concussions compared to 9.9% for males. Male infants experienced assault-related TBI at a rate of 14.6/100,000 infants while the rate for females was 10.7/100,000. Among infants of both sexes, a significant proportion (> 60%) of all head injuries were TBI. Assault-related brain and head injuries are infrequent between 2 and 14 years but began to rise, particularly for males, at around 15 years of age. Between 15 and 64 years of age, the assault-related TBI is substantially higher for males compared to females. For males, assault-related TBI peaked among 20 to 29 year olds at 22.6/100,000 population. At the other end of the age spectrum, hospitalizations for assault-related injuries were again relatively infrequent among seniors 65 years and older.
Figure 4.8: Assault-related brain and head injury hospitalization in Canada, 2006/07 to 2017/18, by sex, age-specific rates/100,000 persons
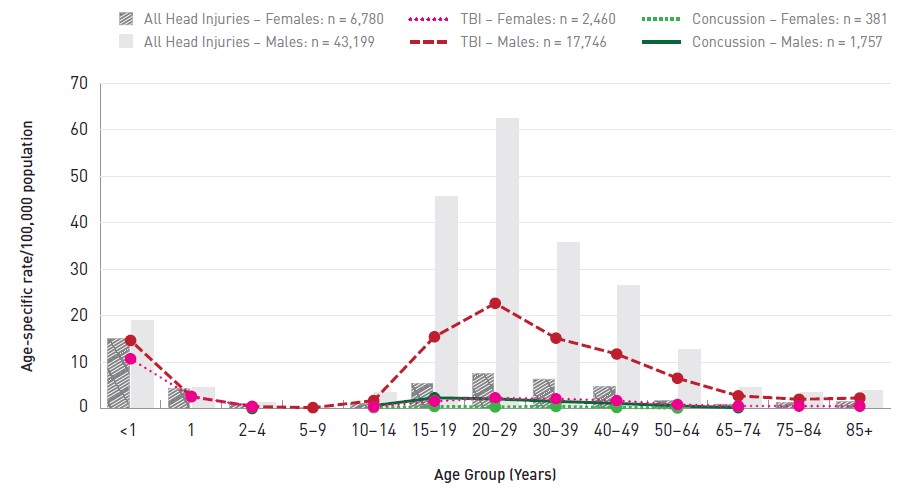
Source: Public Health Agency of Canada analysis of Canadian Institute for Health Information data (HMDB: Canada, 2006/07 to 2010/11; DAD: Canada, excluding Quebec, 2011/12 to 2017/18).
Note: Rates based on counts between 1 and 9 are not reported. See Chapter 2 for further detail.
Text description
| Age Group | All Head Injuries - Females | All Head Injuries - Males | TBI - Females | TBI - Males | Concussion - Females | Concussion - Males |
|---|---|---|---|---|---|---|
| <1 | 15.16 | 19.04 | 10.69 | 14.64 | - | - |
| 1 | 4.28 | 4.62 | 2.59 | 2.56 | - | - |
| 2-4 | 1.08 | 1.30 | 0.41 | 0.44 | - | 0.00 |
| 5-9 | 0.26 | 0.49 | - | 0.18 | - | - |
| 10-14 | 1.04 | 3.51 | 0.36 | 1.70 | 0.18 | 0.61 |
| 15-19 | 5.38 | 45.64 | 1.55 | 15.43 | 0.44 | 2.30 |
| 20-29 | 7.49 | 62.38 | 2.30 | 22.64 | 0.35 | 2.06 |
| 30-39 | 6.37 | 35.74 | 2.09 | 15.14 | 0.44 | 1.53 |
| 40-49 | 4.69 | 26.47 | 1.69 | 11.72 | 0.23 | 1.10 |
| 50-64 | 1.82 | 12.73 | 0.84 | 6.51 | 0.11 | 0.55 |
| 65-74 | 0.98 | 4.42 | 0.53 | 2.72 | - | 0.18 |
| 75-84 | 1.26 | 3.43 | 0.52 | 1.98 | - | - |
| 85+ | 1.59 | 3.98 | 0.49 | 2.26 | - | - |
|
||||||
Figure 4.9 shows the pattern of SPAR-related hospitalizations for brain and head injuries. All head injuries among males peaked for 15 to 19 year olds at 36.4/100,000 while for females the peak was at 10 to 14 years of age (14.6/100,000). For both sexes, TBI rates began to rise for those greater than 5 years of age, peaked at 10 to 14 years, and then began to decline after 19 years of age. Of all of the SPAR-related hospitalizations for TBI among females, 39.7% were concussions compared to 32.2% for males. For both sexes, TBI and concussions peaked in 10 to 14 year olds (TBI: 25.5/100,000 for males and 9.6/100,000 for females; concussion: 14.6/100,000 in males and 5.5/100,000 for females). Although declining after 19 years of age, TBI hospitalization rates among males 30 to 84 years remained stable at about 7.0-8.0/100,000.
Figure 4.9: Sports and recreation-related brain and head injury hospitalization in Canada, 2006/07 to 2017/18, by sex, age-specific rates/100,000 persons
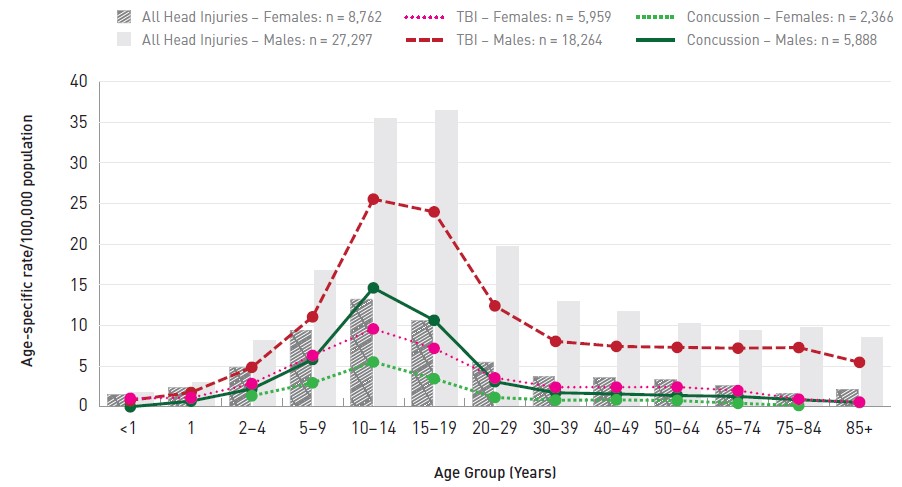
Source: Public Health Agency of Canada analysis of Canadian Institute for Health Information data (HMDB: Canada, 2006/07 to 2010/11; DAD: Canada, excluding Quebec, 2011/12 to 2017/18).
Note: Rates based on counts between 1 and 9 are not reported. See Chapter 2 and Appendix C for further details.
Text description
| Age Group | All Head Injuries - Females | All Head Injuries - Males | TBI - Females | TBI - Males | Concussion - Females | Concussion - Males |
|---|---|---|---|---|---|---|
| <1 | 1.53 | 1.70 | 1.05 | 0.80 | - | 0.00 |
| 1 | 2.38 | 2.91 | 1.11 | 1.76 | - | 0.70 |
| 2-4 | 4.88 | 8.09 | 2.85 | 4.86 | 1.35 | 2.20 |
| 5-9 | 9.33 | 16.78 | 6.32 | 11.06 | 2.95 | 5.82 |
| 10-14 | 13.24 | 35.41 | 9.58 | 25.54 | 5.51 | 14.62 |
| 15-19 | 10.58 | 36.39 | 7.19 | 23.97 | 3.45 | 10.64 |
| 20-29 | 5.48 | 19.68 | 3.56 | 12.41 | 1.15 | 3.09 |
| 30-39 | 3.67 | 12.92 | 2.41 | 8.05 | 0.81 | 1.73 |
| 40-49 | 3.60 | 11.63 | 2.42 | 7.43 | 0.85 | 1.58 |
| 50-64 | 3.33 | 10.24 | 2.44 | 7.31 | 0.76 | 1.39 |
| 65-74 | 2.64 | 9.40 | 1.99 | 7.21 | 0.43 | 1.27 |
| 75-84 | 1.57 | 9.76 | 0.94 | 7.29 | 0.16 | 0.87 |
| 85+ | 2.09 | 8.45 | 0.58 | 5.47 | - | 0.54 |
|
||||||
Figure 4.10 displays the results for hospitalizations due to transport-related head injuries. Note that sports and recreation-related injuries involving certain vehicles (e.g., injuries involving all-terrain vehicles, dirt bikes, bicycles and other motor sports) are with the SPAR group and are not included in this transportation category (see Appendix A for further detail). Overall, of all the transport-related hospitalizations for TBI among females, 20.4% were concussions compared to 18.6% for males. For males there are two peaks: 15 to 29 years and 85 and older. Among 15 to 19 year old males the rate of all head injuries was 40.5/100,000 and the TBI rate was 27.6/100,000. The rates for 20 to 29 year old males were just slightly lower at 37.3/100,000 (all head injuries) and 25.0/100,000 (TBI). Males 85 years and older suffered the highest rates of hospitalizations for all transport-related head injuries (42.4/100,000) and TBI (30.0/100,000). Females showed a similar pattern except that the TBI rate dropped for those older than 84 years.
Figure 4.10: Transport-related brain and head injury hospitalization in Canada, 2006/07 to 2017/18, by sex, age-specific rates/100,000 persons
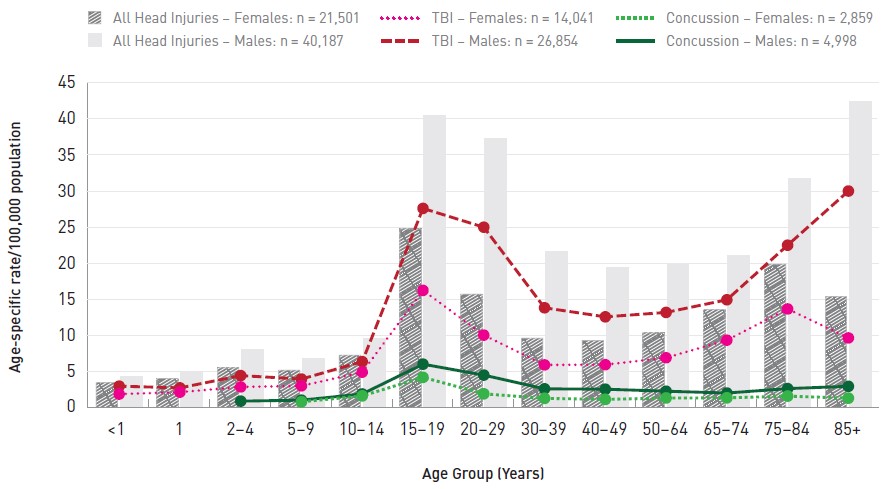
Source: Public Health Agency of Canada analysis of Canadian Institute for Health Information data (HMDB: Canada, 2006/07 to 2010/11; DAD: Canada, excluding Quebec, 2011/12 to 2017/18).
Note: Rates based on counts between 1 and 9 are not reported. See Chapter 2 and Appendix C for further details.
Text description
| Age Group | All Head Injuries - Females | All Head Injuries - Males | TBI - Females | TBI - Males | Concussion - Females | Concussion - Males |
|---|---|---|---|---|---|---|
| <1 | 3.53 | 4.30 | 1.95 | 3.05 | - | - |
| 1 | 4.07 | 4.82 | 2.22 | 2.81 | - | - |
| 2-4 | 5.57 | 8.01 | 2.94 | 4.51 | - | 0.98 |
| 5-9 | 5.24 | 6.87 | 3.09 | 4.03 | 0.88 | 1.11 |
| 10-14 | 7.31 | 9.57 | 4.98 | 6.44 | 1.70 | 1.97 |
| 15-19 | 24.78 | 40.46 | 16.30 | 27.64 | 4.27 | 6.09 |
| 20-29 | 15.75 | 37.28 | 10.11 | 25.04 | 1.99 | 4.58 |
| 30-39 | 9.66 | 21.61 | 5.99 | 13.89 | 1.36 | 2.68 |
| 40-49 | 9.37 | 19.46 | 6.02 | 12.64 | 1.22 | 2.63 |
| 50-64 | 10.40 | 19.96 | 6.98 | 13.25 | 1.41 | 2.35 |
| 65-74 | 13.62 | 21.07 | 9.41 | 15.00 | 1.43 | 2.10 |
| 75-84 | 19.90 | 31.74 | 13.73 | 22.55 | 1.67 | 2.71 |
| 85+ | 15.44 | 42.42 | 9.72 | 30.04 | 1.39 | 3.03 |
|
||||||
Figure 4.11 shows the pattern of fall-related hospitalizations for head and brain injuries. Of all the fall-related hospitalizations for TBI among females, 13.3% were concussions compared to 10.9% for males. There was a minor peak in all head injuries and TBI among infants. In male infants, the all head injury hospitalization rate was 136.9/100,000 while for female infants the rate was 113.5/100,000. For TBI the rates were 95.3/100,000 male infants and 77.0/100,000 for females. The rates were lower but still slightly elevated (relatively) among 1 to 4 year old children of both sexes. Between the ages of 5 and 49 the fall-related hospitalization rates for head injuries were at their lowest. For all head injuries the rates ranged from 10.6/100,000 to 27.3/100,000 for males and from 5.6 to 11.6 for females. For TBI the rates ranged from 7.5/100,000 to 17.5/100,000 for males and 2.9 to 7.0 for females. Rates among those 65 and older rose sharply. Among males the fall-related hospitalization rate for head injuries was 131.8/100,000 for those aged 65 to 74 years and climbed to 358.4/100,000 for 75 to 84 year olds and then to 896.7 for men aged 85 years and older. For female seniors the same age-specific rates were 90.6, 294.8 and 749.8 per 100,000, respectively.
Figure 4.11: Fall-related brain and head injury hospitalization in Canada, 2006/07 to 2017/18, by sex, age-specific rates/100,000 persons
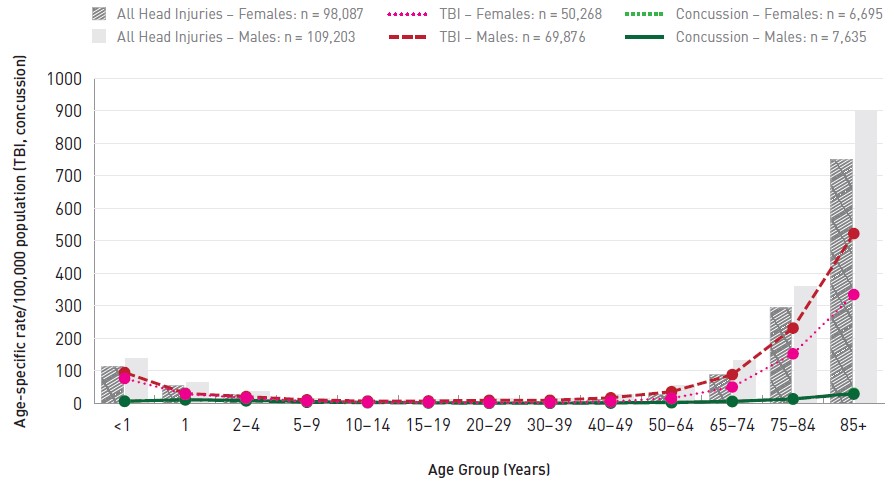
Source: Public Health Agency of Canada analysis of Canadian Institute for Health Information data (HMDB: Canada, 2006/07 to 2010/11; DAD: Canada, excluding Quebec, 2011/12 to 2017/18).
Note: Rates based on counts between 1 and 9 are not reported. See Chapter 2 and Appendix C for further details.
Text description
| Age Group | All Head Injuries - Females | All Head Injuries - Males | TBI - Females | TBI - Males | Concussion - Females | Concussion - Males |
|---|---|---|---|---|---|---|
| <1 | 113.49 | 136.88 | 76.96 | 95.30 | 6.79 | 7.05 |
| 1 | 56.21 | 65.37 | 28.98 | 31.08 | 11.32 | 11.90 |
| 2-4 | 29.14 | 36.44 | 17.41 | 21.22 | 8.16 | 9.81 |
| 5-9 | 10.38 | 16.40 | 6.96 | 11.29 | 3.78 | 6.28 |
| 10-14 | 5.58 | 10.64 | 3.61 | 7.51 | 2.30 | 4.29 |
| 15-19 | 6.76 | 12.85 | 3.87 | 7.86 | 1.69 | 2.64 |
| 20-29 | 5.77 | 15.26 | 2.88 | 9.80 | 0.78 | 1.57 |
| 30-39 | 6.32 | 15.71 | 3.22 | 9.97 | 0.80 | 1.42 |
| 40-49 | 11.57 | 27.29 | 6.31 | 17.49 | 1.36 | 2.24 |
| 50-64 | 28.15 | 54.74 | 16.00 | 36.25 | 2.37 | 3.72 |
| 65-74 | 90.55 | 131.82 | 50.63 | 88.71 | 6.00 | 6.66 |
| 75-84 | 294.80 | 358.41 | 152.71 | 231.83 | 14.09 | 13.75 |
| 85+ | 749.80 | 896.73 | 334.84 | 522.35 | 28.93 | 31.48 |
|
||||||
Emergency department visits (NACRS)
Overview and annual trend
Overall, between 2002/03 and 2017/18 there were 5,074,239 emergency department visits for head injuries (Ontario only 2002/03 to 2009/10; Ontario and Alberta 2010/11 to 2017/18) available from the NACRS database, 61.5% (3,123,042) of which involved males. Among these 3,123,042 head injuries, 11.6% were TBI and of those, 67.3% were diagnosed as a concussion. Of the 1,951,197 head injuries among females, 13.4% were TBI and of those, 75.6% were concussions.
Figures 4.12 and 4.13 show the trend in ED visits for TBI, concussions and all head injuries between 2002/03 and 2017/18 for females and males (note the secondary y-axis for all head injuries).
Figure 4.12 shows the trends for females. The standardized rate of ED visits remained stable for all head injuries from 2002/03 to 2009/10 and from 2010/11 to 2016/17 there was a rising trend (APC = 2.1%). TBI and concussions both showed an increased trend over the full 16 year period, with a stronger increase since 2010/11 (APC = 9.2% for TBI and 13.0% for concussions).
Figure 4.12: Head and brain injury-related emergency department visits, 2002/03 to 2017/18, females, all ages, age-standardized rates/100,000 persons
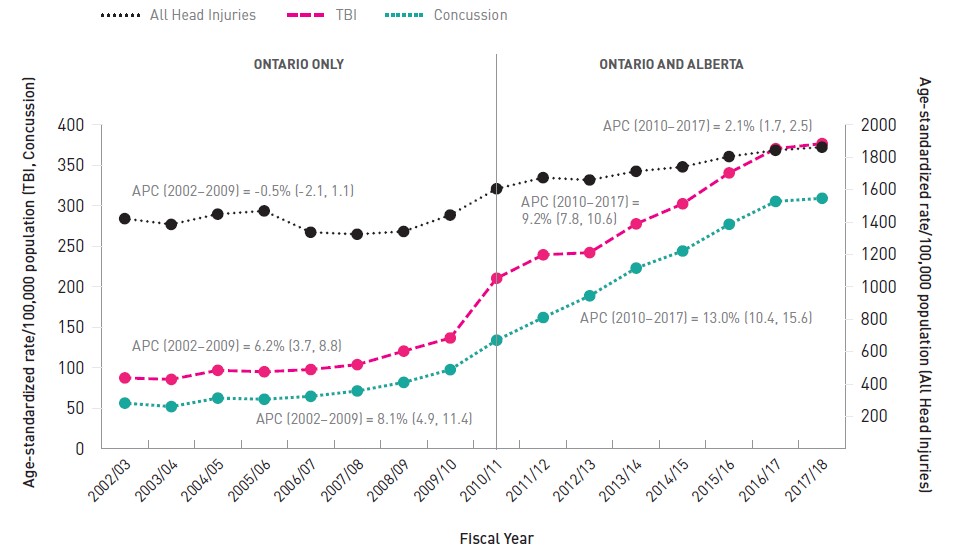
Source: Public Health Agency of Canada analysis of Canadian Institute for Health Information data (NACRS: Ontario, 2002/03 to 2017/18; Alberta, 2010/11 to 2017/18).
Note: Rates are standardized to the 2011 Ontario/Alberta population. All head injuries are plotted against the right-hand Y axis, while all traumatic brain injuries and concussions are plotted against the left-hand Y axis.
Text description
| Fiscal Year | All Head Injuries | TBI | Concussion |
|---|---|---|---|
| 2002/03 | 1,421.2 | 87.6 | 56.5 |
| 2003/04 | 1,385.7 | 85.8 | 52.2 |
| 2004/05 | 1,449.0 | 97.0 | 62.7 |
| 2005/06 | 1,468.9 | 95.2 | 61.3 |
| 2006/07 | 1,337.2 | 98.0 | 64.9 |
| 2007/08 | 1,324.9 | 104.0 | 71.5 |
| 2008/09 | 1,342.0 | 120.7 | 82.1 |
| 2009/10 | 1,443.3 | 136.9 | 97.8 |
| 2010/11 | 1,605.6 | 210.7 | 134.2 |
| 2011/12 | 1,674.1 | 239.6 | 162.2 |
| 2012/13 | 1,659.8 | 242.3 | 189.0 |
| 2013/14 | 1,713.5 | 277.8 | 223.2 |
| 2014/15 | 1,740.7 | 302.6 | 244.3 |
| 2015/16 | 1,804.5 | 340.7 | 277.3 |
| 2016/17 | 1,843.2 | 370.6 | 305.5 |
| 2017/18 | 1,862.3 | 376.9 | 309.4 |
APC: Annual percent change Ontario Only
Ontario and Alberta
|
|||
Figure 4.13 shows the trend for males. There was a slight decrease in all head injuries of 2% per year from 2002/03 to 2009/10, after which the trend was stable. The pattern for TBI and concussions was similar to females except that the increases were not as steep. Specifically, TBI and concussions both showed an increased trend over the full 16-year period, with a stronger increase since 2010 (APC = 3.3% for TBI and 6.6% for concussions).
Note that for Figures 4.12 and 4.13, the distinct increase in rates starting at 2010/11 is partially due to the overall higher rates for Alberta (when this province started to participate in NACRS).
Figure 4.13: Head and brain injury-related emergency department visits, 2002/03 to 2017/18, males, all ages, age-standardized rates/100,000 persons
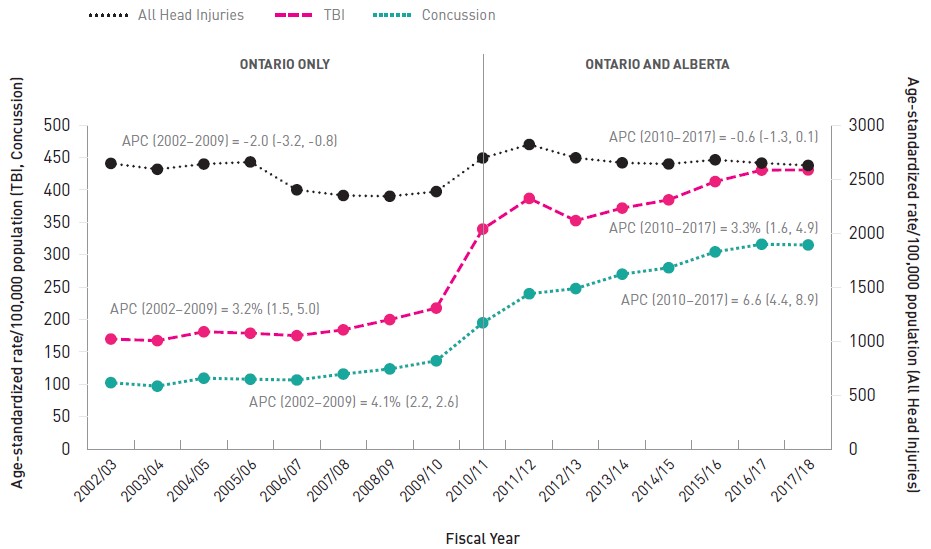
Source: Public Health Agency of Canada analysis of Canadian Institute for Health Information data (NACRS: Ontario, 2002/03 to 2017/18; Alberta, 2010/11 to 2017/18).
Note: Rates are standardized to the 2011 Ontario/Alberta population. All head injuries are plotted against the right-hand Y axis, while all traumatic brain injuries and concussions are plotted against the left-hand Y axis.
Text description
| Fiscal Year | All Head Injuries | TBI | Concussion |
|---|---|---|---|
| 2002/03 | 2,645.1 | 169.8 | 102.5 |
| 2003/04 | 2,590.8 | 167.3 | 97.1 |
| 2004/05 | 2,639.1 | 181.0 | 109.4 |
| 2005/06 | 2,658.5 | 178.8 | 107.8 |
| 2006/07 | 2,400.4 | 175.0 | 106.6 |
| 2007/08 | 2,348.0 | 184.0 | 115.8 |
| 2008/09 | 2,340.9 | 199.8 | 123.7 |
| 2009/10 | 2,384.3 | 217.6 | 136.2 |
| 2010/11 | 2,695.1 | 339.5 | 194.9 |
| 2011/12 | 2,820.2 | 386.9 | 239.7 |
| 2012/13 | 2,696.6 | 352.5 | 247.7 |
| 2013/14 | 2,650.7 | 371.9 | 269.9 |
| 2014/15 | 2,639.8 | 384.6 | 279.8 |
| 2015/16 | 2,678.5 | 412.8 | 304.3 |
| 2016/17 | 2,648.2 | 430.5 | 316.1 |
| 2017/18 | 2,626.3 | 430.7 | 315.0 |
APC: Annual percent change Ontario Only
Ontario and Alberta
|
|||
Life course
Figures 4.14 to 4.17 show the age-specific rates of ED visits by sex for all head injuries, TBI and concussions over the life course for four select external causes of injuries: assault, SPAR, transport and falls (note secondary Y-axis). Tables D1 to D6 in Appendix D contain detail for all external causes.
Figure 4.14 shows ED visit rates for assault-related brain and head injuries for males and females. Rates peaked in the 15 to 29 year age range for both sexes. Of all of the assault-related ED visits for TBI among females, 72.7% were concussions compared to 47.2% for males. Assault-related TBI is substantially higher for males 15 to 64 years, compared to females. For 15 to 19 year old males, the rate of all head injuries was 819.0/100,000 and was slightly lower at 770.1/100,000 for 20 to 29 year olds. The TBI rate for 15 to 19 year old males was 88.5/100,000, increasing slightly to 91.0/100,000 among 20 to 29 year old males. Concussions among males peaked in the 15 to 19 year age group (54.8/100,000). Similarly for females, the all head injury ED visit rate was 224.9/100,000 among 15 to 19 year old girls and 202.8/100,000 for those 20 to 29 years of age. The TBI rate peaked among 15 to 19 year olds at 25.4/100,000 and reduced slightly to 21.1/100,000 for 20 to 29 year old females.
Figure 4.14: Assault-related brain and head injury emergency department visits, Ontario and Alberta, 2002/03 to 2017/18, by sex, age-specific rates/100,000 persons
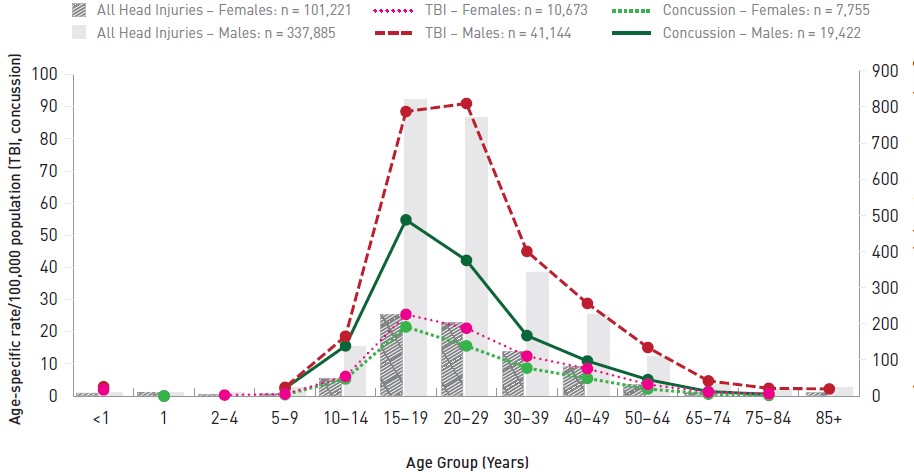
Source: Public Health Agency of Canada analysis of Canadian Institute for Health Information data (NACRS: Ontario, 2002/03 to 2017/18; Alberta, 2010/11 to 2017/18).
Note: All head injuries are plotted against the right-hand Y axis, while all traumatic brain injuries and concussions are plotted against the left-hand Y axis. Rates based on counts between 1 and 9 are not reported. See Chapter 2 and Appendix D for further details.
Text description
| Age Group | TBI_ON | ALLHEAD | CONCUSS | TBI_ON | ALLHEAD | CONCUSS |
|---|---|---|---|---|---|---|
| <1 | 1.9 | 8.4 | - | 2.9 | 11.0 | - |
| 1 | - | 9.0 | 0.0 | - | 10.4 | 0.0 |
| 2-4 | 0.3 | 5.5 | - | - | 9.0 | - |
| 5-9 | 0.6 | 7.6 | 0.4 | 2.7 | 22.3 | 2.4 |
| 10-14 | 6.1 | 49.1 | 5.3 | 18.6 | 138.3 | 15.6 |
| 15-19 | 25.4 | 224.9 | 21.5 | 88.5 | 819.0 | 54.8 |
| 20-29 | 21.1 | 202.8 | 15.6 | 91.0 | 770.1 | 42.2 |
| 30-39 | 12.4 | 124.5 | 8.7 | 45.0 | 343.1 | 18.8 |
| 40-49 | 8.5 | 81.5 | 5.5 | 28.8 | 224.2 | 10.9 |
| 50-64 | 3.6 | 32.0 | 2.2 | 15.1 | 110.1 | 5.1 |
| 65-74 | 1.2 | 10.4 | 0.6 | 4.7 | 31.6 | 1.4 |
| 75-84 | 0.7 | 9.7 | 0.2 | 2.4 | 18.2 | 0.5 |
| 85 + | - | 11.0 | - | 2.2 | 23.8 | - |
|
||||||
Figure 4.15 depicts ED visit rates for SPAR-related brain and head injuries for males and females. Of all of the SPAR-related ED visits for TBI among females, 90.7% were concussions compared to 86.2% for males. For both sexes rates began to rise in the 5 to 9 year age group, peaked in the 10 to 19 year old age range and then began to decline to relatively low levels beyond age 30. More specifically, for males the all head injury, TBI and the concussion rates peaked among 10 to 14 year old boys at 1,583.3/100,000, 453.8/100,000 and 426.1/100,000, respectively. For females, the all head injury rate peaked among 10 to 14 year olds at 653.8/100,000 while the TBI and concussion rates peaked among those 15 to 19 years at 234.3/100,000 and 223.0/100,000, respectively.
Figure 4.15: Sports and recreation-related brain and head injury emergency department visits, Ontario and Alberta, 2002/03 to 2017/18, by sex, age-specific rates/100,000 persons
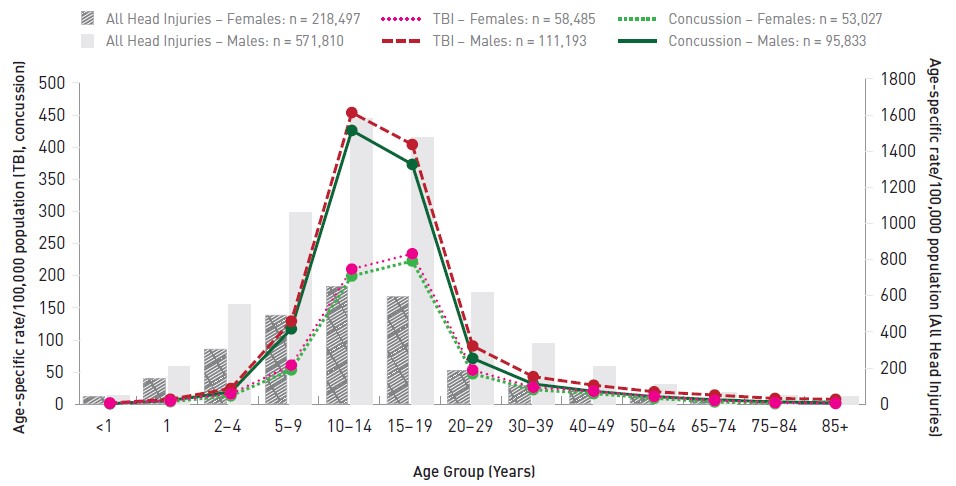
Source: Public Health Agency of Canada analysis of Canadian Institute for Health Information data (NACRS: Ontario, 2002/03 to 2017/18; Alberta, 2010/11 to 2017/18).
Note: All head injuries are plotted against the right-hand Y axis, while all traumatic brain injuries and concussions are plotted against the left-hand Y axis. Rates based on counts between 1 and 9 are not reported. See Chapter 2 and Appendix D for further details.
Text description
| Age Group | Females | Males | ||||
|---|---|---|---|---|---|---|
| TBI_ON | ALLHEAD | CONCUSS | TBI_ON | ALLHEAD | CONCUSS | |
| <1 | 1.9 | 41.3 | - | 2.1 | 45.4 | 0.9 |
| 1 | 5.2 | 141.1 | 4.2 | 8.0 | 209.7 | 6.1 |
| 2-4 | 16.4 | 305.5 | 13.3 | 24.7 | 548.7 | 19.3 |
| 5-9 | 61.0 | 493.8 | 53.7 | 129.5 | 1,058.4 | 117.5 |
| 10-14 | 210.4 | 653.8 | 199.7 | 453.8 | 1,583.3 | 426.1 |
| 15-19 | 234.3 | 596.8 | 223.0 | 404.2 | 1,476.6 | 373.3 |
| 20-29 | 53.3 | 185.8 | 47.7 | 90.8 | 618.9 | 71.5 |
| 30-39 | 26.5 | 103.5 | 22.8 | 43.1 | 336.8 | 31.7 |
| 40-49 | 20.3 | 78.1 | 16.8 | 29.8 | 207.8 | 20.3 |
| 50-64 | 12.3 | 47.9 | 9.4 | 19.6 | 109.1 | 12.0 |
| 65-74 | 5.9 | 28.3 | 3.8 | 14.5 | 65.2 | 7.2 |
| 75-84 | 2.5 | 20.5 | 1.2 | 9.2 | 48.4 | 3.8 |
| 85 + | 1.4 | 21.1 | - | 7.9 | 41.8 | 2.1 |
|
||||||
Figure 4.16 depicts ED visit rates for non-SPAR transport-related brain and head injuries for males and females. Of all of the transport-related ED visits for TBI among females, 74.0% were concussions compared to 61.8% for males. For both sexes all rates peaked among 15 to 19 year olds. Among males the peak rates (per 100,000) were 241.2 (all head injuries), 67.2 (TBI) and 46.6 (concussion). For females the rates were 230.8, 65.8 and 53.8, respectively. As with hospitalizations there was a secondary peak among 85 year old males for all head injuries (112.2/100,000) and TBI (27.6/100,000).
Figure 4.16: Transport-related brain and head injury emergency department visits, Ontario and Alberta, 2002/03 to 2017/18, by sex, age-specific rates/100,000 persons
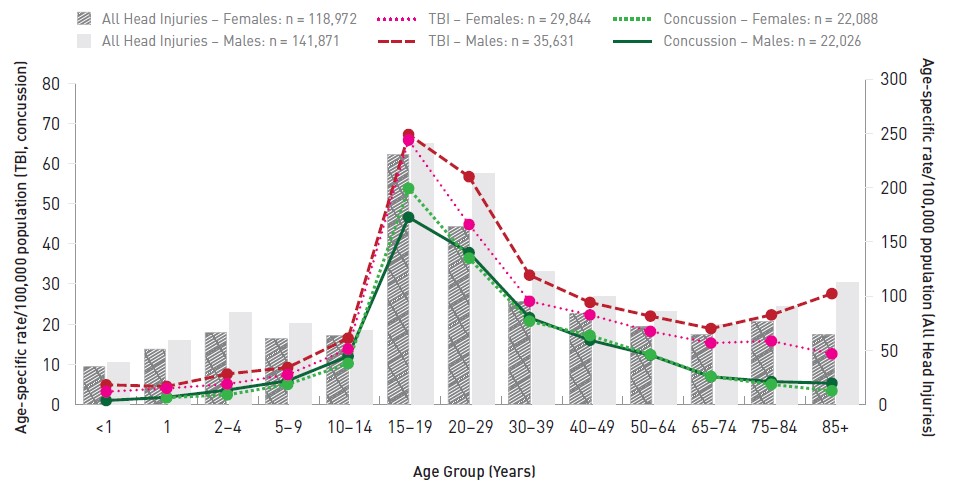
Source: Public Health Agency of Canada analysis of Canadian Institute for Health Information data (NACRS: Ontario, 2002/03 to 2017/18; Alberta, 2010/11 to 2017/18).
Note: All head injuries are plotted against the right-hand Y axis, while all traumatic brain injuries and concussions are plotted against the left-hand Y axis. Rates based on counts between 1 and 9 are not reported. See Chapter 2 and Appendix D for further details.
Text description
| Age Group | Females | Males | ||||
|---|---|---|---|---|---|---|
| TBI_ON | ALLHEAD | CONCUSS | TBI_ON | ALLHEAD | CONCUSS | |
| <1 | 3.2 | 35.2 | - | 4.9 | 38.9 | 1.0 |
| 1 | 4.0 | 51.3 | 1.7 | 4.5 | 59.1 | 1.8 |
| 2-4 | 5.1 | 66.8 | 2.4 | 7.6 | 84.9 | 3.6 |
| 5-9 | 7.4 | 61.1 | 5.0 | 9.2 | 75.2 | 5.9 |
| 10-14 | 13.8 | 64.1 | 10.2 | 16.5 | 68.1 | 12.0 |
| 15-19 | 65.8 | 230.8 | 53.8 | 67.2 | 241.2 | 46.6 |
| 20-29 | 44.8 | 164.3 | 36.4 | 56.7 | 212.9 | 37.8 |
| 30-39 | 25.7 | 95.3 | 20.7 | 32.2 | 123.0 | 21.6 |
| 40-49 | 22.3 | 84.0 | 17.2 | 25.4 | 99.5 | 16.0 |
| 50-64 | 18.2 | 71.9 | 12.4 | 22.0 | 85.6 | 12.3 |
| 65-74 | 15.3 | 65.0 | 7.0 | 18.9 | 73.8 | 6.9 |
| 75-84 | 15.8 | 76.8 | 5.0 | 22.3 | 90.4 | 5.7 |
| 85 + | 12.6 | 64.5 | 3.4 | 27.6 | 112.2 | 5.3 |
|
||||||
Figure 4.17 depicts ED visit rates for fall-related brain and head injuries for males and females. Of all fall-related ED visits for TBI among females, 66.4% were concussions compared to 57.5% for males. The pattern of fall-related ED visits was different from hospitalizations, in that rates were high at both young and older ages of the spectrum. One year old children had the highest rates of all head injuries (5,884.7/100,000 for males and 4,455.0/100,000 for females). Among children under 10 years, TBI were most frequent among infants (198.5/100,000 for males and 168.0/100,000 for females). Over the full age range, concussions peaked among males at 10 to 14 years old (126.5/100,000) and among females at 15 to 19 years (110.2/100,000). Men and women 85 years and older had the highest rates of TBI (544.4/100,000 for men and 413.1/100,000 for women).
Figure 4.17: Fall-related brain and head injury emergency department visits, Ontario and Alberta, 2002/03 to 2017/18, by sex, age-specific rates/100,000 persons
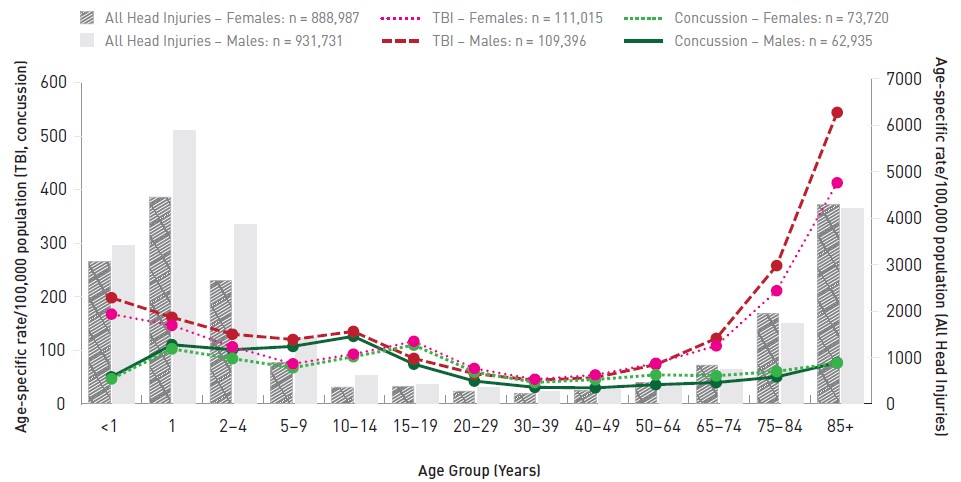
Source: Public Health Agency of Canada analysis of Canadian Institute for Health Information data (NACRS: Ontario, 2002/03 to 2017/18; Alberta, 2010/11 to 2017/18).
Note: All head injuries are plotted against the right-hand Y axis, while all traumatic brain injuries and concussions are plotted against the left-hand Y axis.
Text description
| Age Group | Females | Males | ||||
|---|---|---|---|---|---|---|
| TBI_ON | ALLHEAD | CONCUSS | TBI_ON | ALLHEAD | CONCUSS | |
| <1 | 168.0 | 3,074.0 | 47.0 | 198.5 | 3,413.4 | 50.7 |
| 1 | 147.0 | 4,455.0 | 103.0 | 162.0 | 5,884.7 | 110.8 |
| 2-4 | 106.9 | 2,661.8 | 84.9 | 130.4 | 3,860.9 | 101.5 |
| 5-9 | 75.2 | 892.7 | 67.8 | 120.6 | 1,431.7 | 107.7 |
| 10-14 | 93.2 | 365.9 | 88.5 | 135.6 | 612.6 | 126.5 |
| 15-19 | 117.1 | 386.3 | 110.2 | 85.2 | 418.6 | 74.6 |
| 20-29 | 66.5 | 282.2 | 60.1 | 56.8 | 347.4 | 43.0 |
| 30-39 | 46.3 | 220.9 | 40.5 | 44.4 | 262.0 | 31.3 |
| 40-49 | 54.4 | 288.2 | 45.7 | 49.5 | 307.0 | 30.3 |
| 50-64 | 76.2 | 472.6 | 54.6 | 73.6 | 434.9 | 36.3 |
| 65-74 | 108.7 | 842.8 | 52.9 | 122.6 | 752.3 | 40.2 |
| 75-84 | 211.7 | 1,943.1 | 61.0 | 258.5 | 1,724.2 | 50.8 |
| 85 + | 413.1 | 4,299.1 | 76.7 | 544.4 | 4,213.5 | 77.4 |
|
||||||
External cause by age, 2017/18
Figures 4.18 and 4.19 show the age-specific rates of ED visits for the most recent year of data (2017/18, Ontario and Alberta) for TBI over the life course for different mechanisms for females and males, respectively: assault, SPAR, transportation, falls and being struck (including struck by or struck against something or someone).
Figure 4.18 depicts the results for females. Falls (not including those sustained during sports and recreation activities) were common throughout the life course, particularly among females aged 75 and older where rates ranged from 333.5/100,000 to 624.1/100,000. SPAR-related brain injuries were significant among 10 to 19 year old females, ranging from 389.1/100,000 to 402.8/100,000.
Figure 4.18: Traumatic brain injury-related emergency department visits, by external cause, Ontario and Alberta, 2017/18, females, age-specific rates/100,000 persons
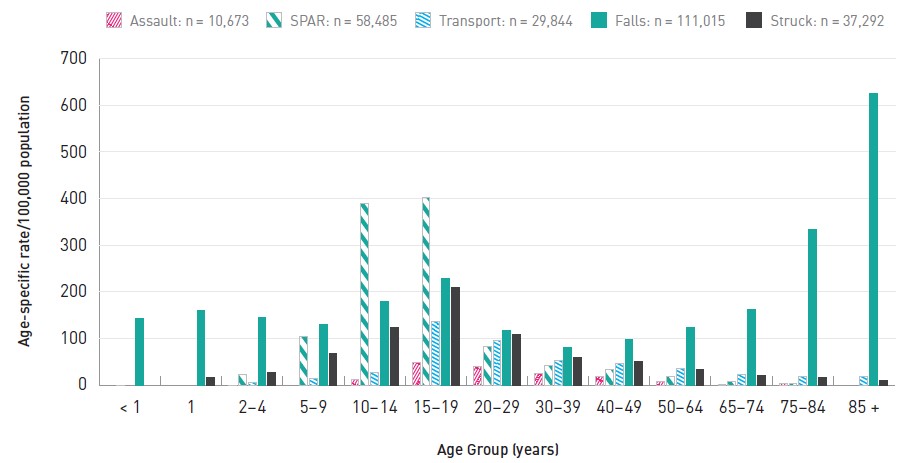
Source: Public Health Agency of Canada analysis of Canadian Institute for Health Information data (NACRS: Ontario and Alberta, 2017/18).
Note: Rates based on counts between 1 and 9 are not reported. See Chapter 2 and Appendix D for further details.
SPAR: Sports and recreation
Text description
| ASSAULT Rate | SPAR Rate | TRANSPORT Rate | FALLS Rate | STRUCK Rate | |
|---|---|---|---|---|---|
| < 1 | - | 0.0 | - | 142.4 | - |
| 1 | -- | - | - | 160.3 | 17.4 |
| 2-4 | 0.0 | 21.9 | 5.5 | 144.7 | 26.1 |
| 5-9 | - | 104.9 | 15.1 | 130.6 | 67.5 |
| 10-14 | 12.9 | 389.1 | 26.7 | 179.3 | 123.1 |
| 15-19 | 49.1 | 402.8 | 135.4 | 229.0 | 208.5 |
| 20-29 | 39.0 | 82.3 | 96.0 | 116.4 | 109.4 |
| 30-39 | 24.1 | 42.2 | 53.7 | 79.8 | 58.3 |
| 40-49 | 17.8 | 32.7 | 46.5 | 98.8 | 50.7 |
| 50-64 | 7.5 | 18.1 | 35.3 | 123.5 | 33.6 |
| 65-74 | 1.3 | 8.6 | 22.4 | 163.0 | 20.1 |
| 75-84 | 2.5 | 2.5 | 19.4 | 333.5 | 16.7 |
| 85 + | - | - | 18.3 | 624.1 | 11.0 |
|
|||||
Figure 4.19: Traumatic brain injury-related emergency department visits, by external cause, Ontario and Alberta, 2017/18, males, age-specific rates/100,000 persons
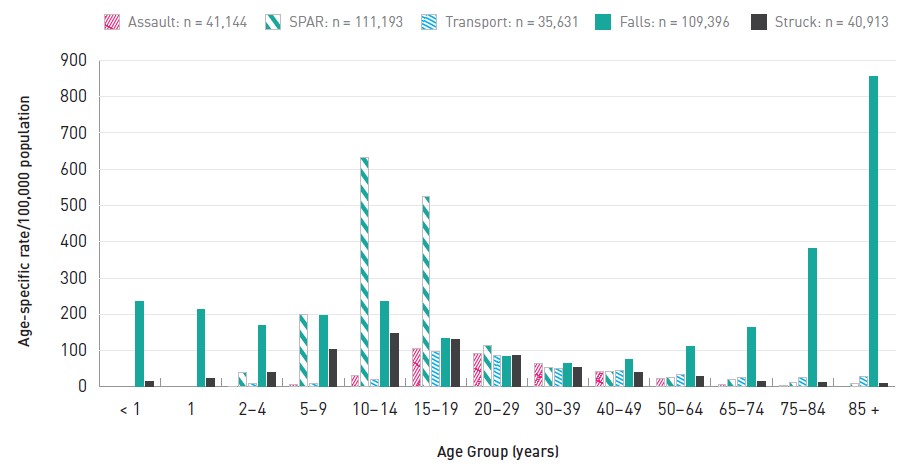
Source: Public Health Agency of Canada analysis of Canadian Institute for Health Information data (NACRS: Ontario and Alberta, 2017/18).
Note: Rates based on counts between 1 and 9 are not reported. See Chapter 2 and Appendix D for further details.
SPAR: Sports and recreation
Text description
| Age Group | Assault | Sports and Recreation | Transport | Falls | Struck |
|---|---|---|---|---|---|
| <1 | - | - | - | 234.7 | 14.4 |
| 1 | - | - | - | 213.9 | 23.2 |
| 2-4 | 0.0 | 39.9 | 9.4 | 168.4 | 40.9 |
| 5-9 | 5.2 | 200.8 | 9.9 | 195.4 | 104.0 |
| 10-14 | 32.1 | 631.1 | 21.5 | 234.0 | 146.4 |
| 15-19 | 105.8 | 524.8 | 98.4 | 133.8 | 130.3 |
| 20-29 | 92.0 | 113.0 | 85.2 | 83.9 | 86.5 |
| 30-39 | 65.3 | 54.6 | 51.1 | 65.5 | 52.1 |
| 40-49 | 43.0 | 42.3 | 44.5 | 75.9 | 39.9 |
| 50-64 | 23.0 | 25.3 | 33.4 | 110.6 | 28.1 |
| 65-74 | 7.2 | 19.6 | 26.5 | 164.8 | 15.1 |
| 75-84 | 2.6 | 11.9 | 27.2 | 380.5 | 12.4 |
| 85+ | - | 8.7 | 29.2 | 854.8 | 8.0 |
|
|||||
Concussions: Hospitalizations and emergency department visits
Figure 4.20 compares the data from ED visits (NACRS) and hospitalizations (HMDB/DAD) and displays the relative importance of concussions by external cause of injury and the hospital visit outcome (discharge from emergency department or hospital admission). For a given external cause a higher proportion of all TBI are concussions for ED visits compared to hospitalizations. There is variation by external cause and sex. For assault-related TBI ED visits, females had a concussion diagnosis in 72.6% of TBI cases compared to 47.2% for males. This indicates that males suffer more serious assault-related brain injuries. For sports and recreation-related TBI ED visits, most of the TBI were concussions.
Figure 4.20: Percentage of concussions among all traumatic brain injuries, by external cause and hospital visit outcome, hospitalization (HMDB/DAD, 2006/07 to 2017/18) or emergency department visit (NACRS, 2002/03 to 2017/18)
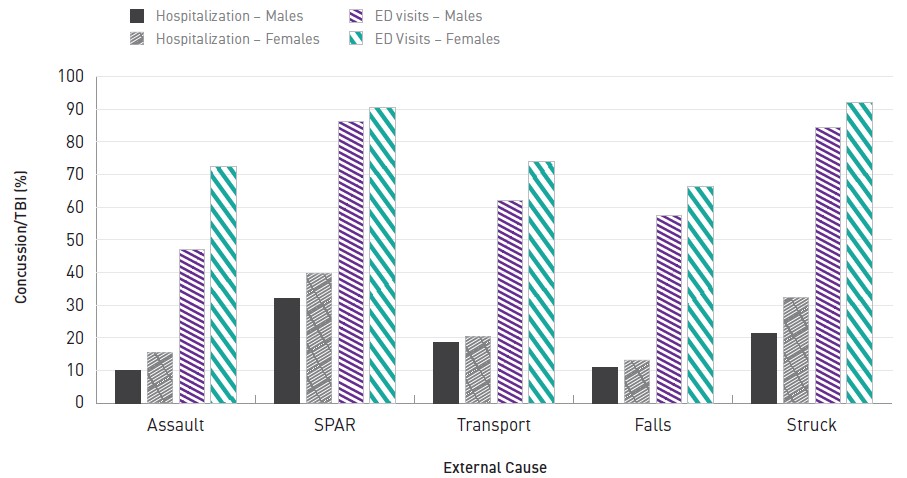
Source: Public Health Agency of Canada analysis of Canadian Institute for Health Information data (HMDB: Canada, 2006/07 to 2010/11; DAD: Canada, excluding Quebec, 2011/12 to 2017/18. NACRS: Ontario and Alberta, 2002/03 to 2017/18).
Text description
| External Cause | Hospitalization - Males | Hospitalization -Females | ED visits - Males | ED Visits - Females |
|---|---|---|---|---|
| Assault | 9.9 | 15.5 | 47.2 | 72.6 |
| Sports and recreation | 32.2 | 39.7 | 86.2 | 90.7 |
| Transport | 18.6 | 20.4 | 62.2 | 74 |
| Falls | 10.9 | 13.3 | 57.5 | 66.4 |
| Struck | 21.5 | 32.5 | 84.5 | 92.2 |
Sports and recreation-related concussions, emergency department visits, Ontario and Alberta, ages 5 to 29 years, 2017/18
Among all SPAR-related concussions among females treated in EDs, the 5 to 29 year age group accounts for 80.7%. Similarly for males the proportion is 85.8%. Figures 4.21 and 4.22 focus on SPAR-related concussions among those aged 5 to 29 years.
Figure 4.21 shows the breakdown for females. Among those 5 to 9 years of age, playground equipment (PGE) had the highest rate of concussion at 26.7/100,000. Among 10 to 14 year old females, other ball sports (including basketball and volleyball) were highest at 95.3/100,000 followed by ice hockey at 68.6/100,000. Rugby/football (66.4/100,000) and other ball sports (72.9/100,000) were the two most frequent categories among females aged 15 to 19 years. Among females aged 20 to 29, other ball sports (14.0/100,000) and skiing/snowboarding (12.2/100,000) were the most common.
Figure 4.21: Sports and recreation-related concussions, emergency department visits, Ontario and Alberta, 2017/18, females, age-specific rates/100,000 persons
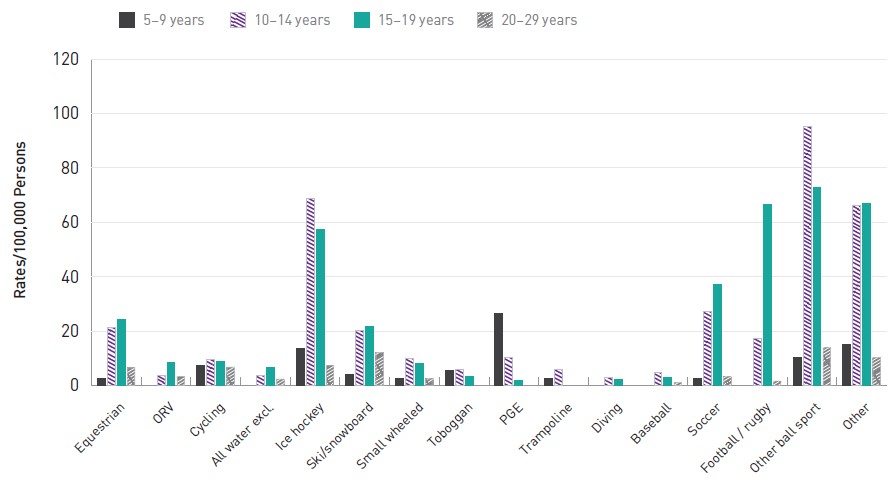
Source: Public Health Agency of Canada analysis of Canadian Institute for Health Information data (NACRS: Ontario and Alberta, 2017/18).
Note: Rates based on counts between 1 and 9 are not reported. See Chapter 2 and Appendix D for further details.
Text description
| Age Group | EQUESTRIAN | ORV | CYCLING | All WATER excl. diving | ICE HOCKEY | SKI/SNOWBOARD | SMALL WHEELED | TOBOGGAN | PGE | TRAMPOLINE | DIVING | BASEBALL | SOCCER | FOOTBALL/RUGBY | Other ball sport | OTHER |
|---|---|---|---|---|---|---|---|---|---|---|---|---|---|---|---|---|
| 5-9 YR | 2.8 | - | 7.4 | - | 13.7 | 4.2 | 2.8 | 5.6 | 26.7 | 2.6 | - | - | 2.6 | - | 10.2 | 15.1 |
| 10-14 YR | 21.2 | 3.9 | 9.7 | 3.9 | 68.6 | 20.3 | 9.9 | 6.0 | 10.5 | 6.0 | 3.1 | 4.7 | 27.3 | 17.5 | 95.3 | 66.2 |
| 15-19 YR | 24.2 | 8.4 | 9.0 | 6.5 | 57.4 | 21.9 | 8.2 | 3.3 | 1.9 | - | 2.3 | 3.1 | 37.2 | 66.4 | 72.9 | 67.1 |
| 20-29 YR | 6.6 | 3.5 | 6.9 | 2.5 | 7.5 | 12.2 | 2.6 | - | - | - | - | 1.3 | 3.3 | 1.8 | 14.0 | 10.5 |
Figure 4.22 shows the breakdown for males. Among boys 5 to 9 years of age, ice hockey (51.2/100,000) and PGE (24.3/100,000) were the two most frequent SPAR categories. Ice hockey increases sharply to 203.7/100,000 among 10 to 14 year old boys. Ice hockey is still the most frequent among 15 to 19 year old males (150.7/100,000), followed closely by football/rugby (119.2/100,000). Ice hockey is still the most frequent category among 20 to 29 year old men (18.2/100,000), but still lower than those 5 to 19 years.
Figure 4.22: Sports and recreation-related concussions, emergency department visits, Ontario and Alberta, 2017/18, males, age-specific rates/100,000 persons
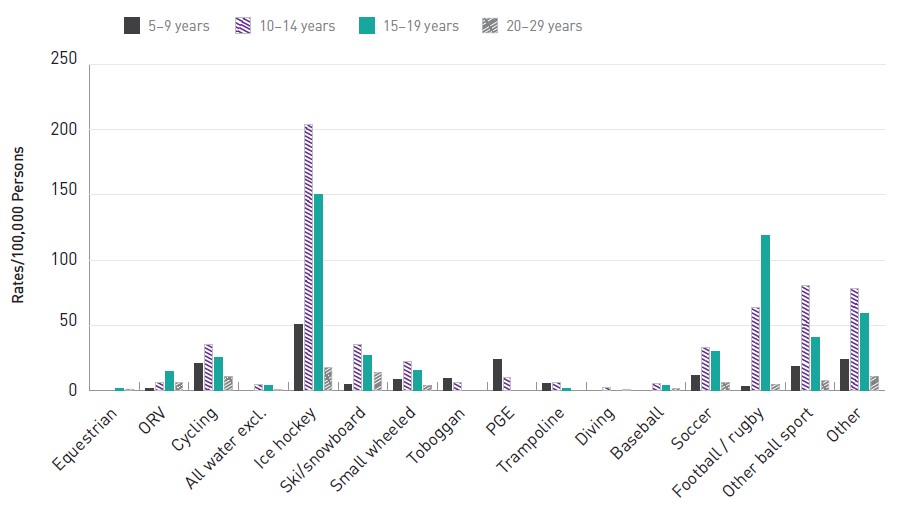
Source: Public Health Agency of Canada analysis of Canadian Institute for Health Information data (NACRS: Ontario and Alberta, 2017/18).
Note: Rates based on counts between 1 and 9 are not reported. See Chapter 2 and Appendix D for further details.
Text description
| Age Group | EQUESTRIAN | ORV | CYCLING | All WATER excl. diving | ICE HOCKEY | SKI/SNOWBOARD | SMALL WHEELED | TOBOGGAN | PGE | TRAMPOLINE | DIVING | BASEBALL | SOCCER | FOOTBALL/RUGBY | Other ball sport | OTHER |
|---|---|---|---|---|---|---|---|---|---|---|---|---|---|---|---|---|
| 5-9 YR | - | 2.1 | 21.0 | - | 51.2 | 4.8 | 8.4 | 9.2 | 24.3 | 5.4 | - | - | 11.9 | 3.3 | 18.7 | 23.7 |
| 10-14 YR | - | 6.8 | 35.6 | 4.7 | 203.7 | 35.6 | 22.7 | 6.6 | 10.6 | 6.6 | 2.7 | 5.3 | 33.4 | 63.5 | 80.7 | 78.2 |
| 15-19 YR | 1.8 | 14.8 | 25.2 | 4.0 | 150.7 | 26.9 | 15.5 | - | - | 2.0 | - | 4.3 | 30.1 | 119.2 | 40.6 | 58.9 |
| 20-29 YR | 1.5 | 6.5 | 11.3 | 1.3 | 18.2 | 14.0 | 4.3 | - | - | - | 0.7 | 1.9 | 6.5 | 4.8 | 8.2 | 11.2 |
5. Results: Sentinel surveillance of emergency department visits for traumatic brain injuries and all head injuries: Canadian hospitals injury reporting and prevention program (CHIRPP/eCHIRPP)
Sentinel surveillance of trends in emergency department visits for traumatic brain injuries (TBI) and all head injuries, CHIRPP/eCHIRPP, 1990 to 2018, all ages, all mechanisms
Introduction
Traumatic brain injuries (TBI) are a public health issue that have generated increasing public attention and concern in recent years. Although rarely fatal, mild TBI can have serious long term consequencesFootnote 7Footnote 8. Sentinel surveillance of TBI can be important to identifying changing trends and mechanisms of injury in a timely fashion. The Canadian Hospitals Injury Reporting and Prevention Program (CHIRPP) system collects data via electronic entry at participating hospitals within days of the injury event and is able to provide system-wide data almost immediately. There is some evidence that minor (closed) head injuries and concussions are increasing recently due to increased exposure to risks (sports and recreation in particular)Footnote 110Footnote 111 and/or enhanced reporting/diagnosis. The purpose of this study is to show the most recent overall trends in TBI reporting to sentinel sites in the CHIRPP system.
Sentinel surveillance of TBI can be important to identifying changing trends and mechanisms of injury in a timely fashion.
Methods
The entire CHIRPP/eCHIRPP databases were searched (1990 to 2018, all ages, extraction date October 5, 2018; a total of 3,267,372 records) for cases of traumatic brain injuries (TBI_CHIRPP) and other head injuries (refer to the methods section for CHIRPP/eCHIRPP description and surveillance definitions).
Cases organized by sex and the annual and weekly trends as well as the age distribution were normalized relative to all CHIRPP cases in the given year, week or age group. The annual trend was assessed using the annual percent change including 95% confidence intervals, APC (CI), calculated based on methods described by the US National Cancer InstituteFootnote 112. The week number was calculated using the SAS WEEK function using the ‘U’ (week starts on Sunday) option.
Results
Annual trend
Figure 5.1 shows the trend in the normalized proportions for males and females for all head injuries and TBI alone. Head injuries overall remained stable (CI contains zero) for both males and females. For males, a total of 647,718 head injuries were identified over the 29 year time period. Of these, 232,487 (35.9%) were TBI, but the proportion varied by year. From 1990 to 1999 the average proportion of all injuries that were TBI was 22.6%. This increased to 36.4% for the period 2000 to 2009 and again to 45.9% for 2010 to 2018 (as of October 5, 2018). Overall the annual percent change (TBI) was 4.5% (3.6, 5.3). For females, there were a total of 384,528 head injuries of which 151,155 (39.3%) were classified as TBI. From 1990 to 1999 the average proportion of all injuries that were TBI was 24.7% and this increased to 39.0% (2000 to 2009) and further to 49.7% (2010 to 2018). Overall the annual percent change (TBI) was 4.5% (3.7, 5.4).
Weekly trend
Figure 5.2 shows the percentage of all injuries that are TBI by week of the year for the two eras of the CHIRPP database—1990 to 2011 (CHIRPP) and 2011 to 2018 (eCHIRPP). For both males and females, there was less variation in the percentage TBI for the older CHIRPP data (1990 to 2011) compared to eCHIRPP (2011 to 2018). For males, from 1990 to 2011 the average percent TBI was 10.6% (SD = 0.7) with a range of 2.6%—from 11.9% in week 5 to 9.3% in week 35. For females, from 1990 to 2011, the average was 9.6% (SD = 0.4) with a range of 1.7%—10.4% in week 8 to 8.7% in week 22. For the more recent era (2011 to 2018), for males, the average percent TBI was 16.3% (SD = 1.5) with a range of 6.2%—from 19.3% in week 3 to 13.1% in week 53. For females, the average percent TBI was 14.7% (SD = 1.3) with a range of 6.7%—from 17.8% in week 2 to 11.1% in week 53.
Age
Figure 5.3 details the age and sex distribution. For both males and females, children under 5 years of age had the highest proportion at 17,983.7/100,000 and 18,276.3/100,000, respectively. The second highest for males were 5 to 9 year olds (12,357.5/100,000), while for females 15 to 19 year olds were the next highest at 10,754.3/100,000.
Figure 5.1: Sentinel surveillance of emergency department visits for traumatic brain injuries, CHIRPP/eCHIRPP, 1990 to 2018Figure 5.1 Footnote a, all ages, normalizedFigure 5.1 Footnote b (per 100,000 CHIRPP records)
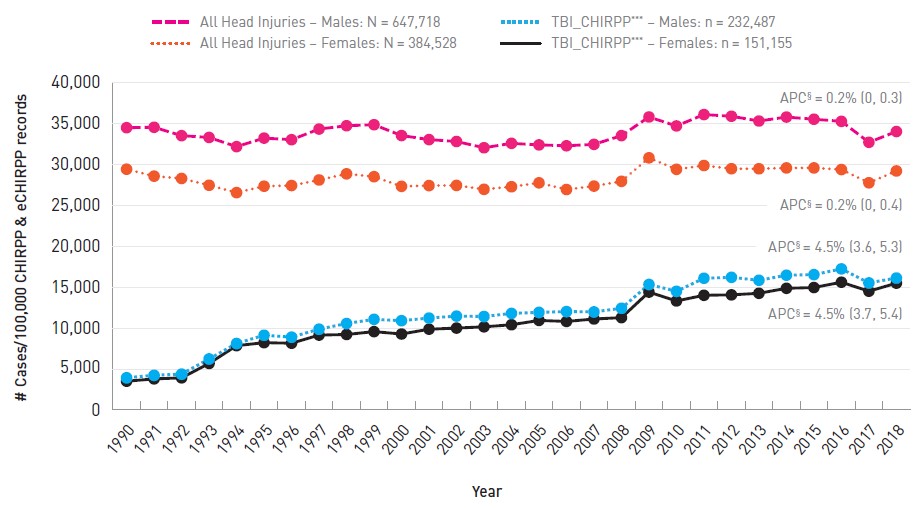
- Figure 5.1 Footnote a
-
2018 is incomplete; extraction date = October 5, 2018
- Figure 5.1 Footnote b
-
Proportions are expressed as a normalized frequency relative to system denominators (not population denominators). As such, proportions per 100,000 records are normalized to all cases in the eCHIRPP database for the given year, on the data extraction date. See Chapter 3 for more information.
CHIRPP traumatic brain injury surveillance definition: any of the three injury fields contains minor (closed) head injury, concussion, intracranial injury, or skull/facial fracture/crushing injury.
Text description
| Year | Males | Females | ||
|---|---|---|---|---|
| All Head Injuries | TBI_CHIRPP | All Head Injuries | TBI_CHIRPP | |
| 1990 | 34,471.9 | 3,935.7 | 29,402.9 | 3,507.1 |
| 1991 | 34,523.4 | 4,234.1 | 28,552.2 | 3,792.1 |
| 1992 | 33,498.3 | 4,378.7 | 28,270.4 | 3,919.2 |
| 1993 | 33,280.3 | 6,233.0 | 27,441.9 | 5,678.8 |
| 1994 | 32,158.2 | 8,119.0 | 26,543.6 | 7,851.3 |
| 1995 | 33,200.8 | 9,125.4 | 27,324.2 | 8,217.3 |
| 1996 | 33,005.9 | 8,893.6 | 27,408.0 | 8,150.0 |
| 1997 | 34,305.5 | 9,867.5 | 28,087.0 | 9,141.5 |
| 1998 | 34,710.6 | 10,558.2 | 28,835.1 | 9,215.7 |
| 1999 | 34,834.4 | 11,066.5 | 28,486.9 | 9,565.4 |
| 2000 | 33,514.3 | 10,901.5 | 27,307.6 | 9,272.8 |
| 2001 | 33,018.3 | 11,222.4 | 27,401.9 | 9,860.9 |
| 2002 | 32,785.0 | 11,462.7 | 27,422.1 | 9,999.2 |
| 2003 | 32,023.6 | 11,414.6 | 26,946.7 | 10,151.7 |
| 2004 | 32,561.9 | 11,791.7 | 27,260.9 | 10,404.9 |
| 2005 | 32,370.4 | 11,917.6 | 27,739.0 | 10,935.1 |
| 2006 | 32,263.3 | 12,020.5 | 26,922.5 | 10,808.1 |
| 2007 | 32,434.7 | 11,976.3 | 27,339.7 | 11,107.5 |
| 2008 | 33,503.9 | 12,420.8 | 27,921.9 | 11,275.4 |
| 2009 | 35,781.3 | 15,329.6 | 30,792.0 | 14,394.8 |
| 2010 | 34,684.7 | 14,492.2 | 29,388.2 | 13,309.5 |
| 2011 | 36,076.3 | 16,083.9 | 29,853.9 | 14,003.7 |
| 2012 | 35,869.5 | 16,197.6 | 29,460.7 | 14,055.5 |
| 2013 | 35,287.7 | 15,835.2 | 29,456.3 | 14,248.9 |
| 2014 | 35,770.9 | 16,454.7 | 29,559.1 | 14,856.5 |
| 2015 | 35,507.1 | 16,526.2 | 29,558.6 | 14,952.1 |
| 2016 | 35,247.1 | 17,225.1 | 29,361.6 | 15,601.0 |
| 2017 | 32,687.4 | 15,515.2 | 27,742.2 | 14,498.7 |
| 2018 | 34,002.6 | 16,115.6 | 29,188.9 | 15,484.4 |
APC: Annual percent change
2018 is incomplete; extraction date = October 5, 2018 Proportions are expressed as a normalized frequency relative to system denominators (not population denominators). As such, proportions per 100,000 records are normalized to all cases in the eCHIRPP database for the given year, on the data extraction date. See Chapter 3 for more information. |
||||
Figure 5.2: Sentinel surveillance of emergency department visits for traumatic brain injuries (TBI), all mechanisms, CHIRPP/eCHIRPP, 1990 to 2018, weekly distribution of TBI for two eras (percentage of all injuries)
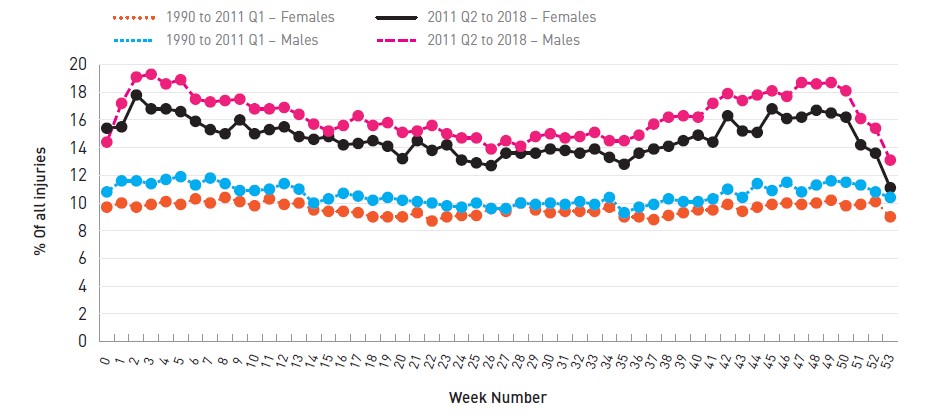
0 and 53 are partial weeks
Text description
| Week Number | Males | Females | ||
|---|---|---|---|---|
| 1990-2011 Q1 | 2011 Q2 - 2018 | 1990-2011 Q1 | 2011 Q2 - 2018 | |
| 0 (partial week) | 10.8 | 14.4 | 9.7 | 15.4 |
| 1 | 11.6 | 17.2 | 10.0 | 15.5 |
| 2 | 11.6 | 19.1 | 9.7 | 17.8 |
| 3 | 11.4 | 19.3 | 9.9 | 16.8 |
| 4 | 11.7 | 18.6 | 10.1 | 16.8 |
| 5 | 11.9 | 18.9 | 9.9 | 16.6 |
| 6 | 11.3 | 17.5 | 10.3 | 15.9 |
| 7 | 11.8 | 17.3 | 10.0 | 15.3 |
| 8 | 11.4 | 17.4 | 10.4 | 15.0 |
| 9 | 10.9 | 17.5 | 10.1 | 16.0 |
| 10 | 10.9 | 16.8 | 9.8 | 15.0 |
| 11 | 11.0 | 16.8 | 10.3 | 15.3 |
| 12 | 11.4 | 16.9 | 9.9 | 15.5 |
| 13 | 11.0 | 16.4 | 10.0 | 14.8 |
| 14 | 10.0 | 15.7 | 9.5 | 14.6 |
| 15 | 10.3 | 15.2 | 9.4 | 14.8 |
| 16 | 10.7 | 15.6 | 9.4 | 14.2 |
| 17 | 10.5 | 16.3 | 9.3 | 14.3 |
| 18 | 10.2 | 15.6 | 9.0 | 14.5 |
| 19 | 10.4 | 15.8 | 9.0 | 14.1 |
| 20 | 10.2 | 15.1 | 9.0 | 13.2 |
| 21 | 10.1 | 15.2 | 9.3 | 14.5 |
| 22 | 10.0 | 15.6 | 8.7 | 13.8 |
| 23 | 9.8 | 15.0 | 9.0 | 14.2 |
| 24 | 9.7 | 14.7 | 9.1 | 13.1 |
| 25 | 10.0 | 14.7 | 9.1 | 12.9 |
| 26 | 9.6 | 13.9 | 9.6 | 12.7 |
| 27 | 9.6 | 14.5 | 9.4 | 13.6 |
| 28 | 10.0 | 14.1 | 10.0 | 13.6 |
| 29 | 9.9 | 14.8 | 9.5 | 13.6 |
| 30 | 10.0 | 15.0 | 9.3 | 13.9 |
| 31 | 9.9 | 14.7 | 9.4 | 13.8 |
| 32 | 10.1 | 14.8 | 9.4 | 13.6 |
| 33 | 9.9 | 15.1 | 9.4 | 13.9 |
| 34 | 10.4 | 14.5 | 9.7 | 13.3 |
| 35 | 9.3 | 14.5 | 9.0 | 12.8 |
| 36 | 9.7 | 14.9 | 9.0 | 13.6 |
| 37 | 9.9 | 15.7 | 8.8 | 13.9 |
| 38 | 10.3 | 16.2 | 9.1 | 14.1 |
| 39 | 10.1 | 16.3 | 9.3 | 14.5 |
| 40 | 10.1 | 16.2 | 9.5 | 14.9 |
| 41 | 10.3 | 17.2 | 9.5 | 14.4 |
| 42 | 11.0 | 17.9 | 9.9 | 16.3 |
| 43 | 10.4 | 17.4 | 9.4 | 15.2 |
| 44 | 11.4 | 17.8 | 9.7 | 15.1 |
| 45 | 10.9 | 18.1 | 9.9 | 16.8 |
| 46 | 11.5 | 17.7 | 10.0 | 16.1 |
| 47 | 10.8 | 18.7 | 9.9 | 16.2 |
| 48 | 11.3 | 18.6 | 10.0 | 16.7 |
| 49 | 11.6 | 18.7 | 10.2 | 16.5 |
| 50 | 11.5 | 18.1 | 9.8 | 16.2 |
| 51 | 11.3 | 16.1 | 9.9 | 14.2 |
| 52 | 10.8 | 15.4 | 10.1 | 13.6 |
| 53 (partial week) | 10.4 | 13.1 | 9.0 | 11.1 |
Figure 5.3: Sentinel surveillance of emergency department visits for traumatic brain injuries, all mechanisms, CHIRPP/eCHIRPP, 1990 to 2018Figure 5.3 Footnote a, normalizedFigure 5.3 Footnote b (per 100,000 records in the same age group)
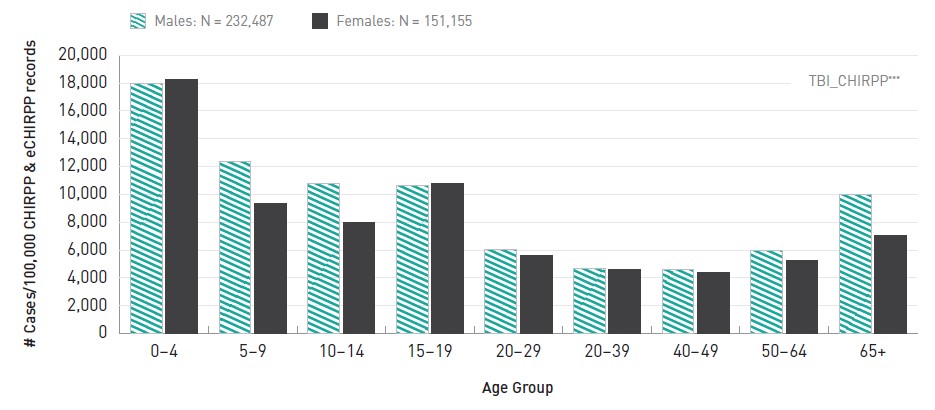
- Figure 5.3 Footnote a
-
2018 is incomplete; extraction date = October 5, 2018
- Figure 5.3 Footnote b
-
Proportions are expressed as a normalized frequency relative to system denominators (not population denominators). As such, proportions per 100,000 records are normalized to all cases in the eCHIRPP database for the given age group and sex, on the data extraction date. See Chapter 3 for more information.
CHIRPP traumatic brain injury surveillance definition: any of the three injury fields contains minor (closed) head injury, concussion, intracranial injury, or skull/facial fracture/crushing injury.
Text description
| Age Group | Males | Females |
|---|---|---|
| 0-4 | 17,983.7 | 18,276.3 |
| 5-9 | 12,357.5 | 9,351.6 |
| 10-14 | 10,777.8 | 7,984.2 |
| 15-19 | 10,627.3 | 10,754.3 |
| 20-29 | 6,021.3 | 5,618.1 |
| 20-39 | 4,702.1 | 4,634.5 |
| 40-49 | 4,578.5 | 4,411.2 |
| 50-64 | 5,931.8 | 5,241.5 |
| 65+ | 10,003.6 | 7,042.6 |
|
||
Discussion
An increasing trend in TBI for both males and females was observed over the period from 1990 to 2018. Since CHIRPP is a numerator-based system, some of the increase could be due to exposure but since the data are normalized some of the increase is likely due to increased reporting/diagnosis and possibly an inherent increase in TBI. The trend results (Figure 5.1) are similar to the NACRS data presented in the previous section (increases in the recent 5 to 10 years).
Similar results have been found in other studies. Taylor et al.Footnote 8 showed increases in rates of TBI between 2007 and 2013 and found that the highest rates were among individuals 75 years and older and those under 5 years of age. Zemek et al.Footnote 110 found increases in ED and physician office visits for concussion (Ontario, Canada), particularly since 2010.
Figure 5.3 shows that for recent years (2011 to 2018) there is some weekly variation in the proportion of all injuries that are TBI. Some of this variation may be due to the seasonality of various sports and recreational activities.
While Figures 5.1 to 5.3 show the overall trends over all external causes, other studies in this series will detail specific mechanisms, sexes and age groups.
Sentinel surveillance of TBI show similar patterns to those reported from other sources. Continued tracking of TBI in close to real time is important in the assessment of the burden and changes in patterns of brain injuries.
6. Sentinel surveillance of emergency department visits for traumatic brain injuries and all head injuries associated with sports and recreation
Electronic Canadian hospitals injury reporting and prevention program (eCHIRPP), 2011 to 2017, ages 5 to 19 years
Introduction
Sports and recreational activity (SPAR)-related brain injuries among youth is a topic of growing concern in recent yearsFootnote 12Footnote 28Footnote 111. Our increased understanding of the potential long-term consequences of repeat concussionsFootnote 28Footnote 113 points to the need for continued surveillance. Some SPAR are specified in ICD-10-CA (see Table A1 in Appendix A). However, many are not identifiable in ICD-10 data and are coded to either W21.08 (Striking against or struck by other specified sport equipment), W21.09 (Striking against or struck by other unspecified sport equipment), W22.07 (Striking against or struck by other objects while engaged in other sports/recreation), W51.07 (Striking against or bumped into by another person in other sports/recreation), or another, less specific, code. Other sports are partially grouped such as football/ rugby and skiing/snowboarding. While this is adequate to assess burden, more specific information is required to inform sport-specific injury prevention initiatives. The eCHIRPP system contains 145 SPAR codes arranged into 25 groups to allow the identification of almost any specific sport or recreational activity. Rare or newly emerging activities can be identified from the narrative fields.
The purpose of this study was to identify the current most frequent sports and recreational activities associated with brain injuries among children and youth by age and sex.
Sports and recreational activity (SPAR)-related brain injuries among youth is a topic of growing concern in recent yearsFootnote 12Footnote 28Footnote 111.
Methods
The eCHIRPP system was searched from 2011 to 2017 (as of December 1, 2017) for cases coded with a SPAR code among children and youth 5 to 19 years of age (60 to 239 months). Specific sports activities were sorted by number of injuries and only those with a count of 100 or higher were included in the analysis (SPAR where the count had less than 100 cases tended to have unstable proportions). SPAR were then ranked based on the ratio of traumatic brain injury (TBI) (see CHIRPP TBI surveillance definition in previous section) relative to all injuries in that sport for the specific age group and sex. For the fifth ranked position, if two SPAR had the same proportion the one with the highest count took precedence.
Results
Figures 6.1 to 6.6 show the results of the ranking analysis by age group and sex. Among males 5 to 9 years of age, ice hockey was the highest TBI-ranked sport, with almost half (43.4%) of all injuries presenting to the ED being a TBI. For 5 to 9 year old females, ice hockey is also the most frequent with TBI-ranked at 30.9% of all injuries. Ice hockey and rugby were the top TBI-ranked sports among 10 to 14 year old boys (28.7% and 28.5%, respectively) while among girls of the same age ringette was the most frequent at 38.2%. Ringette was also the highest TBI-ranked sport among 15 to 19 year old females (44.3%), followed closely by ice hockey at 37.1%, while for males it was rugby (27.0%).
Figure 6.1: Five sports and recreational activities with the highest proportion of traumatic brain injuries (relative to all injuries), eCHIRPP, 2011 to 2017, males, ages 5 to 9 years
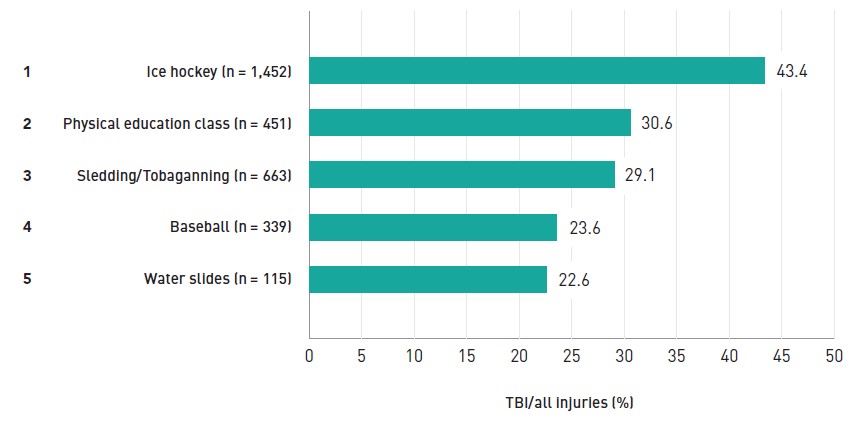
Text description
| Sport | % of injuries that are TBIs | |
|---|---|---|
| 1 | Ice hockey (n = 1,452) | 43.4 |
| 2 | Physical education class ( n = 451) | 30.6 |
| 3 | Sledding/Tobaganning (n = 663) | 29.1 |
| 4 | Baseball (n = 339) | 23.6 |
| 5 | Water slides (n = 115) | 22.6 |
Figure 6.2: Five sports and recreational activities with the highest proportion of traumatic brain injuries (relative to all injuries), eCHIRPP, 2011 to 2017, females, ages 5 to 9 years
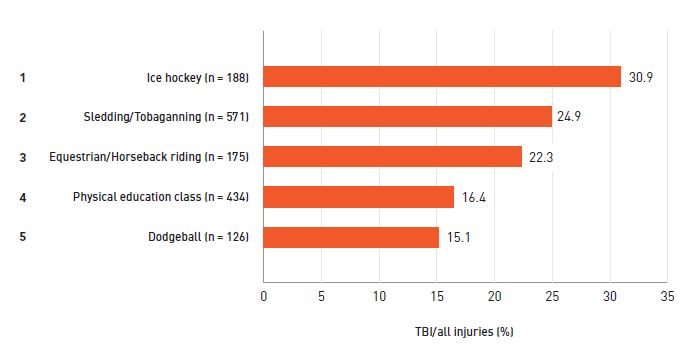
Text description
| Sport | % of injuries that are TBIs | |
|---|---|---|
| 1 | Ice hockey (n = 188) | 30.9 |
| 2 | Sledding/Tobaganning (n = 571) | 24.9 |
| 3 | Equestrian/Horseback riding (n = 175) | 22.3 |
| 4 | Physical education class ( n = 434) | 16.4 |
| 5 | Dodgeball (n = 126) | 15.1 |
Figure 6.3: Five sports and recreational activities with the highest proportion of traumatic brain injuries (relative to all injuries), eCHIRPP, 2011 to 2017, males, ages 10 to 14 years
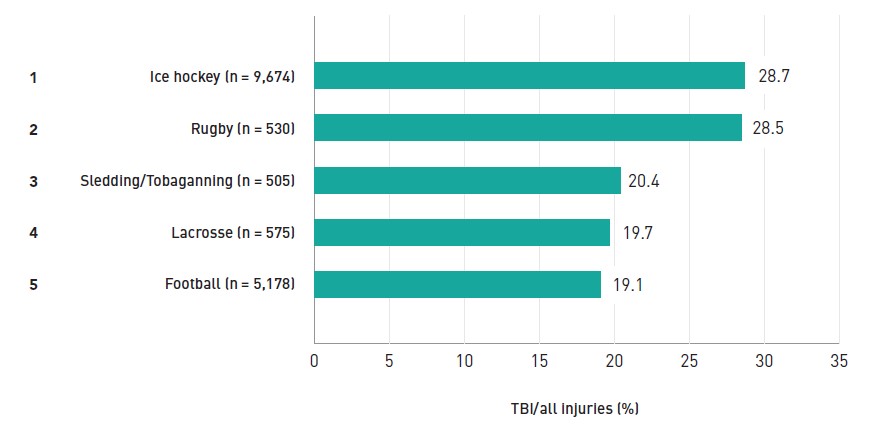
Text description
| Sport | % of injuries that are TBIs | |
|---|---|---|
| 1 | Ice hockey (n = 9,674) | 28.7 |
| 2 | Rugby (n = 530) | 28.5 |
| 3 | Sledding/Tobaganning (n = 505) | 20.4 |
| 4 | Lacrosse ( n = 575) | 19.7 |
| 5 | Football (n = 5,178) | 19.1 |
Figure 6.4: Five sports and recreational activities with the highest proportion of traumatic brain injuries (relative to all injuries), eCHIRPP, 2011 to 2017, females, ages 10 to 14 years
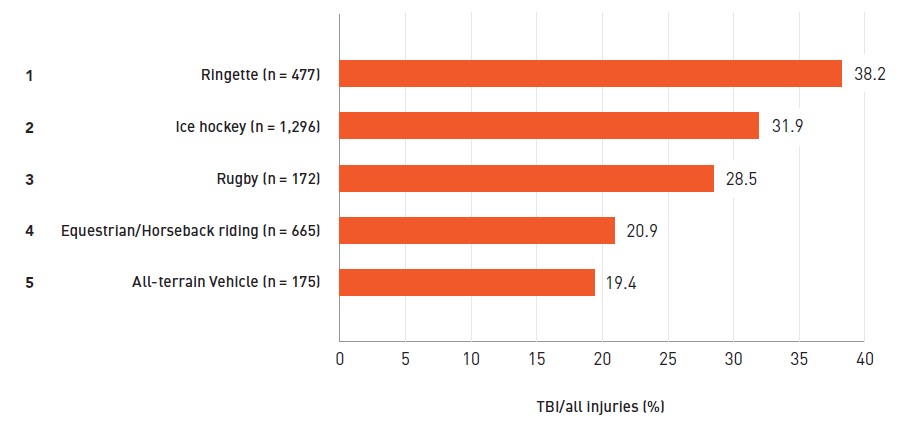
Text description
| Sport | % of injuries that are TBIs | |
|---|---|---|
| 1 | Ringette (n = 477) | 38.2 |
| 2 | Ice hockey (n = 1,296) | 31.9 |
| 3 | Rugby (n = 172) | 28.5 |
| 4 | Equestrian/Horseback riding (n = 665) | 20.9 |
| 5 | All-terrain Vehicle (n = 175) | 19.4 |
Figure 6.5: Five sports and recreational activities with the highest proportion of traumatic brain injuries (relative to all injuries), eCHIRPP, 2011 to 2017, males, ages 15 to 19 years
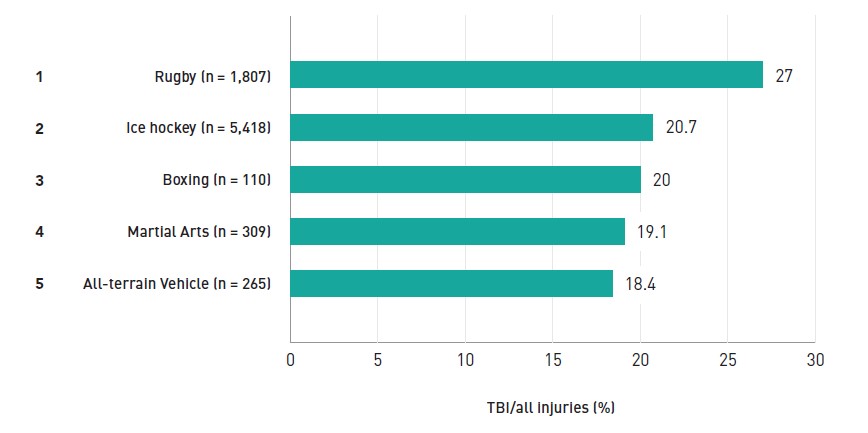
Text description
| Sport | % of injuries that are TBIs | |
|---|---|---|
| 1 | Rugby (n = 1,807) | 27 |
| 2 | Ice hockey (n = 5,418) | 20.7 |
| 3 | Boxing (n = 110) | 20 |
| 4 | Martial Arts (n = 309) | 19.1 |
| 5 | All-terrain Vehicle (n = 265) | 18.4 |
Figure 6.6: Five sports and recreational activities with the highest proportion of traumatic brain injuries (relative to all injuries), eCHIRPP, 2011 to 2017, females, ages 15 to 19 years
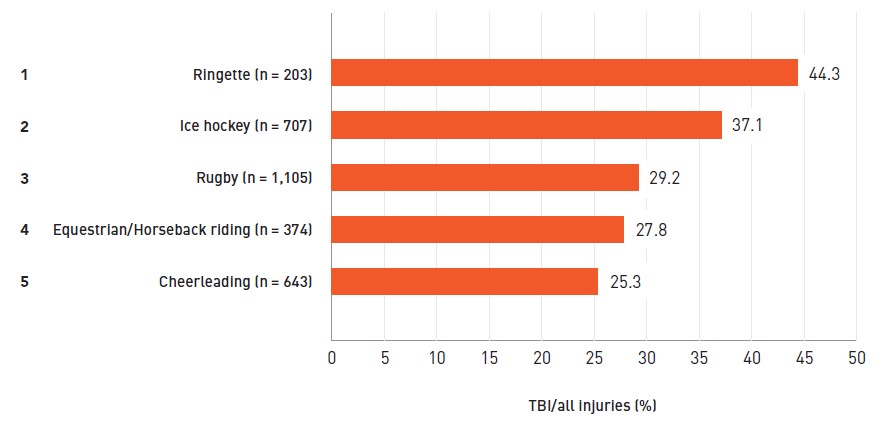
Text description
| Sport | % of injuries that are TBIs | |
|---|---|---|
| 1 | Ringette (n = 203) | 44.3 |
| 2 | Ice hockey (n = 707) | 37.1 |
| 3 | Rugby (n = 1,105) | 29.2 |
| 4 | Equestrian/Horseback riding (n = 374) | 27.8 |
| 5 | Cheerleading (n = 643) | 25.3 |
Discussion
The results of this analysis indicate that there are many SPAR, both contact and non-contact, which are associated with a relatively high proportion of TBI among Canadian children and youth. There were a number of SPAR that would not have been identified (fully or partially) under an ICD-coded system (ringette, lacrosse, physical education class, dodge ball, rugby, cheerleading, equestrian, water slides, and martial arts).
Most of the activities listed in Figures 6.1 to 6.6 involve both unintentional and intentional impacts (hockey, rugby, football, lacrosse, ringette, boxing, martial arts), speed (sledding/tobogganing, water slides, ATV) or falls from heights (cheerleading, equestrian).
As expected, ice hockey emerges as a most frequent-ranked sport in all age groups and both sexes. In addition to being a high participation sport, hockey is a fast-paced activity with risk of collisions with the boards, goal posts as well as with other players (both intentional and unintentional). Stick and puck impacts are also significantFootnote 114Footnote 115Footnote 116. Interestingly, despite being designated a non-contact sport in women's leagues, girls'/women's hockey still emerges as a frequent sport associated with a relatively high proportion of TBI. There is some evidence from boys' hockey that more injuries and more serious injuries occurred from unintentional collisions than from intentional body contactFootnote 117. A 2014 study also using CHIRPP data (1995 to 2009)Footnote 54 found that unintentional collisions were the most frequent mechanism among female hockey players and females were injured almost twice as frequently due to falls, compared to males. Also, females had significantly (although not clinically significant) more mild TBI than males. Two other studies in this report will delve into hockey-related head injuries (both men and women) in more detail.
Rugby also emerges as a sport with a high percentage of TBI for both males and females aged 10 to 19 years. A Canadian studyFootnote 118 of rugby injuries (1993 to 2003, ages 14 and older) found that about 10% of all injuries were neurotrauma, with the highest proportion among 14 to 16 year olds (12.4%). Although that study used a wider age group and different definitions than the current analysis, it also used CHIRPP data (Kingston, Ontario sites), and it appears that the proportion of TBI was increasing at the time of the study. Another Canadian study on concussion in a number of varsity sports (men and women) found that women's rugby had the highest incidence of 20 concussions per athlete-seasonFootnote 119. Another study in this report looks at female rugby injuries in more detail.
Recently, ATV-related injuries have appeared in the high rankings of this study (fifth) among 10 to 14 year old females; these injuries had not ranked as highly in previous analyses. In 50% of the TBI cases, a young girl was driving the ATV. Paediatric ATV injuries are an ongoing problem. A recent study out of Nova ScotiaFootnote 120 found that legislation and social marketing interventions had resulted in a short-term effect of a decrease in the frequency of ATV-related injuries, but had no sustained effect.
Baseball is considered a non-contact sport, yet among 5 to 9 year old boys, 23.6% of all injuries in this study are TBI. Of these 80 TBI injuries, 41 (51.3%) were due to ball impacts and 31 (38.8%) were due to bat impacts. A U.S. studyFootnote 121 found that 5.8% of all injuries were concussions/closed head injuries and 33.5% of injuries were to the face. Ball impacts were the leading mechanism (46%) followed by the bat (24.9%). Ball impacts in baseball are also a concern for the rare event of commotio cordisFootnote 122.
Cheerleading emerges as the fifth-ranked activity among 15 to 19 year old females. Cheerleading injuries often involve falls from heights and can be serious in nature. A previous study of CHIRPP dataFootnote 123 found that 44.3% of injuries were the result of stunts at height and 29% involved the head and neck.
Ringette consistently shows up in analyses as a top activity (among females) where the percentage of head injuries is very highFootnote 59. There is no clear reason for this, but it is possible that those presenting to the ED do not present as often for non-head injuries or there are inherently fewer non-head injuries (compared to other sports), either way inflating the percentage of TBI relative to all injuries.
The combat sports of boxing and martial arts have emerged as frequent TBI-associated activities among males 15 to 19 years of age. Boxing has a long history of controversy in the medical community, particularly with respect to chronic traumatic encephalopathy (CTE)Footnote 124. In a 2012 Position Statement, the Canadian Paediatric Society recommended that paediatricians vigorously oppose boxing as a sport for any child or adolescentFootnote 125. A 2011 study of boxing injuries presenting to U.S. emergency departments found that TBI accounted for 8–9% of all injuries, depending on ageFootnote 126. More recently, mixed martial arts (MMA) has gained popularity. A study from Alberta found that concussion was the most common type of injury (62.3%)Footnote 127.
A number of sports that appear in the five most frequent rankings have a percentage of all TBI that are concussion of 75% or less (data not shown). This indicates other, potentially more serious, injuries including moderate to severe brain injuries, skull/facial fractures or crushing injuries. These activities include baseball (75%), boxing (54.5%), and ATV (73.5% for females 10–14 years; 46.8% for males 15 to 19 years). The current study only shows the five most frequent sports and recreational activities. Information on all SPAR TBI captured in eCHIRPP is presented in the Public Health Agency of Canada's Public Health Infobase data blog on this topicFootnote 128.
The total number of injuries for each sport is heavily influenced by popularity and participation as well as risk. Since CHIRPP is a numerator-based database, the denominator used in this study was all CHIRPP injuries for that sport (by age/sex). This allows for an internal comparison and is less influenced by participation. However, this is only valid for ED visits since, for a given SPAR, a higher proportion of head-injured patients may seek care at an ED versus another health care option. So, the proportions reported here would not necessarily be the same at another point of care.
Continued, timely surveillance is necessary to identify changing patterns, including new, emerging sports/activities, which may be associated with TBI. Surveillance is also useful in tracking trends over time to assess the effectiveness of prevention efforts.
7. Sentinel surveillance of emergency department visits for traumatic brain injuries and all head injuries associated with male organized ice hockey, comparing legal versus penalizable play
The electronic Canadian hospitals injury reporting and prevention program (eCHIRPP), 2011 to 2017, males, ages 10 to 19 years
Introduction
Organized minor league ice hockey is a popular sport in Canada, with over 626,000 registered players (males and females) in the 2017–2018 seasonFootnote 129. Along with the important health and social benefits of sports participationFootnote 130Footnote 131Footnote 132Footnote 133Footnote 134, sports can come with a risk of traumatic brain injury (TBI)Footnote 135, with the majority of sport-related TBI sustained while playing contact-collision and high-velocity sports including ice hockeyFootnote 136. Evidence shows concussions are among the most common youth hockey-related injuryFootnote 137, and can lead to long-term cognitive deficitsFootnote 138.
Overall, the most common mechanism of injury in minor ice hockey is body checkingFootnote 139Footnote 140Footnote 141. A body check is a defensive play by the checker who uses body contact against an opposing player possessing the puck, to stop the player’s progress and/or to separate the player from the puckFootnote 142. In response to a growing body of evidence on the risk of injury from body checking, in 2012 USA Hockey introduced a policy to delay body checking in ice hockey until the Bantam level (ages 13 to 14)Footnote 143, and in 2013 Hockey Canada introduced a similar policyFootnote 144. There is evidence that this change is associated with reduced TBI risk among Pee Wee players (aged 11 to 12 years)Footnote 139.
The objective of this study was to identify and describe cases of TBI and all head injuries related to legal versus penalizable play in male organized ice hockey among patients aged 10 to 19 years, captured in eCHIRPP. For TBI specifically, select details surrounding the injury event concerning play legality (e.g., allowable body checks versus prohibited head checks) are reported in eCHIRPP and this level of detail is not discernable in other health administrative data sources coded with the following ICD-10-CA codes: W21.02 striking against or struck by hockey stick; W21.03 striking against or struck by hockey puck; W22.02 striking against or struck by other objects while playing hockey; and W51.02 striking against or bumped into by another person in hockeyFootnote 64.
Methods
Records in the eCHIRPP database with an injury date from April 1, 2011 onward were extracted on June 27, 2017. Cases of head injuries including TBI among male patients aged 10 to 19 years (120 to 239 months) related to playing organized ice hockey were identified. Using the head injuries and TBI surveillance definitions described earlier in the Methods section of this report, case identification criteria also included records with the sports and recreation (SPAR) variable coded as “S1118: Ice hockey” or the patient’s narrative contained the keyword “hockey”, and the Organized Sport variable coded as “1” for “Yes” (organized sport involves coaches and/or officials). Patients’ narratives describing the injury event in a 25% sample of TBI cases were also individually assessed and coded according to legal versus penalizable player interactionsFootnote a. Injuries involving other types of hockey were excluded, including informal ice hockey (often called pick-up hockey or shinny), field hockey, sledge hockey, ball/cosom/floor/street hockey, and other variations. Study results are reported as counts (N, n), percentages, and as a normalized frequency distribution per 100,000 eCHIRPP records (see Chapter 3 for more information on normalization).
Results
Overall there were 5,154 head injuries during the study period among male patients aged 10 to 19 years, sustained while playing organized ice hockey (3,068.7 cases per 100,000 records). Of those, 90% (n = 4,641; 2,763.2/100,000) were TBI. Figure 7.1 presents the frequency distribution of organized ice hockey-related TBI among males aged 10 to 17 years as a trend over time. The overall frequency of cases aged 10 to 17 years declined between 2012 and 2015, and then increased thereafter. This trend was most prominent among those aged 11 to 12 years.
Figure 7.1: NormalizedFigure 7.1 Footnote a annual frequency distribution of traumatic brain injury cases associated with male organized ice hockey, eCHIRPP, 2011 to 2017, ages 10 to 17Figure 7.1 Footnote b years, per 100,000 records
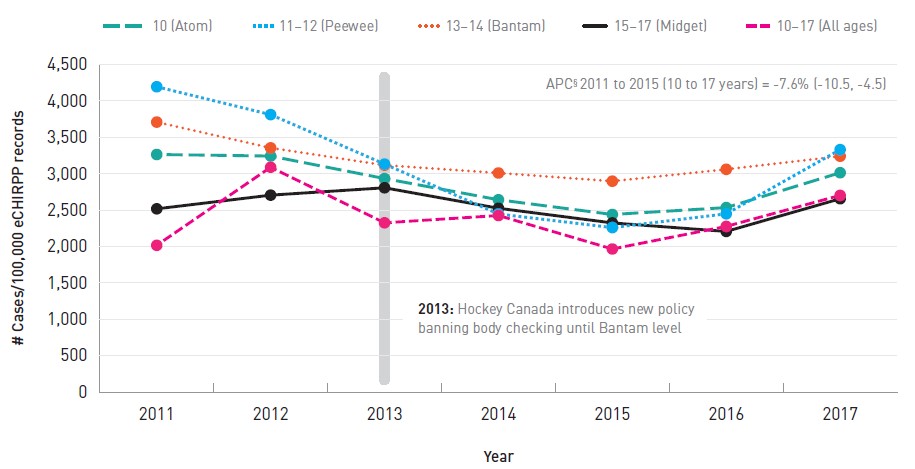
- Figure 7.1 Footnote a
-
Proportions are expressed as a normalized frequency relative to system denominators (not population denominators). As such, proportions per 100,000 records are normalized to all male cases in the eCHIRPP database in each calendar year for the given age group, on the data extraction date. See Chapter 3 for more information.
- Figure 7.1 Footnote a
-
Data for 18 and 19 year olds omitted due to small numbers.
Text description
| Year | Age Group (Level) | ||||
|---|---|---|---|---|---|
| 10 (Atom) | 11-12 (Peewee) | 13-14 (Bantam) | 15-17 (Midget) | 10-17 (All ages) | |
| 2011 | 2,016.7 | 4,195.2 | 3,709.4 | 2,517.9 | 3,264.5 |
| 2012 | 3,089.1 | 3,812.2 | 3,355.2 | 2,705.7 | 3,243.0 |
| 2013 | 2,325.6 | 3,133.1 | 3,117.6 | 2,807.0 | 2,933.7 |
| 2014 | 2,426.0 | 2,446.9 | 3,010.2 | 2,525.6 | 2,642.4 |
| 2015 | 1,966.1 | 2,259.9 | 2,897.6 | 2,324.2 | 2,440.1 |
| 2016 | 2,276.7 | 2,449.2 | 3,060.5 | 2,207.1 | 2,534.9 |
| 2017 | 2,702.7 | 3,331.4 | 3,241.2 | 2,656.2 | 3,013.9 |
APC 2011 to 2015 (10 to 17 years) = -7.6% (-10.5, -4.5) APC: Annual percent change |
|||||
Figure 7.2 presents the age distribution of male organized hockey-related head injuries (all types) and TBI. The highest proportion of head injuries overall and TBI was among players aged 13 to 14 years, at 3,444.9 and 3,170.8/100,000 cases, respectively.
Figure 7.2: NormalizedFigure 7.2 Footnote a ageFigure 7.2 Footnote b distribution of all head injury cases and traumatic brain injury cases associated with male
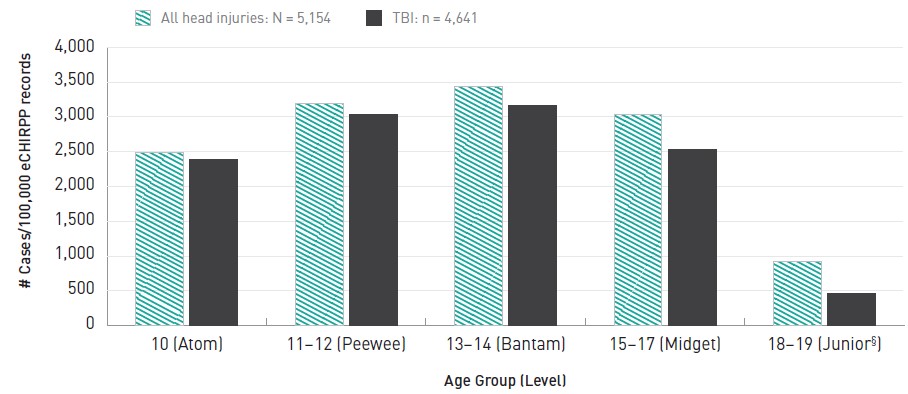
- Figure 7.2 Footnote a
-
Proportions are expressed as a normalized frequency relative to system denominators (not population denominators). As such, proportions per 100,000 records are normalized to all male cases in the eCHIRPP database for the given age group, on the data extraction date. See Chapter 3 for more information.
- Figure 7.2 Footnote b
-
Results are based on the age at injury; however, ages are grouped to approximate the following Hockey Canada age categories, in terms of a player's age as of December 31st of the current season: Atom – 10 year olds (< 11 years); Peewee – 11 to 12 year olds (under 13 years); Bantam – 13 to 14 year olds (under 15 years); Midget – 15 to 17 year olds (under 18 years); Junior – 18 years or older.
Note: Results in the 18 to 19 years of age category (Junior) should be interpreted with caution due to small numbers.
Text description
| Age Group (Level) | All head injuries | TBIs |
|---|---|---|
| 10 (Atom) | 2,485.1 | 2,382.9 |
| 11-12 (Peewee) | 3,198.8 | 3,032.5 |
| 13-14 (Bantam) | 3,444.9 | 3,170.8 |
| 15-17 (Midget) | 3,040.7 | 2,532.3 |
| 18-19 (Junior, interpret with caution due to small numbers) | 917.6 | 458.8 |
|
||
Figure 7.3 presents the distribution of TBI according to legal versus penalizable patient-reported player interactions within each age group, based on a 25% random sample of TBI cases; it does not account for incidental events where no direct interaction with another player was reported (mechanisms of incidental events are presented in Table 7.1). Age groups are grouped to approximate the Hockey Canada age categoriesFootnote 145. With the exception of players aged 15 to 17 years (the Midget age category), all age groups showed an overall higher percentage of injuries sustained during legal player interactions, although injuries related to penalizable interactions were still all over 40% in the three youngest age groups. More than half (55.4%) of reported interactions among players aged 15 to 17 years were penalizable (e.g., head checks, intentional tripping, etc.).
Figure 7.3: Percentage distribution of penalizable player interactionsFigure 7.3 Footnote a among traumatic brain injury cases associated with male organized ice hockey, by levelFigure 7.3 Footnote b, eCHIRPP, 2011 to 2017, ages 10 to 19 years
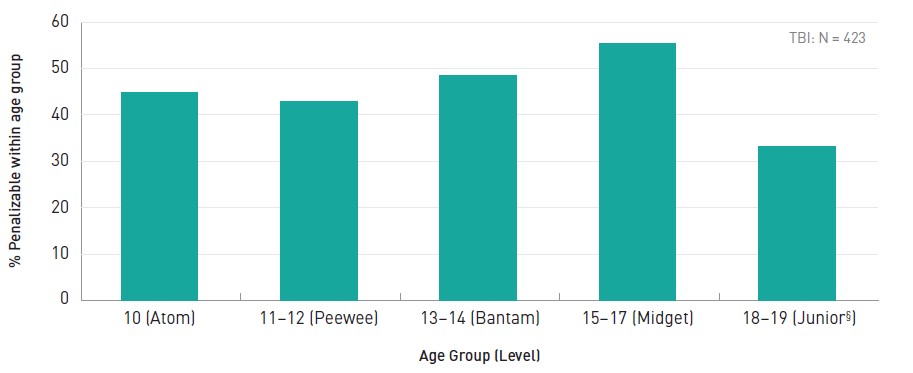
- Figure 7.3 Footnote a
-
Based on a 25% random sample of the full dataset comprising TBI sustained while playing organized ice hockey, among boys aged 10 to 19 years.
- Figure 7.3 Footnote b
-
Results are based on the age at injury; however, ages are grouped to approximate the following Hockey Canada age categories, in terms of a player's age as of December 31st of the current season: Atom – 10 year olds (< 11 years); Peewee – 11 to 12 year olds (under 13 years); Bantam – 13 to 14 year olds (under 15 years); Midget – 15 to 17 year olds (under 18 years); Junior – 18 years or older.
Note: that results in the 18 to 19 years of age category (Junior) should be interpreted with caution due to small numbers.
Text description
| Age Group (Level) | Percentage |
|---|---|
| 10 (Atom) | 44.9 |
| 11-12 (Peewee) | 42.9 |
| 13-14 (Bantam) | 48.5 |
| 15-17 (Midget) | 55.4 |
| 18-19 (Junior, interpret with caution due to small numbers) | 33.3 |
TBI: N = 423 |
|
Table 7.1 provides details on the mechanism of injury among patients who sustained a TBI while playing organized ice hockey, based on a 25% random sample. Mechanisms are organized according to legal player interactions, penalizable player interactions, and other events where no direct interaction with another player was reported by the patient.
Overall, legal player interactions had the highest share at 41.6% of patient-reported TBI mechanisms, while penalizable interactions followed closely at 39.4%. The remaining mechanisms were those that reportedly did not directly involve another player, at 19.0%. Contact with the boards accounted for nearly half (47.8%) of the injury mechanisms among legal interactions, and one-fifth (19.9%) of all injury mechanisms (legal, penalizable, and other). Checks/hits were the most common injury mechanism during penalizable player interactions at 60.5%, and the most common injury mechanism overall at 23.8%. Nearly half of penalizable hits were to the head (47.2%), and hits to the head comprised 11.3% of all injury mechanisms. Among other events where the patient did not report direct interaction with another player, the most common injury mechanism was contact with the ice at 40.2%, and 7.6% of injury mechanisms overall.
Overall, legal player interactions had the highest share at 41.6% of patient-reported TBI mechanisms, while penalizable interactions followed closely at 39.4%.
| MechanismTable 7.1 Footnote aTable 7.1 Footnote b | # | % Of overall total (% of N = 1,074) |
|
|---|---|---|---|
| Legal player interactions | |||
| Contact with boards | Total | 214 | 19.9 |
| Body-checked into boards | 178 | 16.6 | |
| Pushed into boards | 29 | 2.7 | |
| Hit boards while giving check, or other player interaction involving boards | 7 | 0.7 | |
| Unintentional collision/contact with body part | 111 | 10.3 | |
| Body checked as open ice hit/no contact with boards reported | 107 | 10.0 | |
| Other legal player interaction (pulled/knocked/pushed down; other player fell on patient; tripped over fallen player) | 10 | 0.9 | |
| Struck the goal post after contact with other player | 5 | 0.5 | |
| Total legal player interactions | 447 | 41.6 | |
| Penalizable player interactions | |||
| Illegal checks or hits | Total | 256 | 23.8 |
| Hit to the head (head-checked, head shot, clotheslined) | 121 | 11.3 | |
| Body checked from behind, including hit head-first into the boards | 98 | 9.1 | |
| Cross-checked | 27 | 2.5 | |
| Other improper body check including charged, boarded, blindsided, cheap-shot | 10 | 0.9 | |
| Struck by opponent’s elbow | 91 | 8.5 | |
| Struck with opponent’s stick, including stick to face or head, slashed, hooked | 26 | 2.4 | |
| Tripped by opponent | 21 | 2.0 | |
| Struck by opponent’s knee | 10 | 0.9 | |
| Pushed by opponent, including from behind or head-first into the boards | 10 | 0.9 | |
| Involved in fight/roughing/was punchedTable 7.1 Footnote a | 9 | 0.8 | |
| Total penalizable player interactions | 423 | 39.4 | |
| Other events (no interaction with others reported) | |||
| Contact with the ice (after falling/tripping/otherwise losing balance, catching skate edge, skating backwards, etc.) | 82 | 7.6 | |
| Hit/collided with boards (after loss of control, or NFSTable 7.1 Footnote c) | 74 | 6.9 | |
| Struck by the puck | 36 | 3.4 | |
| Struck the goal post | 5 | 0.5 | |
| Other events (no recollection of what happened; injury to head NFSTable 7.1 Footnote c; overheated; loss of consciousness/dizziness; struck by door) | 7 | 0.7 | |
| Total other events | 204 | 19.0 | |
| Total overall | 1,074 | 100.0 | |
|
|||
Discussion
This study identified and described cases of TBI and all head injuries related to legal versus penalizable play in male organized ice hockey among patients 10 to 19 years of age. The overall frequency (10 to 17 year olds) of these cases in the database declined between 2012 and 2015, and then increased thereafter, with the trend being most prominent among the 11 to 12 year olds. This may be partly indicative of reduced injury risk among Pee Wee players following Hockey Canada’s 2013 policy to delay body checking until the Bantam level (13 to 14 years). The increase from 2015 onward may be due to increased awareness and reporting.
The frequency of organized hockey-related TBI in relation to all injury cases among males aged 10 to 19 years in the eCHIRPP database increased with the older age groups in the study population, and then decreased as players reached the 15 to 17 year age group. The literature shows mixed evidence for age as an injury risk factor in youth sports. Some research has shown increasing age among adolescents to be associated with increased injury riskFootnote 146, while others argue that younger less experienced players are more prone to injury in certain contextsFootnote 147.
In this study, both legal and penalizable player interactions causing TBI were distributed relatively consistently across the age groups with legal play being more common in all age groups except among 15 to 17 year olds who showed a slightly larger proportion of penalizable injury mechanisms. This could be indicative of more aggressive manoeuvring such as powerful body checking as players physically develop and play becomes more competitive. Legal plays including body checks into the boards contributed to the highest overall share of patient-reported TBI mechanisms; penalizable player interactions followed closely, and the most common specific mechanisms of TBI overall in the random sample analyzed were illegal checks and hits including head checks and hits from behind. These results are supported by the literature which consistently reports body checking as the most common mechanism of injury in ice hockeyFootnote 139Footnote 140Footnote 141. The distribution of injury mechanisms was substantially different compared to the women’s organized ice hockey study also found in this report. This is likely explained in part by body checking being permissible in men’s hockey but not in women’s hockey.
Moreover, the proportion of TBI attributable to penalizable interactions were considerably lower among the men than women, which is also possibly because all body checking is illegal in women’s hockey. Previous research comparing men’s and women’s organized ice hockey using earlier CHIRPP data also showed body checking to be an important cause of injury among both sexesFootnote 54.
Injury prevention is an important component of minor hockey in Canada.
An important limitation to note in regards to both studies is that injury mechanisms were classified according to patients’ narratives of the injury event; therefore it is possible that some could be misclassified due to missing or inconsistently reported information.
Injury prevention is an important component of minor hockey in Canada. In addition to Hockey Canada’s policy change in 2013 to delay body checking until the Bantam level (ages 13 to 14)Footnote 144, injury prevention is incorporated directly into skills development and safety programmingFootnote 148. Moreover, an important development in the management of concussions sustained in organized sport in Canada was the July 2017 release of the evidence-based Canadian Guideline on Concussion in Sport by Parachute, a national Canadian injury prevention charity, which “…aims to ensure that athletes with a suspected concussion receive timely and appropriate care, and proper management to allow them to return to their sport”Footnote 32. Sport specific concussion protocols were then released in 2018 for implementation by national sporting organizations (NSOs)Footnote 149, and as of December 2019, 45 of 56 NSOs have committed to adopting the protocols. In 2018, significant updates were also developed by Canadian experts for the Concussion Awareness Training Tool (CATT) for Medical ProfessionalsFootnote 33, the content of which aligns with the internationally recognized 5th Consensus Statement on Concussion in sportFootnote 12.
All contact sports have an inherent risk of injury due to the physical contact and interaction with other players and the high intensity of physical activity. This is evident in the results of this study whereby, even if all illegal interactions were reduced, there would still be a sizeable proportion of legal interactions between players that have the potential to cause TBI. This highlights the importance of official policies to reduce the risk of injury and the continued emphasis on injury prevention when developing skills among young players.
8. Sentinel surveillance of emergency department visits for traumatic brain injuries and all head injuries associated with female organized ice hockey
The electronic Canadian hospitals injury reporting and prevention program (eCHIRPP), 2011 to 2017, females, ages 10 to 19 years
Introduction
Ice hockey is a fast paced contact team sport that involves players from each team using strategy and physical skill to score pointsFootnote 150. As a result of the high speed of play, the equipment used, and various legal and illegal manoeuvres, ice hockey is considered to be high-riskFootnote 151Footnote 152Footnote 153. Canadian data suggest that ice hockey injuries account for 10% of adolescent sport injuriesFootnote 154.
Globally, Canada has one of the highest percentages of female players in minor ice hockey at 13.8%Footnote 129Footnote 155. A study of female youth ice hockey players found that rates of injuries were lower than among male youth organized ice hockey or older female organized ice hockey players, which may be as a result of different rules about body checking for male players and possible previous injuries among older female hockey playersFootnote 156. A 2014 study using CHIRPP data found that unintentional collisions were the most frequent mechanism of injury among female hockey players and females were injured almost twice as frequently due to falls, compared to malesFootnote 54.
Select details surrounding the traumatic brain injury (TBI) event concerning play legality (e.g., unintentional collisions versus prohibited head checks) are reported in CHIRPP that are not available in other health administrative data sources coded with the following ICD-10-CA codes: W21.02 striking against or struck by hockey stick; W21.03 striking against or struck by hockey puck; W22.02 striking against or struck by other objects while playing hockey; and W51.02 striking against or bumped into by another person in hockeyFootnote 64. Therefore, the objective of this study was to identify and describe cases of traumatic brain injuries (TBI) and all head injury cases in female organized ice hockey among patients aged 10 to 19 years old that were captured in eCHIRPP database.
Methods
Records entered into the eCHIRPP system with an injury date between April 1, 2011 and July 17, 2017 were extracted from the CHIRPP database for females between the ages of 10 to 19 years old (120 to 239 months) (N = 117,272).
From this dataset all head injuries (including TBI) were extracted using the surveillance definitions described previously in the Methods section of this report. Female organized ice hockey-related injuries were selected if the sports and recreation (SPAR) variable was coded as “S1118: Ice Hockey” or “S1126: Hockey, NFS” or the patient’s narrative contained the keyword “hockey”, and the Organized Sport variable was coded as “Yes” (organized sport, involves coaches and/or officials) or “Unknown”. A semi-automated procedure, using other variables (location, contributing factors) and keywords, was used to verify cases and remove irrelevant ones (e.g. floor hockey, foot hockey, ball hockey, figure skating, air hockey, or ringette, pick-up hockey).
Another semi-automated procedure, with built-in hierarchical rules, was used to examine the narratives and code the circumstances surrounding the injury event. Detailed codes describing various player interactions (rule adherence, penalizable or legal) as well as incidental cases (no other player involved) were generated. For women’s hockey, all organized play is non-contact (intentional), therefore all body checks were considered illegal. Age at time of injury was used to categorize players into Hockey Canada levels of play, i.e. Atom (10 year olds), Peewee (11 and 12 year olds), Bantam (13 and 14 year olds), Midget (15 to 17 year olds), Junior (18 and 19 year olds)145. Study results are reported as counts (N, n), percentages, annual percent change (APC) with 95% confidence intervals (CI), and as a normalized frequency distribution per 100,000 eCHIRPP records (see Chapter 3 for more information on normalization).
Results
A total of 712 cases of female organized hockey-related head injuries were identified, 692 of which were TBI (97.2%), representing a frequency of 607.1 injuries and 590.1 injuries per 100,000 eCHIRPP cases, respectively. Figure 8.1 presents the annual trends for TBI by age division and all ages combined (10 to 19 years). Due to the small number of cases (n = 6), the trend for Junior (18 to 19 years) is not shown. Overall, for 10 to 19 year-old girls, from 2013 to 2017, there is a falling trend with an annual percent change of -15.2% (-25.3, -3.6). There is some suggestion of an increase from 2016 at the Atom and Bantam divisions and a further decrease at the Midget level, but further surveillance will be required to identify a stable trend. Figure 8.2 displays the age distribution of TBI cases associated with female organized hockey, with the majority of cases occurring at the bantam level (13 or 14 years old), with a normalized frequency of 819.0/100,000 eCHIRPP cases.
Figure 8.1: NormalizedFigure 8.1 Footnote a annual frequency distribution of traumatic brain injury cases associated with female organized ice hockey, eCHIRPP, 2011 to 2017, ages 10 to 19 yearsFigure 8.1 Footnote bFigure 8.1 Footnote c, per 100,000 records
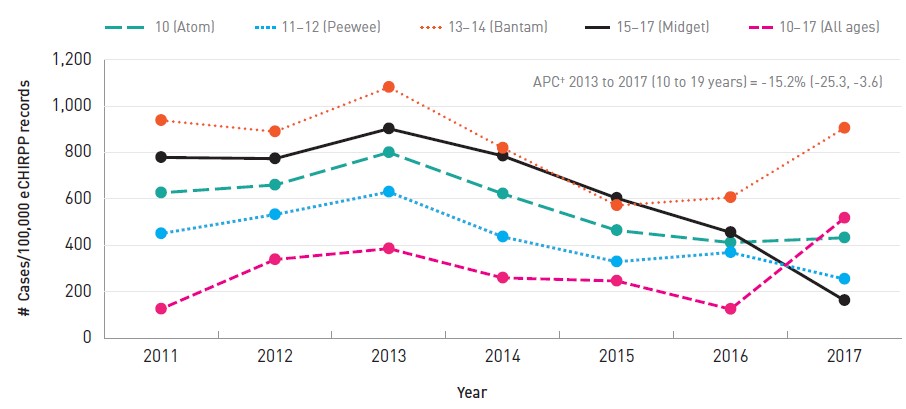
- Figure 8.1 Footnote a
-
Proportions are expressed as a normalized frequency relative to system denominators (not population denominators). As such, proportions per 100,000 records are normalized to all female cases in the eCHIRPP database in each calendar year for the given age group, on the data extraction date. See Chapter 3 for more information.
- Figure 8.1 Footnote b
-
Separate trend for Junior (18 to 19 years) is not included due to small numbers.
- Figure 8.1 Footnote c
-
Results are based on the age at injury; however, ages are grouped to approximate the following Hockey Canada age categories, in terms of a player's age as of December 31 of the current season: Atom – 10 year olds (< 11 years); Peewee – 11 to 12 year olds (under 13 years); Bantam – 13 to 14 year olds (under 15 years); Midget – 15 to 17 year olds (under 18 years); Junior – 18 years or older.
Text description
| Year | Age Group (Level) | ||||
|---|---|---|---|---|---|
| 10 (Atom) | 11-12 (Peewee) | 13-14 (Bantam) | 15-17 (Midget) | 10-19 (All ages) | |
| 2011 | 125.5 | 450.6 | 938.4 | 778.9 | 626.4 |
| 2012 | 338.6 | 532.6 | 889.9 | 773.5 | 660.0 |
| 2013 | 385.7 | 630.1 | 1,081.4 | 902.6 | 800.2 |
| 2014 | 259.5 | 436.5 | 819.4 | 785.4 | 622.0 |
| 2015 | 246.3 | 329.1 | 571.7 | 603.2 | 464.2 |
| 2016 | 124.7 | 369.3 | 606.3 | 455.5 | 411.7 |
| 2017 | 517.5 | 254.5 | 905.3 | 162.5 | 432.5 |
APC: Annual percent change APC 2013 to 2017 (10 to 19 years) = -15.2% (-25.3, -3.6) |
|||||
Figure 8.2: NormalizedFigure 8.2 Footnote a ageFigure 8.2 Footnote b distribution of traumatic brain injury cases associated with female organized ice hockey, eCHIRPP, 2011 to 2017, ages 10 to 19 years, per 100,000 records
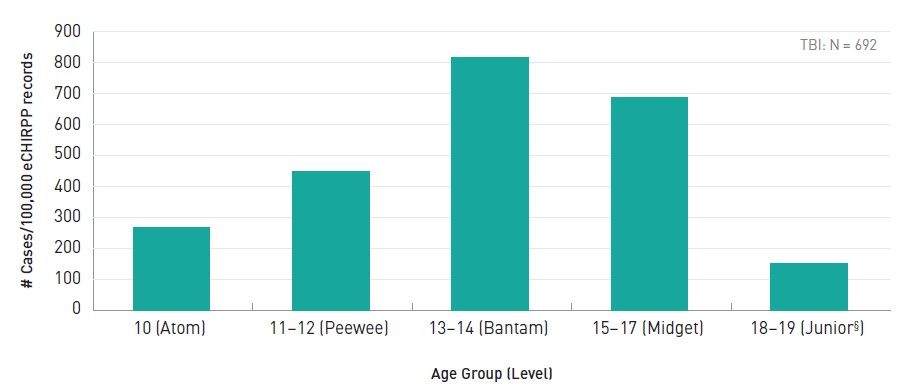
- Figure 8.2 Footnote a
-
Proportions are expressed as a normalized frequency relative to system denominators (not population denominators). As such, proportions per 100,000 records are normalized to all female cases in the eCHIRPP database for the given age group, on the data extraction date. See Chapter 3 for more information.
- Figure 8.2 Footnote b
-
Results are based on the age at injury; however, ages are grouped to approximate the following Hockey Canada age categories, in terms of a player's age as of December 31st of the current season: Atom – 10 year olds (< 11 years); Peewee – 11 to 12 year olds (under 13 years); Bantam – 13 to 14 year olds (under 15 years); Midget – 15 to 17 year olds (under 18 years); Junior – 18 years or older.
Note: Results in the 18 to 19 years of age category (Junior) should be interpreted with caution due to small numbers.
Text description
| Age Group (Level) | Distribution |
|---|---|
| 10 (Atom) | 269.0 |
| 11-12 (Peewee) | 448.0 |
| 13-14 (Bantam) | 819.0 |
| 15-17 (Midget) | 689.0 |
| 18-19 (Junior) | 151.0 |
TBI: N = 692 |
|
The distribution of penalizable player interactions within each level of play is portrayed in Figure 8.3, where the majority of injuries were due to penalizable player interactions, at all levels.
Figure 8.3: Percentage distribution of penalizable player interactionsFigure 8.3 Footnote a among traumatic brain injury cases associated with female organized ice hockey, by levelFigure 8.3 Footnote b, eCHIRPP, 2011 to 2017, ages 10 to 19 years
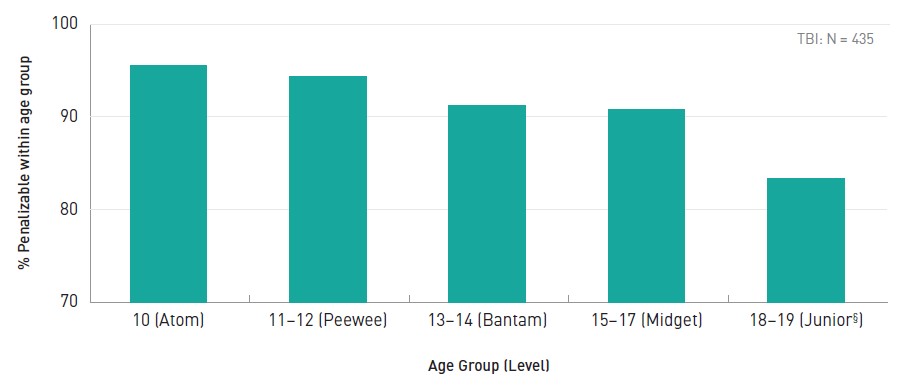
- Figure 8.3 Footnote a
-
Incidental injuries were not included in these estimations.
- Figure 8.3 Footnote b
-
Results are based on the age at injury; however, ages are grouped to approximate the following Hockey Canada age categories, in terms of a player's age as of December 31st of the current season: Atom – 10 year olds (< 11 years); Peewee – 11 to 12 year olds (under 13 years); Bantam – 13 to 14 year olds (under 15 years); Midget – 15 to 17 year olds (under 18 years); Junior – 18 years or older.
Note: Results in the 18 to 19 years of age category (Junior) should be interpreted with caution due to small numbers.
Text description
| Age Group (Level) | Distribution |
|---|---|
| 10 (Atom) | 95.5 |
| 11-12 (Peewee) | 94.3 |
| 13-14 (Bantam) | 91.2 |
| 15-17 (Midget) | 90.8 |
| 18-19 (Junior, interpret with caution due to small numbers) | 83.3 |
TBI: N = 435 |
|
Overall, injuries in female organized hockey were most frequently due to penalizable player interactions (62.9%), followed by incidental events (31.4%) (Table 8.1). Among legal interactions, unintentional collisions were the most common mechanism accounting for more than half (52.5%) of such cases. Among injuries related to penalizable player interactions, the majority of cases were due to checks (77.9%), with head checks accounting for 83.5% of all checks. Female organized hockey-related TBI resulted in admission to hospital in 1.3% of cases.
Overall, injuries in female organized hockey were most frequently due to penalizable player interactions (62.9%), followed by incidental events (31.4%).
| Mechanism | # | % of overall total | |
|---|---|---|---|
| Legal player interactions | |||
| Unintentional collision | 21 | 3.0 | |
| Other legal player interaction (other player fell on patient; tripped over fallen player) | 16 | 2.3 | |
| Struck the goal post after contact with other player | 3 | 0.4 | |
| Total legal player interactions | 40 | 5.8 | |
| Penalizable player interactions | |||
| Checks/hits | Total | 333 | 48.1 |
| Hit to the head | 283 | 40.9 | |
| Body-checked from behind, including hit head-first into the boards | 20 | 2.9 | |
| Cross-check | 2 | 0.3 | |
| Other | 28 | 4.0 | |
| Struck by opponent's stick | 29 | 4.2 | |
| Tripped by opponent | 24 | 3.5 | |
| Involved in fight | 17 | 2.5 | |
| Struck by opponent's elbow | 15 | 2.2 | |
| Contact with boards | Total | 12 | 1.7 |
| Body-checked into boards | 6 | 0.9 | |
| Pushed into boards | 2 | 0.3 | |
| Others | 4 | 0.6 | |
| Struck by opponents knee | 5 | 0.7 | |
| Total penalizable player interactions | 435 | 62.9 | |
| Incidental (no interactions with other players) | |||
| Fall (tripping, losing balance, catching skate edge, skating backwards, etc.) | 137 | 19.8 | |
| Hit/collided with boards | 43 | 6.2 | |
| Contact with ice | N/A | N/A | |
| Struck by the puck | 36 | 5.2 | |
| Struck the goal post | 1 | 0.1 | |
| Total incidental | 217 | 31.4 | |
| Total Overall | 692 | 100.0 | |
Discussion
In this study, the majority of head injury-related ED visits in female organized ice hockey were classified as a TBI. Putting this in context of all types of injuries associated with female ice hockey however, TBI (concussion specifically) accounted for 15.1% of overall injuries based on a recent study (ages 9 to 17 years, all points of healthcare contact)Footnote 156 and the sports and recreation study found in Chapter 6 in this report indicates that TBI represents between 30.9% and 37.1% of all injuries, depending on age (5 to 19 years, sentinel surveillance of ED visits). When comparing ice hockey injuries among male and female players, another CHIRPP study from 2014Footnote 54 reported that males were more often injured than females through body checking (42.8% among males compared with 25.7% among females). In the current analysis of female and male organized ice hockey-related TBI (see Chapters 7 and 8 of this report), among all mechanisms involving player interactions (i.e. excluding incidental mechanisms) females had a higher proportion of TBI related to checking and hitting compared to males (71.4% vs. 49.9%). Although from the same data source, the 2014 CHIRPP study and the two studies in this report differ in two ways. The 2014 study looked at all injuries while the studies in the current report were focussed on TBI. Also, the 2014 study used less detailed coding of injury mechanisms compared to those in this report. An interesting finding from the two hockey studies in this report relates to hits to the head, which are illegal in both men's and women's hockey. Among males, hits to the head account for 29.4% of all non-incidental cases compared to 59.6% for females. Since all body checking in female hockey is illegalFootnote 157 it is possible that an unintended consequence of this rule is an increase in illegal hits (proportionally). Further research is needed to determine the reason for this difference.
Injury prevention is important in all forms of sport. Accordingly, it has been incorporated into skills development and safety programming by Hockey CanadaFootnote 160.
In addition to differences on the basis of sex, we also observed differences among the levels (age groups) of play among female ice hockey players. Over time, TBI were lowest among the Atom and the Junior levels of play, and were highest among Bantam players, which is similar to previously reported distributions for female ice hockey injuries of any typeFootnote 158.
Penalizable player interactions accounted for the majority of injuries, with a large proportion of TBI due to contact with an opponent. This is consistent with reports based on youth ice hockey overall1 and even hockey in the National Hockey LeagueFootnote 159. The high proportion of TBI associated with illegal contact further supports the enforcement of penalties for illegal contact and risky play in youth hockey. Examining the efficacy of such measures, a higher rate of concussion was observed in sport leagues that permitted body checking relative to those where it was not allowedFootnote 150Footnote 117. Furthermore, rules to ban body checking have been shown to decrease the incidence of concussion after two yearsFootnote 150Footnote 137Footnote 160. Most of these studies have been conducted looking at male hockey. Female hockey may have more subtle differences which need to be examined more thoroughly.
It is important to note the limitation that injury mechanisms in this study were classified according to patients' narratives of the injury event; therefore it is possible that some could be misclassified due to missing or inconsistently reported information.
Injury prevention is important in all forms of sport. Accordingly, it has been incorporated into skills development and safety programming by Hockey CanadaFootnote 148. With the 2017 release of evidence-based Canadian Guideline on Concussion in Sport by Parachute CanadaFootnote 32, there is momentum to ensure that athletes who have sustained a suspected concussion receive timely and appropriate care, and proper management to allow them to return to their sport. Sport specific concussion protocols were released in 2018 for implementation by national sporting associations (NSOs)Footnote 149, and as of December 2019, 45 of 56 NSOs have committed to adopting the protocols. In 2018, significant updates were also developed by Canadian experts for the Concussion Awareness Training Tool (CATT) for Medical ProfessionalsFootnote 33, the content of which aligns with the internationally recognized fifth Consensus Statement on Concussion in sportFootnote 12. The descriptions of the mechanisms by which TBI are occurring in female ice hockey as presented in this study may be useful to inform further efforts to prevent injury in this sport.
9. Sentinel surveillance of emergency department visits for traumatic brain injuries and all head injuries associated with female organized rugby
The electronic Canadian hospitals injury reporting and prevention program (eCHIRPP), 2011 to 2017, females, ages 14 to 19 years
Introduction
Participants of any sport are at risk of traumatic brain injury (TBI), but the majority of sport-related TBI are sustained playing contact-collision and high-velocity sportsFootnote 161. A Canadian study on mechanisms of team sport-related brain injuries found that striking another player was the most common injury mechanismFootnote 140. Rugby involves tackling and collisions with other players and is associated with an increased risk of TBIFootnote 161Footnote 162. The International Rugby Board estimates that globally 6.6 million people play rugby and its popularity is on the riseFootnote 163.
Responding to mounting evidence on increasing rates of concussion among several youth sport and recreational (SPAR) activities popular in CanadaFootnote 164, on March 7, 2018, Ontario’s Bill 193, Rowan’s Law was passed, requiring sports organizations to address concussion safety in terms of a code of conduct, removal-from-sport protocol for athletes with suspected concussion, and a return-to-sport protocolFootnote 165Footnote 39. Ontario’s Rowan Stringer was 17 years old when she tragically died in 2013 from Second Impact Syndrome after sustaining three concussions in less than a week before her death while playing high school rugbyFootnote 38. More information about Second Impact Syndrome and Rowan’s Law can be found earlier in this report in the Introduction/Background chapter.
The objective of this study was to identify and describe cases of TBI and all head injuries related to female organized rugby that were captured within eCHIRPP database. For TBI specifically, select details surrounding the injury event are reported in eCHIRPP that are not available in other health administrative data sources with ICD coding. For example, cases specific to rugby only, and certain mechanisms of injury such as whether a player was tackled versus a head-to- head collision with another player cannot be identified in ICD coded data with the existing ICD-10 codes: W22.03 Striking against or struck by other objects while playing football/rugby, W51.03 Striking against or bumped into by another person in football/rugbyFootnote 63.
Methods
Records in the eCHIRPP database with an injury date from April 1, 2011 onward were extracted on June 27, 2017. Cases of TBI and other head injuries related to organized rugby were identified among females aged 14 to 19 years (168 to 239 months). Using the TBI and head injury surveillance definitions described earlier in the Methods section of this report, case identification criteria also included records with the SPAR variable coded as “1122S: Rugby” or the patient’s narrative containing the keyword “rugby”, and the Organized Sport variable coded as “1” for “Yes”. Study results are reported as counts (N, n), percentages, and as a normalized frequency distribution per 100,000 eCHIRPP records (see Chapter 3 for more information on normalization).
Results
Overall there were 487 organized rugby-related head injury cases among females aged 14 to 19 years during the study period, of which TBI comprised 85.2% (N = 415). Figure 9.1 presents the frequency distribution of organized rugby-related TBI cases among females aged 14 to 19 years, as a trend over time. The frequency of cases declined between 2011 and 2012, and then steadily increased in 2013 and beyond.
Figure 9.1: NormalizedFigure 9.1 Footnote a annual frequency distribution of traumatic brain injury cases associated with female organized rugby, eCHIRPP, 2011 to 2017, ages 14 to 19 years, per 100,000 records
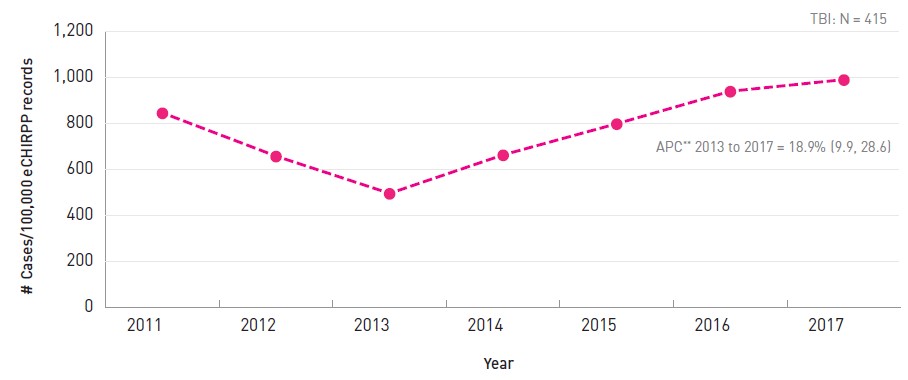
- Figure 9.1 Footnote a
-
Proportions are expressed as a normalized frequency relative to system denominators (not population denominators). As such, proportions per 100,000 records are normalized to all female cases in the eCHIRPP database in each calendar year, on the data extraction date. See Chapter 3 for more information.
APC: Annual percent change. Note that APC was not calculated for 2011 to 2013 due to insufficient data for a stable result.
Text description
| Year | # Cases/100,000 eCHIRPP records |
|---|---|
| 2011 | 845.0 |
| 2012 | 657.3 |
| 2013 | 495.5 |
| 2014 | 662.6 |
| 2015 | 797.9 |
| 2016 | 938.7 |
| 2017 | 989.3 |
|
|
Figure 9.2 presents the frequency distribution of organized rugby-related TBI and other head injury among females aged 14 to 19 years. Rugby-related head injuries (all types) were most frequent among females aged 17 years (1,430.5/100,000, n = 116), followed by females aged 16 years (1,257.4/100,000, n = 161). Conversely, TBI were most frequent among females aged 16 years (1,140.3/100,000, n = 146), followed by females aged 17 years (1,134.5/100,000, n = 92).
Figure 9.2: NormalizedFigure 9.2 Footnote a age distribution of all head injury cases and traumatic brain injury cases associated with female organized rugby, eCHIRPP, 2011 to 2017, ages 14 to 19 years, per 100,000 records
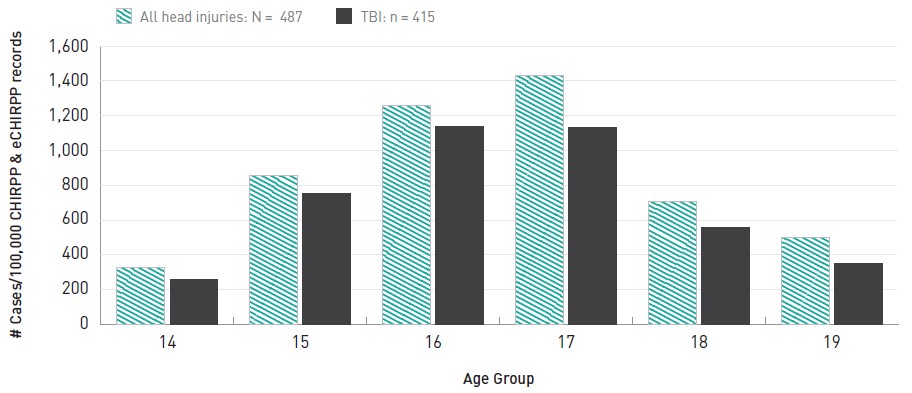
- Figure 9.2 Footnote a
-
Proportions are expressed as a normalized frequency relative to system denominators (not population denominators). As such, proportions per 100,000 records are normalized to all female cases in the eCHIRPP database for the given age, on the data extraction date. See Chapter 3 for more information.
Text description
| Age | All head injuries | TBIs |
|---|---|---|
| 14 | 328.5 | 260.3 |
| 15 | 855.4 | 752.5 |
| 16 | 1,257.4 | 1,140.3 |
| 17 | 1,430.5 | 1,134.5 |
| 18 | 706.7 | 555.3 |
| 19 | 498.0 | 348.6 |
| Total | 860.6 | 733.4 |
|
||
Table 9.1 presents information on where the patient was playing rugby when the injury occurred, with nearly half of patients (46.5%, n = 193) having indicated a secondary school or post-secondary institution. Nearly one-third of patients reported being injured at a sports field, but without providing additional details on whether the injury happened at a school versus a public park or other sports facility.
| Location | # | % |
|---|---|---|
| School (secondary and post-secondary), including indoor and outdoor areas | 193 | 46.5 |
| Public park | 44 | 10.6 |
| Other facility for land-based sport | 35 | 8.4 |
| Sports field, NFSTable 9.1 Footnote a | 123 | 29.6 |
| OtherTable 9.1 Footnote b | 7 | 1.7 |
| Unknown | 13 | 3.1 |
| Total | 415 | 100.0 |
|
||
Table 9.2 presents the mechanism of injury among female patients who sustained a TBI while playing organized rugby. More than half (55.2%, n = 229) of patients reported being injured while involved in a tackle. Among cases where details of the tackle were reported (sustained versus instigated, n = 211) 77.3% of TBI patients reported being tackled. Head-to-head collisions were reported among 10.1% of TBI patients.
More than half (55.2%, n = 229) of patients reported being injured while involved in a tackle.
| MechanismTable 9.2 Footnote a | # | % | |
|---|---|---|---|
| Tackle | Total | 229 | 55.2 |
| Tackle sustained | 163 | 39.3 | |
| Tackle instigated | 48 | 11.6 | |
| Tackle NFSTable 9.2 Footnote b | 18 | 4.3 | |
| Head-to-head collision | 42 | 10.1 | |
| Hit by specified body part (e.g., knee to the head) | 27 | 6.5 | |
| Fell or tripped | 20 | 4.8 | |
| Head hit by/on another player, or hit head NFSTable 9.2 Footnote b (excluding head-to-head collision) | 18 | 4.3 | |
| Kicked (unintentional) | 16 | 3.9 | |
| Knocked down/pulled down/hit by another player, or hit NFSTable 9.2 Footnote b (“tackle” not reported) | 15 | 3.6 | |
| Collision with another player (excluding head-to-head collision) | 13 | 3.1 | |
| Ruck or scrum-relatedTable 9.2 Footnote c | 9 | 2.2 | |
| Hit by ball | 7 | 1.7 | |
| Foul play (e.g., punched, illegal hit)Table 9.2 Footnote d | 6 | 1.4 | |
| OtherTable 9.2 Footnote e | 11 | 2.7 | |
| Mechanism not specified | 2 | 0.5 | |
| Total | 415 | 100.0 | |
|
|||
Among TBI patients, the first injury reported (Nature of Injury “1”) was a concussion or minor closed head injury at 90.1%, denoting that the remaining TBI patients reported other more serious injuries, for e.g., a fracture. Less than 1% of TBI cases were admitted to hospital.
Discussion
This study examined the epidemiology of organized rugby-related TBI and all head injuries among females aged 14 to 19 years. It complements other rugby studies and adds to the knowledge of TBI among female adolescent rugby players specificallyFootnote 140Footnote 166Footnote 167Footnote 168.
In this study, TBI comprised most frequent head injuries among female rugby players. Other research has also shown a notable proportion of rugby-related injuries among adolescent females to be TBIFootnote 166.
The frequency of cases declined between 2011 and 2012, and then steadily increased in 2013 and beyond. Although reasons for the initial decline are unclear, the recent increases may be due to rugby’s rising popularity, greater participation, and increased awareness and reporting of TBI. Regarding age differences, the frequency of cases increased between the ages of 14 and 16 years and then decreased. The literature shows mixed evidence for age as an injury risk factor in youth sports. Some research has shown that younger, less experienced athletes are actually more prone to injury in certain contextsFootnote 147, while others argue increasing age among adolescents is associated with increased injury riskFootnote 146Footnote 169.
In this study, tackling was the leading injury mechanism among TBI patients, adding to the evidence that tackling is the most common mechanism of rugby-related injury overallFootnote 162Footnote 168, and among rugby players who sustained a brain injuryFootnote 140Footnote 169. The most common location of the injury events were school settings which is expected given the age group examined and because many schools have rugby programs and sports fields.
Injury prevention and management is an important component of organized rugby in Canada. Transition to tackling and other player contact is not introduced until the “rookie rugby under-11” age category, and all age-grade rugby players in Canada are required to wear mouth guardsFootnote 170. While a systematic review on the effectiveness of strategies to prevent neurological injuries in rugby found only limited evidence of mouth guards’ and headgear’s effectiveness for preventing these rugby-related injuries, education strategies aimed at reducing brain or spinal injuries were found to be significantly more effectiveFootnote 171.
Injury prevention and management is an important component of organized rugby in Canada.
Rugby Canada’s PlaySmart program “is a Player Welfare program that aims to educate players, parents, coaches, match officials and administrators on the safety of rugby across Canada”Footnote 172. It also includes a concussion management module that all registered coaches and match officials are required to complete every 12 monthsFootnote 172. The July 2017 release of the evidence-based Canadian Guideline on Concussion in Sport by Parachute, a national not-for-profit Canadian injury prevention organization, also “…aims to ensure that athletes with a suspected concussion receive timely and appropriate care, and proper management to allow them to return to their sport”Footnote 32. Sport specific concussion protocols were then released in 2018 for implementation by national sporting organizations (NSOs), and as of December 2019, 45 of 56 NSOs have committed to adopting the protocolsFootnote 149. In 2018, significant updates were also developed by Canadian experts for the Concussion Awareness Training Tool (CATT) for Medical ProfessionalsFootnote 33, the content of which aligns with the internationally recognized fifth Consensus Statement on Concussion in SportFootnote 12.
This study provided additional evidence of TBI risk while playing rugby, in particular related to the type of player-to-player contact. All contact sports have an inherent risk of injury due to the physical contact and interaction with other players and high intensity of physical activity. Better understanding of the epidemiology of rugby-related TBI among female adolescents together with continued education strategies for the rugby community (including players, coaches, officials and parents), and safety oriented player training are essential for advancing evidence-based injury prevention efforts.
10. Sentinel surveillance of emergency department visits for traumatic brain injuries and all head injuries associated with bleachers and grandstands
The Canadian hospitals injury reporting and prevention program (CHIRPP/eCHIRPP), 2007 to 2017
Introduction
Bleachers and grandstands are common indoor and outdoor stepped seating structures found at sporting and other spectator events, and are generally categorized as one of the following types: fixed, portable, telescopic/folding, or temporaryFootnote 173. Bleachers and grandstands also often have no backrests and can be hazardous to people using them and to others engaged in sports and other activities nearby.
Some of the injury mechanisms include falling while on the structures, falling to the ground, colliding with them, entrapment, and even collapses. Although large scale collapses are rare, they invariably result in critical injuries and even fatalities. Internationally there have been 93 documented incidents of spectator seating collapses between 1889 and 2008 killing 85 people and injuring more than 6,300Footnote 174. One of the most devastating bleacher collapses happened at a soccer match in Bastia, France in 1992 when a large section of temporary spectator seating in the Furiani stadium collapsed under 2000 spectators, killing 18 people and injuring hundreds moreFootnote 175. An investigation revealed multiple factors caused the collapse including engineering errors, insufficient planning and oversight, rushed construction, and non-compliance with safety proceduresFootnote 175.
A Canadian incident causing serious injuries was the failing of a defective railing in the grandstands at Lansdowne Park, Ottawa, Ontario during a 1987 university football game, when 30 spectators fell from the standsFootnote 176. Also in Canada, a previous surveillance study showed that 765 bleacher-related injuries were reported to CHIRPP between 1990 and 2002, with nearly half of those being to the head, face or neckFootnote 177. In the United States, according to the National Electronic Injury Surveillance System (NEISS)Footnote 178 it is estimated that in 2016 alone there were more than 19,100 bleacher-related injuriesFootnote 179, and between 1980 and 2003 there were 19 fall-related deaths involving bleachers in the USFootnote 173.
The ICD-10 code most likely to be used for bleacher-related incidents given that falls are the most common injury mechanism is W13: fall from, out of or through building or structure; however, it is not possible to isolate bleacher-related incidents from records using this code because it is also used to classify a variety of other incidents such as falls from balconies, buildings, bridges, and other structuresFootnote 63. Other ICD-10 codes applicable to bleacher-related injuries, for instance those used to code falls on the same level and falls from stairs (among other mechanisms) are also used to capture a variety of contexts and are therefore not specific to bleacher-related incidents. Cases of injury and injury events coded in CHIRPP provide more detail than ICD coded administrative health data sources. CHIRPP coding is able to identify injuries specific to bleachers and grandstands and to identify other relevant factors such as location on the stands where the injury occurred and the height involved in falls. The objective of this study was to identify and describe cases of traumatic brain injury (TBI) and all head injuries related to bleachers and grandstands captured within the CHIRPP/eCHIRPP.
Methods
Records in the CHIRPP’s data holdings (both the historical CHIRPP database, and more current eCHIRPP database) with an injury date from January 1, 2007 onward were extracted on June 27, 2017. Cases of TBI and other head injuries related to bleachers and grandstands were identified for all ages. Using the TBI and head injury surveillance definitions described earlier in the Methods section of this report, case identification criteria also included records with the Direct Cause or any of the Contributing Factor variables were coded as “1013F: Grandstands and bleachers” or the patient’s narrative contained English and French keywords “bleacher,” “stands” (which captures “grandstands” or “stands”), “riser,” “gradins,” or “estrade.” Grammatical variations of keywords were also incorporated to maximize record identification. Spectators using bleachers or grandstands who were struck with hockey pucks, baseballs or other sporting projectiles were excluded from this study. Study results are reported as counts (N, n), percentages, and as a normalized frequency distribution per 100,000 CHIRPP/eCHIRPP records (see the Methods chapter for more information on normalization).
Results
Overall there were 440 bleacher-related head injury cases among patients of all ages during the study period (34.8/100,000 records), and of those, nearly half were TBI (n = 195, 44.3%, 15.4/100,000). Figure10.1 presents the frequency distribution of bleachers and grandstand-related head injury cases as a trend over time. The annual percent change (APC) for all head injuries and TBI was stable over the 11-year period.
Figure 10.1: NormalizedFigure 10.1 Footnote a annual frequency distribution of all head injury cases and traumatic brain injury cases associated with bleachers and grandstands, CHIRPP/eCHIRPP, 2007 to 2017, per 100,000 records
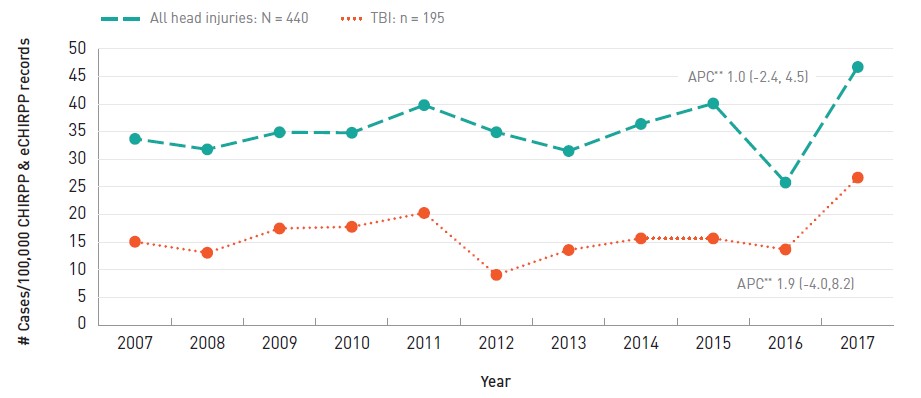
- Figure 10.1 Footnote a
-
Proportions are expressed as a normalized frequency relative to system denominators (not population denominators). As such, proportions per 100,000 records are normalized to all cases in the CHIRPP and eCHIRPP databases for the given year, on the data extraction date. See Chapter 3 for more information.
Text description
| Year | All head injuries | TBIs |
|---|---|---|
| 2007 | 33.7 | 15.1 |
| 2008 | 31.8 | 13.1 |
| 2009 | 34.9 | 17.5 |
| 2010 | 34.8 | 17.8 |
| 2011 | 39.8 | 20.3 |
| 2012 | 34.9 | 9.1 |
| 2013 | 31.5 | 13.6 |
| 2014 | 36.4 | 15.7 |
| 2015 | 40.1 | 15.7 |
| 2016 | 25.8 | 13.7 |
| 2017 | 46.7 | 26.7 |
APC: annual percent change
|
||
Figure 10.2 presents the frequency distribution of bleacher- and grandstand-related head injuries by age group. All head injuries and TBI were highest among children aged 2 to 9 years (all head injuries N = 303; 67.6/100,000, TBI n = 116, 25.9/100,000).
Figure 10.2: NormalizedFigure 10.2 Footnote a age distribution of all head injury cases and traumatic brain injury cases associated with bleachers and grandstands, CHIRPP/eCHIRPP, 2007 to 2017, per 100,000 records
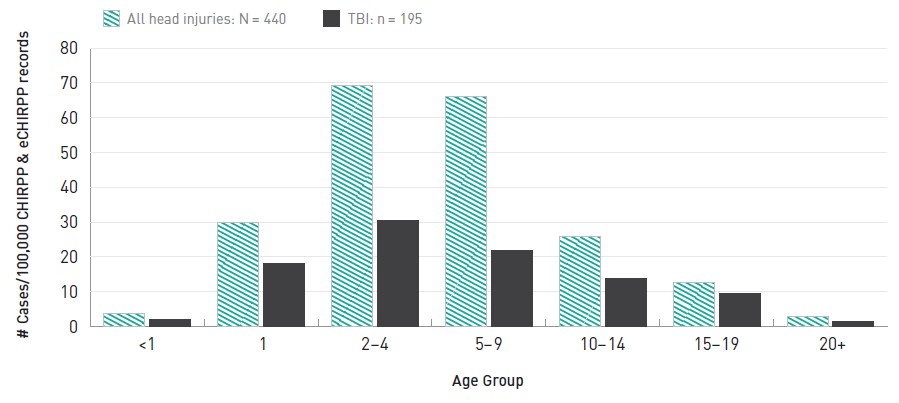
- Figure 10.2 Footnote a
-
Proportions are expressed as a normalized frequency relative to system denominators (not population denominators). As such, proportions per 100,000 records are normalized to all cases in the CHIRPP and eCHIRPP databases for the given age group, on the data extraction date. See Chapter 3 for more information.
Text description
| Age Group | All head injuries | TBIs |
|---|---|---|
| <1 | 3.7 | 1.9 |
| 1 | 30.0 | 18.2 |
| 2-4 | 69.2 | 30.6 |
| 5-9 | 66.2 | 21.8 |
| 10-14 | 26.0 | 13.8 |
| 15-19 | 12.6 | 9.4 |
| 20+ | 3.0 | 1.5 |
| Total | 34.7 | 15.4 |
|
||
The distribution of TBI by age and sex is presented in Figure 10.3. Males aged 2 to 9 years had the highest frequency of cases (n = 73, 28.6/100,000 records), and females in the same age group followed (n = 43, 22.3/100,000 records).
Figure 10.3: NormalizedFigure 10.3 Footnote a age and sex distribution of traumatic brain injury cases associated with bleachers and grandstands, CHIRPP/eCHIRPP, 2007 to 2017, per 100,000 records
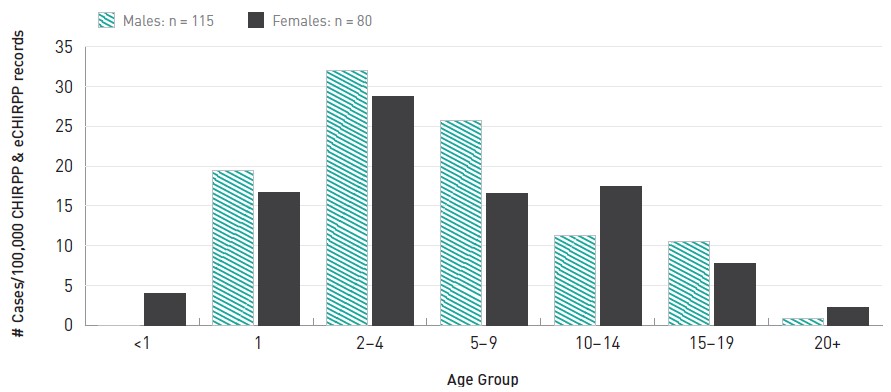
- Figure 10.3 Footnote a
-
Proportions are expressed as a normalized frequency relative to system denominators (not population denominators). As such, proportions per 100,000 records are normalized to all cases in the CHIRPP and eCHIRPP databases for the given age group and sex, on the data extraction date. See Chapter 3 for more information.
Text description
| Age Group | Males | Females |
|---|---|---|
| <1 | 0.0 | 4.0 |
| 1 | 19.5 | 16.7 |
| 2-4 | 32.0 | 28.7 |
| 5-9 | 25.7 | 16.6 |
| 10-14 | 11.3 | 17.5 |
| 15-19 | 10.5 | 7.8 |
| 20+ | 0.9 | 2.2 |
|
||
Table 10.1 presents information on the location where the injury occurred. Nearly a third (30.8%) of bleacher-related TBI were sustained in a school setting, followed by a stadium or arena (26.7%).
| Location | # | % | |
|---|---|---|---|
| School (K-12, and post-secondary) | Total | 60 | 30.8 |
| School gymnasium | 28 | 14.4 | |
| Other or unspecified school area | 32 | 16.4 | |
| Stadium or arena | 52 | 26.7 | |
| Other sports or recreation facility | 40 | 20.5 | |
| Public park | 23 | 11.8 | |
| OtherTable 10.1 Footnote a | 11 | 5.6 | |
| Unspecified location | 9 | 4.6 | |
| Total | 195 | 100.0 | |
|
|||
The mechanism of injury among patients who sustained a TBI while using bleachers is presented in Table 10.2. A considerable proportion of TBI (42.1%) happened when a person fell off the bleachers, although the height of the fall was unreported in nearly half of those cases. Among falls from the bleachers with reported height (n = 46) 60.8% of those were from at least five feet high (at least 1.52 m; n = 28). A fifth (21%) of TBI happened when the patient fell while on the structure (e.g., tripped and fell among the seats) while another 16.4% collided with bleachers while on the ground. Fewer than five cases of TBI were admitted to hospital, and some of those were caused by falls from height.
A considerable proportion of TBI (42.1%) happened when a person fell off the bleachers, although the height of the fall was unreported in nearly half of those cases.
| MechanismTable 10.2 Footnote a | # | % | |
|---|---|---|---|
| Fell from structure to ground | Total | 82 | 42.1 |
| Height not specified | 36 | 18.5 | |
| <5 feet | 18 | 9.2 | |
| 5 to 9 feet | 22 | 11.3 | |
| 10 to 18 feet | 6 | 3.1 | |
| Fell while on structure (e.g., running/playing among seats and fell) | 41 | 21.0 | |
| Collided with structure (e.g., ran into bleachers while playing basketball, or while running/playing under it) | 35 | 17.9 | |
| Fell while ascending/descending/climbing on stairs or seating | 20 | 10.3 | |
| Fainted while on structure, including fell off | 7 | 3.6 | |
| OtherTable 10.2Footnote b | 10 | 5.1 | |
| Total | 195 | 100.0 | |
|
|||
Discussion
Research on the epidemiology of injuries related to bleachers and grandstands is scarce. Published work on spectator injuries overwhelmingly concerns hazards such as being struck by airborne pucks, bats and balls (and associated liability issues), or consists of clinical case studiesFootnote 180Footnote 181Footnote 182Footnote 183. The injury patterns reported in this study are similar to previously reported CHIRPP statistics, and add to the surveillance knowledge on injuries including TBI related to bleachers and grandstands.
Head injuries (all types) and TBI were most common among young children aged 2 to 9 years of age, and overall falling to the ground was the most common cause of TBI.
No annual increase or decrease was evident; the trend was persistent over the 11-year period. Head injuries (all types) and TBI were most common among young children aged 2 to 9 years of age, and overall falling to the ground was the most common cause of TBI. This was expected given many bleachers have open sides without handrails, openings large enough for young children to fall through, and many young children may treat bleachers and grandstands like play structures by climbing and running on them. In 2000, for the prevention of falls from bleachers, the US Consumer Product Safety Commission released the voluntary Guidelines for Retrofitting BleachersFootnote 173: recommendations address fall hazards including missing guardrails from the backs of bleachers, the open sides, and openings in the seating and guardrail apparatuses.
In terms of sex differences, males aged 2 to 9 years of age had the highest frequency of TBI. Epidemiological studies have found males to be more at risk of TBI and other injury than females in most contexts. Differences in risk-taking behaviours, parenting, gender roles, socioeconomic factors, and other factors have been studied in relation to injury risk among the sexesFootnote 184Footnote 185.
Nearly a third of TBI related to bleachers and grandstands were sustained in a school setting which is expected given the largely paediatric population within CHIRPP, and because many schools have sports fields and or gymnasiums with spectator seating. Not surprisingly, stadiums/arenas or other sports facilities were the second and third most common location where TBI were sustained, respectively.
Bleachers and grandstand seating may seem like innocuous structures, and in Canada must be built to comply with the National Building Code’s safety standardsFootnote 186; however, it is apparent that while they are a common and practical solution for seating crowds at spectator events and are built according to safety standards, they can still pose significant hazards that can lead to TBI and other injuries, especially among young children and often due to falls. This study provides additional evidence on the risk of sustaining TBI on and around bleachers and grandstands and is useful for targeting injury prevention efforts. Prevention approaches should be multifaceted including heightened parental supervision of young children while on and around bleachers and grandstands, and improved product design incorporating additional safety features such as backrests and hand rails where needed.
11. Sentinel surveillance of emergency department visits for traumatic brain injuries and all head injuries associated with television tip-overs
The electronic Canadian hospitals reporting and prevention program (eCHIRPP), 2011 to 2017, ages 0 to 9 years
Introduction
Televisions (TVs) are a ubiquitous product in most Canadian households and children spend considerable time in proximity to them. A number of reports from different countries have identified TV tip-overs to be associated with serious paediatric injuriesFootnote 187Footnote 188Footnote 189Footnote 190Footnote 191Footnote 192. ICD-10 coding does not have enough specificity to identify television tip-overs; the most specific code is W20—Struck by thrown, projected or falling object. For injury prevention purposes, more detailed information is required. One of the first presentations (using CHIRPP data) on child injuries associated with TV tip-overs was at the 2002 sixth World Conference on Injury Prevention and ControlFootnote 193. That report indicated that more distal points of the body (below knee and head) were injured most frequently and some of the head injuries were very serious. From that study, spanning 1990 to 2001, 4.5 of every 100,000 CHIRPP ED visits among children less than ten years of age involved a traumatic brain injury (TBI) associated with a toppling television. A number of updates (unpublished internal report) showed a significantly increasing trend to 59.4 per 100,000 CHIRPP records in the period 2006 to 2009, likely due to the availability of larger TVs and the increase in the proportion of multi-TV householdsFootnote 187. With the advent of LCD and plasma televisions, which are able to be mounted on the wall and are thinner, lighter and more stable than their cathode-ray tube (CRT) forerunners, it was expected that the risk of tip-over injuries would be reducedFootnote 187Footnote 188Footnote 194. The purpose of this study was to provide a further update using current CHIRPP data (2011 to 2017) to study recent trends in TV tip-over-related head and TBI.
Methods
All cases of TBI and other head injuries (refer to previous section for CHIRPP surveillance definitions) among children under 10 years of age were identified from a current extract of the eCHIRPP database (all cases, 0 to 119 months, entered into the system between April 1, 2011 and October 1, 2017, N = 393,581). Among this subset of cases, TV tip-overs were identified by a narrative search using the following text strings: ‘TV’, ’tele’, ‘cathode’, ‘tube’, ‘CRT’, ‘LCD’, ‘plasma’, ‘flat screen’. An automated program (SAS PC Version 9.3) was used to remove irrelevant cases (e.g. ‘telephone pole’, ‘ATV’). The remaining cases were reviewed manually and the narrative information coded to gain further details of the injury event.
Results
Overall, 185 cases of tip-over-related head injuries were identified, 128 (69.2%) of which were TBI (32.5/100,000 eCHIRPP records). Figure 11.1 shows the annual trend for all head injuries and the TBI cases. Both show a falling trend, with all head injuries declining at a faster rate. TBI account for a larger percentage of all head injuries in recent years; (50% in 2011 increased to 82 to 83% in 2016 to 2017). Figure 11.2 details the age distribution by single year. Children 2 to 4 years of age are injured most frequently at 55.0/100,000 eCHIRPP records. Overall, 56.7% were males.
Figure 11.1: NormalizedFigure 11.1 Footnote a annual frequency distribution of all head injury cases and traumatic brain injury cases associated with television tip-overs, eCHIRPP, 2011 to 2017, ages 0 to 9 years, per 100,000 records
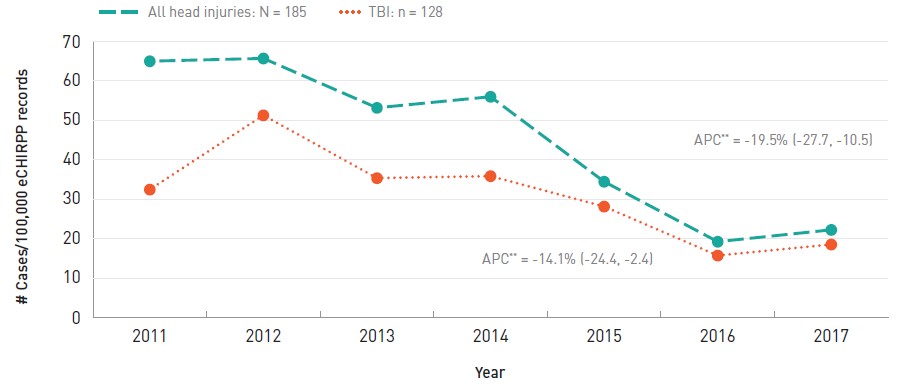
- Figure 11.1 Footnote a
-
Proportions are expressed as a normalized frequency relative to system denominators (not population denominators). As such, proportions per 100,000 records are normalized to all cases in the eCHIRPP database in each calendar year, on the data extraction date. See Chapter 3 for more information.
Text description
| Year | All head injuries | TBIs |
|---|---|---|
| 2011 | 65.0 | 32.5 |
| 2012 | 65.7 | 51.3 |
| 2013 | 53.2 | 35.4 |
| 2014 | 56.0 | 35.9 |
| 2015 | 34.5 | 28.2 |
| 2016 | 19.3 | 15.8 |
| 2017 | 22.3 | 18.6 |
APC: Annual percent change
|
||
Figure 11.2: NormalizedFigure 11.2 Footnote a age distribution of traumatic brain injury cases associated with television tip overs, eCHIRPP, 2011 to 2017, ages 0 to 9 years, per 100,000 records
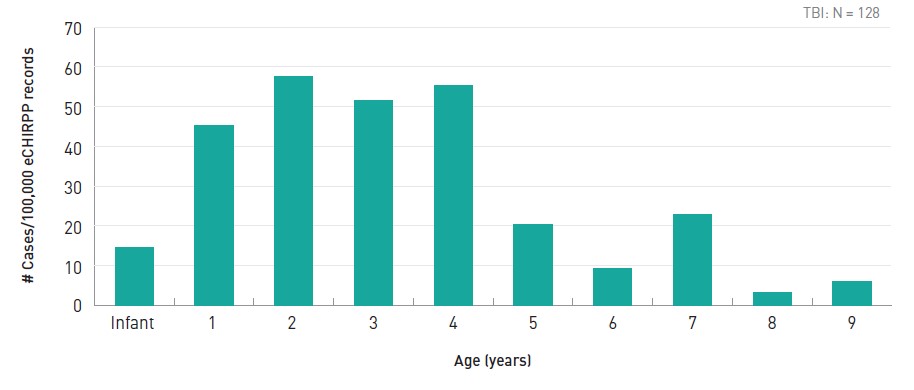
- Figure 11.2 Footnote a
-
Proportions are expressed as a normalized frequency relative to system denominators (not population denominators). As such, proportions per 100,000 records are normalized to all cases in the eCHIRPP database for the given age, on the data extraction date. See Chapter 3 for more information.
Text description
| Age | Distribution |
|---|---|
| Infant | 14.5 |
| 1 | 45.3 |
| 2 | 57.5 |
| 3 | 51.5 |
| 4 | 55.4 |
| 5 | 20.3 |
| 6 | 9.2 |
| 7 | 22.9 |
| 8 | 3.3 |
| 9 | 6.1 |
TBI N = 128 |
|
The type of TV was reported in 34% of the TBI cases (n = 44). Of those, three-quarters were identified as old style cathode ray tube (CRT) and 25% were flat screen (including plasma and LCD). There was only one reported case where a wall-mounted flat screen fell. TV size was reported in 26.6% of incidents, 59% of which were 27 to 36 inch TVs. Table 11.1 details the specific circumstances surrounding the tip-over event. Of the TBI cases, 25.8% were admitted to hospital and there were 3 deaths among 1 to 3 year olds (2.3%). Overall, the 128 patients sustained 144 injuries (12.5% with multiple injuries). Table 11.2 shows the distribution of injuries within the TBI surveillance definition. Figure 11.3 shows the distribution of areas/locations where the injury occurred by era.
| Circumstance/mechanism | # | % |
|---|---|---|
| Push, Pull (TV, wires, stand) | 35 | 27.3 |
| Dresser-Related | 28 | 21.9 |
| Climbing | 11 | 8.6 |
| Patient bumped into | 7 | 5.5 |
| Other person bumped into | 5 | 3.9 |
| Other, unknownTable 11.1 Footnote a | 42 | 32.8 |
| Total | 128 | 100.0 |
|
||
| Component of TBI_CHIRPP (nature of Injury) | # | % |
|---|---|---|
| Minor Closed Head Injury | 85 | 59.0 |
| Concussion | 11 | 7.6 |
| Intracranial | 18 | 12.5 |
| Skull fracture | 25 | 17.4 |
| Facial fracture | 5 | 3.5 |
| Total | 144 | 100.0 |
Figure 11.3: Location of injury event distributed by era, traumatic brain injury cases associated with television tip-overs, CHIRPP/eCHIRPP, 1990 to 2017, ages 0 to 9 years
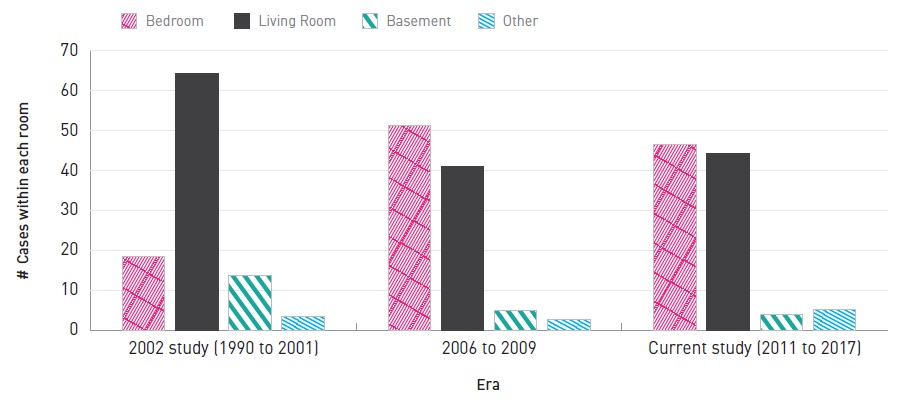
Text description
| Era | Bedroom | Living Room | Basement | Other |
|---|---|---|---|---|
| 2002 study (1990 to 2001) | 18.4 | 64.2 | 13.8 | 3.6 |
| 2006 to 2009 | 51.3 | 41.0 | 5.1 | 2.6 |
| Current study (2011 to 2017) | 46.4 | 44.3 | 4.1 | 5.2 |
Discussion
Overall, ED visits for TBI associated with TV-tip overs have declined since 2002; however, they still persist at about 32 per 100,000 eCHIRPP records and can be serious. Despite eCHIRPP being a poor source of mortality data, three deaths were captured in the current study, which speaks to the potential severity of this mechanism of injury. An important finding of this study was that bedrooms have become a more frequent area where these injuries are occurring. With the increasing proportion of multi-TV households and flat screen TVs becoming the main household TV, some of the CRTs which formerly were in the living room, may have been displaced to children's bedrooms, often on a dresser. Thus, the already unstable CRTs have been set up in a potentially more unstable configuration. This has been noted in other studiesFootnote 187Footnote 188. As CRTs are eventually discarded it is possible that this injury mechanism will significantly diminish. However, continued surveillance is needed to assess the distribution of TVs in households, where the situation may be temporarily more hazardous, and to surveil for any emerging issues related to newer flat screen TVs.
Overall, ED visits for traumatic brain injuries associated with TV-tip overs have declined since 2002 ... An important finding of this study was that bedrooms have become a more frequent area where these injuries are occurring.
12. Sentinel surveillance of emergency department visits for traumatic brain injuries and all head injuries associated with strollers
The electronic Canadian hospitals injury reporting and prevention program (eCHIRPP), 2011 to 2017, ages 0 to 4
Introduction
An infant stroller is a wheeled vehicle used to assist caregivers with transporting a young child in a seated position. In Canada, carriages and strollers are regulated under the Consumer Product Safety Act, which outlines product specifications intended to ensure safety and securityFootnote 195Footnote 196. Nevertheless, strollers have frequently been associated with paediatric injury, including fatalities occasionally. Studies from the United States and Canada show that of all nursery products, strollers are one of the most frequently associated with injuriesFootnote 197Footnote 198Footnote 199. Based on findings from the United States’ National Electronic Injury Surveillance System (NEISS), an estimated 12,470 (CI: 9,719, 15,222) stroller-related injuries have been treated each year (1990 to 2010). Aside from a couple of brief periods of increase, injury rates were generally decliningFootnote 200. These injuries occurred most commonly when the child made contact with the ground, and traumatic brain injuries (TBI) were the second most frequently reported diagnosisFootnote 200. An Australian state studyFootnote 201 reported an estimated 200 injuries per year (1999 to 2008, children under 5 years), with the most frequent diagnosis being intracranial injuries (38%). A 2003 Canadian studyFootnote 202 of stroller-related head and face injuries among infants and one-year olds using CHIRPP data (1990 to 2001) found that 81.4% of the head injuries were TBI and 7.8% were skull fractures. In over half (53.8%) of the cases the child fell out of the stroller and in 14.2% of the incidents the stroller tipped over.
Although health administrative data sources are able to identify some stroller-related injuries using the ICD-10-CA code W05.03 fall from strollerFootnote 64, this code is not comprehensive and does not capture injuries other than falls, and does not provide additional detail on the circumstances of these injuries. Thus the objective of this analysis was to identify and describe in detail cases of TBI related to strollers that were captured in eCHIRPP databaseFootnote 203.
Methods
Records entered into the CHIRPP system with an injury date between April 1, 2011 and July 17, 2017 were extracted from the eCHIRPP database for patients less than 5 years old (0 to 59 months; N = 223,321). From this subset, stroller- related cases were identified as records where the direct cause or contributing factor of injury was a stroller (eCHIRPP factor codes 4603, 4604) or the narrative description of the injury event or the product field included bilingual terms for stroller: ‘stroller’, ‘pram’, ‘buggy’, ‘carrosse’, ‘poussette’, ‘carriage’. From this dataset all head injuries (including TBI) were extracted using the surveillance definitions described previously in Chapter 3 of this report. Cases that involved a toy stroller, or where the stroller was incidental to the injury and the child was not sitting in the stroller, were excluded. A semi-automated procedure was used to classify the injury mechanisms in detail. Study results are reported as counts (N, n), percentages, annual percent change (APC) with 95% confidence interval (CI) and as a normalized frequency distribution per 100,000 eCHIRPP records (see Chapter 3 for more information on normalization).
Results
A total of 1,627 stroller-related head injuries were identified among children aged 4 years and younger, of which 66.4% (n = 1,081) were TBI. This resulted in normalized frequencies of 728.5/100,000 (all head injury cases) and 484.1/ 100,000 (TBI cases). Figure 12.1 shows the annual trends for all head injury cases and TBI cases. All head injuries and TBI show a significant decreasing trend with all head injuries declining at a slightly faster rate (APC = -6.7% vs. -6.1%, respectively). Figure 12.2 describes the age and sex distribution of TBI cases associated with strollers. The majority of stroller-related TBI cases were among children under 1 year of age (1,896.2/100,000 eCHIRPP records). Young males accounted for 52.9% of all cases.
Figure 12.1: NormalizedFigure 12.1 Footnote a annual frequency distribution of all head injury cases and traumatic brain injury cases associated with strollers, eCHIRPP, 2011 to 2017, ages 0 to 4 years, per 100,000 eCHIRPP records
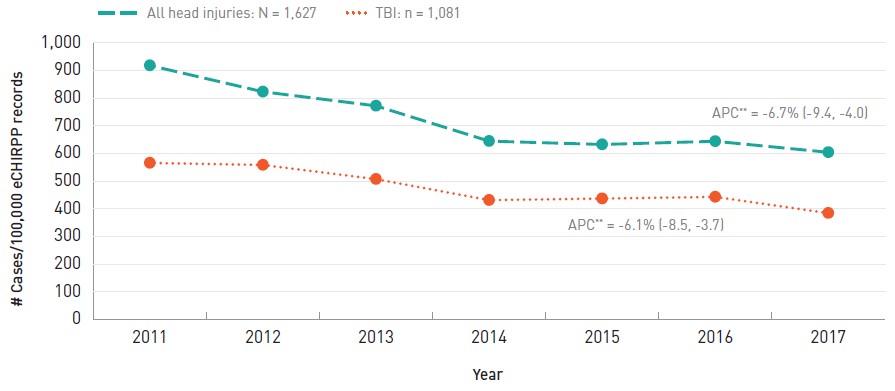
- Figure 12.1 Footnote a
-
Proportions are expressed as a normalized frequency relative to system denominators (not population denominators). As such, proportions per 100,000 records are normalized to all cases in the eCHIRPP database in each calendar year, on the data extraction date. See Chapter 3 for more information.
Text description
| Year | All head injuries | TBIs |
|---|---|---|
| 2011 | 917.9 | 565.7 |
| 2012 | 822.9 | 558.3 |
| 2013 | 771.9 | 507.2 |
| 2014 | 644.5 | 431.3 |
| 2015 | 632.4 | 436.9 |
| 2016 | 643.9 | 442.9 |
| 2017 | 604.1 | 384.4 |
APC: Annual percent change
|
||
Figure 12.2: NormalizedFigure 12.2 Footnote a age and sex distribution of traumatic brain injury cases associated with strollers, eCHIRPP, 2011 to 2017, ages 0 to 4 years, per 100,000 records
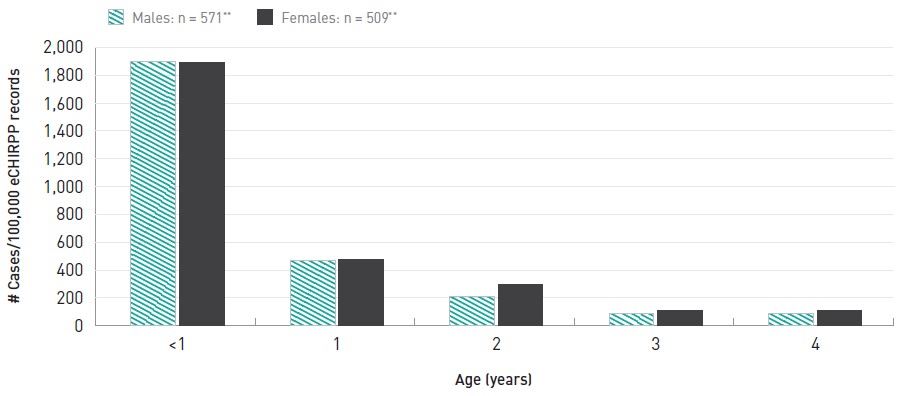
**Sex information missing for 1 case.
- Figure 12.2 Footnote a
-
Proportions are expressed as a normalized frequency relative to system denominators (not population denominators). As such, proportions per 100,000 records are normalized to all cases in the eCHIRPP database for the given age and sex, on the data extraction date. See Chapter 3 for more information.
Text description
| Age | Males | Females |
|---|---|---|
| <1 | 1,899.7 | 1,892.3 |
| 1 | 468.2 | 477.4 |
| 2 | 206.5 | 293.5 |
| 3 | 85.8 | 109.7 |
| 4 | 42.3 | 26.6 |
|
||
Falls from tip-overs and run-aways were the three leading mechanisms of TBI, accounting for 81.3% of all cases (Table 12.1). There were fewer injuries associated with mechanical issues (stroller brakes or wheel, 4.3%), a child seated in a stroller being struck by a projectile or falling object (3.4%), or a child in transit from their stroller either by way of the child trying to get into or out of the stroller or the caregiver moving the child to or from the stroller (2.4%). Across various mechanisms, a total of 134 cases (12.4%) involved a motor vehicle (i.e. the child was a pedestrian).
| MechanismTable 12.1 Footnote a | # | % |
|---|---|---|
| Fall from/out of | 525 | 48.6 |
| Tip-over | 267 | 24.7 |
| Stroller run away | 87 | 8.0 |
| While climbing out (or attempting to) | 54 | 5.0 |
| Mechanical/malfunction/collapse | 46 | 4.3 |
| Struck by object | 37 | 3.4 |
| In transit in to or from stroller | 26 | 2.4 |
| Other | 39 | 3.6 |
| Total | 1,081 | 100.0 |
|
||
Table 12.2 shows the distribution of the injury event location among stroller-related TBI cases. In cases where the location was known (n = 530, 49.0%), the majority (76.1%) of stroller-related TBI occurred at home, on a sidewalk, or at a park.
| LocationTable 12.2 Footnote a | # | % |
|---|---|---|
| In and around a private home | 170 | 32.1 |
| Sidewalk | 117 | 22.1 |
| Outdoor park | 116 | 21.9 |
| Commercial area | 80 | 15.1 |
| Road | 39 | 7.4 |
| Daycare | 6 | 1.1 |
| Sports facility | 2 | 0.4 |
| Total | 530 | 100.0 |
|
||
A total of 39 cases (3.6% or 17.5/100,000 records) of stroller-related TBI cases were admitted to the hospital.
Safety equipment use (harness, restraint or brake mechanism) was reported in 71.1% (n = 766) of the cases. Of those, 66.3% (n = 508) reported not using/having a safety feature.
Discussion
Although strollers were developed to assist with the safe and secure transport of children, they have frequently been associated with unintentional injuries, with TBI and other types of head injuries often predominatingFootnote 64Footnote 197Footnote 198Footnote 199Footnote 200Footnote 201Footnote 202Footnote 203Footnote 204Footnote 205. Due to their relatively large head and high center of gravity, very young children will tend to “lead with their head”Footnote 206 in a collision or a fall, thus head injuries are common with many nursery products.
In this study, between 2011 and 2017, the proportion of TBI declined by 6.1% per year. The decline may be related to a number of factors, including: people are using the devices less often, safety notices, recalls and other injury prevention messaging are somewhat effective or manufacturers are designing safer products. The U.S. studies showed an overall decline (although with some short periods of increase) between 1990 and 2011Footnote 197Footnote 200; there are no data available for recent years to compare directly with this study.
In this study, between 2011 and 2017, the proportion of TBI declined by 6.1% per year.
The 2003 study using CHIRPP dataFootnote 202 is not directly comparable to the current study due to the differing age cut-offs, the addition of one other paediatric hospital and the inclusion of facial injuries in the overall analysis in the 2003 study. However, some elements are crudely comparable. Indirect estimates from the 2003 study show that among children one year and younger, stroller-related TBI accounted for 635.6/100,000 CHIRPP records whereas in the current study the normalized proportion is 994.8/100,000 eCHIRPP cases. Thus, even considering the comparability limitations and the current decline, there appears to be an increase in the overall proportion when comparing the two periods (1990 to 2001, and 2011 to 2017).
This study found that these injuries occurred most frequently among children less than one year of age, similar to reports from other studiesFootnote 200Footnote 201Footnote 204Footnote 205, with the frequency of TBI diminishing each year of age thereafter. The home (in and around) was found to be the most common location of injury, as has been previously described for stroller related injuries overallFootnote 200. Falls were the leading cause of stroller-related TBI in this study, confirming previous reportsFootnote 200Footnote 202Footnote 204. Although stroller tip-overs and a stroller rolling away may have both also resulted in a fall, the second mechanism event was not always evident.
This study found that these injuries occurred most frequently among children less than one year of age, similar to reports from other studies.
The 2003 CHIRPP study showed that 14.2% of the cases were tip-overs, with the relative frequency higher among one year-oldsFootnote 202. Although not directly comparable, the tip-over rate in the current CHIRPP study is 24.7%. The difference may be partly due to older (heavier) children involved in this study (17% were older than 23 months), differences in coding or product design-related issues. Studies looking at stability, hazards and standards have been doneFootnote 200Footnote 207Footnote 208, yet injuries due to falls and tip-overs continue to persist internationally. There is some evidence that tip- overs occur more frequently if the child is not restrainedFootnote 200Footnote 207 or if the stroller is designed for two children (one behind the other)Footnote 207. In this study, no cases of twin strollers were identified. Safety device usage was reported in 71.1% of cases and of those 66.3% reported not using or having a safety feature. In contrast, the 2003 CHIRPP studyFootnote 202 had low reporting (11.1%) but indicated that 38% of those injured were not using a restraint. The reasons for this difference are not clear, but may include reporting bias, enhanced information capture, and differing product and safety feature availability during the two time periods. Further research looking at mechanism by age and restraint use over time will help to clarify the findings. Although the harness/restraint is a safety feature, in addition to lack of supervision, it has been associated with fatalitiesFootnote 201Footnote 209.
Stroller run away accounted for 8% of cases in the current study and 13.7% in the 2003 CHIRPP studyFootnote 202. This mechanism has been associated with fatalities (drowning) internationallyFootnote 201Footnote 210. In Australia there were 2 deaths in a four month period by drowning due to a runaway stroller. The products involved were highly mobile, 3-wheeled, jogging strollers. In these two deaths wrist straps and brakes were not usedFootnote 210.
While trends suggest that stroller related TBI are on the decline, strollers are undergoing continued design changes.
While trends suggest that stroller related TBI are on the decline, strollers are undergoing continued design changes. There are many different stroller designs, classifications and geometries, for example: jogging, folding (umbrella), 3-wheel, 4-wheel, 6-wheel (twin single file or side-by-side), removable child seat, right triangle frame, telescopic bar frame, and lambda frameFootnote 208. Although subject to performance and design standards, the dynamic loads (the child) and unexpected external forces (e.g., sibling, wind, graded surfaces, attached objects, and dogs) can result in an injury scenario. Thus, continued surveillance is needed to monitor related injuries and trends as this product continues to evolve in the consumer market.
13. Sentinel surveillance of emergency department visits for traumatic brain injuries and all head injuries occurring in schools
The Canadian hospitals injury reporting and prevention program (CHIRPP/eCHIRPP) 2007 to 2017, ages 5 to 17 years
Introduction
School is an important setting for children’s learning, development, and interaction with their peers. In Canada, it is estimated that more than 5 million children are enrolled in public elementary or secondary school programsFootnote 211. Since children spend a significant proportion of their day in and around schoolsFootnote 212, it is not surprising that 10% to 25% of injuries in this age group are sustained in a school settingFootnote 213. Schools are the third most prevalent location of injury for Canadian adolescents after sports/athletic and home settingsFootnote 214. These paediatric injuries may be broadly grouped as unintentional (accidental) or intentional (violent). Unintentional injuries often relate to factors in the built environment, for example falls on floors, stairs or furnishings, while intentional injuries involve self-harm or aggressive interpersonal acts such as bullyingFootnote 213. An injury study in Ottawa, Canada, reported that 18% of all injuries among school-aged children occurred at school (rather than other locations), with the majority of cases being among boysFootnote 215. This study reported the risk of head injuries was higher at school compared to other locations, and participation in sports and other recreation was also associated with an increased risk of injury. A similar study in the U.S. also reported that the majority of injuries occurred among males, with 11% of these injuries being violent in nature and 5.5% being a traumatic brain injury (TBI)Footnote 216.
Schools are the third most prevalent location of injury for Canadian adolescents after sports/athletic and home settings.
The objective of this analysis was to identify and describe cases of TBI occurring in school that were captured in the CHIRPP databaseFootnote 203. Although there is an ICD-10-CA code for identifying school-related cases (U98.28)Footnote 64, in health administrative data sources this code is a provisional one and is inconsistently used. For all practical purposes, these cases are unidentifiable in the DAD or NACRS.
Methods
Records entered into the CHIRPP system with an injury date between January 1, 2007 and July 17, 2017 were extracted for patients between the ages of 5 and 17 years old (60 to 215 months, N = 648,403). School-related injuries were identified from this subset when injuries occurred during the weekday and were specified as having occurred at a kindergarten through secondary school (CHIRPP location code 42L), any school-like institution (CHIRPP location codes 41L, 43L to 49L), or with narrative text listing bilingual key words such as “school” and “école”. Study results are reported as counts (N, n), Annual percent change (APC) with 95% confidence intervals (CI), percentages, and as a normalized frequency distribution per 100,000 CHIRPP/eCHIRPP records (see Chapter 3 for more information on normalization).
Results
Over the approximately 10.5 year period, a total of 45,970 cases of emergency department (ED) visits for school- related head injury were identified in the CHIRPP records, of which 57.9% (n = 26,622) were TBI (7,089.7 and 4,105.8 per 100,000 CHIRPP records, respectively). Figure 13.1 shows the annual trends for school-based all head injuries and TBI. Both show an increasing trend with TBI increasing at a faster rate (APC = 6.2% vs. 2.8%). Figure 13.2 displays the age and sex distribution of the TBI cases associated with school. TBI cases were more frequent among males (63.9%) and they appear to plateau between 6 and 10 years of age, and then decline for older ages. Among females TBI occur more consistently across the age range with small peaks between 6 and 7 years and again between 13 and 15 years of age.
Figure 13.1: NormalizedFigure 13.1 Footnote a annual frequency distribution of all head injury cases and traumatic brain injury cases associated with school, CHIRPP/eCHIRPP, 2007 to 2017, ages 5 to 17 years, per 100,000 record
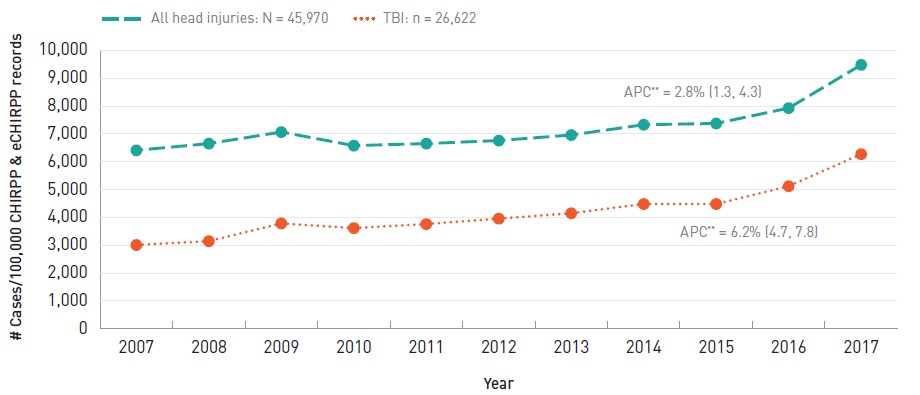
- Figure 13.1 Footnote a
-
Proportions are expressed as a normalized frequency relative to system denominators (not population denominators). As such, proportions per 100,000 records are normalized to all cases in the CHIRPP and eCHIRPP databases in each calendar year, on the data extraction date. See Chapter 3 for more information.
Text description
| Year | All head injuries | TBIs |
|---|---|---|
| 2007 | 6,412.7 | 3,012.0 |
| 2008 | 6,653.9 | 3,149.4 |
| 2009 | 7,069.2 | 3,787.8 |
| 2010 | 6,580.5 | 3,619.2 |
| 2011 | 6,654.3 | 3,764.1 |
| 2012 | 6,763.8 | 3,959.3 |
| 2013 | 6,962.2 | 4,152.2 |
| 2014 | 7,331.2 | 4,484.0 |
| 2015 | 7,378.0 | 4,484.8 |
| 2016 | 7,929.7 | 5,124.7 |
| 2017 | 9,483.1 | 6,275.2 |
APC: Annual percent change
|
||
Figure 13.2: NormalizedFigure 13.2 Footnote a age and sex distributionFigure 13.2 Footnote b of traumatic brain injury cases associated with school, CHIRPP/eCHIRPP, 2007 to 2017, ages 5 to 17 years, per 100,000 records
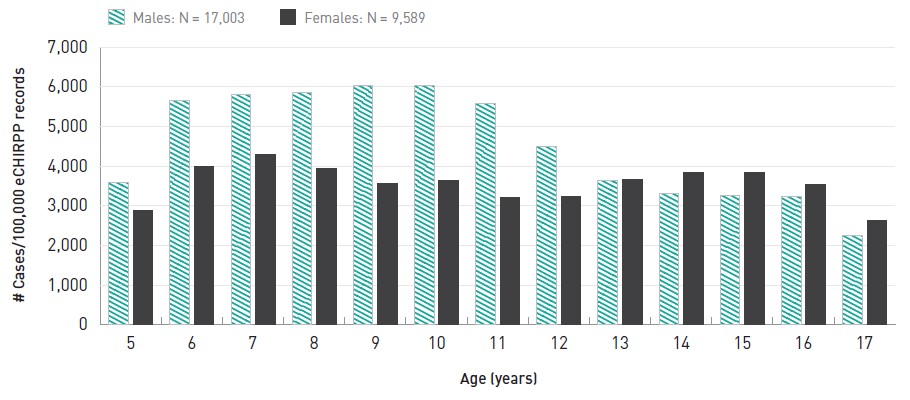
- Figure 13.2 Footnote a
-
Proportions are expressed as a normalized frequency relative to system denominators (not population denominators). As such, proportions per 100,000 records are normalized to all cases in the CHIRPP and eCHIRPP databases for the given age and sex, on the data extraction date. See Chapter 3 for more information.
- Figure 13.2 Footnote b
-
Age/sex information was missing in 30 cases.
Text description
| Age | Males | Females |
|---|---|---|
| 5 | 3,582.0 | 2,882.5 |
| 6 | 5,665.3 | 3,996.1 |
| 7 | 5,797.4 | 4,301.2 |
| 8 | 5,857.4 | 3,954.4 |
| 9 | 6,029.4 | 3,561.2 |
| 10 | 6,045.0 | 3,638.7 |
| 11 | 5,576.8 | 3,212.5 |
| 12 | 4,495.8 | 3,235.1 |
| 13 | 3,651.0 | 3,654.4 |
| 14 | 3,321.4 | 3,832.9 |
| 15 | 3,267.9 | 3,837.4 |
| 16 | 3,237.9 | 3,529.5 |
| 17 | 2,258.9 | 2,633.0 |
|
||
The majority of school based TBI were unintentional in nature (94.5%) and resulted from cases of being struck against an object, a fall, or an unintentional impact with another person. Intentional injuries including assaults and self-harm were also observed (3.5%) (Table 13.1). Children were engaged in a sport or recreation activity in 39.5% of school-based TBI cases.
| Mechanism | # | % | |
|---|---|---|---|
| Intentional | Total | 939 | 3.5 |
| Physical assault | 926 | 3.5 | |
| Self-harm | 13 | < 1.0 | |
| Unintentional | Total | 25,160 | 94.5 |
| Unintentional impact with other person | 18,522 | 69.6 | |
| Fall | 3,803 | 14.3 | |
| Struck by/against object | 2,835 | 10.7 | |
| Not further specified | 523 | 2.0 | |
| Total | 26,622 | 100 | |
The locations of the injury events within the school were also examined. Among cases where information was available, the majority of TBI occurred in the yard (including playgrounds), followed by the gym (Table 13.2). The direct element of impact involved in the injury was also examined, such as whether an individual was responsible for the injury vs. another agent. The majority of TBI were attributed to direct contact with a structural element such as stairs, walls, and floors (Table 13.3). School-based TBI resulted in hospital admission in 1.9% of cases (76.5 cases/ 100,000 CHIRPP records).
| Location | # | % |
|---|---|---|
| Yard | 9,052 | 34.0 |
| Gym | 4,549 | 17.1 |
| Classroom | 1,765 | 6.6 |
| Hallway | 1,520 | 5.7 |
| Stairs | 519 | 2.0 |
| Outside, not further specified | 379 | 1.4 |
| Cafeteria | 226 | 0.9 |
| Inside, not further specified | 185 | 0.7 |
| Lockers, locker room | 171 | 0.6 |
| Parking | 76 | 0.3 |
| No details available | 8,180 | 30.7 |
| Total | 26,622 | 100.0 |
| Direct element of impact | # | % |
|---|---|---|
| Structural element | 12,010 | 45.1 |
| Other person | 9,320 | 35.0 |
| Object | 2,300 | 8.6 |
| Environment | 1,264 | 4.8 |
| Sporting equipment | 1,020 | 3.8 |
| Furniture | 229 | 0.9 |
| Container | 13 | 0.1 |
| No details available | 466 | 1.8 |
| Total | 26,622 | 100.0 |
Discussion
All school-based head injuries, including TBI, presenting to CHIRPP hospitals' emergency departments have been increasing over the past decade, which is consistent with previous findingsFootnote 58. Similar to studies from the U.S.Footnote 216 and Ottawa, CanadaFootnote 5 on overall school-based injuries, the majority of TBI in this study were found to be among males. While school-based TBI appear to plateau in the early years among boys before declining slightly for adolescents, TBI patterns were relatively steady among girls across the age range in this study. Unintentional injuries account for the majority of school-based injury, but this study found a small percentage of intentional cases. Although almost all of the intentional injuries were related to assault, self-inflicted injuries should not be overlooked. Many self-inflicted injuries are non-head related and would not be captured in this studyFootnote 217. School curricula seldom prioritize self-harm, and as a result, issues regarding self-harm in the school setting are often rendered invisible despite its escalating prevalenceFootnote 217Footnote 218.
Unintentional TBI were most often due to an impact with another person, with many of these cases having occurred during participation in an informal sport. The yard and the gym were the two most common locations for school-based TBI, and structural elements such as pavement or a wall, factored in as the most frequent direct element of impact for TBI. This study corroborates existing knowledge on school-based injuries and provides a specific lens on instances that resulted in TBI. Given the increasing trends in TBI in Canada, the injury characteristics described in this study should support further work regarding injury prevention in school settings.
The causes of school-based head injuries are highly varied, and include mechanisms such as falls, playground/sports-related falls, assaults/fights and impacts, and collisions with motor vehicles. No single approach to prevention is sufficiently comprehensive to address all injury contexts. Preventive action on specific issues such as refitting playgrounds and infrastructure to meet current standards, and making sports safety equipment and rules of play mandatory in the school setting is likely to be effective. Consequently, ministries of education, school boards and staff should continue to consider evolving safety initiatives for specific causes of injuries, especially categories where TBI and other head injuries are especially frequent or serious in the school setting.
14. Sentinel surveillance of emergency department visits for traumatic brain injuries and all head injuries associated with seniors' falls
The electronic Canadian hospitals injury reporting and prevention program (eCHIRPP) 2011 to 2017, ages 65 years and older
Introduction
According to the 2016 Canadian Census, seniors aged 65 years and older comprise a sizeable share of the population at 16.9%Footnote 219 and it is forecasted this could increase to as much as 27.8% by 2063Footnote 220. Each year in Canada between 20% to 30% of seniors fallFootnote 221, and fall-related injuries are the leading cause of injury-related hospitalizations among seniorsFootnote 4. Resulting injuries can cause disability, reduced mobility, increased risk of premature deathFootnote 222, as well as negative mental health outcomes including fear of falling, confusion, and depression, and increased isolation and dependence on othersFootnote 221.
Falls are also costly to the Canadian economy. In 2010, falls cost $8.7 billion in indirect and direct costs, totalling a third of the total $26.8 billion in injury costsFootnote 5. Between 2010 and 2035, it has been forecasted that a 20% reduction in falls among seniors aged 65 and older could save 4,400 lives and $10.8 billionFootnote 5.
Given the vulnerability and growth of Canada’s aging population, it is imperative to better understand the epidemiology of seniors’ falls, including both risk factors and outcomes.
There are many complex and interactive risk factors for seniors’ falls, categorized as biological/intrinsic (e.g., health conditions), behavioural (e.g., excessive alcohol, multiple medications), environmental (e.g., slippery surfaces) and social/economic (e.g., living alone, genderFootnote 221Footnote 223Footnote 224). Leading risk factors include balance and gait deficits, previous falls, and using multiple medications at the same timeFootnote 224. The manner of fall can also influence the injury type. Forward falls, for instance, have been associated with head impact and related injuriesFootnote 225, and in general, falls are the leading cause of traumatic brain injury (TBI) among seniorsFootnote 11Footnote 226Footnote 227.
Given the vulnerability and growth of Canada’s aging population, it is imperative to better understand the epidemiology of seniors’ falls, including both risk factors and outcomesFootnote 227. The objective of this study was to identify and describe cases of TBI and all head injuries related to seniors’ falls that were captured in eCHIRPP database. ICD-10 falls classifications were used in this study to manually categorize the injury mechanism for comparison purposesFootnote 63; however, additional details of TBI cases including where the injury happened, its direct cause (e.g., impact with level flooring versus stairs) and risk factors such as previous falls or alcohol consumption are also reported based on information in the patients’ narratives and other variables in eCHIRPP. This detailed information is not available in ICD-10 coded health administrative data (i.e., from ambulatory care, hospitalizations, and mortality databases).
Methods
Records in the eCHIRPP database with an injury date from April 1, 2011 onward were extracted on June 27, 2017. Cases of TBI and other head injuries related to seniors’ falls were identified among patients aged 65 years and older (≥ 780 months). Case identification criteria included records with the External Cause of Injury variable coded as “201EC:Falls” or those where the patient’s narrative contained any of the following English and French keywords: “fall,” “fell,” “wiped out,” “foosh” (an acronym for “fell on outstretched hand”), “slip,” “trip,” “tombe,” “glisse,” “trebuche,” and “chute.” Grammatical variations of keywords were also incorporated to maximize record identification. Falls involving motorized and non-motorized mobility devices such as scooters and wheelchairs were included in this study, while other transport-related cases were excluded.
Additional cases that did not meet the study criteria were also excluded (for instance, records with patients’ narratives that contained the word “fell,” but described a falling object that did not cause the patient to fall). Study results are reported as counts (N, n), percentages, and as a normalized frequency distribution per 100,000 eCHIRPP records (see Chapter 3 for more information on normalization and other methodological details).
Results
Overall, there were 4,736 fall-related head injury cases among seniors (17,675.6 per 100,000 records), half of whom reported a TBI (n = 2,334, 49.3%). Three quarters (75.5%) of the fall-related head injury cases were seen at two of the 7 general hospitals reporting to CHIRPP during the study period. Among TBI patients, nearly half (43.2%) were admitted to hospital for injury treatment, and there were 13 fatalities (0.6%). The frequency of all head injury and TBI cases increased over the study period, with TBI increasing at twice the rate (5.4% vs. 2.5% as seen in Figure 14.1).
Figure 14.1: NormalizedFigure 14.1 Footnote a annual frequency distribution of all head injury cases and traumatic brain injury cases associated with falls, eCHIRPP, 2011 to 2017, ages 65 years and older, per 100,000 records
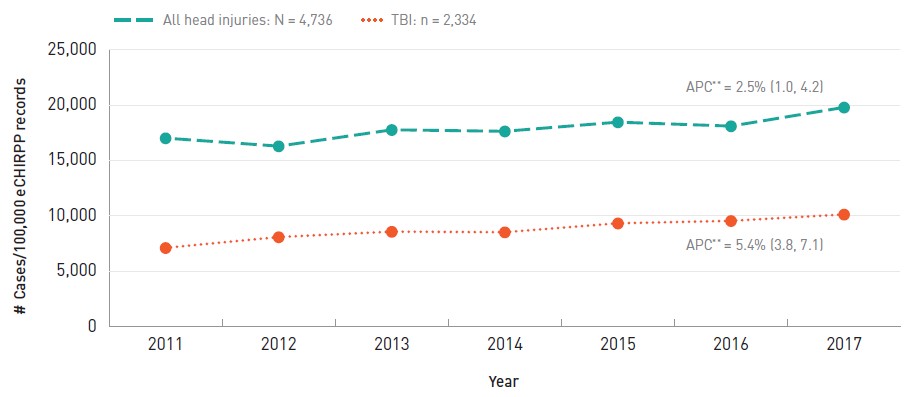
- Figure 14.1 Footnote a
-
Proportions are expressed as a normalized frequency relative to system denominators (not population denominators). As such, proportions per 100,000 records are normalized to all cases in the eCHIRPP database in each calendar year, on the data extraction date. See Chapter 3 for more information.
Text description
| Year | All head injuries | TBIs |
|---|---|---|
| 2011 | 17,033.7 | 7,123.2 |
| 2012 | 16,308.1 | 8,096.2 |
| 2013 | 17,781.9 | 8,586.8 |
| 2014 | 17,651.0 | 8,535.8 |
| 2015 | 18,475.3 | 9,340.7 |
| 2016 | 18,119.1 | 9,560.0 |
| 2017 | 19,812.8 | 10,140.4 |
APC: Annual percent change
|
||
Figure 14.2 presents the frequency distribution of fall-related head injuries among seniors, by sex. Males had a slightly higher normalized frequency than females regarding all head injuries (18,238.4/100,000 vs. 17,230.8/100,000 among females) and TBI (9,924.4/100,000 vs. 7,874.4/100,000 among females).
Figure 14.2: NormalizedFigure 14.2 Footnote a sex distributionFigure 14.2 Footnote b of all head injury cases and traumatic brain injury cases associated with falls, eCHIRPP, 2011 to 2017, ages 65 years and older, per 100,000 records
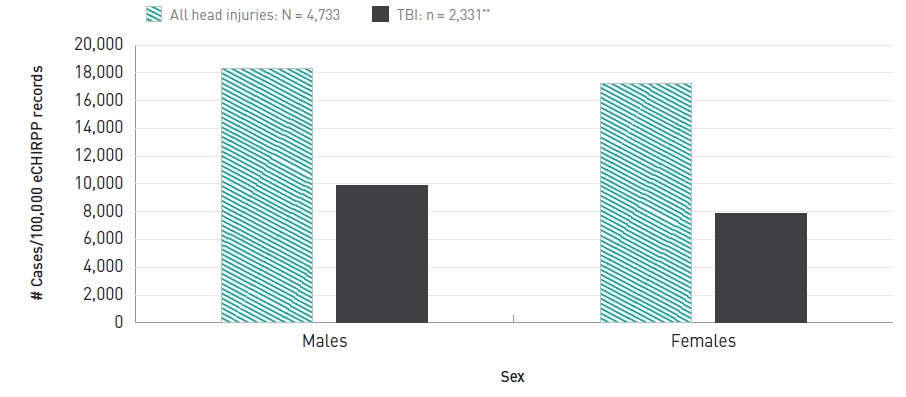
- Figure 14.2 Footnote a
-
Proportions are expressed as a normalized frequency relative to system denominators (not population denominators). As such, proportions per 100,000 records are normalized to all cases in the eCHIRPP database for the given age group and sex, on the data extraction date. See Chapter 3 for more information.
- Figure 14.2 Footnote b
-
The three TBI cases with missing sex information are reflected in both the all head injuries and TBI frequencies on the graph.
Text description
| Males | Females | |
|---|---|---|
| All head injuries | 18,328.4 | 17,230.8 |
| TBIs | 9,924.4 | 7,874.4 |
|
||
The location of fall-related TBI was provided for 78.2% of cases. Among these cases with known location, almost two thirds (n = 1,209; 66.2%) of TBI were sustained while falling in a private home (the patient's own home or someone else's). Among cases where a private home's room/area was also reported (n = 826), the stairs (25.7%), bedroom (14.8%) and bathroom (14.4%) were the three most common places where falls occurred (Table 14.1).
Among these cases with known location, nearly two thirds (n = 1,209; 66.2%) of TBI were sustained while falling in a private home (the patient's own home or someone else's).
| Room or area | # | % |
|---|---|---|
| Stairs, ramp | 212 | 25.7 |
| Bedroom | 122 | 14.8 |
| Bathroom | 119 | 14.4 |
| Kitchen | 69 | 8.4 |
| Garden, yard | 59 | 7.1 |
| Driveway | 43 | 5.2 |
| Living room, family room, rec room, den | 42 | 5.1 |
| Private garage, carport | 29 | 3.5 |
| Veranda, porch, balcony, deck | 26 | 3.1 |
| Hall, foyer | 23 | 2.8 |
| Roof | 21 | 2.5 |
| Sidewalk, path | 14 | 1.7 |
| Basement, cellar | 11 | 1.3 |
| Other room/area | 36 | 4.4 |
| TotalTable 14.1 Footnote b | 826 | 100.0 |
|
||
The second most common reported location where fall-related TBI were sustained was medical or residential institutional settings (hospital, other health centre, home for the elderly or other institutional home), which accounted for 13.4% (244/1,825) of cases with reported location. Among those where the room/area was also known (n = 88), the bathroom (33%), bedroom/dorm (29.5%), and hall/foyer (11.4%), were the three most common places for falls (Table 14.2).
| Room or area | # | % |
|---|---|---|
| Bathroom | 29 | 33.0 |
| Bedroom or dorm | 26 | 29.5 |
| Hall, foyer, waiting room | 10 | 11.4 |
| Living room, family room, rec room, den | 6 | 6.8 |
| Stairs, ramp | 6 | 6.8 |
| Dining area, cafeteria | 5 | 5.7 |
| Other room or area | 6 | 6.8 |
| TotalTable 14.2 Footnote b | 88 | 100.0 |
| ||
Table 14.3 presents the mechanism of fall-related TBI among seniors, within a 25% random sample of all fall-related TBI among seniors. Nearly half (47%) of the sampled falls occurred on the same level (excluding involving ice or snow) from slipping/tripping/stumbling; colliding with another person; bumping against an object; from getting on/off the toilet; or from falling on the same level without further specification of what happened. Another 18.6% of falls happened on stairs/steps including ramps or inclines, while 8.6% involved furniture. Falls on the same level involving ice or snow accounted for 6.5% of the sampled fall-related TBI.
| MechanismTable 14.3 Footnote b | # | % |
|---|---|---|
| Fall on same level, excl. ice and snowTable 14.3 Footnote c | 273 | 47.0 |
| Fall on and from stairs and steps | 108 | 18.6 |
| Fall involving bed, chair, or other furniture | 50 | 8.6 |
| Fall on same level involving ice and snow (excl. stairs/steps, ice skates and skis) | 38 | 6.5 |
| Fall from ladder or from/on scaffolding | 18 | 3.1 |
| Fall involving ice-skates, skis, roller skates | 11 | 1.9 |
| OtherTable 14.3 Footnote d | 16 | 2.8 |
| Unspecified fall | 67 | 11.5 |
| Total | 581 | 100.0 |
|
||
In the 25% random sample of TBI cases, 54% of falls occurred indoors and 32.5% outdoors, while the setting was unknown in 13.4% of cases. The most common direct element of impact involved in the injury for indoor falls was impact with flooring including concrete and other surfaces (58.6%), with more than two-thirds of those (68.6%) having reported a fall on the same level as the injury mechanism. The second most common direct element of impact for indoor falls was impact with stairs, ramps or landings, including handrails, railings, and bannisters, at 11.4% of sampled cases (and all of those cases reported a stair fall as the injury mechanism). Findings were similar for outdoor falls, whereby the most common direct element of impact for TBI was also impact with concrete and other surfaces, including flooring (70.1%), with more than half of those (51.8.%) having reported a fall on the same level as the injury mechanism. Impact with ice/ snow was the direct cause of TBI in 10.8% of outdoor falls, with 64.7% of those having reported falling on the same level as the injury mechanism.
In terms of risk factors, within the 25% random sample of fall-related TBI cases:
- 4.8% of patients reported alcohol consumption;
- 4.8% of patients reported another health problem including dementia, Alzheimer's, Parkinson's, diabetes, or a heart condition;
- 4.1% of patients reported dizziness or loss of consciousness leading up to the fall; and
- 2.9% of patients reported previous falls.
Discussion
Overall, nearly one-fifth of unintentional injury cases among seniors in the eCHIRPP database during the study period involved a fall-related head injury, and half of those were TBI. This is expected given the high rate of falls among seniors in Canada, and high proportion causing TBI according to the literature. Nearly half of patients in this study with fall-related TBI were admitted to hospital, which is consistent with population-based statistics showing falls as the leading cause of injury-related hospitalizations among Canadian seniors. While eCHIRPP is not a robust source of mortality data, it is worth noting that there were also 13 TBI deaths reported in the study population. This is disproportionately higher than the overall proportion of deaths in the eCHIRPP database, which is indicative of the severity of the injury mechanism and the vulnerability of the senior population. In this study, when accounting for the sex distribution in the eCHIRPP database, males with a fall-related head injury accounted for a higher normalized frequency among all injuries overall. Males of all ages and specifically in the senior age groups also had a higher population-based rate of emergency department visits for fall-related TBI, as presented earlier in this report.
Among cases where the location of the fall was reported, this study found that the majority of fall-related TBI were sustained at private homes, and the second most common location was medical or residential institutional settings. This was expected given the high likelihood that the majority of the study population is retired from the labour force, and therefore spending more time at home than other locations. Moreover, seniors under care at medical or residential institutional settings are already more vulnerable to falling given compromised health. This finding also highlights the vulnerability of seniors even when they are under supervised care in a controlled setting such as a hospital or residential care.
After falls on the same level, stair falls were the second most common mechanism reported overall among TBI patients, but were the most common among falls at private homes (inside and outside). This finding is consistent with other studies showing the high risk of TBI from stair falls among older adultsFootnote 228Footnote 229, and high proportions of seniors' falls happening at homeFootnote 221. In addition to factors such as compromised mobility and vision and other health conditions, stairs themselves can pose additional challenges including uneven steps, deficient handrails, slippery surfaces, disrepairFootnote 230Footnote 231, low lighting, stair height and non-distinct stair edgesFootnote 232. More in-depth analyses of a 25% sample of fall-related TBI further revealed information on the general locale, injury mechanism, and direct causes of injury, with more than half of the sampled falls having occurred indoors, and mainly due to falling on the same level to the floor. Findings were similar for the outdoor cases, which is not surprising considering time spent being mobile doing every day activities at ground level, indoors and out. Comorbidities including dementia, Alzheimer's, Parkinson's disease, and diabetes were also reported among patients (or caregivers) among the study population; however, the prevalence of many chronic health conditions among Canada's seniors is higher than what was reported in this study, so these results should be interpreted with cautionFootnote 233.
This study corroborated existing knowledge on TBI among seniors sustained during falls, further highlighting the need for ongoing injury prevention efforts among this vulnerable and growing population.
15. Sentinel surveillance of emergency department visits for traumatic brain injuries and all head injuries associated with motor vehicle-pedestrian collisions
The electronic Canadian hospitals injury reporting and prevention program (eCHIRPP), 2011 to 2017
Introduction
According to the World Health Organization (WHO),
“[a] pedestrian is any person who is travelling by walking for at least part of his or her journey... [and] may be using various modifications and aids to walking such as wheelchairs, motorized scooters, walkers, canes, skateboards, and roller blades... A person is also considered a pedestrian when running, jogging, hiking, or when sitting or lying down in the roadway”Footnote 234.
The WHO estimates that each year there are approximately 270,000 pedestrian fatalities, accounting for more than one-fifth of the 1.24 million global annual road fatalitiesFootnote 234. Others estimate the annual number of pedestrian fatalities to be as high as 400,000Footnote 235. In Canada, among pedestrians struck by motor vehicles in traffic there were 300 fatalitiesFootnote 236 in 2016 and 1,883 hospitalizations in 2017/18Footnote 4.
Overall, transport injuries are the second most common cause (after falls) of unintentional injury death among Canadians, and it is estimated that pedestrian-transport injuries cost the Canadian economy $458 million each year in direct and indirect costs to the healthcare system and lost labour productivityFootnote 5.
Pedestrian fatality rates have been declining over the last several decades in Canada; however, the percentage of deaths that pedestrians comprise among all road user deaths does not show a similar declineFootnote 237. Moreover, among member countries of the Organisation for Economic Co-operation and Development (OECD) Canada’s pedestrian fatality rate is higher than many top performing nationsFootnote 238.
There are many risk factors of motor vehicle-pedestrian collisions, including road user behaviour, roadway and vehicle design, environmental conditions, socioeconomic status, and demographic influences including age. Pedestrian distraction, mostly notably from mobile phone use in recent years, is also a behavioural risk factor that is garnering more research attentionFootnote 239Footnote 240Footnote 241. Regarding demographics, seniors are the most vulnerable pedestrians and have the highest age-specific fatality ratesFootnote 242. This is not surprising given that many seniors experience reduced mobility, vision, hearing, cognition, and reaction time, and are more likely to be seriously injured or not survive a collision.
Among vulnerable road users, pedestrians are generally the least protectedFootnote 243, and frontal impacts by motor vehicles are the most common mechanism of pedestrian collisionsFootnote 234.
Among vulnerable road users, pedestrians are generally the least protectedFootnote 243, and frontal impacts by motor vehicles are the most common mechanism of pedestrian collisionsFootnote 234. Among adult pedestrians, their legs are often struck, sending them onto the hood of the vehicle with their head then hitting the hood or windshieldFootnote 234. Several studies have shown head injuries to be among the most common injuries sustainedFootnote 244Footnote 245Footnote 246.
The objective of this study was to identify and describe cases of traumatic brain injuries (TBI) and all head injuries, sustained by pedestrians struck by motor vehicles on roadways, captured in eCHIRPP database. Health administrative data sources are able to identify pedestrian injury cases using the following ICD-10 codes: V02.1 Pedestrian injured in collision with two- or three-wheeled motor vehicle, traffic accident; V03.1 Pedestrian injured in collision with car, pick-up truck or van, traffic accident; V03.9 Pedestrian injured in collision with car, pick-up truck or van, unspecified whether traffic or non-traffic accident; V04.1 Pedestrian injured in collision with heavy transport vehicle or bus, traffic accident; V04.9 Pedestrian injured in collision with heavy transport vehicle or bus, unspecified whether traffic or non-traffic accident; V09.2 Pedestrian injured in traffic accident involving other and unspecified motor vehiclesFootnote 63. These ICD-10 codes, however, do not capture the more detailed information provided by CHIRPP on the circumstances of these injury events such as whether the pedestrian was struck while crossing at an intersection versus while walking along the side of a roadway.
Methods
Records in the eCHIRPP database with an injury date from April 1, 2011 onward were extracted on June 27, 2017. Cases of TBI and other head injuries related to pedestrians struck by motorized vehicles on roadways were identified. Case identification criteria included records with an External Cause of Injury code of 100EC: Transport injuries occurring in traffic, in combination with any of the following Context codes: 11C: Pedestrian including baby being carried or child in stroller on street; 12C: Using wheelchair, (wheelchair type scooter (3 wheels), powered or unpowered, mobility assistance devices); 29C: Using inline skates, skateboards, and scooters (powered/unpowered) for transport; 91C: Walking, running, crawling; or 92C: Sitting, standing. Cases involving patients struck by trailers being towed by motor vehicles were also included. Injuries involving other types of interactions between pedestrians and motor vehicles on roadways were excluded, including near misses where an impact with a motor vehicle did not occur, and pedestrians who chased and/or intentionally grabbed onto the back of a moving motor vehicle. Study results are reported as counts (N, n), percentages, and as a normalized frequency distribution per 100,000 eCHIRPP records (see Chapter 3 for more information on normalization and further methodological details).
Results
Overall there were 657 head injury cases among pedestrians struck by motorized vehicles on roadways, of which 67.1% (n = 441) reported a TBI. The frequencies of all head injuries and TBI as a trend over time are shown in figure 15.1. The normalized frequency remains stable over the study period.
Figure 15.1: NormalizedFigure 15.1 Footnote a annual frequency distribution of all head injury cases and traumatic brain injury cases associated with pedestrians struck by motor vehicles on roadways, eCHIRPP, 2011 to 2017, per 100,000 records
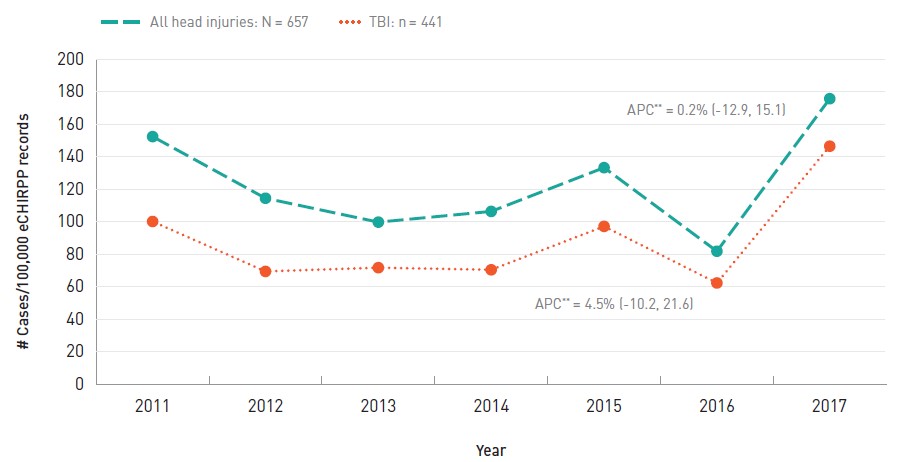
- Figure 15.1 Footnote a
-
Proportions are expressed as a normalized frequency relative to system denominators (not population denominators). As such, proportions per 100,000 records are normalized to all cases in the eCHIRPP database for the given year, on the data extraction date. See Chapter 3 for more information.
Text description
| Year | All head injuries | TBIs |
|---|---|---|
| 2011 | 152.3 | 100.1 |
| 2012 | 114.4 | 69.4 |
| 2013 | 99.7 | 71.7 |
| 2014 | 106.3 | 70.4 |
| 2015 | 133.2 | 97.1 |
| 2016 | 81.8 | 62.3 |
| 2017 | 175.6 | 146.4 |
APC: Annual percent change
|
||
Figure 15.2 presents frequency distribution of head injuries sustained by pedestrians struck by motor vehicles on roadways, by age group. The frequencies of all head injuries and TBI per 100,000 records were highest among seniors aged 65 years and older (207.2 and 160.4/100,000 respectively). For all head injuries, youth aged 15 to 19 years followed at 156.5/100,000, whereas for TBI the second highest frequency was among those aged 50 to 64 at 123.4/100,000 records.
Figure 15.2: NormalizedFigure 15.2 Footnote a age distribution of all head injury cases and traumatic brain injury cases associated with pedestrians struck by motor vehicles on roadways, eCHIRPP, 2011 to 2017, per 100,000 records
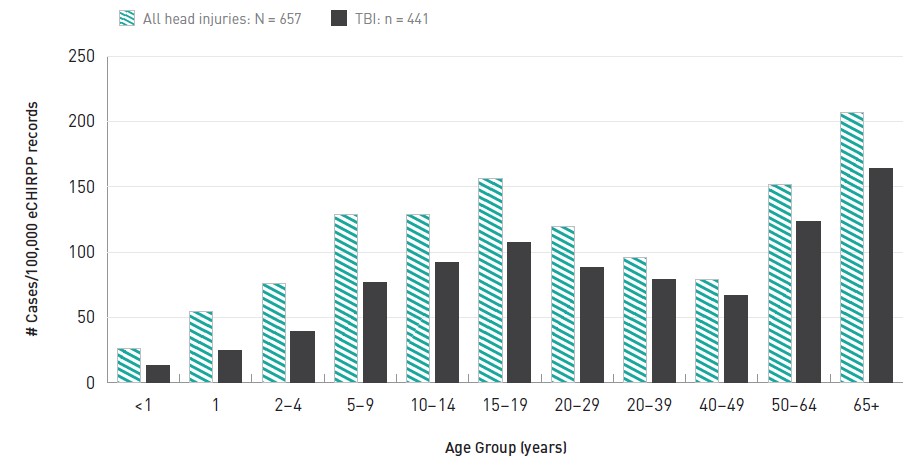
- Figure 15.2 Footnote a
-
Proportions are expressed as a normalized frequency relative to system denominators (not population denominators). As such, proportions per 100,000 records are normalized to all cases in the eCHIRPP database for the given age group, on the data extraction date. See Chapter 3 for more information.
Text description
| Age Group | All head injuries | TBIs |
|---|---|---|
| <1 | 26.2 | 13.1 |
| 1 | 54.9 | 25.0 |
| 2-4 | 75.9 | 39.0 |
| 5-9 | 128.9 | 76.6 |
| 10-14 | 128.9 | 91.8 |
| 15-19 | 156.5 | 107.7 |
| 20-29 | 119.3 | 88.6 |
| 20-39 | 96.3 | 79.3 |
| 40-49 | 78.8 | 66.7 |
| 50-64 | 152.2 | 123.4 |
| 65+ | 207.2 | 164.0 |
|
||
Overall, female pedestrians had a higher frequency of TBI than males, at 87.8 cases/100,000 records, versus 69.9/100,000 cases, respectively; this result is most apparent throughout childhood and young adulthood (20 to 29 years), where the highest frequency among female pedestrians was among those aged 15 to 19 years, at 147.4/100,000 records (Figure 15.3). Nonetheless, the highest frequency overall was noted among male seniors aged 65 years or older at 234.2/100,000 records.
Figure 15.3: NormalizedFigure 15.3 Footnote a age and sex distribution of traumatic brain injury cases among pedestrians struck by motor vehicles on roadways, eCHIRPP, 2011 to 2017, per 100,000 records

- Figure 15.3 Footnote a
-
Proportions are expressed as a normalized frequency relative to system denominators (not population denominators). As such, proportions per 100,000 records are normalized to all cases in the eCHIRPP database for the given age group and sex, on the data extraction date. See Chapter 3 for more information.
Text description
| Age Group | Males | Females |
|---|---|---|
| <1 | 0.0 | 27.9 |
| 1 | 27.2 | 22.2 |
| 2-4 | 30.5 | 50.3 |
| 5-9 | 86.9 | 63.0 |
| 10-14 | 67.7 | 127.1 |
| 15-19 | 80.2 | 147.4 |
| 20-29 | 66.9 | 122.9 |
| 30-39 | 102.8 | 43.2 |
| 40-49 | 72.9 | 58.1 |
| 50-64 | 126.9 | 119.8 |
| 65+ | 234.2 | 116.3 |
|
||
| CircumstanceTable 15.1 Footnote a | # | % | |
|---|---|---|---|
| Crossing roadway | Total | 243 | 55.1 |
| Crossing roadway, NFS2 | 150 | 34.0 | |
| Struck while in crosswalk/intersection, including vehicles turning or running a red light/stop sign | 59 | 13.4 | |
| Ran across or into roadway | 27 | 6.1 | |
| Darted/walked out from between parked cars | 7 | 1.6 | |
| On roadway, including while walking, running, and on roadway NFSTable 15.1 Footnote c | 159 | 36.1 | |
| Struck by vehicle’s mirror, or foot was run over | 10 | 2.3 | |
| Struck while exiting a vehicle (same or other vehicle) | 9 | 2.0 | |
| Struck while walking/standing on the side of roadway | 9 | 2.0 | |
| Back-over | 7 | 1.6 | |
| OtherTable 15.1 Footnote b, NFSTable 15.1 Footnote c | 4 | 0.9 | |
| Total | 441 | 100.0 | |
|
|||
Table 15.1 presents information on the circumstances of the injury event among patients who sustained a TBI from being struck by a motor vehicle on a roadway. The most common reported circumstance at more than half (55.1%) of cases was being struck while crossing the roadway including at a crosswalk or intersection, running across the roadway, or darting out from between parked cars, and more than a third of these (34.1%) were among children aged 10 to 14 years. Another 36.1% of cases reported simply being on the roadway when they were struck, but further specificity was not provided.
Regarding other injuries sustained, among 441 TBI cases a total of 962 specific injuries were reported as some records had up to three specific injuries recorded. Another 53 cases sustained multiple injuries (more than 3 injuries). Nearly half (43.3%) of TBI patients were admitted to hospital for treatment of their injuries, and substance use by patients or others involved in the injury incidents was reported in 6.3% of cases.
More than 90% (n = 398) of TBI patients reported being struck by a light duty vehicle (car, van, SUV, or a truck with the type not further specified) while another 3.9% of patients reported that a large truck was the impacting vehicle. The majority (93.9%) of pedestrians who sustained a TBI from being struck by a motor vehicle were on foot, while the other pedestrians were in a stroller (3.4%), being carried (1.1%), or other pedestrian transport modes (Table 15.2). Some patients/guardians (n = 53) reported the distance that they were projected during the collision, and among those nearly half (47.2%) reported being projected between 7 and 15 feet (Table 15.3).
| Pedestrian type | # | % |
|---|---|---|
| On foot | 414 | 93.9 |
| In a stroller | 15 | 3.4 |
| Being carried or in wagon | 5 | 1.1 |
| OtherTable 15.2 Footnote a | 7 | 1.6 |
| Total | 441 | 100.0 |
| ||
| Distance projected or draggedTable 15.3 Footnote a | # | % |
|---|---|---|
| 3 to 6 feet (0.91 m to 1.82 m) | 10 | 18.9 |
| 7 to 15 feet (2.13 m to 4.57 m) | 25 | 47.2 |
| 20 to 30 feet (6.1 m to 9.14 m) | 12 | 22.6 |
| 40 or more feet (12.19 m or more) | 6 | 11.3 |
| Total | 53 | 100.0 |
| ||
Discussion
This study described the epidemiology of TBI and all head injuries sustained by pedestrians struck by motor vehicles on roadways. Across the life course, the data provided evidence of increased TBI risk among pedestrians leading up to and during the teenage years; risk declined during early adulthood before increasing in middle-age and climbing to high levels among seniors. Other Canadian research also shows teens, young adults and senior pedestrians to be at higher riskFootnote 243. It should be noted, however, that the proportion of seniors in the eCHIRPP database is low because the majority of CHIRPP hospitals are paediatric, so results pertaining to seniors should be interpreted with caution due to small numbers. Interestingly, the overall age-specific patterns of injury in this study are similar to patterns seen in population- based Canadian data on the age distribution of pedestrian fatality rates from motor vehicle traffic collisions.
Over the study period the trend in pedestrian related injuries was stable (persistent). Regarding the sex distribution among pedestrian TBI cases, overall, female pedestrians had a higher frequency of TBI than males, although the highest risk group was males aged 65 years or older; the association of senior males with higher pedestrian injury and fatality rates is also evidenced elsewhereFootnote 247Footnote 248. Interestingly, however, throughout childhood and young adulthood (2 to 29 years), TBI frequencies in this study were predominantly higher among females, with the highest being among those aged 15 to 19 years.
Crossing the roadway was the most common injury circumstance reported, which is consistent with findings of other work on this topicFootnote 238. Substance use was not common in the study population which was expected given that a high proportion of cases were children. Notwithstanding, alcohol consumption is a major risk factor for pedestrian injury and death. In Canada in 2011, among fatally injured pedestrians tested for alcohol, over 40% percent had been drinking and 28.2% percent had blood alcohol concentrations over 160 mgFootnote 249. Regarding injury severity, the high proportion overall of TBI patients admitted to hospital in this study was expected given the possibility of a pedestrian being projected several feet even if impacted by a slow-moving vehicle and the inherent intensity of this injury mechanism. Although the distance projected or dragged was reported in 12% of TBI cases, a limitation is that these are estimates based on patients’ narratives, and it is likely a considerably higher proportion of patients were projected or dragged after impact but did not report this in the narrative.
In addition to this limitation and others described in Chapter 3 of this report, reports of injury circumstances in eCHIRPP data are based on patients’ ability and willingness to recall and report details of the event. As such, various pertinent risk factors captured in other data sources such as police reports (e.g. compliance with road use laws ), are not consistently captured in eCHIRPP data, and are based on patients’ personal observations.
This study provided evidence of head injury risk to pedestrians while interacting with motor vehicles on roadways that complements other important sources of motor vehicle collision information such as police reports, observational studies, hospitalizations and fatality data, and other information sources. Examining the epidemiology of injuries sustained in motor vehicle-pedestrian collisions by consulting multiple data sources is essential for developing injury prevention strategies for pedestrians and other road users. One such key strategy is Canada’s Road Safety Strategy 2025 which is guided by a safe system approach to improving road safetyFootnote 250. This approach “...recognizes that the most vulnerable part of the system is comprised of unprotected human beings and that it has to be designed around them”Footnote 238.
Canada has made significant improvements and has seen important declines in motor vehicle-related injuries and fatalities over the last several decades, although declines among pedestrians have been less pronouncedFootnote 251. Pedestrian safety is a complex and multidisciplinary issue, requiring continued awareness and effort from all road users, and road and vehicle safety practitioners.
16. Sentinel surveillance of emergency department visits for traumatic brain injuries and all head injuries associated with intentional injury
The electronic Canadian hospitals injury reporting and prevention program (eCHIRPP), 2011 to 2017, all ages
Introduction
Intentional injury refers to injuries that occur as a result of purposeful human action to cause harm directed either to oneself or to another. Physical assault is an act of violence towards another, and includes instances of intimate partner violence, bullying, child maltreatment, and abusive head trauma to a young child (formerly referred to as shaken baby syndrome). Self-harm is another form of intentional injury, and can be inflicted through a variety of mechanisms such as through the deliberate misuse of drugs or self-inflicted lacerations (cutting).
In Canada, in 2018 there were 368 deaths due to all forms of assault and 3,809 suicidesFootnote 252. In 2017/18 there were 6,492 hospitalizations related to assault and 14,430 due to self-inflicted injury excluding QuebecFootnote 253.
While assaults are not a main cause of death or hospitalization in Canada (homicide is the fourth leading cause among those 20 to 24 years of age and sixth among those 25 to 34 yearsFootnote 252Footnote 253), they often involve younger people and head injuries are frequently the resultFootnote 8Footnote 254Footnote 255. Thus, prevention of these injuries is important due to the potential for long term consequences and the economic impact of injured young peopleFootnote 68Footnote 256. Suicide is the second leading cause of death among Canadians 15 to 34 years of ageFootnote 252Footnote 257. Conversely, rates of death by suicide are much higher among malesFootnote 257. Head injuries are less frequent among self-inflicted cases, but they can occur due to jumps or falls as well as being a secondary diagnosis related to a poisoning (e.g. fell while intoxicated).
The Canadian Enhancement of the International Statistical Classification of Diseases and Related Health Problems (ICD-10-CA)Footnote 64 contains numerous codes to identify intentional injuries: X70-X84 for intentional self-harm by various external causes, X85-Y09 for various forms of assault including maltreatment, neglect, and abandonment, and Y10-Y34 for events of undetermined intent. These codes do not provide detail with regards to the place of occurrence, the perpetrator or the weapon used. Also, there is some evidence that these codes are not always used consistently and thus cases of intentional injury may not be fully identified in administrative databases and thus other data sources may be helpful to gain further insightFootnote 258.
Emergency department surveillance of intentional injuries presents challenges compared to unintentional injuries, particularly with domestic violence, child maltreatment and self-inflicted injuriesFootnote 259Footnote 260.
The purpose of this study was to identify cases of assaults and self-inflicted traumatic brain injuries (TBI) in the eCHIRPP database and to provide details which may not be completely captured in health administrative databases.
Methods
Records entered into the CHIRPP system with injury date between April 1, 2011 and July 17, 2017 were extracted from the eCHIRPP database for all ages to use for the present analysis (N = 794,237). Intentional injury refers to cases of assault (physical, sexual, child maltreatment) or self-harm (suicide or self-inflicted injury), or events of undetermined intent and were identified by excluding cases that were coded as unintentional in nature (eCHIRPP intent code 10IN) or that were related to sports (if variable coding for organised sport confirmed sport participation or if narrative text used terms for sports). Undetermined cases were included because they are often thought to be intentional, particularly among poisoningsFootnote 261.
The mechanisms of injury examined can be broadly classified as assault, self-harm, or unknown. A variety of search strategies were used to identify assault cases; for example, cases of abusive head trauma to young children were identified by a combination of the age being below five years and the inclusion of narrative text using terms to describe abusive head trauma. Sexual assault cases were identified using a combination of context codes (eCHIRPP context code 85) and/or narrative text using key terms. Cases of bullying, child maltreatment, sibling abuse, physical assault, and intimate partner violence (IPV) were identified using key terms specific to those types of injury in combination with descriptions of assault. In the case of bullying, words related to “bully” were screened, while for sibling abuse, terms describing a sibling in combination with an assault were examined. Cases of IPV screened for words related to a domestic partner, and included cases of intentional injury where a third party to domestic violence may have been injured, e.g. a young child.
Cases of self-harm were identified by first screening out cases where another individual was identified in the factor codes (eCHIRPP factor codes 3122F and 3123F) or when the intent codes were suggestive of another party (12IN 13IN 14IN 19IN). If the narrative text included terms to suggest the use of drugs, or if substance use coding indicated drug use, then the case was classified as one of self-harm with the use of drugs. Otherwise, cases were identified as cases of self-harm where no drug was in use. Finally, undetermined cases were classified as either unknown or other. Other cases include those where a TBI occurred by way of childbirth or where an individual was found unconscious, or had amnesia. Unknown cases describe those where the individual has no recollection of what happened, or where the narrative text provided no further detail about the event. The perpetrator and the weapon/agent of injury were each identified using a combination of narrative text and mechanism coding.
Data mining syntax (PERL regular expressions) was used when assessing narrative textFootnote 108. Study results are reported as counts (N, n), annual percent change (APC) with 95% confidence intervals (CI), percentages, and as a normalized frequency distribution per 100,000 CHIRPP/eCHIRPP records (see Chapter 3 for more information on normalization and further methodological details).
Results
A total of 18,052 (2.3%) intentional (including undetermined) injury cases were identified in the eCHIRPP database during the study period, 28.1% of which (n = 5,075) were head injuries (639.0 cases/100,000 eCHIRPP records).
Of the 5,075 head injuries, 48.9% (n = 2,484) were TBI (312.8/100,000). Figure 16.1 shows the annual trends for all head injury and the TBI cases. Both head injuries and TBI decreased during the period from 2011 to 2015, with all head injuries at a slightly faster rate (12.1% versus 10%). Although there appears to be an increase beyond 2015, due to the small numbers and incomplete data entry, this period has not been further assessed. Figure 16.2 describes the age and sex distribution of TBI cases associated with intentional injury. The majority of cases were among males who sustained 74.7% of TBI. Among males, incidents were most frequent in the 20 to 29 years age group (1,831.9/100,000). Among females, the peak occurred in the 15 to 19 years age group (581.8/100,000).
Figure 16.1: NormalizedFigure 16.1 Footnote a annual frequency distribution of all head injury cases and traumatic brain injury cases associated with intentional injuries, eCHIRPP, 2011 to 2017, per 100,000 records
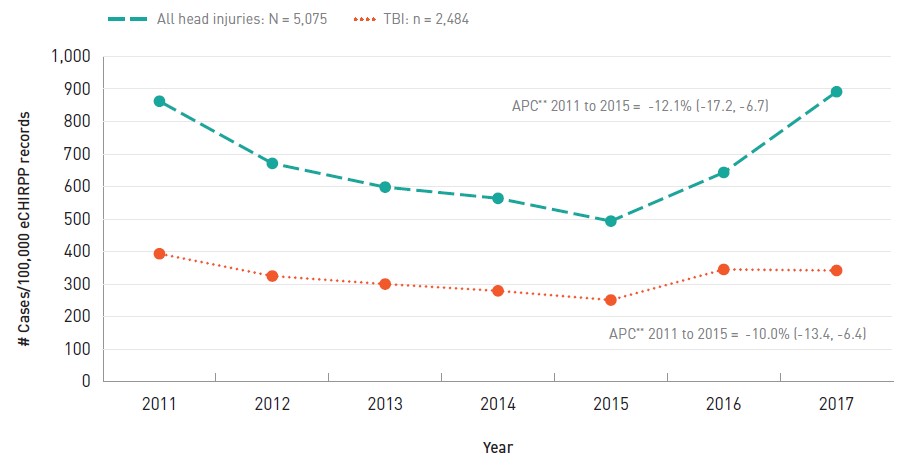
- Figure 16.1 Footnote a
-
Proportions are expressed as a normalized frequency relative to system denominators (not population denominators). As such, proportions per 100,000 records are normalized to all cases in the eCHIRPP database for the given year, on the data extraction date. See Chapter 3 for more information.
Text description
| Year | All head injuries | TBIs |
|---|---|---|
| 2011 | 862.3 | 393.4 |
| 2012 | 671.2 | 324.9 |
| 2013 | 598.2 | 300.2 |
| 2014 | 563.8 | 279.4 |
| 2015 | 493.7 | 251.1 |
| 2016 | 643.3 | 345.1 |
| 2017 | 891.4 | 342.0 |
APC: Annual percent change
|
||
Figure 16.2: NormalizedFigure 16.2 Footnote a age and sex distribution of traumatic brain injury cases associated with intentional injuries, eCHIRPP, 2011 to 2017, per 100,000 records
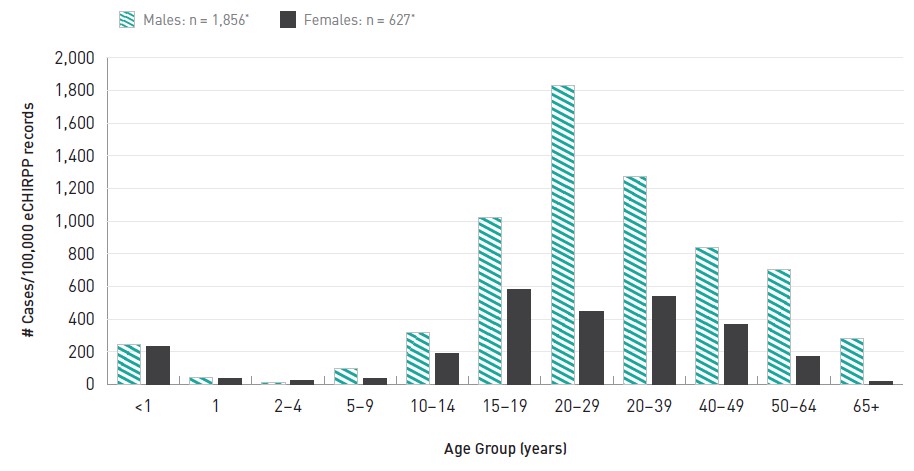
Sex information was missing in one case.
- Figure 16.2 Footnote a
-
Proportions are expressed as a normalized frequency relative to system denominators (not population denominators). As such, proportions per 100,000 records are normalized to all cases in the eCHIRPP database for the given age group and sex, on the data extraction date. See Chapter 3 for more information.
Text description
| Age Group | Males | Females |
|---|---|---|
| <1 | 243.8 | 231.1 |
| 1 | 44.6 | 39.1 |
| 2-4 | 14.6 | 24.5 |
| 5-9 | 99.9 | 36.2 |
| 10-14 | 318.9 | 190.2 |
| 15-19 | 1,021.3 | 581.8 |
| 20-29 | 1,831.9 | 445.9 |
| 20-39 | 1,274.1 | 535.6 |
| 40-49 | 836.3 | 365.7 |
| 50-64 | 703.6 | 170.4 |
| 65+ | 280.2 | 18.5 |
|
||
Table 16.1 presents the breakdown of TBI cases associated with intentional mechanisms. The majority of intentional TBI cases captured in eCHIRPP were due to an assault (91.8%) with fewer than one in ten being due to self-inflicted (5.9%) or cases of undetermined intent (2.3%). Some types of assaultive injury varied by age, for instance, abusive head trauma was frequent among babies aged 2 years or younger. Intimate partner violence was observed in adults up to 74 years of age, although there were also some children who were injured as a consequence of IPV between older individuals and included in this classification. Among cases of self-harm the concomitant use of drugs including alcohol was examined and 23.8% were associated with drugs or alcohol. Those under the influence of drugs or alcohol at the time of self-injury tended to be older (mean age 38 years) compared to those not using these substances (mean 24.5 years).
| Mechanism | # | % | Mean age (years) | |
|---|---|---|---|---|
| Assault | Total | 2,278 | 91.8 | 20.6 |
| Physical assault | 1,949 | 78.5 | 21.8 | |
| Child maltreatment | 161 | 6.5 | 5.9 | |
| Intimate partner violence | 73 | 2.9 | 27.6 | |
| Sibling abuse | 54 | 2.2 | 18.2 | |
| Bullying | 26 | 1.1 | 12.2 | |
| Abusive head trauma | 12 | 0.5 | 0.6 | |
| Sexual assault | 3 | 0.1 | 15.3 | |
| Self-harm | Total | 147 | 5.9 | 27.7 |
| Self-harm—no drugsTable 16.1 Footnote a | 112 | 4.5 | 24.5 | |
| Self-harm—with drugsTable 16.1 Footnote a | 35 | 1.4 | 38.1 | |
| Undetermined | Total | 59 | 2.3 | 30.8 |
| OtherTable 16.1 Footnote b | 27 | 1.1 | 34.0 | |
| UnknownTable 16.1 Footnote c | 32 | 1.3 | 28.1 | |
| Total | 2,484 | 100.0 | - | |
|
||||
A total of 588 intentional TBI cases were admitted to hospital (23.7% TBI or 74.0 cases/100,000 CHIRPP records). Frequency estimates suggest that cases of abusive head trauma, followed by self-harm with drugs, and child maltreatment were the three most frequent forms of TBI-related intentional injury resulting in hospital admission.
The perpetrator associated with an intentional injury, as well as the weapon used, is examined in Table 16.2. Among those cases where the perpetrator of assaultive injuries was identified, the assault was most often by a friend, a family caregiver or an intimate partner. When a weapon or the agent used to inflict the intentional injury was identified, the most frequently reported was a belt/rope or a knife. The majority of cases did not actually involve a weapon (n = 102), or involved the use of a body part (e.g. knee) to inflict injury (n = 2,110).
| Perpetrator | # | % |
|---|---|---|
| Friend | 331 | 13.3 |
| Family caregiver | 118 | 4.8 |
| Intimate Partner | 92 | 3.7 |
| Sibling | 69 | 2.8 |
| Other caregiverTable 16.2 Footnote a | 41 | 1.7 |
| Unknown or unidentified personTable 16.2 Footnote b | 1,636 | 65.9 |
| Self | 147 | 5.9 |
| No details available | 50 | 2.0 |
| Total | 2,484 | 100.0 |
| Weapon/agent | ||
| Belt or rope | 55 | 20.2 |
| Knife | 43 | 15.8 |
| Horizontal surface | 39 | 14.3 |
| Gun | 37 | 13.6 |
| Bat or bar | 35 | 12.9 |
| Bottle | 27 | 9.9 |
| Vertical surface | 22 | 8.1 |
| Glass | 14 | 5.2 |
| No weaponTable 16.2 Footnote c | 2,212 | – |
| Total | 2,484 | 100.0 |
|
||
Table 16.3 shows the location or places where the TBI occurred. When reported (n = 1,810), 21.6% were at school (in and around), 21.3% in an alley, bus stop, sidewalk or parking lot, and 18.8% in the victim's own home.
| Place of occurrence | # | % | |
|---|---|---|---|
| School (incl. university, college) | 391 | 15.7 | |
| Alley, bus stop, sidewalk, parking lot | 385 | 15.5 | |
| Own home | Total | 341 | 13.7 |
| Private home, apartment | 332 | 13.4 | |
| Cottage, Cabin | 9 | 0.3 | |
| Other private home | 142 | 5.7 | |
| Night club, bar | 135 | 5.4 | |
| Public park | 96 | 3.9 | |
| Group home, prison, detention centre | 74 | 3.0 | |
| Other place for sports and recreation | 52 | 2.1 | |
| Restaurant | 37 | 1.5 | |
| Shopping centre, mall | 37 | 1.5 | |
| Stadium, arena | 35 | 1.4 | |
| Airport, bus, train station | 25 | 1.0 | |
| Other public place | 17 | 0.7 | |
| Hospital, health care centre | 15 | 0.6 | |
| Daycare, pre-school, nursing home | 11 | 0.4 | |
| Other outdoor location | 17 | 0.7 | |
| Unknown | 674 | 27.1 | |
| Total | 2,484 | 100.0 | |
Discussion
Between 2011 and 2015, sentinel surveillance of TBI related to assault and self-harm showed a decreasing trend. From 2015 to 2017 there was an indication of an increase, but the counts are too low to provide a stable estimate of the APC. Further surveillance will indicate if this trend persists. If it does, it could be due to a number of different factors, including enhanced capture, societal changes in the acceptance of reporting these types of cases, or an inherent increase.
Young males (20 to 29 years) were the most frequent victims of assaults which is also seen in other studiesFootnote 8Footnote 254.
The majority of the cases in the current study are assault-related (91.8%). Conversely, as mentioned in the introduction, in Canada, hospitalizations for self-inflicted injuries are more than twice the frequency of those for assaultFootnote 253. A number of factors likely account for this apparently contradictory result. First, eCHIRPP is an emergency department (ED)-based surveillance system and some of the hospitalizations may not have taken the ED pathway. Also, the national data include all injuries (not just head injuries), and since many self-inflicted injuries are to body parts other than the head we would expect to see a different mix in the ED. Finally, the ED capture of self-inflicted injuries is known to be problematicFootnote 260 and that may be reflected in these results.
Young males (20 to 29 years) were the most frequent victims of assaults which is also seen in other studiesFootnote 8Footnote 254. Intimate partner violence was observed in cases up to 74 years of age, but the mean age was 27.6 years, with female victims predominating. Concussions among victims of domestic violence is an important issue as it is comparable to sport- related concussion in the sense that they may be exposed to repeated concussions/sub-concussion over timeFootnote 20Footnote 21Footnote 256.
The location of the injury event was unknown in 27.1% of cases. This proportion is higher compared to unintentional injuries (PHAC analysis, unpublished internal report). This is often the case due to the nature of intentional injuries. However, in the 1,810 cases (72.9%) where location information was available, while school was the most frequent (15.7%), there was no one place that significantly predominated; there were a number of different locations many of which were in public places. This information may be useful for prevention initiatives (particularly for schools, night clubs, malls, restaurants and bus stops).
The increased likelihood of admission to hospital relative to the number of ED visits can be an indicator of the severity of an injury. Based on this measure, this study found that abusive head trauma, self-harm, and child maltreatment were all examples of severe mechanisms of injury, although in the case of self-inflicted injury an unknown proportion of hospital admissions were for mental health reasons and not necessarily related to the severity of the physical injury.
ED capture of cases of intentional injury has always been a challenge. In the eCHIRPP database a number of studies have been undertaken recentlyFootnote 258Footnote 259Footnote 260 to delve into various aspects of this issue. In one studyFootnote 260, it was found that 71% of presenting patients agreed to give details about their injury. In the past many of these cases would have gone missing. These and future studies will help to improve ED surveillance with possible changes in administrative policies and data elements.
A number of behavioural, social, and environmental factors can give rise to violenceFootnote 262Footnote 263. The fact that most intentional injury TBI cases involved person to person contact, rather than the use of a weapon, is not surprising given the high proportion of assault cases. However, when a weapon was in use, a rope or a belt like object was the one most commonly used. Given the numerous factors that can precipitate cases of intentional injury, and the difficulties in supporting progress to reduce injury rates in this area, EDs could play an important role in prevention of such injury. Along those lines, priorities for violence prevention in this setting have been suggested and ideas for how to target high risk subgroups, such as individuals with mental illness have been providedFootnote 263Footnote 264Footnote 265Footnote 266. Continued action to address these various risk and protective factors should assist with supporting continued declines in the rates of intentional injuries, and TBI, in Canada.
Although the current focus is on unintentional TBI related to sports and recreation among youth, TBI related to intentional mechanisms also warrant attention as they can be a source of TBI and potentially result in long term consequences. ED visits for TBI associated with intentional injuries in eCHIRPP are predominantly assault-related, including child maltreatment, abusive head trauma and intimate partner violence.
Discussion and concluding remarks
This report has reviewed the most recently available surveillance information on the mortality and morbidity of traumatic brain injuries (TBI) and other head injuries over the life course by sex and external cause.
External cause of TBI varies by age, sex and severity of the injury whether minor, serious or fatal. TBI deaths of children under five years of age are most often the result of transport incidents or abusive head trauma. Falls are the most frequent reason for TBI hospitalizations and ED visits among children under 5 years of age. Among children and youth aged 5 to 19, maneuvers sports and recreational activities emerge as a leading cause of TBI-related hospitalizations and ED visits. Assaults are a leading cause of TBI hospitalizations and ED visits among males 20 to 39 years of age. From age 40 years and onward, non-SPAR-related falls take over as the predominant mechanism of TBI-related deaths, hospitalizations and ED visits, with especially high rates among those 85 years and older.
Analysis of sentinel surveillance data from CHIRPP reveals that the characteristics of individuals who sustain TBI while engaged in a range of specific activities and the circumstances of related injury events can be revealed. The activities and situations vary widely from SPAR (ice hockey, rugby, cheerleading, martial arts, ATV, tobogganing, equestrian, ringette), to locations (school, home), to products (strollers, falling televisions, grandstands) to intentional injury contexts (assaults and self-harm). The actual range of activities and situations that can potentially be explored using the CHIRPP sentinel surveillance program is interminable. One example comes from the detailed analysis of sentinel surveillance of men’s and women’s organized hockey that confirms illegal still contribute to a large proportion of all TBI, but unintentional contact is also an important factor.
The data sources used for this report have limitations which need to be recognized and used to outline improvements to TBI and head injury surveillance in the future. But more importantly, the limitations of one source may often be addressed by adding the analysis of other sources and synthesizing the collected information to obtain a much more comprehensive understanding of a specific injury problem. For example, mortality and to an extent, hospitalization data, are of limited use for studying the mild end of the TBI continuum because concussions and other minor head injuries are mostly treated in emergency departments or in non-hospital settings.
The NACRS ED data currently have only complete coverage in Ontario, Alberta and Yukon. However, if this data source is expanded across the country in the future it would enable the calculation of complete population-based rates (both regional and national) for injuries treated in emergency settings.
None of the current data sources used capture information on the many minor injuries treated in settings outside hospitals: injuries treated during physician’s office visits, by coaches or trainers, or other health professionals such as physiotherapists. Collection of information on these injuries would enhance overall understanding. This type of information could be especially useful for prevention initiatives in settings such as leagues and regulatory bodies of specific sports.
A number of surveys including the Canadian Community Health Survey (CCHS) and the Health Behaviour of School- aged Children (HBSC) could potentially add to our knowledge of brain injuries and TBI. Each cycle of the CCHS includes questions on a special theme. Should a future cycle of this survey choose a theme related to SPAR, for example, it could provide valuable information on SPAR-related head injuries.
Since SPAR-related concussions are a significant concern for children and youth, participation rates in the most popular sports would help to identify the sports and activities carrying the most risk. Injury rates calculated with participation rather than population denominators provide a more accurate measure of risk. Information on Canadian participation in sports and recreational activities by age category and sex could provide the missing denominator information needed to determine more reliable rates and track them over time.
One of the main objectives of public health is the prevention of disease, illness and injury. The public health approach uses surveillance not only to identify problems but also to identify the risk factors and help develop and evaluate prevention strategies. Injury prevention is an ongoing effort in public health and other sectors. Head injuries and TBI happen in a wide variety of settings and situations and are associated with many diverse activities. As illustrated in various chapters of this report, prevention is best addressed in the context of circumstances that result in frequent or severe head injury.
Initiatives to prevent head injuries can happen at all levels from national (or even international) down to the community level. For example, at the national level Canada has regulations and guidelines related to products used by children including the play structures found in school grounds. There is traffic safety legislation and regulation at the national, provincial/territorial levels and municipal levels. Speed limits can be an important factor in pedestrian motor vehicle collisions. Aside from governments, this report has shown the role that national and regional sports bodies can play in setting rules of play to enhance safety.
There is a role for multiple sectors and multiple professionals in the prevention of head injuries and TBI. In this report head injuries were studied in a variety of sports settings, in schools and in traffic situations. The SPAR setting is one that illustrates the involvement of multiple sectors and professionals well. The sports chapters mention recent efforts to increase awareness of concussions and to develop and implement protocols for recovery and safe return to play; these initiatives were developed by experts in medical care, sports, training and coaching, education and more. Another factor, harmonization, was important in the development of concussion protocols.
For some situations leading to head injuries, prevention can be “built in” when hazards are recognized. Safety in design applies to many children’s products including strollers and the evolution of design for televisions may have contributed to declines in head injuries due to tip overs. Design is also very relevant to safety in bleachers and grandstands. Sports equipment, especially protective equipment, is another example where design is important and safety is “built in”.
This report has shown several situations where head injuries and TBI have declined over time and these declines have been linked to prevention initiatives. However, injury rates are still high and head injuries and TBI continue to be an important public health issue. As long as frequent and serious head injuries and TBI persist, the need for effective injury surveillance in support of prevention remains.
Appendix A: Breakdown of ICD-10/ICD10-CA sports and recreation codes
| ICD-10-CA code | Description |
|---|---|
V10-V19 |
Pedal cyclist injured in transport accident |
|
V80.0Table A1 Footnote a |
Animal-rider or occupant of animal-drawn vehicle injured by fall from or being thrown from animal or animal-drawn vehicle in non-collision accident
|
V80.8Table A1 Footnote a |
Animal-rider or occupant of animal-drawn vehicle injured in collision with fixed or stationary object |
|
V80.9Table A1 Footnote a |
Animal-rider or occupant of animal-drawn vehicle injured in other and unspecified transport accidents Includes:
|
V86 (V86.0-V86.98, incl. |
Occupant of special all-terrain or other motor vehicle designed primarily for off-road use, injured in transport accident Excludes: vehicle in stationary use or maintenance (W31.-) |
|
V90.2-V90.9 |
Accident to watercraft causing drowning and submersion
|
|
V91.2-V91.9 |
Accident to watercraft causing other injury
|
|
V92.2-V92.9 |
Water-transport-related drowning and submersion without accident to watercraft
|
|
V93.2-V93.9 |
Accident on board watercraft without accident to watercraft, not causing drowning and submersion
|
|
V94.2-V94.9 |
Other and unspecified water transport accidents
|
|
V96 |
Accident to nonpowered aircraft causing injury to occupant
|
|
V97.2Table A1 Footnote c |
Other specified air transport accident
|
Other specified transport accident
|
|
|
W02 |
Fall involving skates, skis, sport boards and in-line skates
|
|
W09 |
Fall involving playground equipment
|
|
W16 |
Diving or jumping into water causing injury other than drowning or submersion
|
|
W21 |
Striking against or struck by sports equipment
|
|
W22 |
Striking against or struck by other objects
|
|
W51 |
Striking against or bumped into by another person
|
|
W67-W74Table A1 Footnote e |
Accidental drowning and submersion
|
|
X50 |
Overexertion and strenuous or repetitive movements
|
|
U99 |
Activity Note: there are numerous activity codes (U99.0-U99.0); These codes are under the category of Provisional codes for research and temporary assignment in Canada. These codes were included in the search but since they are not consistently used, they did not contribute significantly to the total counts. |
| |
Appendix B: Mortality tables (ICD-10/ICD-10-CA coded data)
E: Coefficient of variation is between 16.6% and 33.3%; interpret with caution. # Coefficient of variation is greater than 33.3%; rate is not reliable.
Abbreviations:
- SPAR:
- Sports and recreation
- LCL:
- Lower confidence limit
- UCL:
- Upper confidence limit
| Assault | Suicide | SPAR | TransportTable B1 Footnote b | FallsTable B1 Footnote b | ||||||||||||||||
|---|---|---|---|---|---|---|---|---|---|---|---|---|---|---|---|---|---|---|---|---|
| Age (years) | Count | Rate | LCL | UCL | Count | Rate | LCL | UCL | Count | Rate | LCL | UCL | Count | Rate | LCL | UCL | Count | Rate | LCL | UCL |
| < 1 | 40 | 1.43 | 1.02 | 1.95 | 0 | 0.00 | 0.00 | 0.00 | 0 | 0.00 | 0.00 | 0.00 | 20 | 0.71E | 0.44 | 1.10 | 5 | # | # | # |
| 1 | 15 | 0.54E | 0.30 | 0.88 | 0 | 0.00 | 0.00 | 0.00 | 0 | 0.00 | 0.00 | 0.00 | 35 | 1.25E | 0.87 | 1.74 | 10 | 0.36E | 0.17 | 0.66 |
| 2–4 | 30 | 0.36E | 0.24 | 0.51 | 0 | 0.00 | 0.00 | 0.00 | 15 | 0.18E | 0.10 | 0.29 | 85 | 1.01 | 0.80 | 1.25 | 10 | 0.12E | 0.06 | 0.22 |
| 5–9 | 10 | 0.07E | 0.03 | 0.13 | 0 | 0.00 | 0.00 | 0.00 | 35 | 0.24E | 0.17 | 0.34 | 95 | 0.66 | 0.53 | 0.81 | 5 | # | # | # |
| 10–14 | 10 | 0.07E | 0.03 | 0.12 | 35 | 0.23E | 0.16 | 0.32 | 90 | 0.59 | 0.47 | 0.72 | 125 | 0.81 | 0.67 | 0.96 | 5 | # | # | # |
| 15–19 | 140 | 0.83 | 0.70 | 0.97 | 380 | 2.26 | 2.04 | 2.49 | 165 | 0.98 | 0.83 | 1.13 | 1,110 | 6.61 | 6.22 | 7.00 | 50 | 0.30 | 0.22 | 0.39 |
| 20–29 | 485 | 1.38 | 1.26 | 1.51 | 885 | 2.52 | 2.36 | 2.69 | 330 | 0.94 | 0.84 | 1.04 | 2,165 | 6.18 | 5.92 | 6.44 | 200 | 0.57 | 0.49 | 0.65 |
| 30–39 | 310 | 0.88 | 0.79 | 0.98 | 915 | 2.61 | 2.44 | 2.78 | 265 | 0.76 | 0.66 | 0.85 | 1,155 | 3.29 | 3.10 | 3.48 | 220 | 0.63 | 0.54 | 0.71 |
| 40–49 | 315 | 0.81 | 0.72 | 0.90 | 1,290 | 3.34 | 3.15 | 3.52 | 275 | 0.71 | 0.63 | 0.80 | 1,145 | 2.96 | 2.79 | 3.13 | 655 | 1.69 | 1.56 | 1.82 |
| 50–64 | 310 | 0.63 | 0.56 | 0.70 | 2,155 | 4.38 | 4.19 | 4.56 | 335 | 0.68 | 0.61 | 0.75 | 1,340 | 2.72 | 2.58 | 2.87 | 2,005 | 4.07 | 3.89 | 4.25 |
| 65–74 | 80 | 0.43 | 0.34 | 0.53 | 835 | 4.44 | 4.14 | 4.74 | 125 | 0.66 | 0.55 | 0.78 | 565 | 3.01 | 2.76 | 3.25 | 1,970 | 10.48 | 10.02 | 10.94 |
| 75–84 | 45 | 0.44 | 0.32 | 0.59 | 610 | 5.98 | 5.50 | 6.45 | 110 | 1.08 | 0.88 | 1.28 | 515 | 5.05 | 4.61 | 5.48 | 3,635 | 35.63 | 34.47 | 36.79 |
| 85+ | 10 | 0.35E | 0.17 | 0.64 | 155 | 5.42 | 4.57 | 6.27 | 15 | 0.52E | 0.29 | 0.86 | 210 | 7.34 | 6.35 | 8.33 | 3,395 | 118.68 | 114.69 | 122.67 |
| Total | 1,800 | 0.72 | 0.69 | 0.75 | 7,260 | 2.90 | 2.83 | 2.96 | 1,760 | 0.70 | 0.67 | 0.74 | 8,565 | 3.42 | 3.35 | 3.49 | 12,165Table B1 Footnote c | 4.86 | 4.77 | 4.94 |
|
||||||||||||||||||||
| Age (years) | Struck by/againstTable B1 part 2 Footnote a | Other unintentionalTable B1 part 2 Footnote aTable B1 part 2 Footnote b | OtherTable B1 part 2 Footnote c | Intent undetermined | ||||||||||||
|---|---|---|---|---|---|---|---|---|---|---|---|---|---|---|---|---|
| Count | Rate | LCL | UCL | Count | Rate | LCL | UCL | Count | Rate | LCL | UCL | Count | Rate | LCL | UCL | |
| < 1 | 5 | # | # | # | 10 | 0.36E | 0.17 | 0.66 | 0 | 0.00 | 0.00 | 0.00 | 5 | # | # | # |
| 1 | 5 | # | # | # | 5 | # | # | # | 0 | 0.00 | 0.00 | 0.00 | 5 | # | # | # |
| 2–4 | 10 | 0.12E | 0.06 | 0.22 | 5 | # | # | # | 0 | 0.00 | 0.00 | 0.00 | 5 | # | # | # |
| 5–9 | 5 | # | # | # | 15 | 0.10E | 0.06 | 0.17 | 0 | 0.00 | 0.00 | 0.00 | 5 | # | # | # |
| 10–14 | 15 | 0.10E | 0.05 | 0.16 | 25 | 0.16E | 0.11 | 0.24 | 5 | # | # | # | 5 | # | # | # |
| 15–19 | 20 | 0.12E | 0.07 | 0.18 | 50 | 0.30 | 0.22 | 0.39 | 10 | 0.06E | 0.03 | 0.11 | 20 | 0.12E | 0.07 | 0.18 |
| 20–29 | 40 | 0.11 | 0.08 | 0.16 | 150 | 0.43 | 0.36 | 0.50 | 55 | 0.16 | 0.12 | 0.20 | 60 | 0.17 | 0.13 | 0.22 |
| 30–39 | 70 | 0.20 | 0.16 | 0.25 | 160 | 0.46 | 0.39 | 0.53 | 115 | 0.33 | 0.27 | 0.39 | 45 | 0.13 | 0.09 | 0.17 |
| 40–49 | 60 | 0.16 | 0.12 | 0.20 | 260 | 0.67 | 0.59 | 0.75 | 205 | 0.53 | 0.46 | 0.60 | 90 | 0.23 | 0.19 | 0.29 |
| 50–64 | 140 | 0.28 | 0.24 | 0.33 | 565 | 1.15 | 1.05 | 1.24 | 535 | 1.09 | 0.99 | 1.18 | 115 | 0.23 | 0.19 | 0.28 |
| 65–74 | 65 | 0.35 | 0.27 | 0.44 | 400 | 2.13 | 1.92 | 2.34 | 385 | 2.05 | 1.84 | 2.25 | 40 | 0.21 | 0.15 | 0.29 |
| 75–84 | 50 | 0.49 | 0.36 | 0.65 | 575 | 5.64 | 5.18 | 6.10 | 405 | 3.97 | 3.58 | 4.36 | 25 | 0.25E | 0.16 | 0.36 |
| 85+ | 10 | 0.35E | 0.17 | 0.64 | 465 | 16.25 | 14.78 | 17.73 | 185 | 6.47 | 5.54 | 7.40 | 10 | 0.35E | 0.17 | 0.64 |
| Total | 495 | 0.20 | 0.18 | 0.22 | 2,685 | 1.07 | 1.03 | 1.11 | 1,900 | 0.76 | 0.72 | 0.79 | 430 | 0.17 | 0.16 | 0.19 |
|
||||||||||||||||
| Assault | Suicide | SPAR | TransportTable B1 Footnote b | FallsTable B1 Footnote b | ||||||||||||||||
|---|---|---|---|---|---|---|---|---|---|---|---|---|---|---|---|---|---|---|---|---|
| Age (years) | Count | Rate | LCL | UCL | Count | Rate | LCL | UCL | Count | Rate | LCL | UCL | Count | Rate | LCL | UCL | Count | Rate | LCL | UCL |
| < 1 | 35 | 1.32E | 0.92 | 1.83 | 0 | 0.00 | 0.00 | 0.00 | 0 | 0 | 0 | 0 | 20 | 0.75E | 0.46 | 1.16 | 0 | 0.00 | 0.00 | 0.00 |
| 1 | 10 | 0.38E | 0.18 | 0.69 | 0 | 0.00 | 0.00 | 0.00 | 5 | # | # | # | 35 | 1.32E | 0.92 | 1.83 | 5 | # | # | # |
| 2–4 | 15 | 0.19E | 0.10 | 0.31 | 0 | 0.00 | 0.00 | 0.00 | 5 | # | # | # | 65 | 0.81 | 0.63 | 1.03 | 5 | # | # | # |
| 5–9 | 5 | # | # | # | 0 | 0.00 | 0.00 | 0.00 | 15 | 0.11E | 0.06 | 0.18 | 85 | 0.62 | 0.50 | 0.77 | 5 | # | # | # |
| 10–14 | 15 | 0.10E | 0.06 | 0.17 | 5 | # | # | # | 35 | 0.24E | 0.17 | 0.33 | 80 | 0.55 | 0.43 | 0.68 | 5 | # | # | # |
| 15–19 | 40 | 0.25 | 0.18 | 0.34 | 35 | 0.22E | 0.15 | 0.31 | 50 | 0.31 | 0.23 | 0.41 | 480 | 3.01 | 2.74 | 3.28 | 20 | 0.13E | 0.08 | 0.19 |
| 20–29 | 120 | 0.35 | 0.29 | 0.41 | 90 | 0.26 | 0.21 | 0.32 | 65 | 0.19 | 0.15 | 0.24 | 720 | 2.11 | 1.96 | 2.26 | 35 | 0.10E | 0.07 | 0.14 |
| 30–39 | 95 | 0.27 | 0.22 | 0.33 | 85 | 0.24 | 0.19 | 0.30 | 45 | 0.13 | 0.09 | 0.17 | 420 | 1.20 | 1.09 | 1.32 | 50 | 0.14 | 0.11 | 0.19 |
| 40–49 | 105 | 0.27 | 0.22 | 0.33 | 135 | 0.35 | 0.29 | 0.41 | 35 | 0.09E | 0.06 | 0.13 | 450 | 1.17 | 1.06 | 1.28 | 155 | 0.40 | 0.34 | 0.47 |
| 50–64 | 110 | 0.22 | 0.18 | 0.26 | 140 | 0.28 | 0.23 | 0.33 | 35 | 0.07E | 0.05 | 0.10 | 610 | 1.22 | 1.13 | 1.32 | 610 | 1.22 | 1.13 | 1.32 |
| 65–74 | 40 | 0.20 | 0.14 | 0.27 | 40 | 0.20 | 0.14 | 0.27 | 20 | 0.10E | 0.06 | 0.15 | 335 | 1.63 | 1.46 | 1.81 | 950 | 4.63 | 4.34 | 4.93 |
| 75–84 | 35 | 0.26E | 0.18 | 0.36 | 20 | 0.15E | 0.09 | 0.23 | 5 | # | # | # | 340 | 2.51 | 2.24 | 2.77 | 2590 | 19.10 | 18.37 | 19.84 |
| 85+ | 30 | 0.50E | 0.34 | 0.71 | 5 | # | # | # | 5 | # | # | # | 145 | 2.41 | 2.01 | 2.80 | 4210 | 69.88 | 67.76 | 71.99 |
| Total | 655 | 0.26 | 0.24 | 0.28 | 555 | 0.22 | 0.20 | 0.24 | 320 | 0.13 | 0.11 | 0.14 | 3,785 | 1.48 | 1.44 | 1.53 | 8,640 | 3.39 | 3.32 | 3.46 |
|
||||||||||||||||||||
| Age (years) | Struck by/againstTable B1 Part 2 Footnote a | Other unintentionalTable B1 Part 2 Footnote aTable B1 Part 2 Footnote b | OtherTable B1 Part 2 Footnote c | Intent undetermined | ||||||||||||
|---|---|---|---|---|---|---|---|---|---|---|---|---|---|---|---|---|
| Count | Rate | LCL | UCL | Count | Rate | LCL | UCL | Count | Rate | LCL | UCL | Count | Rate | LCL | UCL | |
| < 1 | 0 | 0 | 0 | 0 | 5 | # | # | # | 0 | 0.00 | 0.00 | 0.00 | 5 | # | # | # |
| 1 | 0 | 0 | 0 | 0 | 5 | # | # | # | 0 | 0.00 | 0.00 | 0.00 | 5 | # | # | # |
| 2–4 | 10 | 0.12E | 0.06 | 0.23 | 5 | # | # | # | 5 | # | # | # | 5 | # | # | # |
| 5–9 | 5 | # | # | # | 5 | # | # | # | 5 | # | # | # | 0 | 0.00 | 0.00 | 0.00 |
| 10–14 | 5 | # | # | # | 0 | 0.00 | 0.00 | 0.00 | 0 | 0.00 | 0.00 | 0.00 | 0 | 0.00 | 0.00 | 0.00 |
| 15–19 | 0 | 0 | 0 | 0 | 15 | 0.09E | 0.05 | 0.16 | 5 | # | # | # | 5 | # | # | # |
| 20–29 | 0 | 0 | 0 | 0 | 25 | 0.07E | 0.05 | 0.11 | 15 | 0.04E | 0.02 | 0.07 | 10 | 0.03E | 0.01 | 0.05 |
| 30–39 | 5 | # | # | # | 40 | 0.11 | 0.08 | 0.16 | 25 | 0.07E | 0.05 | 0.11 | 20 | 0.06E | 0.03 | 0.09 |
| 40–49 | 10 | 0.03E | 0.01 | 0.05 | 75 | 0.20 | 0.15 | 0.24 | 45 | 0.12 | 0.09 | 0.16 | 30 | 0.08E | 0.05 | 0.11 |
| 50–64 | 15 | 0.03E | 0.02 | 0.05 | 135 | 0.27 | 0.23 | 0.32 | 135 | 0.27 | 0.23 | 0.32 | 35 | 0.07E | 0.05 | 0.10 |
| 65–74 | 5 | # | # | # | 145 | 0.71 | 0.59 | 0.82 | 100 | 0.49 | 0.39 | 0.58 | 20 | 0.10E | 0.06 | 0.15 |
| 75–84 | 15 | 0.11E | 0.06 | 0.18 | 325 | 2.40 | 2.14 | 2.66 | 135 | 1.00 | 0.83 | 1.16 | 10 | 0.07E | 0.04 | 0.14 |
| 85+ | 5 | # | # | # | 505 | 8.38 | 7.65 | 9.11 | 185 | 3.07 | 2.63 | 3.51 | 20 | 0.33E | 0.20 | 0.51 |
| Total | 75 | 0.03 | 0.02 | 0.04 | 1,285 | 0.50 | 0.48 | 0.53 | 655 | 0.26 | 0.24 | 0.28 | 165 | 0.06 | 0.05 | 0.07 |
|
||||||||||||||||
Appendix C: Hospitalization tables (ICD-10/ICD-10-CA coded data)
All external causes by age and sex for all head injuries, traumatic brain injuries and concussions (Counts, rates, 95% CI)
# Counts between 1 and 9 (and the associated rates) are not reported. Other counts (0 or > 9) are also suppressed as required to prevent calculation by subtraction. See Chapter 2 for further detail and references.
Abbreviation:
- SPAR:
- Sports and recreation
| Age (years) | Assault | Self-harm | SPAR | TransportTable C1 Footnote b | FallsTable C1 Footnote b | Struck by / againstTable C1 Footnote b | Other unintentionalTable C1 Footnote bTable C1 Footnote c | OtherTable C1 Footnote d | Intent undetermined | |||||||||
|---|---|---|---|---|---|---|---|---|---|---|---|---|---|---|---|---|---|---|
| Count | Rate | Count | Rate | Count | Rate | Count | Rate | Count | Rate | Count | Rate | Count | Rate | Count | Rate | Count | Rate | |
| Infant | 293 | 14.64 | 0 | 0.00 | 16 | 0.80 | 61 | 3.05 | 1,907 | 95.30 | 83 | 4.15 | 218 | 10.89 | 24 | 1.20 | 12 | 0.60 |
| 1 | 51 | 2.56 | 0 | 0.00 | 35 | 1.76 | 56 | 2.81 | 619 | 31.08 | 85 | 4.27 | 60 | 3.01 | # | # | # | # |
| 2–4 | 26 | 0.44 | 0 | 0.00 | 289 | 4.86 | 268 | 4.51 | 1,261 | 21.22 | 160 | 2.69 | 80 | 1.35 | # | # | # | # |
| 5–9 | 18 | 0.18 | # | # | 1,102 | 11.06 | 402 | 4.03 | 1,125 | 11.29 | 253 | 2.54 | 81 | 0.81 | # | # | # | # |
| 10–14 | 179 | 1.70 | # | # | 2,697 | 25.54 | 680 | 6.44 | 793 | 7.51 | 225 | 2.13 | 92 | 0.87 | 13 | 0.12 | # | # |
| 15–19 | 1,825 | 15.43 | 103 | 0.87 | 2,834 | 23.97 | 3,269 | 27.64 | 930 | 7.86 | 235 | 1.99 | 245 | 2.07 | 27 | 0.23 | 24 | 0.20 |
| 20–29 | 5,681 | 22.64 | 214 | 0.85 | 3,114 | 12.41 | 6,282 | 25.04 | 2,460 | 9.80 | 544 | 2.17 | 685 | 2.73 | 98 | 0.39 | 48 | 0.19 |
| 30–39 | 3,665 | 15.14 | 161 | 0.67 | 1,947 | 8.05 | 3,361 | 13.89 | 2,414 | 9.97 | 443 | 1.83 | 645 | 2.67 | 81 | 0.33 | 28 | 0.12 |
| 40–49 | 3,111 | 11.72 | 186 | 0.70 | 1,972 | 7.43 | 3,357 | 12.64 | 4,644 | 17.49 | 528 | 1.99 | 882 | 3.32 | 109 | 0.41 | 21 | 0.08 |
| 50–64 | 2,330 | 6.51 | 244 | 0.68 | 2,617 | 7.31 | 4,745 | 13.25 | 12,979 | 36.25 | 947 | 2.64 | 1,765 | 4.93 | 211 | 0.59 | 45 | 0.13 |
| 65–74 | 371 | 2.72 | 72 | 0.53 | 983 | 7.21 | 2,047 | 15.00 | 12,102 | 88.71 | 435 | 3.19 | 1,034 | 7.58 | # | # | # | # |
| 75–84 | 146 | 1.98 | 67 | 0.91 | 537 | 7.29 | 1,661 | 22.55 | 17,078 | 231.83 | 340 | 4.62 | 937 | 12.72 | 96 | 1.30 | 12 | 0.16 |
| 85+ | 50 | 2.26 | 15 | 0.68 | 121 | 5.47 | 665 | 30.04 | 11,564 | 522.35 | 130 | 5.87 | 420 | 18.97 | # | # | # | # |
| Total | 17,746 | 10.02 | 1,071 | 0.60 | 18,264 | 10.31 | 26,854 | 15.16 | 69,876 | 39.44 | 4,408 | 2.49 | 7,144 | 4.03 | 836 | 0.47 | 216 | 0.12 |
|
||||||||||||||||||
| Age (years) | Assault | Self-harm | SPAR | TransportTable C2 Footnote b | FallsTable C2 Footnote b | Struck by / againstTable C2 Footnote b | Other unintentionalTable C2 Footnote bTable C2 Footnote c | OtherTable C2 Footnote d | Intent undetermined | |||||||||
|---|---|---|---|---|---|---|---|---|---|---|---|---|---|---|---|---|---|---|
| Count | Rate | Count | Rate | Count | Rate | Count | Rate | Count | Rate | Count | Rate | Count | Rate | Count | Rate | Count | Rate | |
| Infant | 203 | 10.69 | 0 | 0.00 | 20 | 1.05 | 37 | 1.95 | 1,462 | 76.96 | 62 | 3.26 | 121 | 6.37 | # | # | # | # |
| 1 | 49 | 2.59 | 0 | 0.00 | 21 | 1.11 | 42 | 2.22 | 548 | 28.98 | 58 | 3.07 | 51 | 2.70 | # | # | # | # |
| 2–4 | 23 | 0.41 | 0 | 0.00 | 161 | 2.85 | 166 | 2.94 | 982 | 17.41 | 118 | 2.09 | 60 | 1.06 | # | # | # | # |
| 5–9 | # | # | # | # | 597 | 6.32 | 292 | 3.09 | 658 | 6.96 | 124 | 1.31 | 53 | 0.56 | # | # | # | # |
| 10–14 | 36 | 0.36 | 11 | 0.11 | 959 | 9.58 | 498 | 4.98 | 361 | 3.61 | 85 | 0.85 | 37 | 0.37 | # | # | # | # |
| 15–19 | 174 | 1.55 | 57 | 0.51 | 805 | 7.19 | 1,825 | 16.30 | 433 | 3.87 | 97 | 0.87 | 74 | 0.66 | 27 | 0.24 | # | # |
| 20–29 | 562 | 2.30 | 81 | 0.33 | 871 | 3.56 | 2,471 | 10.11 | 703 | 2.88 | 86 | 0.35 | 133 | 0.54 | 36 | 0.15 | 18 | 0.07 |
| 30–39 | 508 | 2.09 | 50 | 0.21 | 588 | 2.41 | 1,459 | 5.99 | 785 | 3.22 | 109 | 0.45 | 135 | 0.55 | 45 | 0.18 | # | # |
| 40–49 | 447 | 1.69 | 60 | 0.23 | 641 | 2.42 | 1,595 | 6.02 | 1,670 | 6.31 | 114 | 0.43 | 223 | 0.84 | 64 | 0.24 | 11 | 0.04 |
| 50–64 | 303 | 0.84 | 68 | 0.19 | 886 | 2.44 | 2,531 | 6.98 | 5,803 | 16.00 | 211 | 0.58 | 471 | 1.30 | 148 | 0.41 | 11 | 0.03 |
| 65–74 | 79 | 0.53 | 17 | 0.11 | 295 | 1.99 | 1,393 | 9.41 | 7,493 | 50.63 | 158 | 1.07 | 331 | 2.24 | 99 | 0.67 | # | # |
| 75–84 | 49 | 0.52 | 14 | 0.15 | 89 | 0.94 | 1,299 | 13.73 | 14,449 | 152.71 | 190 | 2.01 | 419 | 4.43 | 57 | 0.60 | # | # |
| 85+ | # | # | # | # | 26 | 0.58 | 433 | 9.72 | 14,921 | 334.84 | 139 | 3.12 | 296 | 6.64 | 28 | 0.63 | # | # |
| Total | 2,460 | 1.36 | 360 | 0.20 | 5,959 | 3.30 | 14,041 | 7.79 | 50,268 | 27.87 | 1,551 | 0.86 | 2,404 | 1.33 | 534 | 0.30 | 77 | 0.04 |
|
||||||||||||||||||
| Age (years) | Assault | Self-harm | SPAR | TransportTable C3 Footnote b | FallsTable C3 Footnote b | Struck by / againstTable C3 Footnote b | Other unintentionaTable C3 Footnote bTable C3 Footnote c | OtherTable C3 Footnote d | Intent undetermined | |||||||||
|---|---|---|---|---|---|---|---|---|---|---|---|---|---|---|---|---|---|---|
| Count | Rate | Count | Rate | Count | Rate | Count | Rate | Count | Rate | Count | Rate | Count | Rate | Count | Rate | Count | Rate | |
| Infant | 381 | 19.04 | # | # | 34 | 1.70 | 86 | 4.30 | 2,739 | 136.88 | 165 | 8.25 | 382 | 19.09 | 105 | 5.25 | # | # |
| 1 | 92 | 4.62 | # | # | 58 | 2.91 | 96 | 4.82 | 1,302 | 65.37 | 185 | 9.29 | 327 | 16.42 | 11 | 0.55 | # | # |
| 2–4 | 77 | 1.30 | # | # | 481 | 8.09 | 476 | 8.01 | 2,165 | 36.44 | 405 | 6.82 | 652 | 10.97 | 19 | 0.32 | # | # |
| 5–9 | 49 | 0.49 | # | # | 1,672 | 16.78 | 685 | 6.87 | 1,634 | 16.40 | 547 | 5.49 | 608 | 6.10 | 39 | 0.39 | # | # |
| 10–14 | 371 | 3.51 | 27 | 0.26 | 3,739 | 35.41 | 1,011 | 9.57 | 1,124 | 10.64 | 403 | 3.82 | 469 | 4.44 | 31 | 0.29 | 20 | 0.19 |
| 15–19 | 5,397 | 45.64 | 223 | 1.89 | 4,303 | 36.39 | 4,784 | 40.46 | 1,520 | 12.85 | 598 | 5.06 | 894 | 7.56 | 78 | 0.66 | 62 | 0.52 |
| 20–29 | 15,653 | 62.38 | 447 | 1.78 | 4,938 | 19.68 | 9,355 | 37.28 | 3,829 | 15.26 | 1,308 | 5.21 | 2,529 | 10.08 | 232 | 0.92 | 89 | 0.35 |
| 30–39 | 8,649 | 35.74 | 356 | 1.47 | 3,127 | 12.92 | 5,230 | 21.61 | 3,802 | 15.71 | 1,025 | 4.24 | 2,104 | 8.69 | 208 | 0.86 | 70 | 0.29 |
| 40–49 | 7,029 | 26.47 | 366 | 1.38 | 3,089 | 11.63 | 5,166 | 19.46 | 7,246 | 27.29 | 1,136 | 4.28 | 2,392 | 9.01 | 284 | 1.07 | 65 | 0.24 |
| 50–64 | 4,557 | 12.73 | 458 | 1.28 | 3,667 | 10.24 | 7,146 | 19.96 | 19,603 | 54.74 | 1,694 | 4.73 | 3,600 | 10.05 | 562 | 1.57 | 92 | 0.26 |
| 65–74 | 603 | 4.42 | 128 | 0.94 | 1,283 | 9.40 | 2,875 | 21.07 | 17,984 | 131.82 | 723 | 5.30 | 1,689 | 12.38 | 402 | 2.95 | 20 | 0.15 |
| 75–84 | 253 | 3.43 | 111 | 1.51 | 719 | 9.76 | 2,338 | 31.74 | 26,403 | 358.41 | 564 | 7.66 | 1,384 | 18.79 | 275 | 3.73 | 28 | 0.38 |
| 85+ | 88 | 3.98 | 21 | 0.95 | 187 | 8.45 | 939 | 42.42 | 19,852 | 896.73 | 249 | 11.25 | 616 | 27.83 | 81 | 3.66 | 10 | 0.45 |
| Total | 43,199 | 24.38 | 2,139 | 1.21 | 27,297 | 15.41 | 40,187 | 22.68 | 109,203 | 61.64 | 9,002 | 5.08 | 17,646 | 9.96 | 2,327 | 1.31 | 504 | 0.28 |
|
||||||||||||||||||
| Age (years) | Assault | Self-harm | SPAR | TransportTable C4 Footnote b | FallsTable C4 Footnote b | Struck by / againstTable C4 Footnote b | Other unintentionalTable C4 Footnote bTable C4 Footnote c | OtherTable C4 Footnote d | Intent undetermined | |||||||||
|---|---|---|---|---|---|---|---|---|---|---|---|---|---|---|---|---|---|---|
| Count | Rate | Count | Rate | Count | Rate | Count | Rate | Count | Rate | Count | Rate | Count | Rate | Count | Rate | Count | Rate | |
| Infant | 288 | 15.16 | # | # | 29 | 1.53 | 67 | 3.53 | 2,156 | 113.49 | 125 | 6.58 | 268 | 14.11 | 84 | 4.42 | # | # |
| 1 | 81 | 4.28 | # | # | 45 | 2.38 | 77 | 4.07 | 1,063 | 56.21 | 124 | 6.56 | 224 | 11.85 | # | # | # | # |
| 2–4 | 61 | 1.08 | # | # | 275 | 4.88 | 314 | 5.57 | 1,643 | 29.14 | 250 | 4.43 | 445 | 7.89 | 36 | 0.64 | # | # |
| 5–9 | 25 | 0.26 | # | # | 881 | 9.33 | 495 | 5.24 | 981 | 10.38 | 241 | 2.55 | 375 | 3.97 | 24 | 0.25 | # | # |
| 10–14 | 104 | 1.04 | 25 | 0.25 | 1,325 | 13.24 | 732 | 7.31 | 559 | 5.58 | 172 | 1.72 | 214 | 2.14 | 28 | 0.28 | # | # |
| 15–19 | 602 | 5.38 | 142 | 1.27 | 1,185 | 10.58 | 2,775 | 24.78 | 757 | 6.76 | 182 | 1.63 | 265 | 2.37 | 84 | 0.75 | 16 | 0.14 |
| 20–29 | 1,831 | 7.49 | 166 | 0.68 | 1,338 | 5.48 | 3,849 | 15.75 | 1,411 | 5.77 | 245 | 1.00 | 484 | 1.98 | 118 | 0.48 | 27 | 0.11 |
| 30–39 | 1,552 | 6.37 | 141 | 0.58 | 894 | 3.67 | 2,353 | 9.66 | 1,540 | 6.32 | 221 | 0.91 | 485 | 1.99 | 163 | 0.67 | 21 | 0.09 |
| 40–49 | 1,241 | 4.69 | 168 | 0.63 | 952 | 3.60 | 2,480 | 9.37 | 3,063 | 11.57 | 245 | 0.93 | 628 | 2.37 | 212 | 0.80 | 28 | 0.11 |
| 50–64 | 660 | 1.82 | 183 | 0.50 | 1,206 | 3.33 | 3,772 | 10.40 | 10,208 | 28.15 | 413 | 1.14 | 1,165 | 3.21 | 444 | 1.22 | 29 | 0.08 |
| 65–74 | 145 | 0.98 | 54 | 0.36 | 390 | 2.64 | 2,016 | 13.62 | 13,401 | 90.55 | 298 | 2.01 | 687 | 4.64 | # | # | # | # |
| 75–84 | 119 | 1.26 | 33 | 0.35 | 149 | 1.57 | 1,883 | 19.90 | 27,893 | 294.80 | 377 | 3.98 | 773 | 8.17 | 206 | 2.18 | 13 | 0.14 |
| 85+ | 71 | 1.59 | 15 | 0.34 | 93 | 2.09 | 688 | 15.44 | 33,412 | 749.80 | 326 | 7.32 | 596 | 13.37 | 114 | 2.56 | 11 | 0.25 |
| Total | 6,780 | 3.76 | 929 | 0.52 | 8,762 | 4.86 | 21,501 | 11.92 | 98,087 | 54.39 | 3,219 | 1.78 | 6,609 | 3.66 | 1,799 | 1.00 | 186 | 0.10 |
|
||||||||||||||||||
| Age (years) | Assault | Self-harm | SPAR | TransportTable C5 Footnote b | FallsTable C5 Footnote b | Struck by / againstTable C5 Footnote b | Other unintentionalTable C5 Footnote bTable C5 Footnote c | OtherTable C5 Footnote d | Intent undetermined | |||||||||
|---|---|---|---|---|---|---|---|---|---|---|---|---|---|---|---|---|---|---|
| Count | Rate | Count | Rate | Count | Rate | Count | Rate | Count | Rate | Count | Rate | Count | Rate | Count | Rate | Count | Rate | |
| Infant | # | # | 0 | 0.00 | 0 | 0.00 | # | # | 141 | 7.05 | # | # | # | # | 0 | 0.00 | # | # |
| 1 | # | # | 0 | 0.00 | 14 | 0.70 | # | # | 237 | 11.90 | 34 | 1.71 | # | # | 0 | 0.00 | 0 | 0.00 |
| 2–4 | 0 | 0.00 | # | # | 131 | 2.20 | 58 | 0.98 | 583 | 9.81 | 62 | 1.04 | 16 | 0.27 | # | # | # | # |
| 5–9 | # | # | # | # | 580 | 5.82 | 111 | 1.11 | 626 | 6.28 | 141 | 1.42 | 26 | 0.26 | 0 | 0.00 | # | # |
| 10–14 | 64 | 0.61 | # | # | 1,544 | 14.62 | 208 | 1.97 | 453 | 4.29 | 122 | 1.16 | 26 | 0.25 | # | # | # | # |
| 15–19 | 272 | 2.30 | # | # | 1,258 | 10.64 | 720 | 6.09 | 312 | 2.64 | 93 | 0.79 | 42 | 0.36 | # | # | # | # |
| 20–29 | 516 | 2.06 | 11 | 0.04 | 775 | 3.09 | 1,149 | 4.58 | 394 | 1.57 | 96 | 0.38 | 67 | 0.27 | # | # | # | # |
| 30–39 | 371 | 1.53 | 10 | 0.04 | 419 | 1.73 | 648 | 2.68 | 343 | 1.42 | 84 | 0.35 | 52 | 0.21 | # | # | # | # |
| 40–49 | 293 | 1.10 | # | # | 419 | 1.58 | 698 | 2.63 | 596 | 2.24 | 98 | 0.37 | 71 | 0.27 | # | # | # | # |
| 50–64 | 198 | 0.55 | 14 | 0.04 | 499 | 1.39 | 841 | 2.35 | 1,332 | 3.72 | 139 | 0.39 | 125 | 0.35 | # | # | # | # |
| 65–74 | 24 | 0.18 | 0 | 0.00 | 173 | 1.27 | 286 | 2.10 | 908 | 6.66 | 37 | 0.27 | 33 | 0.24 | # | # | # | # |
| 75–84 | # | # | # | # | 64 | 0.87 | 200 | 2.71 | 1,013 | 13.75 | 23 | 0.31 | 18 | 0.24 | # | # | # | # |
| 85+ | # | # | 0 | 0.00 | 12 | 0.54 | 67 | 3.03 | 697 | 31.48 | # | # | # | # | # | # | 0 | 0.00 |
| Total | 1,757 | 0.99 | 55 | 0.03 | 5,888 | 3.32 | 4,998 | 2.82 | 7,635 | 4.31 | 948 | 0.54 | 488 | 0.28 | 38 | 0.02 | 19 | 0.01 |
|
||||||||||||||||||
| Age (years) | Assault | Self-harm | SPAR | TransportTable C6 Footnote b | FallsTable C6 Footnote b | Struck by / againstTable C6 Footnote b | Other unintentionalTable C6 Footnote bTable C6 Footnote c | OtherTable C6 Footnote d | Intent undetermined | |||||||||
|---|---|---|---|---|---|---|---|---|---|---|---|---|---|---|---|---|---|---|
| Count | Rate | Count | Rate | Count | Rate | Count | Rate | Count | Rate | Count | Rate | Count | Rate | Count | Rate | Count | Rate | |
| Infant | # | # | 0 | 0.00 | # | # | # | # | 129 | 6.79 | # | # | 0 | 0.00 | 0 | 0.00 | 0 | 0.00 |
| 1 | # | # | 0 | 0.00 | # | # | # | # | 214 | 11.32 | 23 | 1.22 | # | # | 0 | 0.00 | 0 | 0.00 |
| 2–4 | # | # | 0 | 0.00 | 76 | 1.35 | # | # | 460 | 8.16 | 53 | 0.94 | 11 | 0.20 | 0 | 0.00 | # | # |
| 5–9 | # | # | 0 | 0.00 | 279 | 2.95 | 83 | 0.88 | 357 | 3.78 | 62 | 0.66 | 14 | 0.15 | 0 | 0.00 | 0 | 0.00 |
| 10–14 | 18 | 0.18 | # | # | 552 | 5.51 | 170 | 1.70 | 230 | 2.30 | 55 | 0.55 | 15 | 0.15 | # | # | # | # |
| 15–19 | 49 | 0.44 | # | # | 386 | 3.45 | 478 | 4.27 | 189 | 1.69 | 59 | 0.53 | 24 | 0.21 | # | # | # | # |
| 20–29 | 86 | 0.35 | # | # | 281 | 1.15 | 487 | 1.99 | 190 | 0.78 | 34 | 0.14 | 20 | 0.08 | # | # | # | # |
| 30–39 | 107 | 0.44 | # | # | 197 | 0.81 | 331 | 1.36 | 195 | 0.80 | 43 | 0.18 | 10 | 0.04 | # | # | # | # |
| 40–49 | 61 | 0.23 | # | # | 226 | 0.85 | 324 | 1.22 | 360 | 1.36 | 49 | 0.19 | 31 | 0.12 | # | # | # | # |
| 50–64 | 41 | 0.11 | # | # | 274 | 0.76 | 513 | 1.41 | 861 | 2.37 | 54 | 0.15 | 56 | 0.15 | # | # | # | # |
| 65–74 | # | # | # | # | 63 | 0.43 | 212 | 1.43 | 888 | 6.00 | 27 | 0.18 | 14 | 0.09 | # | # | # | # |
| 75–84 | # | # | # | # | 15 | 0.16 | 158 | 1.67 | 1,333 | 14.09 | 25 | 0.26 | # | # | # | # | 0 | 0.00 |
| 85+ | # | # | 0 | 0.00 | # | # | 62 | 1.39 | 1,289 | 28.93 | # | # | # | # | # | # | 0 | 0.00 |
| Total | 381 | 0.21 | 38 | 0.02 | 2,366 | 1.31 | 2,859 | 1.59 | 6,695 | 3.71 | 505 | 0.28 | 208 | 0.12 | 16 | 0.01 | 10 | 0.01 |
|
||||||||||||||||||
Appendix D: Emergency department visit tables (ICD-10/ICD-10-CA coded data)
All external causes by age and sex for all head injuries, traumatic brain injuries and concussions (Counts, rates, 95% CI)
# Counts between 1 and 9 (and the associated rates) are not reported. Other counts (0 or > 9) are also suppressed as required to prevent calculation by subtraction. See Chapter 2 for further detail and references.
Abbreviation:
- SPAR:
- Sports and recreation
| Age (years) | Assault | Self-harm | SPAR | TransportTable D1 Footnote b | FallsTable D1 Footnote b | Struck by / againstTable D1 Footnote b | Other unintentionalTable D1 Footnote bTable D1 Footnote c | OtherTable D1 Footnote d | Intent undetermined | |||||||||
|---|---|---|---|---|---|---|---|---|---|---|---|---|---|---|---|---|---|---|
| Count | Rate | Count | Rate | Count | Rate | Count | Rate | Count | Rate | Count | Rate | Count | Rate | Count | Rate | Count | Rate | |
| Infant | 40 | 2.9 | 0 | 0.0 | 28 | 2.1 | 66 | 4.9 | 2,692 | 198.5 | 171 | 12.6 | 220 | 16.2 | # | # | # | # |
| 1 | # | # | 0 | 0.0 | 109 | 8.0 | 62 | 4.5 | 2,208 | 162.0 | 301 | 22.1 | 96 | 7.0 | 0 | 0.0 | # | # |
| 2–4 | # | # | # | # | 1,021 | 24.7 | 314 | 7.6 | 5,392 | 130.4 | 1,123 | 27.2 | 220 | 5.3 | 0 | 0.0 | # | # |
| 5–9 | 189 | 2.7 | # | # | 9,158 | 129.5 | 650 | 9.2 | 8,528 | 120.6 | 3,909 | 55.3 | 546 | 7.7 | # | # | # | # |
| 10–14 | 1,383 | 18.6 | 11 | 0.1 | 33,678 | 453.8 | 1,227 | 16.5 | 10,067 | 135.6 | 6,018 | 81.1 | 1,213 | 16.3 | 20 | 0.3 | 20 | 0.3 |
| 15–19 | 7,163 | 88.5 | 76 | 0.9 | 32,711 | 404.2 | 5,437 | 67.2 | 6,891 | 85.2 | 5,909 | 73.0 | 2,138 | 26.4 | 85 | 1.1 | 37 | 0.5 |
| 20–29 | 15,425 | 91.0 | 159 | 0.9 | 15,391 | 90.8 | 9,616 | 56.7 | 9,635 | 56.8 | 8,550 | 50.4 | 4,225 | 24.9 | 268 | 1.6 | 82 | 0.5 |
| 30–39 | 7,636 | 45.0 | 93 | 0.5 | 7,315 | 43.1 | 5,468 | 32.2 | 7,542 | 44.4 | 5,537 | 32.6 | 3,140 | 18.5 | 173 | 1.0 | 41 | 0.2 |
| 40–49 | 5,267 | 28.8 | 94 | 0.5 | 5,464 | 29.8 | 4,643 | 25.4 | 9,059 | 49.5 | 4,152 | 22.7 | 2,873 | 15.7 | 117 | 0.6 | 28 | 0.2 |
| 50–64 | 3,471 | 15.1 | 103 | 0.4 | 4,509 | 19.6 | 5,059 | 22.0 | 16,921 | 73.6 | 3,784 | 16.5 | 4,894 | 21.3 | 101 | 0.4 | 41 | 0.2 |
| 65–74 | 409 | 4.7 | 29 | 0.3 | 1,261 | 14.5 | 1,648 | 18.9 | 10,674 | 122.6 | 877 | 10.1 | 1,393 | 16.0 | 32 | 0.4 | 18 | 0.2 |
| 75–84 | 114 | 2.4 | 23 | 0.5 | 440 | 9.2 | 1,064 | 22.3 | 12,339 | 258.5 | 455 | 9.5 | 907 | 19.0 | 26 | 0.5 | 13 | 0.3 |
| 85+ | 30 | 2.2 | # | # | 108 | 7.9 | 377 | 27.6 | 7,448 | 544.4 | 127 | 9.3 | 282 | 20.6 | 10 | 0.7 | # | # |
| Total | 41,144 | 34.4 | 595 | 0.5 | 111,193 | 93.0 | 35,631 | 29.8 | 109,396 | 91.5 | 40,913 | 34.2 | 22,147 | 18.5 | 840 | 0.7 | 296 | 0.2 |
Missing age, n = 20
|
||||||||||||||||||
| Age (years) | Assault | Self-harm | SPAR | TransportTable D2 Footnote b | FallsTable D2 Footnote b | Struck by / againstTable D2 Footnote b | Other unintentionalTable D2 Footnote bTable D2 Footnote c | Otheriv | Intent undetermined | |||||||||
|---|---|---|---|---|---|---|---|---|---|---|---|---|---|---|---|---|---|---|
| Count | Rate | Count | Rate | Count | Rate | Count | Rate | Count | Rate | Count | Rate | Count | Rate | Count | Rate | Count | Rate | |
| Infant | 24 | 1.9 | 0 | 0 | 24 | 1.9 | 41 | 3.2 | 2,161 | 168.0 | 124 | 9.6 | 136 | 10.6 | 0 | 0.0 | 0 | 0 |
| 1 | # | # | 0 | 0 | 67 | 5.2 | 52 | 4.0 | 1,904 | 147.0 | 197 | 15.2 | 66 | 5.1 | 0 | 0.0 | # | # |
| 2–4 | 10 | 0.3 | 0 | 0 | 647 | 16.4 | 199 | 5.1 | 4,206 | 106.9 | 725 | 18.4 | 147 | 3.7 | # | # | # | # |
| 5–9 | 39 | 0.6 | # | # | 4,109 | 61.0 | 501 | 7.4 | 5,062 | 75.2 | 2,251 | 33.4 | 293 | 4.4 | # | # | # | # |
| 10–14 | 429 | 6.1 | 14 | 2.0 | 14,848 | 210.4 | 972 | 13.8 | 6,574 | 93.2 | 3,872 | 54.9 | 738 | 10.5 | # | # | # | # |
| 15–19 | 1,953 | 25.4 | 48 | 6.3 | 17,992 | 234.3 | 5,050 | 65.8 | 8,993 | 117.1 | 6,622 | 86.2 | 1,736 | 22.6 | 34 | 0.4 | 17 | 0.2 |
| 20–29 | 3,510 | 21.1 | 61 | 3.7 | 8,885 | 53.3 | 7,467 | 44.8 | 11,091 | 66.5 | 8,259 | 49.5 | 2,248 | 13.5 | 61 | 0.4 | 31 | 0.2 |
| 30–39 | 2,130 | 12.4 | 39 | 2.3 | 4,562 | 26.5 | 4,420 | 25.7 | 7,982 | 46.3 | 5,164 | 30.0 | 1,887 | 11.0 | 41 | 0.2 | 11 | 0.1 |
| 40–49 | 1,552 | 8.5 | 32 | 1.8 | 3,702 | 20.3 | 4,066 | 22.3 | 9,927 | 54.4 | 4,216 | 23.1 | 2,070 | 11.3 | 52 | 0.3 | 18 | 0.1 |
| 50–64 | 842 | 3.6 | 31 | 1.3 | 2,885 | 12.3 | 4,260 | 18.2 | 17,845 | 76.2 | 4,128 | 17.6 | 3,111 | 13.3 | 53 | 0.2 | 17 | 0.1 |
| 65–74 | 115 | 1.2 | # | # | 571 | 5.9 | 1,475 | 15.3 | 10,465 | 108.7 | 948 | 9.8 | 758 | 7.9 | 24 | 0.2 | # | # |
| 75–84 | 44 | 0.7 | # | # | 155 | 2.5 | 991 | 15.8 | 13,297 | 211.7 | 550 | 8.8 | 492 | 7.8 | 16 | 0.3 | # | # |
| 85+ | # | # | # | # | 38 | 1.4 | 350 | 12.6 | 11,508 | 413.1 | 236 | 8.5 | 305 | 10.9 | # | # | # | # |
| Total | 10,673 | 8.7 | 239 | 2.0 | 58,485 | 47.8 | 29,844 | 24.4 | 111,015 | 90.8 | 37,292 | 30.5 | 13,987 | 11.4 | 299 | 0.2 | 125 | 0.1 |
|
||||||||||||||||||
| Age (years) | Assault | Self-harm | SPAR | TransportTable D3 Footnote b | FallsTable D3 Footnote b | Struck by / againstTable D3 Footnote b | Other unintentionalTable D3 Footnote bTable D3 Footnote c | OtherTable D3 Footnote d | Intent undetermined | |||||||||
|---|---|---|---|---|---|---|---|---|---|---|---|---|---|---|---|---|---|---|
| Count | Rate | Count | Rate | Count | Rate | Count | Rate | Count | Rate | Count | Rate | Count | Rate | Count | Rate | Count | Rate | |
| Infant | 149 | 11.0 | 0 | 0 | 616 | 45.4 | 527 | 38.9 | 46,302 | 3,413.4 | 7,975 | 587.9 | 4,819 | 355.3 | 22 | 1.6 | 52 | 3.8 |
| 1 | 142 | 10.4 | # | # | 2,859 | 209.7 | 805 | 59.1 | 80,223 | 5,884.7 | 26,333 | 1,931.6 | 12,908 | 946.9 | # | # | 109 | 8.0 |
| 2–4 | 374 | 9.0 | # | # | 22,690 | 548.7 | 3,512 | 84.9 | 159,652 | 3,860.9 | 79,769 | 1,929.1 | 35,670 | 862.6 | # | # | 311 | 7.5 |
| 5–9 | 1,579 | 22.3 | 33 | 0.5 | 74,848 | 1,058.4 | 5,321 | 75.2 | 101,245 | 1,431.7 | 86,467 | 1,222.7 | 35,194 | 497.7 | 158 | 2.2 | 330 | 4.7 |
| 10–14 | 10,263 | 138.3 | 112 | 1.5 | 117,506 | 1,583.3 | 5,054 | 68.1 | 45,468 | 612.6 | 49,481 | 666.7 | 23,371 | 314.9 | 130 | 1.8 | 287 | 3.9 |
| 15–19 | 66,273 | 819.0 | 536 | 6.6 | 119,489 | 1,476.6 | 19,516 | 241.2 | 33,877 | 418.6 | 47,349 | 585.1 | 37,252 | 460.3 | 821 | 10.1 | 572 | 7.1 |
| 20–29 | 130,526 | 770.1 | 1,223 | 7.2 | 104,900 | 618.9 | 36,081 | 212.9 | 58,876 | 347.4 | 85,847 | 506.5 | 100,912 | 595.4 | 2,533 | 14.9 | 1,252 | 7.4 |
| 30–39 | 58,273 | 343.1 | 713 | 4.2 | 57,209 | 336.8 | 20,895 | 123.0 | 44,504 | 262.0 | 65,901 | 388.0 | 85,925 | 505.9 | 1,829 | 10.8 | 839 | 4.9 |
| 40–49 | 41,059 | 224.2 | 564 | 3.1 | 38,062 | 207.8 | 18,213 | 99.5 | 56,218 | 307.0 | 59,020 | 322.3 | 80,221 | 438.1 | 1,489 | 8.1 | 729 | 4.0 |
| 50–64 | 25,302 | 110.1 | 461 | 2.0 | 25,071 | 109.1 | 19,670 | 85.6 | 99,939 | 434.9 | 56,566 | 246.1 | 80,089 | 348.5 | 1,184 | 5.2 | 649 | 2.8 |
| 65–74 | 2,752 | 31.6 | 83 | 1.0 | 5,676 | 65.2 | 6,427 | 73.8 | 65,476 | 752.3 | 14,443 | 165.9 | 21,614 | 248.3 | 567 | 6.5 | 200 | 2.3 |
| 75–84 | 868 | 18.2 | 67 | 1.4 | 2,312 | 48.4 | 4,315 | 90.4 | 82,303 | 1,724.2 | 6,831 | 143.1 | 10,874 | 227.8 | 496 | 10.4 | 123 | 2.6 |
| 85+ | 325 | 23.8 | 27 | 2.0 | 572 | 41.8 | 1,535 | 112.2 | 57,648 | 4,213.5 | 2,572 | 188.0 | 3,462 | 253.0 | 209 | 15.3 | 43 | 3.1 |
| Total | 337,885 | 282.7 | 3,833 | 3.2 | 571,810 | 478.4 | 141,871 | 118.7 | 931,731 | 779.6 | 588,554 | 492.5 | 532,311 | 445.4 | 9,551 | 8.0 | 5,496 | 4.6 |
Missing age, n = 97
|
||||||||||||||||||
| Age (years) | Assault | Self-harm | SPAR | TransportTable D4 Footnote b | FallsTable D4 Footnote b | Struck by / againstTable D4 Footnote b | Other unintentionalTable D4 Footnote bTable D4 Footnote c | OtherTable D4 Footnote d | Intent undetermined | |||||||||
|---|---|---|---|---|---|---|---|---|---|---|---|---|---|---|---|---|---|---|
| Count | Rate | Count | Rate | Count | Rate | Count | Rate | Count | Rate | Count | Rate | Count | Rate | Count | Rate | Count | Rate | |
| Infant | 108 | 8.4 | 0 | 0.0 | 531 | 41.3 | 453 | 35.2 | 39,546 | 3,074.0 | 6,249 | 485.7 | 4,289 | 333.4 | # | # | 21 | 1.6 |
| 1 | 117 | 9.0 | # | # | 1,827 | 141.1 | 664 | 51.3 | 57,693 | 4,455.0 | 15,352 | 1,185.5 | 9,780 | 755.2 | # | # | 75 | 5.8 |
| 2–4 | 218 | 5.5 | # | # | 12,023 | 305.5 | 2,630 | 66.8 | 104,752 | 2,661.8 | 42,237 | 1,073.3 | 26,546 | 674.5 | 68 | 1.7 | 208 | 5.3 |
| 5–9 | 513 | 7.6 | # | # | 33,263 | 493.8 | 4,115 | 61.1 | 60,127 | 892.7 | 40,697 | 604.2 | 27,597 | 409.7 | # | # | 167 | 2.5 |
| 10–14 | 3,466 | 49.1 | 113 | 16.0 | 46,135 | 653.8 | 4,521 | 64.1 | 25,819 | 365.9 | 23,518 | 333.3 | 16,038 | 227.3 | 97 | 1.4 | 120 | 1.7 |
| 15–19 | 17,270 | 224.9 | 407 | 53.0 | 45,831 | 596.8 | 17,721 | 230.8 | 29,668 | 386.3 | 26,718 | 347.9 | 22,140 | 288.3 | 239 | 3.1 | 246 | 3.2 |
| 20–29 | 33,799 | 202.8 | 536 | 32.2 | 30,966 | 185.8 | 27,390 | 164.3 | 47,041 | 282.2 | 42,234 | 253.4 | 42,846 | 257.0 | 545 | 3.3 | 388 | 2.3 |
| 30–39 | 21,454 | 124.5 | 333 | 19.3 | 17,828 | 103.5 | 16,414 | 95.3 | 38,057 | 220.9 | 34,223 | 198.7 | 36,261 | 210.5 | 435 | 2.5 | 283 | 1.6 |
| 40–49 | 14,873 | 81.5 | 290 | 15.9 | 14,264 | 78.1 | 15,337 | 84.0 | 52,606 | 288.2 | 31,216 | 171.0 | 37,428 | 205.0 | 447 | 2.4 | 291 | 1.6 |
| 50–64 | 7,489 | 32.0 | 195 | 8.3 | 11,233 | 47.9 | 16,844 | 71.9 | 110,716 | 472.6 | 33,558 | 143.2 | 45,827 | 195.6 | 690 | 2.9 | 322 | 1.4 |
| 65–74 | 999 | 10.4 | 45 | 4.7 | 2,720 | 28.3 | 6,263 | 65.0 | 81,147 | 842.8 | 10,353 | 107.5 | 14,195 | 147.4 | 552 | 5.7 | 125 | 1.3 |
| 75–84 | 608 | 9.7 | 26 | 4.1 | 1,287 | 20.5 | 4,822 | 76.8 | 122,038 | 1,943.1 | 7,811 | 124.4 | 8,685 | 138.3 | 589 | 9.4 | 91 | 1.4 |
| 85+ | 307 | 11.0 | 11 | 3.9 | 589 | 21.1 | 1,798 | 64.5 | 119,777 | 4,299.1 | 4,621 | 165.9 | 4,694 | 168.5 | 259 | 9.3 | 61 | 2.2 |
| Total | 101,221 | 82.8 | 1,966 | 16.1 | 218,497 | 178.7 | 118,972 | 97.3 | 888,987 | 727.1 | 318,787 | 260.7 | 296,326 | 242.4 | 4,043 | 3.3 | 2,398 | 2.0 |
|
||||||||||||||||||
| Age (years) | Assault | Self-harm | SPAR | TransportTable D5 Footnote b | FallsTable D5 Footnote b | Struck by / againstTable D5 Footnote b | Other unintentionalTable D5 Footnote bTable D5 Footnote c | OtherTable D5 Footnote d | Intent undetermined | |||||||||
|---|---|---|---|---|---|---|---|---|---|---|---|---|---|---|---|---|---|---|
| Count | Rate | Count | Rate | Count | Rate | Count | Rate | Count | Rate | Count | Rate | Count | Rate | Count | Rate | Count | Rate | |
| Infant | # | # | 0 | 0 | 12 | 0.9 | 14 | 1.0 | 688 | 50.7 | 51 | 3.8 | 11 | 0.81 | 0 | 0.0 | # | # |
| 1 | 0 | 0.0 | 0 | 0 | 83 | 6.1 | 25 | 1.8 | 1,510 | 110.8 | 188 | 13.8 | 30 | 2.2 | 0 | 0.0 | # | # |
| 2–4 | # | # | # | # | 799 | 19.3 | 148 | 3.6 | 4,199 | 101.5 | 912 | 22.1 | 110 | 2.7 | 0 | 0.0 | # | # |
| 5–9 | 168 | 2.4 | 0 | 0.0 | 8,310 | 117.5 | 417 | 5.9 | 7,617 | 107.7 | 3,562 | 50.4 | 429 | 6.1 | # | # | # | # |
| 10–14 | 1,156 | 15.6 | # | # | 31,621 | 426.1 | 892 | 12.0 | 9,391 | 126.5 | 5,630 | 75.9 | 1,060 | 14.3 | 18 | 0.2 | 17 | 0.2 |
| 15–19 | 4,431 | 54.8 | 28 | 0.3 | 30,209 | 373.3 | 3,768 | 46.6 | 6,039 | 74.6 | 5,375 | 66.4 | 1,625 | 20.1 | 62 | 0.8 | 22 | 0.3 |
| 20–29 | 7,158 | 42.2 | 48 | 0.3 | 12,113 | 71.5 | 6,400 | 37.8 | 7,281 | 43.0 | 7,318 | 43.2 | 1,853 | 10.9 | 154 | 0.9 | 35 | 0.2 |
| 30–39 | 3,196 | 18.8 | 18 | 0.1 | 5,383 | 31.7 | 3,663 | 21.6 | 5,318 | 31.3 | 4,655 | 27.4 | 1,074 | 6.3 | 97 | 0.6 | 21 | 0.1 |
| 40–49 | 1,990 | 10.9 | 16 | 0.1 | 3,718 | 20.3 | 2,931 | 16.0 | 5,555 | 30.3 | 3,340 | 18.2 | 852 | 4.7 | 56 | 0.3 | # | # |
| 50–64 | 1,172 | 5.1 | # | # | 2,747 | 12.0 | 2,824 | 12.3 | 8,351 | 36.3 | 2,844 | 12.4 | 799 | 3.5 | 43 | 0.2 | # | # |
| 65–74 | 118 | 1.4 | # | # | 630 | 7.2 | 602 | 6.9 | 3,503 | 40.2 | 480 | 5.5 | 183 | 2.1 | # | # | 0 | 0.0 |
| 75–84 | 22 | 0.5 | 0 | 0.0 | 179 | 3.8 | 270 | 5.7 | 2,424 | 50.8 | 182 | 3.8 | 105 | 2.2 | # | # | # | # |
| 85+ | # | # | 0 | 0.0 | 29 | 2.1 | 72 | 5.3 | 1,059 | 77.4 | 38 | 2.8 | 15 | 1.10 | # | # | 0 | 0.0 |
| Total | 19,422 | 16.3 | 122 | 0.1 | 95,833 | 80.2 | 22,026 | 18.4 | 62,935 | 52.7 | 34,575 | 28.9 | 8,146 | 6.8 | 440 | 0.4 | 124 | 0.1 |
Missing age, n = 4
|
||||||||||||||||||
| Age (years) | Assault | Self-harm | SPAR | TransportTable D6 Footnote b | FallsTable D6 Footnote b | Struck by / againstTable D6 Footnote b | Other unintentionalTable D6 Footnote bTable D6 Footnote c | OtherTable D6 Footnote d | Intent undetermined | |||||||||
|---|---|---|---|---|---|---|---|---|---|---|---|---|---|---|---|---|---|---|
| Count | Rate | Count | Rate | Count | Rate | Count | Rate | Count | Rate | Count | Rate | Count | Rate | Count | Rate | Count | Rate | |
| Infant | # | # | 0 | 0.0 | # | # | # | # | 604 | 47.0 | 46 | 3.6 | 17 | 1.3 | 0 | 0 | 0 | 0.0 |
| 1 | 0 | 0.0 | 0 | 0.0 | 54 | 4.2 | # | # | 1,334 | 103.0 | 147 | 11.4 | 16 | 1.2 | 0 | 0 | # | # |
| 2–4 | # | # | 0 | 0.0 | 524 | 13.3 | 96 | 2.4 | 3,342 | 84.9 | 581 | 14.8 | 80 | 2.0 | # | # | # | # |
| 5–9 | 30 | 0.4 | 0 | 0.0 | 3,620 | 53.7 | 334 | 5.0 | 4,566 | 67.8 | 2,052 | 30.5 | 233 | 3.5 | # | # | # | # |
| 10–14 | 373 | 5.3 | # | # | 14,096 | 199.7 | 720 | 10.2 | 6,248 | 88.5 | 3,707 | 52.5 | 675 | 9.6 | # | # | # | # |
| 15–19 | 1,654 | 21.5 | 30 | 3.9 | 17,124 | 223.0 | 4,135 | 53.8 | 8,460 | 110.2 | 6,359 | 82.8 | 1,349 | 17.6 | 28 | 0.4 | 13 | 0.17 |
| 20–29 | 2,594 | 15.6 | 19 | 1.1 | 7,951 | 47.7 | 6,073 | 36.4 | 10,015 | 60.1 | 7,821 | 46.9 | 1,457 | 8.7 | 41 | 0.2 | 21 | 0.13 |
| 30–39 | 1,503 | 8.7 | 13 | 0.8 | 3,920 | 22.8 | 3,570 | 20.7 | 6,975 | 40.5 | 4,812 | 27.9 | 873 | 5.1 | # | # | # | # |
| 40–49 | 997 | 5.5 | # | # | 3,065 | 16.8 | 3,139 | 17.2 | 8,337 | 45.7 | 3,898 | 21.4 | 790 | 4.3 | 30 | 0.2 | 13 | 0.07 |
| 50–64 | 527 | 2.2 | # | # | 2,209 | 9.4 | 2,911 | 12.4 | 12,784 | 54.6 | 3,738 | 16.0 | 813 | 3.5 | 25 | 0.1 | # | # |
| 65–74 | 55 | 0.6 | # | # | 370 | 3.8 | 672 | 7.0 | 5,089 | 52.9 | 766 | 8.0 | 208 | 2.2 | # | # | # | # |
| 75–84 | 11 | 0.2 | 0 | 0.0 | 75 | 1.2 | 311 | 5.0 | 3,829 | 61.0 | 347 | 5.5 | 100 | 1.6 | # | # | # | # |
| 85+ | # | # | # | # | # | # | 96 | 3.4 | 2,137 | 76.7 | 100 | 3.6 | 48 | 1.7 | # | # | # | # |
| Total | 7,755 | 6.3 | 86 | 0.7 | 53,027 | 43.4 | 22,088 | 18.1 | 73,720 | 60.3 | 34,374 | 28.1 | 6,659 | 5.4 | 173 | 0.1 | 71 | 0.1 |
|
||||||||||||||||||
References
- Footnote 1
-
Public Health Agency of Canada. Child and Youth Injury in Review, 2009 Edition: Spotlight on Consumer Product Safety. Ottawa, ON: Public Health Agency of Canada; 2009.
- Footnote 2
-
Public Health Agency of Canada, Injury in Review, 2012 Edition: Spotlight on Road and Transport Safety. Ottawa, ON: Public Health Agency of Canada; 2012.
- Footnote 3
-
Public Health Agency of Canada (PHAC). PHAC analysis of 2016 data from the Canadian Vital Statistics: Deaths Database of Statistics Canada. Unpublished internal report; 2019.
- Footnote 4
-
Public Health Agency of Canada (PHAC). PHAC analysis of 2017/18 data from the Discharge Abstract Database of the Canadian Institute for Health Information. Unpublished internal report; 2019.
- Footnote 5
-
Parachute. The Cost of Injury in Canada [Internet]. Toronto, ON: Parachute; 2015 [cited 2017 Dec 4]. Available from: www.parachutecanada.org/downloads/research/Cost_of_Injury-2015.pdf
- Footnote 6
-
Centers for Disease Control and Prevention. Report to Congress: The management of traumatic brain injuries in children. Opportunities for action. Atlanta, GA: National Center for Injury Prevention and Control; Division of Unintentional Injury Prevention; 2018.
- Footnote 7
-
Tator CH. Concussions and their consequences: current diagnosis, management and prevention. CMAJ. 2013;185(11):175–9.
- Footnote 8
-
Taylor CA, Bell JM, Breiding MJ, Xu L. Traumatic brain injury-related emergency department visits, hospitalizations, and deaths—United States, 2007 and 2013. MMWR Surveill Summ. 2017;66(9):1–16.
- Footnote 9
-
Belanger HG, Vanderploeg RD, McAllister T. Subconcussive blows to the head: a formative review of short-term clinical outcomes. J Head Trauma Rehabil. 2016;31(3):159–66.
- Footnote 10
-
Guskiewicz KM , Mihalik JP. Biomechanics of sport concussion: quest for the elusive injury threshold. Exerc Sport Sci Rev. 2011;39(1):4–11.
- Footnote 11
-
Roozenbeek B, Maas AIR, Menon DK. Changing patterns in the epidemiology of traumatic brain injury. Nat Rev Neuro. 2013;9:231–6.
- Footnote 12
-
McCrory P, Meeuwisse W, Dvorak J, Aubry M, Bailes J, Broglio S, et al. Consensus statement on concussion in sport—the 5th international conference on concussion in sport held in Berlin, October 2016. Br J Sports Med. 2017;51(11):838–47.
- Footnote 13
-
Bailes JE, Petraglia AL, Omalu BI, Nauman E, Talavage T. Role of subconcussion in repetitive mild traumatic brain injury. J Neurosurg. 2013;119(5):1235–45.
- Footnote 14
-
Tagge CA, Fisher AM, Minaeva OV, Gaudreau-Balderrama A, Moncaster JA, Zhang XL et al. Concussion, microvascular injury, and early tauopathy in young athletes after impact head injury and an impact concussion mouse model. Brain. 2018;141(2):422–58.
- Footnote 15
-
Alosco ML, Mez J, Tripodis Y, Kiernan PT, Abdolmohammadi B, Murphy L, et al. Age of first exposure to tackle football and chronic traumatic encephalopathy. Ann Neurol. 2018;83(5):886–901.
- Footnote 16
-
Broglio SP, Eckner JT, Martini D. Sosoff JJ, Kutcher JS, Randolph C. Cumulative head impact burden in high school football. J Neurotrauma. 2011;28(10):2069–78.
- Footnote 17
-
Wilcox BJ, Beckwith JG, Greenwald RM, Chu JJ, McAllister TW, Flashman LA et al. Head impact exposure in male and female collegiate ice hockey players. J Biomech. 2014;47(1):109–14.
- Footnote 18
-
Hsieh KL-C, Zimmerman RA, Kao HW, Chen C-Y. Revisiting neuroimaging of abusive head trauma in infants and young children. Am J Roentgenol. 2015;204(5):944–52.
- Footnote 19
-
Prins ML and Giza CC. Repeat traumatic brain injury in the developing brain. Int. J. Dev Neuroscience. 2012;30(3):185–90.
- Footnote 20
-
Corrigan JD, Wolfe M, Mysiw WJ, Jackson RD, Bogner JA. Early identification of mild traumatic brain injury in female victims of domestic violence. Am J Obstet Gynecol. 2003;188(5):S71–76.
- Footnote 21
-
Murray CE, Lundren K, Olson LN, Hunnicutt G. Practice update: What professionals who are not brain injury specialists need to know about intimate partner violence-related traumatic brain injury. Trauma Violence Abuse. 2016;17(3):298–305.
- Footnote 22
-
Omalu B, Hammers JL, Bailes J, Hamilton RL, Kamboh MH, Webster G, et al. Chronic traumatic encephalopathy in an Iraqi war veteran with posttraumatic stress disorder who committed suicide. Neurosurg Focus. 2011;31(5):E3.
- Footnote 23
-
Ferguson PL, Pickelsimer EE, Corrigan JD, Bogner JA, Wald M. Prevalence of traumatic brain injury among prisoners in South Carolina. J Head Trauma Rehabil. 2012;27(3):E11–20.
- Footnote 24
-
Graham R, Rivara FP, Ford MA, Spicer CM, editors. Sports-related concussions in youth. improving the science, changing the culture. Washington, D.C.: The National Academies Press; 2014.
- Footnote 25
-
McGuire C, Kristman VL, Martin L, Bedard M. Characteristics and incidence of traumatic brain injury in older adults using home care in Ontario from 2003–2013. Can Geriatr J. 2017;20(1):2–9.
- Footnote 26
-
Faul M, Xu L, Wald MM, Coronado V. Traumatic brain injuries in the United States: emergency department visits, hospitalizations and deaths, 2002–2006. Atlanta, GA: Centers for Disease Control and Prevention, National Center for Injury Prevention and Control; 2010.
- Footnote 27
-
Loyd AM, Nightingale RW, Luck JF, Song Y, Fronheiser L, Cutcliffe H, et al. The compressive stiffness of human pediatric heads. J Biomech. 2015;48:3766–75.
- Footnote 28
-
Taylor AM, Blackwell LS. Cumulative effects of concussion/chronic traumatic encephalopathy. In: O’Brien M, Meehan III WP, editors. Head and neck injuries in young athletes, contemporary pediatric and adolescent sports medicine. Switzerland: Springer International Publishing; 2016. doi: 10.1007/978-3-319-23549-3_6.
- Footnote 29
-
Guskiewicz KM, McCrea M, Marshall SW, Cantu RC, Randolph C, Barr W, et al. Cumulative effects associated with recurrent concussion in collegiate football players. The NCAA concussion Study. JAMA. 2003;290(19):2549–55.
- Footnote 30
-
McKee AC, Cantu RC, Nowinski CJ, Hedley-Whyte ET, Gavette BE, Budson AE, et al. Chronic traumatic encephalopathy in athletes: progressive tauopathy after repetitive head injury. J Neuropathol Exp Neurol. 2009;68(7):709–35.
- Footnote 31
-
Guskiewicz KM, Marshall SW, Bailes J, McCrea M, Cantu RC, Randolph C, et al. Association between recurrent concussion and late-life cognitive impairment in retired professional football players. Neurosurgery. 2005;57(4):719–26.
- Footnote 32
-
Parachute. Canadian Guideline on Concussion in Sport [Internet].Toronto, ON: Parachute; 2017 [cited 2018 Jul 30]. Available from: www.parachutecanada.org/injury-topics/item/canadian-guideline-on-concussion-in-sport
- Footnote 33
-
Damji F, Babul S. Improving and standardizing concussion education and care: a Canadian experience. Concussion [Internet]. 2018 [cited 5 Feb 2019];3(4):[7 p.]. Available from: www.futuremedicine.com/doi/pdf/10.2217/cnc-2018-0007
- Footnote 34
-
McLendon LA, Kralik SF, Grayson PA, Golomb MR. The controversial second impact syndrome: a review of the literature. Pediatr Neurol. 2016 Sep;62(3):9–17. doi: 10.1016/j.pediatrneurol.2016.03.009.
- Footnote 35
-
Office of the Chief Coroner (Ontario). Verdict of Coroner’s Jury, Office of the Chief Coroner, The Coroners Act – Province of Ontario. Inquest into the death of Rowan Stringer, May-June 2015.
- Footnote 36
-
Rowan’s Law Advisory Committee Act, 2016, ON. [Internet]. c2016 [cited 8 Mar 2018]. Available from: www.ola.org/en/legislative-business/bills/parliament-41/session-1/bill-149
- Footnote 37
-
Government of Ontario [Internet]. Ministry of Tourism, Culture and Sport; [updated 2018 Jan 31]. Ontario passes ground- breaking legislation to protect amateur athletes; [updated 2018 Mar 6; cited 2018 Mar 6]; [about two screens]. Available from: https://news.ontario.ca/mtc/en/2018/03/ontario-passes-ground-breaking-legislation-to-protect-amateur-athletes.html
- Footnote 38
-
CBC News [Internet]. Rowan Stringer inquest jury releases 49 recommendations after rugby death; [updated 2015 Nov 25]. Ottawa, ON: CBC News; c2018 [cited 2018 Nov 7]. Available from: www.cbc.ca/news/canada/ottawa/ rowan-stringer-inquest-jury-releases-49-recommendations-after-rugby-death-1.3095273
- Footnote 39
-
Rowan’s Law (Concussion Safety), 2018, S.O. 2018, c. 1 - Bill 193 (March 7, 2018)
- Footnote 40
-
Rajabali F, Turcotte K, Pike I, Babul S. Concussion among children and youth in British Columbia: an update. Vancouver, BC: BC Injury Research and Prevention Unit; 2016.
- Footnote 41
-
Johnson LSM. Concussion in youth ice hockey: it’s time to break the cycle. CMAJ. 2011 May 17;183(8):921–4. doi:10.1503/cmaj.110282.
- Footnote 42
-
Benson BW, Meeuwisse WH, Rizos J, Kang J, Burke CJ. A prospective study of concussions among National Hockey League players during regular season games: the NHL-NHLPA concussion program. CMAJ. 2011;183 (8):905–11.
- Footnote 43
-
McKee AC, Stein TD, Nowinski CJ, Stein TD, Alvarez VE, Daneshav DH, et al. The spectrum of disease in chronic traumatic encephalopathy. Brain. 2013;136(Pt 1):43–64.
- Footnote 44
-
Omalu B, Bailes J, Hamilton RL, Kamboh MI, Hammers J, Case M, et al. Emerging histomorphologic phenotypes of chronic traumatic encephalopathy in American athletes. Neurosurgery. 2011;69(1):173–83.
- Footnote 45
-
Gilchrist J, Thomas KE, Xu L, McGuire LC, Coronado V. Non-fatal traumatic brain injuries related to sports and recreation activities among persons ≤19 years, United States, 2001–2009. MMWR Morb Mort Wkly Rep. 2011;60(39):1337–42.
- Footnote 46
-
Yue JK, Winkler EA, Burke JF, Chan AK, Dhall SS, Berger MS, et al. Pediatric sports-related traumatic brain injury in United States trauma centers. Neurosurg Focus. 2016;40(4):1–12.
- Footnote 47
-
Ashare A, Ziejewski M, editors. The mechanism of concussion in sports. Selected technical papers, STP 1552. Pennsylvania: ASTM International; 2014.
- Footnote 48
-
Krolikowski MP, Black AM, Palacios-Derflingher LP, Blake TA, Schneider KJ, Emery CA. The effect of the “Zero Tolerance for Head Contact” rule change on the risk of concussions in youth ice hockey players. Am J Sports Med. 2017;45(2):468–73.
- Footnote 49
-
Eisenberg MA, Meehan WP III, Mannix R. Duration and course of postconcussive symptoms. Pediatrics. 2014;133(6):999–1006.
- Footnote 50
-
Zemek R, Barrowman N, Freedman SB, Gravel J, Gagnon I, McGahern C, et al. Clinical risk score for persistent postconcussion symptoms among children with acute concussion in the ED. JAMA. 2016;315(10):1014–25.
- Footnote 51
-
Babcock L, Kurowski BG. Identifying children and adolescents at risk for persistent postconcussion symptoms. JAMA. 2016;315(10):987–8.
- Footnote 52
-
Comstock RD, Logan K. Epidemiology and prevention. In: Kirkwood MW and Yeates KO, editors. Mild traumatic brain injury in children and adolescents. From basic science to clinical management. New York: The Guilford Press; 2012. p. 22–37.
- Footnote 53
-
Wilcox BJ, Beckwith JG, Greenwald RM, Raukar NP, Chu JJ, McAllister TW, et al. Biomechanics of head impacts associated with diagnosed concussion in female collegiate ice hockey players. J Biomech. 2015;48(10):2201–4.
- Footnote 54
-
Forward KE, Seabrook JA, Lynch T, Lim R, Poonai N, Sangha GS. A comparison of the epidemiology of ice hockey injuries between male and female youth in Canada. Paediatr Child Health. 2014;19(8):418–22.
- Footnote 55
-
Tierney RT, Sitler MR, Swanik CB, Sanik KA, Higgins M, Torg J. Gender differences in head-neck segment dynamic stabilization during head acceleration. Med Sci Sports Exerc. 2005;37(2):272–9.
- Footnote 56
-
Covassin T, Moran R. Elbin RJ. Sex differences in reported concussion injury rates and time loss from participation: an update of the National Collegiate Athletic Association injury surveillance program from 2004–2005 through 2008–2009. J Athl Train. 2016;51(3):189–94.
- Footnote 57
-
Kleiven S, von Holst H. Consequences of head size following trauma to the human head. J Biomech. 2002;35(2):153–60.
- Footnote 58
-
Rao DP, McFaull S, Thompson W, Jayaraman GC. Trends in self-reported traumatic brain injury among Canadians, 2005–2014: a repeated cross-sectional analysis [Internet]. CMAJ Open. 2017;5(2):E301–7. doi:10.9778/cmajo.20160115.
- Footnote 59
-
Keays G, Gagnon I, Friedman D. Ringette-related injuries in young female players. Clin J Sport Med. 2014;24(4):326–30.
- Footnote 60
-
Black AM, Sergio LE, Macpherson AK. The epidemiology of concussions: number and nature of concussions and time to recovery among female and male Canadian varsity athletes 2008 to 2011. Clin J Sport Med. 2017;27(1):52–6.
- Footnote 61
-
Government of Canada. Working Group on Gender Equity in Sport of the Minister of Science and Sport [Internet]. Ottawa: Government of Canada; 2019; [about two screens]. Available from: www.canada.ca/en/canadian-heritage/services/ working-group-gender-equity.html
- Footnote 62
-
Government of Canada. Sport Participation 2010: Research Paper [Internet]. Ottawa: Government of Canada; 2013. Available from: http://publications.gc.ca/collections/collection_2013/pc-ch/CH24-1-2012-eng.pdf
- Footnote 63
-
World Health Organization. International Statistical Classification of Diseases and Related Health problems, 10th rev., Volume 1. Geneva: World Health Organization; 2016.
- Footnote 64
-
Canadian Institute for Health Information (CIHI). International Statistical Classification of Diseases and Related Health Problems, 10th rev., Canada. Volume Two—Alphabetical Index [Internet].Ottawa, ON: CIHI; 2015 [cited 2017 Dec 11]. Available from: www.cihi.ca/sites/default/files/icd_volume_two_2015_en_0.pdf
- Footnote 65
-
Hedegaard H, Johnson RL, Warner M, Chen LH, Annest JL. Proposed framework for presenting injury data using the International Classification of Diseases, Tenth Revision, Clinical Modification (ICD-10-CM) Diagnosis Codes. Natl Health Stat Report. 2016 Jan 22;89:1–20.
- Footnote 66
-
Chen AY, Colantonio A. Defining neurotrauma in administrative data using the International Classification of Diseases Tenth Revision. Emerg Themes Epidemiol. 2011;8(4):1–13.
- Footnote 67
-
Drul C. Traumatic brain/concussion injuries in Alberta. Version 2. Hospital admissions (2005–2014) and emergency department visits (2011–2014). Edmonton AB: Injury Prevention Centre; 2017.
- Footnote 68
-
Fu TS, Jing R, McFaull SR, Cusimano MD. Health and economic burden of traumatic brain injury in the emergency department. Can J Neurol Sci. 2016;43(2):238–47.
- Footnote 69
-
Statistics Canada. Canadian Vital Statistics Death Database (CVS:D) [Internet]. Ottawa: Statistics Canada; c2017. [cited 2018 Oct 29]. Available from: http://www23.statcan.gc.ca/imdb/p2SV.pl?Function=getSurvey&SDDS=3233
- Footnote 70
-
Statistics Canada. Disclosure Control Strategy for Canadian Vital Statistics Birth and Death Databases. 2011
- Footnote 71
-
Canadian Institute for Health Information. Hospital Morbidity Database (HMDB). [Internet]. Ottawa: Canadian Institute for Health Information; c2018. [cited 2018 Oct 31]. Available from: www.cihi.ca/en/hospital-morbidity-database
- Footnote 72
-
Canadian Institute for Health Information. Discharge Abstract Database (DAD). [Internet]. Ottawa: Canadian Institute for Health Information; c2018. [cited 2018 Oct 31]. Available from: www.cihi.ca/en/discharge-abstract-database-metadata
- Footnote 73
-
Washington State Department of Health. Department of Health Agency Standards for Reporting Data with Small Numbers [Internet] [updated 2018 May]. Washington State Department of Health; [cited 2019 Jun 24]. Available from: www.doh.wa.gov/DataandStatisticalReports/DataGuidelines.aspx
- Footnote 74
-
Canadian Institute for Health Information. National Ambulatory Care Reporting System (NACRS). [Internet]. Ottawa: Canadian Institute for Health Information; c2018. [cited 2018 Oct 31]. Available from: www.cihi.ca/en/national-ambulatory-care- reporting-system-metadata
- Footnote 75
-
Gibson D, Richards H, Chapman A. The national ambulatory care reporting system: factors that affect the quality of its emergency data. Int. J. Information Quality. 2008;2(2):97–114.
- Footnote 76
-
Zemek RL, Grool AM, Duque DR, DeMatteo C, Rothman L, Benchimol EI, et al. Annual and seasonal trends in ambulatory visits for pediatric concussion in Ontario between 2003 and 2013. J Pediatr. 2017;181:222–8.
- Footnote 77
-
Rao D, McFaull S, Thompson W, Jayaraman GC. Traumatic brain injury management in Canada: changing patterns of care. Health Promot Chronic Dis Prev Can. 2018;38(3);147–50.
- Footnote 78
-
National Cancer Institute. Average Annual Percent Change (AAPC). [Internet] [updated 2018 Oct 25]. Rockville MD: National Cancer Institute; [cited 2018 Oct 29]; [about 3 screens]. Available from: https://surveillance.cancer.gov/help/joinpoint/setting- parameters/method-and-parameters-tab/apc-aapc-tau-confidence-intervals/average-annual-percent-change-aapc
- Footnote 79
-
Yao X, Skinner R, McFaull S, Thompson W. At-a-glance - 2015 injury deaths in Canada. Health Promot and Chronic Dis Prev in Can. 2019: 39(6/7);225–231.
- Footnote 80
-
Washington State Department of Health. Guidelines for Using Confidence Intervals for Public Health Assessment [Internet]. Washington State Department of Health; c2012. [cited 2019 Jun 24]. Available from: www.doh.wa.gov/DataandStatistical Reports/DataGuidelines.aspx
- Footnote 81
-
Washington State Department of Health. Guidelines for Using and Developing Rates for Public Health Assessment [Internet] [updated 2012 May 31]. Washington State Department of Health; [cited 2019 Jun 24]. Available from: www.doh.wa.gov/ DataandStatisticalReports/DataGuidelines.aspx
- Footnote 82
-
Mackenzie SG, Pless IB. CHIRPP: Canada’s principal injury surveillance program. Canadian hospitals injury reporting and prevention program. Inj Prev. 1999;5(3):208–13.
- Footnote 83
-
Herbert M, Mackenzie SG. Injury surveillance in paediatric hospitals: The Canadian experience. Paediatr Child Health. 2004;9(5):306–8.
- Footnote 84
-
Crain J, McFaull S, Thompson W, Skinner R, Do MT, Fréchette M, et al. Status report. The Canadian hospitals injury reporting and prevention program: A dynamic and innovative injury surveillance system. Health Promot Chronic Dis Prev Can. 2016; 36(6):112–17.
- Footnote 85
-
Hayes M, Holder Y, Pickett W. The Evaluation of the Canadian Hospitals Injury Reporting and Prevention Program (CHIRPP). Unpublished internal report; 2001.
- Footnote 86
-
Mukhi SN, Dhiravani K, Micholson B, Yan L, et al. An innovative mobile data collection technology for public health in a field setting. Online J Public Health Inform. 2018;10(2):e202.
- Footnote 87
-
Mukhi S, Aramini J, Kabani A. Contributing to communicable diseases intelligence management in Canada: CACMID meeting, March 2007, Halifax, Nova Scotia. Can J Infect Dis Med Microbiol. 2007;18(6):353–6.
- Footnote 88
-
ICECI Coordination and Maintenance Group. International Classification of External Causes of Injuries (ICECI) Version 1.2. Amsterdam and AIHW National Injury Surveillance Unit, Adelaide: ICECI Coordination and Maintenance Group, Consumer Safety Institute; 2004.
- Footnote 89
-
Mackenzie SG. Scooting mishaps. CMAJ. 2002;167(7):742.
- Footnote 90
-
Macarthur C, Pless IB. Sensitivity and representativeness of a childhood injury surveillance system. Inj Prev. 1999;5(3):214–16.
- Footnote 91
-
Pickett W, Brison RJ, Mackenzie SG, Garner M, King M, Greenberg T, et al. Youth injury data in the Canadian hospitals injury reporting and prevention program: Do they represent the Canadian experience? Inj Prev. 2000;6(1):9–15.
- Footnote 92
-
MacPherson AK, White HL, Mongeon S, Grant VJ, Osmond M, Lipskie T, et al. Examining the sensitivity of an injury surveillance program using population-based estimates. Inj Prev. 2008;14(4):262–5.
- Footnote 93
-
Kang J, Hagel B, Emery CA, Senger T, Meeuwisse W. Assessing the representativeness of the Canadian hospitals injury reporting and prevention programme (CHIRPP) sport and recreational injury data in Calgary, Canada. Int J Inj Contr Saf Promot. 2013;20(1):19–26.
- Footnote 94
-
Macarthur C, Dougherty G, Pless IB. Reliability and validity of proxy respondent information about childhood injury: An assessment of a Canadian surveillance system. Am J Epidemiol. 1997;145(9):834–41.
- Footnote 95
-
Macarthur C, Pless IB. Evaluation of the quality of an injury surveillance system. Am J Epidemiol. 1999;149(6):586–92.
- Footnote 96
-
Kostylova A, Swaine B, Feldman D. Concordance between childhood injury diagnoses from two sources: An injury surveillance system and a physician billing claims database. Inj Prev. 2005;11(3):186–90.
- Footnote 97
-
Butler M, Newton S, and MacPhee S. The Canadian hospitals injury reporting and prevention program: captured versus uncaptured injuries for patients presenting at a paediatric tertiary care centre. Paediatr Child Health. 2017;22(3)134–8.
- Footnote 98
-
Pickett W, Ardern C, Brison RJ. A population-based study of potential brain injuries requiring emergency care. CMAJ. 2001;165(3):288–92.
- Footnote 99
-
McFaull SR, Fréchette M, Skinner R. Emergency department surveillance of injuries associated with bunk beds: The Canadian hospitals injury reporting and prevention program (CHIRPP), 1990–2009. Chronic Dis Inj Can. 2012;33(1):38–46.
- Footnote 100
-
McFaull SR, Keays G. Emergency department presentations for injuries associated with inflatable amusement structures, Canada, 1990–2009. Chronic Dis Inj Can. 2013;33(3):129–36.
- Footnote 101
-
Do MT, Fréchette M, McFaull S, Denning B, Ruta M, Thompson W. Injuries in the North - analysis of 20 years of surveillance data collected by the Canadian hospitals injury reporting and prevention program. Int J Circumpolar Health. 2013;72(1):1–6.
- Footnote 102
-
Rao DP, Abramovici H, Crain J, Do MT, McFaull S, Thompson W, et al. The lows of getting high: sentinel surveillance of injuries associated with cannabis and other substance use. Can J Public Health. 2018;109(2):155–63.
- Footnote 103
-
Cunningham J, Brison, RJ, Pickett W. Concussive symptoms in emergency department patients diagnosed with minor head injury. J Emerg Med. 2011;40(3):262–6.
- Footnote 104
-
Taylor AM, Nigrovic LE, Saillant ML, Trudell EK, Proctor MR, Modest JR, et al. Trends in ambulatory care for children with concussion and minor head injury from Eastern Massachusetts between 2007 and 2013. J Pediatr. 2015;167(3):738–44.
- Footnote 105
-
Hamilton M, Mrazik M, Johnson DW. Incidence of delayed intracranial hemorrhage in children after uncomplicated minor head injuries. Pediatrics [Internet]. 2010 [cited 2018 Oct 29];126:e33–9. Available from: http://pediatrics.aappublications.org/ content/126/1/e33
- Footnote 106
-
Montenigro PH, Alosco ML, Martin BM, Daneshuar JM, Chaisson OE, Nowinski CJ, et al. Cumulative head impact exposure predicts later-life depression, apathy, executive dysfunction, and cognitive impairment in former high school and college football players. J Neuro trauma. 2017;34:328-40
- Footnote 107
-
National Cancer Institute. Annual Percent Change (APC). [Internet] [updated 2018 Oct 25]. Rockville MD: National Cancer Institute; [cited 2018 Oct 29]; [about 3 screens]. Available from: https://surveillance.cancer.gov/help/joinpoint/setting- parameters/method-and-parameters-tab/apc-aapc-tau-confidence-intervals/estimate-average-percent-change- apc-and-confidence-interval
- Footnote 108
-
Zhang Y. Perl Regular Expression in SAS® Macro Programming. Presented at the SAS Global Forum conference 2011; 2011 Apr 4–7; Las Vegas (Nevada). Cary, NC: SAS Institute Inc.; 2011. Paper 159:1–7. Available from: http://support.sas.com/ resources/papers/proceedings11/159-2011.pdf
- Footnote 109
-
Morgan DP. The Essential Guide to SAS Dates and Times. Cary, NC, USA. SAS Press; 2006.
- Footnote 110
-
Zemek RL, Grool AM, Duque DR, DeMatteo C, Rothman L, Benchimol EU, et al. Annual and seasonal trends in ambulatory visits for pediatric concussion in Ontario between 2003 and 2013. J Pediatr. 2017;181:222–8.
- Footnote 111
-
Graham R, Rivara FP, Ford MA, Spicer CM, editors. Sports-related concussions in youth. Improving the science, changing the culture. Washington, D.C.: The National Academies Press; 2014.
- Footnote 112
-
National Cancer Institute. Average Annual Percent Change (AAPC). [Internet] [updated 2018 Oct 25]. Rockville MD: National Cancer Institute; [cited 2018 Oct 29]; [about 3 screens]. Available from: https://surveillance.cancer.gov/help/ joinpoint/setting-parameters/method-and-parameters-tab/apc-aapc-tau-confidence-intervals/average-annual- percent-change-aapc
- Footnote 113
-
Selassie AW, Wilson DA, Pickelsimer EE, Voronca DC, Williams NR, Edwards JC. Incidence of sport-related traumatic brain injury and risk factors of severity: a population-based epidemiologic study. Ann Epidemiol. 2013;23(12):750–6.
- Footnote 114
-
Greenwald R, Ashare A, editors. Fifth international symposium on safety in ice hockey, STP1516. West Conshohocken, PA: ASTM International; 2009.
- Footnote 115
-
Smith AM, Stuart MJ, Roberts WO, Dodick DW, Finnoff JT, Jorgensen JK, et al. Concussion in ice hockey: current gaps and future directions in an objective diagnosis. Clin J Sport Med. 2017;27(5):503–9.
- Footnote 116
-
Smith AM, Stuart MJ, Greenwald RM, Benson BW, Dodick DW, Emery C, et al. Proceedings from the ice hockey summit on concussion: a call to action. Am J Phys Med Rehabil. 2011;90(8);694–703.
- Footnote 117
-
Blake T, Hagel BE, Emery CA. Does intentional or unintentional contact in youth ice hockey result in more injuries? Clin J Sport Med. 2012;22(4):377–8.
- Footnote 118
-
Underhill J, Dostaler SM, Brison RJ, Pickett W. Rugby injury in Kingston, Canada: a ten-year study. Chronic Dis Can. 2007;27(4):163–70.
- Footnote 119
-
Black AM, Sergio LE, Macpherson AK. The epidemiology of concussions: number and nature of concussions and time to recovery among female and male Canadian varsity athletes 2008 to 2011. Clin J Sport Med. 2017;27(1):52–6.
- Footnote 120
-
Jessula A, Murphy N, Yanchar NL. Injury severity in pediatric all-terrain vehicle-related trauma in Nova Scotia. J Pediatr Surg. 2017;52(5):822–5.
- Footnote 121
-
Lawson BR, Comstock RD, Smith GA. Baseball-related injuries to children treated in hospital emergency departments in the United States, 1994–2006. Pediatrics. 2009;123(6):e1028–34.
- Footnote 122
-
Madias C, Maron B, Weinstock J, Estes NAM, Link M. Commotio Cordis – Sudden cardiac death with chest wall impact. J Cardiovasc Electrophysiol. 2007;18(1):115–22.
- Footnote 123
-
Hardy I, McFaull SR, Beaudin M, St-Vil D, Rousseau E. Cheerleading injuries in children: what can be learned? Paediatr Child Health. 2017;22(3):130–3.
- Footnote 124
-
McCrory P. Boxing and the risk of chronic brain injury. BMJ. 2007;335(7624):781–2.
- Footnote 125
-
Purcell LK, LeBlanc CMA, Canadian Paediatric Society, Healthy Active Living and Sports Medicine Committee. Boxing participation by children and adolescents. Paediatr Child Health. 2012;17(1):39.
- Footnote 126
-
Potter MR, Snyder AJ, Smith GA. Boxing Injuries Presenting to U.S. Emergency Departments, 1990–2008. Am J Prev Med. 2011;40(4):462–7.
- Footnote 127
-
Curran-Sills G. Abedin T. Risk factors associated with injury and concussion in sanctioned amateur and professional mixed martial arts bouts in Calgary, Alberta. BMJ Open Sport & Exercise Medicine. 2018;4:e000348. doi:10.1136/ bmjsem-2018-000348
- Footnote 128
-
Public Health Agency of Canada. Data Blog: Sport and Recreation-related Concussions and Other Traumatic Brain Injuries Among Canada’s Children and Youth. [Internet] [updated 2018 Oct 11]. Ottawa, ON: Public Health Agency of Canada; [cited 2018 Oct 25]; [about 4 screens]. Available from: https://infobase.phac-aspc.gc.ca/datalab/head-injury-interactive-en.html
- Footnote 129
-
Hockey Canada. Hockey Canada annual report July 2017–June 2018. [Internet]. Calgary, AB: Hockey Canada; 2019. [cited 2019 Mar 4] Page 13. Available from: https://cdn.agilitycms.com/hockey-canada/Corporate/About/ Downloads/2017-18-hockey-canada-annual-report-e.pdf
- Footnote 130
-
Eime RM, Young JA, Harvey JT, Charity MJ, Payne WR. A systematic review of the psychological and social benefits of participation in sport for children and adolescents: informing development of a conceptual model of health through sport. Int J Behav Nutr Phy. 2013;10(89):1–21.
- Footnote 131
-
Smith JJ, Eather N, Morgan PJ, Plotnikoff RC, Faigenbaum AD, Lubans DR. The health benefits of muscular fitness for children and adolescents: a systematic review and meta-analysis. Sports Med. 2014;44(9):1209–23.
- Footnote 132
-
Tremblay MS, Carson V, Chaput JP, Gorber SC, Dinh T, Duggan M, et al. Canadian 24-hour movement guidelines for children and youth: an integration of physical activity, sedentary behaviour, and sleep. Appl Physiol Nutr Metab. 2016;41 (6 Suppl 3):S311–27.
- Footnote 133
-
Janssen I, Roberts KC, Thompson WT. Adherence to the 24-hour movement guidelines among 10- to 17-year-old Canadians. Health Promot Chronic Dis Prev Can. 2017;37(11):369–75.
- Footnote 134
-
Warburton, DE, Nicol CW, Bredin SS. Health benefits of physical activity: the evidence. CMAJ. 2006;174:801–9.
- Footnote 135
-
Langlois JA, Rutland-Brown W, Wald MM. The epidemiology and impact of traumatic brain injury: a brief overview. J Head Trauma Rehabil. 2006;21(5):375–8.
- Footnote 136
-
Jordan BD. The clinical spectrum of sport-related traumatic brain injury. Nat Rev Neurol. 2013;(9):222–30.
- Footnote 137
-
Emery CA, Meuwisse WH. Injury rates, risk factors, and mechanisms of injury in minor hockey. Am J Sport Med. 2006;34(12):1960–9.
- Footnote 138
-
Benz B, Ritz A, Kiesow S. Influence of age-related factors on long-term outcome after traumatic brain injury (TBI) in children: a review of recent literature and some preliminary findings. Restor Neurol Neurosci. 1999;14:135–41.
- Footnote 139
-
Black AM, Hagel BE, Palacios-Derflingher L, Schneider KL, Emery CA. The risk of injury associated with body checking among Pee Wee ice hockey players: an evaluation of Hockey Canada’s national body checking policy change. Br J Sports Med. 2017;51:1767–72.
- Footnote 140
-
Cusimano MD, Cho N, Amin K, Shirazi M, McFaull SR, Do MT, et al. Mechanisms of Team-Sport-Related Brain Injuries in Children 5 to 19 Years Old: Opportunities for Prevention. PLoS One [Internet]. 2013 [cited 2018 Apr 5];8(3):e58868.
- Footnote 141
-
Cusimano MD, Taback NA, McFaull SR, Hodgins R, Bekele TM, Elfeki N. Effect of bodychecking on rate of injuries among minor hockey players. Open Med. 2011;5(1):e57–64.
- Footnote 142
-
Hockey Canada. Checking skills. [Internet]. Calgary, AB: Hockey Canada; c2018. Checking Skills; [cited 2018 Apr 5]; [about one screen]. Available from: www.hockeycanada.ca/en-ca/hockey-programs/coaching/checking
- Footnote 143
-
McKay CD, Meeuwisse WH, Emery CA. Informing body checking policy in youth ice hockey in Canada: a discussion meeting with researchers and community stakeholders. Can J Public Health. 2014;105:445–9.
- Footnote 144
-
Canadian Broadcasting Corporation. Hockey Canada votes to ban bodychecking in peewee hockey. Canadian Broadcasting Corporation [Internet]. 2013 May 25 [cited 2018 Nov 2]; [about one screen]. Available from: www.cbc.ca/sports/hockey/ nhl/hockey-canada-votes-to-ban-bodychecking-in-peewee-hockey-1.1340868
- Footnote 145
-
Hockey Canada. Player Development Essentials. [Internet]. Calgary, AB: Hockey Canada; c2017. Player Development Essentials. Minor Hockey Age Categories; [revised 2017; cited 2017 Dec 18]; [about one screen]. Available from: www.hockeycanada.ca/en-ca/hockey-programs/players/essentials
- Footnote 146
-
Knowles SB, Marshall SW, Bowling JM, Loomis D, Millikan R, Yang J, et al. A prospective study of injury incidence among North Carolina high school athletes. Am J Epidemiol. 2006;164(12):1209–21.
- Footnote 147
-
Le Gall F, Carling C, Reilly T, Vandewalle H, Church J, Rochcongar P. Incidence of injuries in elite French youth soccer players: a 10-season study. Am J Sports Med. 2006;34(6):928–38.
- Footnote 148
-
Hockey Canada. Safety Program. [Internet]. Calgary, AB: Hockey Canada; c2017. Safety Program; [revised 2017; cited 2017 Dec 21]; [one screen]. Available from: www.hockeycanada.ca/en-ca/hockey-programs/safety
- Footnote 149
-
Parachute. Sport Concussion Protocols now adopted by National Sport Organizations in Canada. [Internet]. Toronto, ON: Parachute; 2018 [cited 2018 Oct 4]. Available from: www.parachutecanada.org/news-releases/item/ sport-concussion-protocols-now-adopted-by-national-sport-organizations-in-c
- Footnote 150
-
Kontos AP, Elbin RJ, Sufrinko A, Dakan S, Bookwalter K, Price A, et al. Incidence of Concussion in Youth Ice Hockey Players. Pediatrics. 2016 Feb;137(2):e20151633–1633. Epub 2016 Jan 8.
- Footnote 151
-
Emery CA. Risk factors for injury in child and adolescent sport: a systematic review of the literature. Clin J Sport Med. 2003;13(4):256–68.
- Footnote 152
-
Marchie A, Cusimano MD. Bodychecking and concussions in ice hockey: Should our youth pay the price? CMAJ. 2003;169(2):124–8.
- Footnote 153
-
Caine D, Caine C, Maffulli N. Incidence and distribution of pediatric sport-related injuries. Clin J Sport Med. 2006;16(6):500–13.
- Footnote 154
-
Emery CA, Meeuwisse WH, McAllister JR. Survey of sport participation and sport injury in Calgary and area high schools. Clin J Sport Med. 2006;16(1):20–6.
- Footnote 155
-
International Ice Hockey Federation. Annual Report July 2017—June 2018. [Internet]. Zurich: International Ice Hockey Federation; 2018 [cited 2019 Mar 5]. Available from: www.iihf.com/IIHFMvc/media/Downloads/Annual%20Report/ AnnualReport2018.pdf
- Footnote 156
-
Decloe MD, Meeuwisse WH, Hagel BE, Emery CA. Injury rates, types, mechanisms and risk factors in female youth ice hockey. Br J Sports Med. 2014;48(1):51–6.
- Footnote 157
-
Hockey Canada. Referee’s Case Book/Rule Combination 2018–2020. [Internet], Calgary, AB: Hockey Canada; 2018 [cited 2019 Jan 23]. Available from: http://cdn.agilitycms.com/hockey-canada/Hockey-Programs/Officiating/ Downloads/rulebook_casebook_e.pdf
- Footnote 158
-
Keightley M, Reed N, Green S, Taha T. Age and competition level on injuries in female ice hockey. Int J Sports Med. 2013;34(8):756–9.
- Footnote 159
-
Hutchison MG, Comper P, Meeuwisse WH, Echemendia RJ. An observational method to code concussions in the National Hockey League (NHL): the heads-up checklist. Br J Sports Med. 2014;48(2):125–9.
- Footnote 160
-
Emery C, Kang J, Shrier I, Goulet C, Hagel B, Benson B, et al. Risk of injury associated with bodychecking experience among youth hockey players. CMAJ. 2011;183(11):1249–56.
- Footnote 161
-
Jordan BD. The clinical spectrum of sport-related traumatic brain injury. Nat Rev Neurol. 2013;9:222–30.
- Footnote 162
-
Freitag A, Kirkwood W, Scharer S, Ofori-Asenso R, Pollock A. Systematic review of rugby injuries in children and adolescents under 21 years. Br J Sports Med. 2015;49:511–19.
- Footnote 163
-
Sabesan V, Steffes Z, Lombardo DJ, Petersen-Fitts GR, Jildeh TR. Epidemiology and location of rugby injuries treated in US emergency departments from 2004 to 2013. Open Access J Sports Med [Internet]. 2016 [cited 2018 Mar 6];7:135–42. Available from: www.ncbi.nlm.nih.gov/pmc/articles/PMC5087755
- Footnote 164
-
Russell K, Ellis MJ, Bauman S, Tator CH. Legislation for youth sport concussion in Canada: review, conceptual framework, and recommendations. Can J Neurol Sci. 2017;44:225–34.
- Footnote 165
-
Government of Ontario [Internet]. Toronto: Ministry of Tourism, Culture and Sport; Ontario Passes Ground-Breaking Legislation to Protect Amateur Athletes [updated 2018 Mar 6]. Toronto: Government of Ontario; 2018 [cited 2018 Mar 6]; [about two screens]. Available from: https://news.ontario.ca/mtc/en/2018/03/ontario-passes-ground-breaking- legislation-to-protect-amateur-athletes.html
- Footnote 166
-
Fridman L, Fraser-Thomas JL, McFaull SR, Macpherson AK. Epidemiology of sports-related injuries in children and youth presenting to Canadian emergency departments from 2007–2010. BMC Sports Sci Med Rehabil [Internet]. 2013;5:30. Available from: https://bmcsportsscimedrehabil.biomedcentral.com/articles/10.1186/2052-1847-5-30
- Footnote 167
-
Underhill J, Dostaler SM, Brison RJ, Pickett W. Rugby injury in Kingston, Canada: A ten-year study. Chronic Dis Can. 2007;27(4):163–70.
- Footnote 168
-
Collins CL, Micheli LJ, Yard EE, Comstock RD. Injuries sustained by high school rugby players in the United States, 2005–2006. Arch Pediatr Adolesc Med. 2008;162(1):49–54.
- Footnote 169
-
Bleakley C, Tully M, O’Connor S. Epidemiology of Adolescent Rugby Injuries: A Systematic Review. J Athl Train. 2011;46(5):555–65.
- Footnote 170
-
Rugby Canada. Age grade variations for club rugby [Internet]. Richmond Hill, ON: Rugby Canada; 2017 [cited 2018 Oct 4]. Available from: www.bytownbluesrugby.ca/wp-content/uploads/2017/11/Rugby-Canada-Age-Grade-Rugby-Game- Cards-EN.pdf
- Footnote 171
-
Cusimano M, Nassiri F, Chang Y. The effectiveness of interventions to reduce neurological injuries in rugby union: a systematic review. Neurosurgery. 2010;67(5):1404–18.
- Footnote 172
-
Rugby Canada. What is Rugby Canada Play Smart? [Internet]. Richmond Hill, ON: Rugby Canada; c2016 [cited 2018 Mar 6]. Available from: http://playsmart.rugbycanada.ca
- Footnote 173
-
United States Consumer Product Safety Commission. Guidelines for Retrofitting Bleachers. [Internet]. Washington, DC: U.S. Consumer Product Safety Commission; 2000. [cited 2018 Apr 11]. Available from: www.cpsc.gov/s3fs-public/330.pdf
- Footnote 174
-
De Brito VL, Pimentel RL. Cases of collapse of demountable grandstands. J Perform Constr Fac. 2009;23(3):151–9.
- Footnote 175
-
The Stadium Guide [Internet]. Twenty years ago: the Bastia stadium disaster [updated Apr 2012]. The Stadium Guide; undated [cited 2018 Apr 13]. Available from: www.stadiumguide.com/twenty-years-ago-the-bastia-stadium-disaster
- Footnote 176
-
Carleton University. Panda-monium [Internet]. Ottawa; Carleton University; undated [cited 2018 Apr 11]. Available from: https://arc.library.carleton.ca/exhibits/ravens-football/panda-monium
- Footnote 177
-
McFaull S. Injuries associated with bleachers and grandstands: data from the Canadian Hospitals Injury Reporting and Prevention Program (CHIRPP). Oral presentation at Canadian Public Health Association Annual Conference; 2004; St. John’s, NFLD.
- Footnote 178
-
United States Consumer Product Safety Commission [Internet]. Washington, DC: United States Consumer Product Safety Commission. National Electronic Injury Surveillance System (NEISS); undated [cited 2018 Mar 8]; [about one screen]. Available from: www.cpsc.gov/ Research--Statistics/NEISS-Injury-Data
- Footnote 179
-
United States Consumer Product Safety Commission. NEISS Highlights, Data, and Query Builder [Internet]. Washington, DC: United States Consumer Product Safety Commission; undated [cited 2017 Dec 13]. Available from: www.cpsc.gov/cgibin/ NEISSQuery/home.aspx
- Footnote 180
-
Ludden MJ. Take me out to the ballgame - but bring a helmet: reforming the baseball rule in light of recent fan injuries at baseball stadiums. Marq Sports L Rev. 2013;24(1):123–40.
- Footnote 181
-
Swischuk, LE. Musculoskeletal: what is different in children? Playing at school: falls into bleachers: left arm pain. Emerg Radiol. 2014(21):45–7.
- Footnote 182
-
Oh JH, Kim JY, Jo BC, Sung GY. The epidemiology of spectator injury and illness in the Korean professional baseball league: 2 consecutive seasons (2011–2012) at the Jamsil Stadium. Korean J Sports Med. 2015;33(1):6–12.
- Footnote 183
-
Beebe J. Injuries from foul balls, broken bats, and railing fall-overs: who is liable? N. Ill. U. L. Rev. 2017;8(2):65–89.
- Footnote 184
-
Morrongiello BA, Zdzieborski D, Normand J. Understanding gender differences in children’s risk taking and injury: A comparison of mothers’ and fathers’ reactions to sons and daughters misbehaving in ways that lead to injury. J Appl Dev Psychol. 2010;31(4):322–9.
- Footnote 185
-
McKinlay A, Kyonka EGE, Grace RC, Horwood LJ, Fergusson DM, MacFarlane MR. An investigation of the pre-injury risk factors associated with children who experience traumatic brain injury. Inj Prev. 2010;16:31–5.
- Footnote 186
-
National Research Council of Canada. National Building Code 2015. Ottawa, ON: National Research Council; 2015.
- Footnote 187
-
Murray KJ, Griffin R, Rue III LW, McGwin Jr G. Recent trends in television tip over-related injuries among children aged 0–9 years. Inj Prev. 2009;15(4):240–3.
- Footnote 188
-
De Roo AC, Chounthirath T, Smith GA. Television-related injuries to children in the United States, 1990–2011. Pediatrics. 2013;132(2):267–74.
- Footnote 189
-
Lichenstein R, Monroe D, Quayle KS, Miskin M, Cooper A, Gerardi MJ, et al. Television-related head injuries in children. A secondary analysis of a large cohort study of head-injured children in the pediatric emergency care applied research network. Pediatr Emerg Care [Internet]. 2015 [cited 31 Jan 2019]; Nov 6:1–6. Available from: 10.1097/PEC.0000000000000605 Subscription required.
- Footnote 190
-
Cusimano MD, Parker N. Toppled television sets and head injuries in the pediatric population: a framework for prevention. J Neurosurg Pediatr. 2016;17:3–12.
- Footnote 191
-
Bol O, Cebiçci H, Koyuncu S, Şarl B, Günay N. A hidden household danger: Television. Ulus Travma Cerrahi Derg. 2016; May 22(3):265–8.
- Footnote 192
-
Waqas M, Javed G, Nathani KR, Ujjan B, Quadri SA, Tahir MZ. The outcome and patterns of traumatic brain injury in the paediatric population of a developing country secondary to TV trolley tip-over. Pediatr Neurosurg. 2018;53(1):7–12.
- Footnote 193
-
McFaull SR. Pediatric injuries resulting from television set tip-overs: Data from the Canadian Hospitals Injury Reporting and Prevention Program (CHIRPP). In: The 6th World Conference, Injury Prevention and Control; May 2002, Montreal, Quebec.
- Footnote 194
-
Wyrick D, Maxson RT. Patterns of injuries in newer mechanisms of pediatric injuries (ATVs, snowmobiles, trampolines, flat screen TVs). Curr Surg Rep. 2014;2:61. doi: 10.1007/s40137-014-0061-2.
- Footnote 195
-
Health Canada. Stroller and carriage safety [Internet]. Ottawa: Health Canada; 2012 [cited 2017 Aug 6]. Available from: www.canada.ca/en/health-canada/services/infant-care/strollers-carriages.html
- Footnote 196
-
Canada Consumer Product Safety Act. Carriages and Strollers Regulations. P.C. 2016–594, June 21, 2016. Consolidation (SOR/2016–167), October 3, 2018. Minister of Justice. [cited 2019 Jan 23]. Available from: https://laws-lois.justice.gc.ca/ eng/regulations/SOR-2016-167/index.html
- Footnote 197
-
Gaw CE, Chounthirath T, Smith GA. Nursery product-related injuries treated in United States emergency departments. Pediatrics [Internet]. 2016 [cited 2019 Jan 25];139(4):e20162503. Available from: http://pediatrics.aappublications.org/ content/pediatrics/139/4/e20162503.full.pdf Subscription required.
- Footnote 198
-
Fréchette M, McFaull S, Skinner R, Crain J. Paediatric emergency department surveillance of injuries associated with baby products, Canadian Hospitals Injury Reporting and Prevention Program (CHIRPP), 1990–2008, 0–5 years. Paediatr Child Health. 2011;(16)Suppl A:24A.
- Footnote 199
-
Skinner R, Ugnat A-M, Grenier D. Baby products and injuries in Canada: Is it still an issue? Paediatr Child Health. 2010;15(8):490.
- Footnote 200
-
Fowler E, Kobe C, Roberts KJ, Collins CL, McKenzie LB. Injuries associated with strollers and carriers among children in the United States, 1990 to 2010. Acad Pediatr. 2016;16(8):726–33.
- Footnote 201
-
Inoue N, Baker R, Scott D. Pram and stroller related injuries in Queensland children under 5 years of age. Queensland Injury Surveillance Unit Injury Bulletin. 2009;108:1–6.
- Footnote 202
-
McFaull, SR. Stroller/pram-related head and face injuries in infants and one year-olds: Data from the Canadian Hospitals Injury Reporting and Prevention Program (CHIRPP). Paediatr Child Health. 2003;Vol 8 Suppl-B:50B.
- Footnote 203
-
Crain J, McFaull S, Thompson W, Skinner R, Do MT, Fréchette M, et al. Status report—The Canadian Hospitals Injury Reporting and Prevention Program: a dynamic and innovative injury surveillance system. Health Promot Chronic Dis Prev Can. 2016;36(6):112–17.
- Footnote 204
-
Powell EC, Jovtis E, Tanz RR. Incidence and description of stroller-related injuries to children. Pediatrics [Internet]. 2002 Nov [cited 2019 Jan 23];110(5):e62[3 pages]. Available from: http://pediatrics.aappublications.org/content/pediatrics/110/ 5/e62.full.pdf
- Footnote 205
-
Tripathi M, Tyebally A, Xun Yi, Feng JX, Chong SL. A review of stroller-related and pram-related injuries to children in Singapore. Inj Prev. 2017;23:60–3.
- Footnote 206
-
Huelke DF. An overview of anatomical considerations of infants and children in the adult world of automobile safety design. 42nd Annual Proceedings, Association for the Advancement of Automotive Medicine; 1998 October 5–7: Charlottesville, Virginia. Des Plaines, IL: Association for the Advancement of Automotive Medicine.
- Footnote 207
-
Wishon PM, Huang A, Spangler RS. Hazard patterns and injury prevention with infant walkers and strollers. In: Southern Association on Children Under Six, 40th Annual Conference; 1989 April.
- Footnote 208
-
Alcala E, Martin AL, Valles B, Martinez L, Dols JF, Pons V, et al. Kinematics of Children Prams in Emergency Maneuvers of Urban Buses. Proceedings of the European Automobile Engineers Cooperation (EAEC); 2011 July; Valencia, Spain.
- Footnote 209
-
Government of Canada. Leaving Children Unattended in Strollers and Failing to Use Restraint Systems Poses a Risk of Injury or Death [Internet]. Ottawa: Government of Canada; 2010 [revised 2013 Feb 1; cited 2017 Dec 18]; [about two screens]. Available from: http://healthycanadians.gc.ca/recall-alert-rappel-avis/hc-sc/2010/13443a-eng.php
- Footnote 210
-
Byard RW, Matthews N. Drowning and three-wheel strollers. Med J Australia. 2007;187(10):597–8.
- Footnote 211
-
Statistics Canada. Elementary–Secondary Education Survey for Canada, the provinces and territories, 2014/2015. The Daily 2016 Nov 18. Ottawa: Statistics Canada; 2015.
- Footnote 212
-
Salminen S, Kurenniemi M, Raback M, Markkula J, Lounamaa A. School environment and school injuries. Front Public Health [Internet]. 2014 Jan [cited 2019 Jan 25];1(76):[5 p.]. Available from: www.frontiersin.org/articles/10.3389/ fpubh.2013.00076/full Subscription required.
- Footnote 213
-
Amanullah S, Heneghan JA, Steele DW, Mello MJ, Linakis JG. Emergency department visits resulting from intentional injury in and out of school. Pediatrics. 2014;133(2):254–61.
- Footnote 214
-
Mo F, Turner MC, Krewski D, Merrick J. Adolescent injuries in Canada: findings from the Canadian community health survey, 2000–2001. Int J Inj Contr Saf Promot. 2006;13(4):235–44.
- Footnote 215
-
Josse JM, MacKay M, Osmond MH, MacPherson AK. School injury among Ottawa-area children: a population-based study. J Sch Health. 2009;79(2):45–50.
- Footnote 216
-
Linakis JG, Amanullah S, Mello MJ. Emergency department visits for injury in school-aged children in the United States: a comparison of nonfatal injuries occurring within and outside of the school environment. Acad Emerg Med. 2006;13(5):567–70.
- Footnote 217
-
Mercado MC, Holland K, Leemis RW, Stone DM, Wang J. Trends in Emergency Department Visits for Nonfatal Self-Inflicted Injuries Among Youth Aged 10–24 Years in the United States, 2001–2015. JAMA. 2017;318(19):1931–33.
- Footnote 218
-
Evans R, Hurrell C. The role of schools in children and young people’s self-harm and suicide: systematic review and bmeta-ethnography of qualitative research. BMC Public Health [Internet]. 2016;16:401. doi: 10.1186/s12889-016-3065-2.
- Footnote 219
-
Statistics Canada. [Internet]. Age and Sex Highlight Tables, 2016 Census. [updated 2017 May 5] Ottawa, ON: Statistics Canada; 2018 [cited 2017 Dec 4]; [about one screen]. Available from: http://www12.statcan.gc.ca/census-recensement/2016/dp-pd/ hlt-fst/as/Table.cfm?Lang=E&T=11
- Footnote 220
-
Bohnert N, Chagnon J, Dion P, Martel L. Population projections for Canada (2013 to 2063), provinces and territories (2013 to 2038): technical report on methodology and assumptions [Internet]. Ottawa, ON: Statistics Canada; 2015 [cited 2017 Dec 4]. Available from: www.statcan.gc.ca/pub/91-620-x/91-620-x2014001-eng.htm
- Footnote 221
-
Public Health Agency of Canada. Seniors’ Falls in Canada Second Report [Internet]. Ottawa, ON: Public Health Agency of Canada; 2014 [cited 2017 Dec 4]. Available from: www.phac-aspc.gc.ca/seniors-aines/publications/public/injury-blessure/ seniors_falls-chutes_aines/assets/pdf/seniors_falls-chutes_aines-eng.pdf
- Footnote 222
-
Gill TM, Murphy TE, Gahbauer EA, Allore HG. Association of injurious falls with disability outcomes and nursing home admissions in community-living older persons. Am J Epidemiol. 2013;178(3):418–25.
- Footnote 223
-
Chang VC, Do MT. Risk factors for falls among seniors: implications of gender. Am J Epidemiol. 2014;181(7):521–31.
- Footnote 224
-
Ambrose AF, Paul G, Hausdorff JM. Risk factors for falls among older adults: a review of the literature. Maturitas. 2013;75:51–61.
- Footnote 225
-
Schonnop R, Yang Y, Feldman F, Robinson E, Loughin M, Robinovitch SN. Prevalence of and factors associated with head impact during falls in older adults in long-term care. CMAJ [Internet]. 2013 [cited 2017 Dec 4];185(17):E803–10. Available from: www.cmaj.ca/content/185/17/E803.short Subscription required.
- Footnote 226
-
Jager TE, Weiss HB, Coben JH, Pepe PE. Traumatic brain injuries evaluated in U.S. emergency departments, 1992–1994. Acad Emerg Med. 2000;7(2):134–40.
- Footnote 227
-
Fu WF, Fu TS, Jing R, McFaull SR, Cusimano MD. Predictors of falls and mortality among elderly adults with traumatic brain injury: a nationwide, population-based study. PLoS ONE [Internet]. 2017 [cited 2017 Dec 4];12(4):e0175868. Available from: https://journals.plos.org/plosone/article?id=10.1371/journal.pone.0175868
- Footnote 228
-
Boye ND, Mattace-Raso FU, Van der Velde N, Van Lieshout EM, De Vries OJ, Hartholt KA, et al. Circumstances leading to injurious falls in older men and women in the Netherlands. Injury. 2014;45:1224–30.
- Footnote 229
-
Hwang HF, Cheng CH, Chien DK, Yu WY, Lin MR. Risk factors for traumatic brain injuries during falls in older persons. J Head Trauma Rehabil [Internet]. 2015 [cited 2017 Dec 4];30(6):E9–17. Available from: www.ingentaconnect.com/content/ wk/htr/2015/00000030/00000006/art00002 Subscription required.
- Footnote 230
-
Maki BE, Bartlett SA, Fernie GR. Influence of stairway handrail height on the ability to generate stabilizing forces and moments. Hum Factors. 1984;26(6):705–14.
- Footnote 231
-
Pauls J. Life safety standards and guidelines focused on stairways. In: Preiser WFE, Ostroff E, editors. Universal design handbook. New York: McGraw-Hill; 2001. p. 32.1–23.
- Footnote 232
-
Jacobs JV. A review of stairway falls and stair negotiation: Lessons learned and future needs to reduce injury. Gait Posture. 2016;49:159–67.
- Footnote 233
-
Public Health Infobase - Canadian Chronic Disease Surveillance System (CCDSS) [Internet]. Ottawa, ON: Government of Canada; 2017 [revised 2018 Dec 7; cited 2019 March 8]. Available from: https://infobase.phac-aspc.gc.ca/ccdss-scsmc/ data-tool
- Footnote 234
-
World Health Organization. Pedestrian safety: A road safety manual for decision-makers and practitioners [Internet]. Geneva: World Health Organization; 2014 [cited 2018 Feb 13]. Available from: www.who.int/roadsafety/projects/manuals/pedestrian/en
- Footnote 235
-
Naci H, Chisholm D, Baker T. Distribution of road traffic deaths by road user group: a global comparison. Inj Prev. 2009 Feb;15(1):55–9.
- Footnote 236
-
Statistics Canada. Table 102-0540 - Deaths, by cause, Chapter XX: External causes of morbidity and mortality (V01 to Y89), age group and sex, Canada, annual (number), CANSIM (database) [Internet] [updated 2018 Feb 23]. Ottawa, ON: Statistics Canada; c2018 [cited 2018 Feb 23]; [about one screen]. Available from: https://www150.statcan.gc.ca/t1/tbl1/en/ tv.action?pid=1310015601
- Footnote 237
-
Robertson, R. Pedestrians: What do we know? [Internet]. Ottawa ON: Traffic Injury Research Foundation; 2015 [cited 2018 Feb 13]. Available from: http://tirf.ca/wp-content/uploads/2017/01/TIRF_Toolkit_Factsheets_Pedestrian-Issue.pdf
- Footnote 238
-
Canadian Council of Motor Transport Administrators. Countermeasures to Improve Pedestrian Safety in Canada [Internet]. Ottawa, ON: Canadian Council of Motor Transport Administrators; 2013 [cited 2018 Feb 13]. Available from: http://ccmta.ca/en/publications/road-safety-research/item/countermeasures-to-improve-pedestrian-safety
- Footnote 239
-
Ayers JW, Leas EC, Dredze M, Allem JP, Grabowski JG, Hill L. Pokémon GO—A new distraction for drivers and pedestrians. JAMA Intern Med. 2016;176(12):1865–6.
- Footnote 240
-
Byington K.W. Schwebel D.C. Effects of mobile Internet use on college student pedestrian injury risk. Accident Anal Prev. 2013 Mar;51:78–83.
- Footnote 241
-
Schwebel DC, Stavrinos D, Byington KW, Davis T, O’Neal EE, de Jong D. Distraction and pedestrian safety: how talking on the phone, texting, and listening to music impact crossing the street. Accident Anal Prev. 2012 Mar;45:266–71.
- Footnote 242
-
Public Health Agency of Canada (PHAC). PHAC analysis of Statistics Canada mortality and population data. Unpublished internal report; 2018.
- Footnote 243
-
Vanlaar W, Mainegra Hing M, Brown S, McAteer H, Crain J, McFaull S. Fatal and serious injuries related to vulnerable road users in Canada. J Safety Res. 2016;58:67–77.
- Footnote 244
-
Longhitano D, Ivarsson J, Henary BY, Crandall J. Torso injury trends for pedestrians struck by cars and LTVs. Presented at the 19th international technical conference on the enhanced safety of vehicles; 2005 June 6–9; Washington DC.
- Footnote 245
-
Zhang G, Cao L, Hu J, Yang KH. A field data analysis of risk factors affecting the injury risks in vehicle-to-pedestrian crashes. Ann Adv Automot Med. 2008;52:199–214.
- Footnote 246
-
Maki T, Asai T, Kajzer J. Development of future pedestrian protection technologies. The 18th international technical conference on the enhanced safety of vehicles Proceedings; Nagoya, Japan. 2003 May 19–22.
- Footnote 247
-
National Highway Traffic Safety Administration (NHSTA). Traffic Safety Facts. [Internet]. Washington, D.C: National Highway Traffic Safety Administration; 2015 [cited 2018 Feb 13]. Available from: https://crashstats.nhtsa.dot.gov/Api/Public/ Publication/812375
- Footnote 248
-
Onieva-García M, Martínez-Ruiz V, Lardelli-Claret P, Jiménez-Moleón J, Amezcua-Prieto C, Dios Luna-del-Castillo J, et al. Gender and age differences in components of traffic-related pedestrian death rates: exposure, risk of crash and fatality rate. Inj Epidemiol. 2016;3(1):14.
- Footnote 249
-
Brown SW, Vanlaar WGM, Robertson RD. The alcohol-crash problem in Canada 2011 report [Internet]. Ottawa, ON: Canadian Council of Motor Transport Administrators; 2015 [cited 2018 Feb 13]. Available from: www.ccmta.ca/images/publications/ pdf/2011_Alcohol_and_Drug_Crash_Problem_Report_Eng.pdf
- Footnote 250
-
Canadian Council of Motor Transport Administrators. Canada’s Road Safety Strategy 2025 [Internet]. Ottawa, ON: Canadian Council of Motor Transport Administrators; 2015 [cited 2018 Feb 13]. Available from: http://roadsafetystrategy.ca/files/ RSS-2025-Report-January-2016-with%20cover.pdf
- Footnote 251
-
Public Health Agency of Canada (PHAC). Injury in Review 2012 Edition: Spotlight on Road and Transport safety. Ottawa, ON: Public Health Agency of Canada; 2012.
- Footnote 252
-
Public Health Agency of Canada (PHAC). PHAC analysis of 2018 data from the Canadian Vital Statistics: Deaths Database of Statistics Canada. Unpublished internal report; 2019.
- Footnote 253
-
Public Health Agency of Canada (PHAC). PHAC analysis of 2017/2018 data from the Discharge Abstract Database of the Canadian Institute for Health Information [unpublished internal report]; 2018.
- Footnote 254
-
Patton DA, McIntosh AS. Head Impact Biomechanics of “King Hit” Assaults. In: Müller B, Wolf S, editors. Handbook of Human Motion. [e-book] Cham, Switzerland: Springer; 2017. Available from: https://link.springer.com/referencework/10.1007/978-3-319-30808-1 [Accessed 2019 Jan 25].
- Footnote 255
-
Fanslow JL, Norton RN, Spinola CG. Indicators of Assault-Related Injuries Among Women Presenting to the Emergency Department. Ann Emerg Med. 1998;32(3):341–8.
- Footnote 256
-
Ilie G, Adlaf EM, Mann RE, Ialomiteanu A, Hamilton H, Rehm J, et al. Associations between self-reported lifetime history of traumatic brain injuries and current disability assessment in a population sample of Canadian adults. PLoS ONE [Internet]. 2018 [cited 31 Jan 2019];13(1):e0188908. Available from: https://doi.org/10.1371/journal.pone.0188908
- Footnote 257
-
Skinner R, McFaull S, Draca J, Fréchette M, Kaur J, Pearson K, et al. Suicide and self-inflicted injury hospitalizations in Canada (1979 to 2014/15). Health Promot Chronic Dis Prev Can. 2016;36(11):243–51.
- Footnote 258
-
Johnson D, Skinner R, Cappelli M, Zemek R, McFaull S, Langill C, et al. Self-Inflicted Injury-Canadian Hospitals Injury Reporting and Prevention Program (CHIRPP-SI): a new surveillance tool for detecting self-inflicted injury events in emergency departments. Can J Public Health [Internet]. 2018 Oct 11 [cited 31 Jan 2019]; [about 9 p.]. Available from: https://doi.org/10.17269/ s41997-018-0139-1 Subscription required.
- Footnote 259
-
Campeau A, Tonmyr L, Gulbransen E, Herbert M, McFaull S, Skinner R. Sentinel surveillance of cases of child maltreatment presenting to Canadian emergency departments. BMC Pediatr. 2019;19(393):doi:10.1186/s12887-019-1788-9.
- Footnote 260
-
Cloutier P, Skinner R, Cappelli M, Zemek R, Langill C, McFaull S, et al. Is it OK to ask? Public Health Surveillance of Self-Harm in the Emergency Department. J Am Acad Child Psy. 2016;55(10 Suppl.):S249–50.
- Footnote 261
-
Skinner R, McFaull S, Rhodes AE, Bowes M, Rockett IRH. Suicide in Canada: Is Poisoning Misclassification an Issue? Can J Psychiatry. 2016;61(7):405–12.
- Footnote 262
-
Krug EG, Mercy JA, Dahlberg LL, Zwi AB. The World Report on Violence and Health. Lancet. 2002;360(9339):1083–8.
- Footnote 263
-
Mercy JA, Rosenberg ML, Powell KE, Broome CV, Roper WL. Public health policy for preventing violence. Health Aff (Millwood). 1993;12(4):7–29.
- Footnote 264
-
Houry D, Cunningham RM, Hankin A, James T, Bernstein E, Hargarten S. Violence prevention in the emergency department: future research priorities. Acad Emerg Med. 2009;16(11):1089–95.
- Footnote 265
-
Monuteaux MC, Lee L, Fleegler E. Children injured by violence in the United States: emergency department utilization, 2000–2008. Acad Emerg Med 2012;19(5):535–40.
- Footnote 266
-
Meuleners LB, Lee AH, Hendrie D. Interpersonal violence hospitalisations for adolescents: a population-based study. J Paediatr Child Health. 2010;46(11):686–90.
Footnotes
- Footnote a
-
A random sample was coded for legal versus penalizable play, because of the large number of cases (N = 4,641) in the full TBI dataset.