
Report on the enhanced surveillance of antimicrobial-resistant gonorrhea: Results from 2015 - 2017
Download in PDF format
(3.3 MB, 52 pages)
Organization: Public Health Agency of Canada
Published: 2021-02-23
Table of contents
- Abbreviations
- Key Messages
- Introduction
- Methods
- Results
- Discussion
- References
- Appendix A
- Appendix B
- Appendix C
- Appendix D
- Appendix E
Abbreviations
- AMR
- Antimicrobial resistance
- AziR
- Azithromycin resistant Neisseria gonorrhoeae
- CARSS
- Canadian Antimicrobial Surveillance System
- CDC
- US Centers for Disease Control and Prevention
- CeDS
- Neisseria gonorrhoeae with decreased susceptibility to cefixime
- CephDS
- Neisseria gonorrhoeae with decreased susceptibility to cephalosporins
- CGSTI
- Canadian Guidelines on Sexually Transmitted Infections
- CipR
- Ciprofloxacin resistant Neisseria gonorrhoeae
- CMRNG
- Chromosomal Mediated Resistant Neisseria gonorrhoeae
- CNPHI
- Canadian Network for Public Health Intelligence
- CxDS
- Neisseria gonorrhoeae with decreased susceptibility to ceftriaxone
- EryR
- Erythromycin resistant Neisseria gonorrhoeae
- ESAG
- Enhanced Surveillance of Antimicrobial-Resistant Gonorrhea
- GASP
- WHO Gonococcal Antimicrobial Surveillance Programme
- gbMSM
- Gay, bisexual and other men who have sex with men
- GISP
- US Gonococcal Isolate Surveillance Project
- HESA
- House of Commons Standing Committee on Health
- MDR
- Multi-drug resistant
- MIC
- Minimum Inhibitory Concentration
- NAAT
- Nucleic acid amplification test
- NG-MAST
- Neisseria gonorrhoeae multi-antigen sequence typing
- NML
- National Microbiology Laboratory
- PenR
- Penicillin resistant Neisseria gonorrhoeae
- PHAC
- Public Health Agency of Canada
- Por
- Porin gene
- PPNG
- Penicillinase Producing Neisseria gonorrhoeae
- SpecR
- Spectinomycin resistant Neisseria gonorrhoeae
- ST
- Sequence type
- STBBI
- Sexually transmitted bloodborne infection
- STI
- Sexually transmitted infection
- TetR
- Tetracycline resistant Neisseria gonorrhoeae
- TOC
- Test of Cure
- TRNG
- High-level, Plasmid mediated Tetracycline Resistant Neisseria gonorrhoeae
- WGS
- Whole genome sequencing
- WHO
- World Health Organization
- XDR
- Extensively drug resistant
Key Messages
- Currently, Neisseria gonorrhoeae (N. gonorrhoeae), the bacteria that causes gonorrhea, is considered a serious public health threat since it has increasingly developed resistance to antimicrobial drugs recommended as treatment.
- The Public Health Agency of Canada launched the Enhanced Surveillance of Antimicrobial-Resistant Gonorrhea (ESAG) initiative in 2013 to better understand the current trends of antimicrobial-resistant N. gonorrhoeae, and to support the development of treatment guidelines and public health interventions to minimize the spread of antimicrobial resistant gonorrhea in Canada.
- In 2015 and 2016, data were collected from sentinel sites in five jurisdictions: Calgary, Edmonton, Fort McMurray, Winnipeg and Halifax. In 2017, an additional jurisdiction, the Northwest Territories, was added. Almost 95% (2,407/2,544) of the cases in ESAG were from Alberta.
- From 2015 to 2017, ESAG collected 2,544 cultures from 2,120 cases (794 cultures from 668 cases in 2015, 832 cultures from 684 cases in 2016, and 918 cultures from 768 cases in 2017).
- The majority of cases in each year were male (81.9% in 2015, 79.2% in 2016, and 81.4% in 2017) and less than 40 years old (83.8% in 2015, 84.6% in 2016, and 81.5% in 2017). Slightly less than half of the cases were among gay, bisexual and other men who have sex with men (gbMSM) in each year (47.8% in 2015 and 2016, and 45.1% in 2017). Nearly all female cases in all years reported male sexual partners.
- Risk behaviours for ESAG cases saw some sizeable increases from 2015 to 2017, most likely due to better reporting. There was a 197% increase in those reporting sex work in the last 30 days (2.5% in 2015, 3.5% in 2016, and 7.6% in 2017).
- There was a reduction in 2017 in the proportion of isolates with resistance to one or more antimicrobials 58.2% compared to 63.0% in 2015 and 65.8% in 2016.
- The proportion of isolates with decreased susceptibility to cefixime declined from 0.8% in 2015 to 0.3% in 2017 with no isolates showing decreased susceptibility in 2016. Decreased susceptibility to ceftriaxone declined from 1.8% in 2015 to 0.6% in 2016 and 0.4% in 2017. The overall proportion resistant to azithromycin increased from 0.4% in 2015 to 1.9% in 2016 and dropped to 1.6% in 2017.
- Among gbMSM, the preferred therapy of ceftriaxone and azithromycin was consistently prescribed more frequently to treat pharyngeal infections than to treat anogenital infections in all years (90.8% vs 87.5% in 2015; 83.2% vs 82.7% in 2016; and 85.5% vs 80.9% in 2017).
- Adherence to the preferred or alternate treatments recommended by the Canadian Guidelines on Sexually Transmitted InfectionsReference 1 was above 85% for all treatment groups, with the exception of other adults with pharyngeal infections in 2015. In this category, 76.8% of cases received a preferred or alternate treatment in 2015; this proportion rose to 86.7% in 2016 and 86.9% in 2017.
- With regards to molecular typing, ST7638 was the most prevalent sequence type in both 2015 (23.0%) and 2016 (11.4%), while ST5985 (22.4%) was the most prevalent ST in 2017. ST7638 was the primary ST identified among non-gbMSM and females, and isolates from this group are susceptible or have low-level resistance to tetracycline. Although 70% of ST5985 isolates were from non-gbMSM males, it was the primary ST identified among gbMSM males. The majority of these isolates are high-level, plasmid mediated tetracycline resistant N. gonorrhoeae (TRNG).
- Engagement with other provinces/territories is ongoing with respect to potentially joining the Enhanced Surveillance of Antimicrobial-Resistant Gonorrhea project.
Introduction
In Canada and globally, rates of sexually transmitted infections (STI) continue to riseReference 2Reference 3 and remain a serious public health threatReference 4. Gonorrhea is the most commonly reported drug resistant STI and the second most common bacterial STI in Canada with over 29,000 cases reported in 2017Reference 5Reference 6. Worldwide, an estimated 87 million new cases of gonorrhea were reported in 2016Reference 2Reference 7. Over time, the causative organism, Neisseria gonorrhoeae (N. gonorrhoeae), has shown a remarkable ability to acquire antimicrobial resistance (AMR) through various evolutionary adaptationsReference 7Reference 8Reference 9Reference 10Reference 11Reference 12. In 2012, laboratory observed increases in decreased susceptibility to the “last line” class of antibiotic drugs, cephalosporins, along with high levels of resistance to penicillins, sulfonamides, tetracyclines, quinolones and macrolidesReference 13Reference 14 prompted the Public Health Agency of Canada to issue new recommendations for treatment of gonorrhea in the Canadian Guidelines on Sexually Transmitted InfectionsReference 1. Other international health agencies also updated their treatment guidelinesReference 7Reference 10Reference 12Reference 15Reference 16Reference 17. Since then, the recommended first-line treatment for uncomplicated anogenital gonorrhea in gay, bisexual and other men who have sex with men (gbMSM) and pharyngeal gonorrhea in all adults has been combination dual therapy with single doses of ceftriaxone (250 mg) injected intramuscularly (IM) and azithromycin (1 g) ingested orally (PO) Reference 1Reference 10Reference 18. Despite this effort, dual treatment failures have been reported in CanadaReference 19 and worldwideReference 3Reference 8Reference 17 due to high-level resistance.
The World Health Organization (WHO) predicted that drug resistance in N. gonorrhoeae could result in its eventual emergence as a “superbug”Reference 7 and that it could become untreatable due to resistance to all classes of antimicrobialsReference 20. Gonorrhea was listed as one of the three most critical public health threats in the United States by the Director of the US Centers for Disease Control and Prevention (CDC) in 2013Reference 4. The management of antimicrobial resistance has also been identified as a priority in the Public Health Agency of Canada (PHAC)’s Report on Plans and PrioritiesReference 21Reference 22Reference 23, Corporate Risk Profile, Operating Plan, as well as in the Standing Committee of Health (HESA) Study on the Status of Antimicrobial Resistance in Canada and Related RecommendationsReference 24. It has also been highlighted in the Agency’s Canadian Antimicrobial Resistance Surveillance System (CARSS)Reference 25Reference 26 reporting as well as in its Pan-Canadian Framework for Action: Reducing the Health Impact of Sexually Transmitted and Blood-borne Infections in Canada by 2030Reference 27.
The definition of multi-drug resistantFootnote a (MDR-GC) and extensively-drug resistantFootnote b gonococci (XDR-GC) were recently updated to reflect the current Canadian guidelinesReference 14Reference 17. In isolates tested by the NML, the proportion of MDR-GC increased from 6.2% in 2012Reference 13Reference 17 to 12.2% in 2017Reference 9, and the proportion of XDR-GC remained low (less than 1%)Reference 9. Travel-related ceftriaxone-resistant gonorrhea has also been reported in Canada (Quebec, 2017; Alberta, 2018)Reference 28Reference 29Reference 30. The cases were genetically similar to the N. gonorrhoeae Japanese strain FC428 and were related to travel within AsiaReference 14Reference 17Reference 28Reference 29 The 2017 case was successfully treated using the current recommended therapy, while the 2018 case required treatment with gentamicin and azithromycin before being successfully cured, denoting the gravity of gonorrhea becoming an untreatable infectionReference 12Reference 14Reference 28Reference 29.
Antimicrobial resistance testing is an important component of gonococcal (GC) surveillance as it: (i) allows for the identification and characterization of resistant isolates in circulation; and (ii) monitors changes in the proportion of isolates that are resistant, which is vital for informing clinical treatment guidelines. Currently, the regional laboratories in all ten provinces employ culture for a proportion of the total gonorrhea tests done within their jurisdictions, but nucleic acid amplification testing (NAAT) is the preferred testing method for diagnosis in these jurisdictions. The use of culture for antimicrobial resistance (AMR) testing is a standard laboratory practice for all positive gonorrhea isolates detected by culture worldwide, including Canada. However, as the majority of GC cases (70-78%) are not cultured, AMR data are not available for these casesReference 9Reference 17. Most jurisdictions with provincial laboratories that perform culture also perform AMR testing on all positive cultures. Resistant isolates, as well as all isolates from jurisdictions that do not conduct AMR testing, are sent from the provincial/territorial laboratory to the National Microbiology Laboratory (NML) for a standard panel of AMR testing. However, the submission of isolates submitted to the NML varies by jurisdiction, resulting in a lack of representativeness. The NML also performs N. gonorrhoeae multi-antigen sequence typing (NG-MAST) on isolates received as a means to describe the circulating strains of gonorrhea across Canada. Sex, age of patient, province, and anatomic site of isolation are the only epidemiological data collected on these isolates.
Gonorrhea has been a nationally notifiable disease since 1924 in Canada; however, the amount and quality of information collected and reported to PHAC through routine surveillance are limited. Comprehensive national epidemiological data for antimicrobial-resistant gonorrhea isolates are currently not available; limiting the ability to assess risk factors associated with AMR and guide treatment recommendations at a national level. There are also significant difficulties in deriving a valid denominator to estimate the prevalence and patterns of AMR in Canada. The establishment of a pan-Canadian, standardized approach to the surveillance of antimicrobial-resistant gonococci, combining both epidemiologic and laboratory data would provide better representation across the country and greater confidence in the estimation of the proportion of drug-resistant isolates. Coupled with NG-MAST sequence typing and enhancement in data quality, this approach could also provide an opportunity to detect unusual clusters, facilitate timelier outbreak response, and design evidence-informed treatment guidelines.
In 2013, the Centre for Communicable Diseases and Infection Control (CCDIC), in partnership with the NML and three provinces (Alberta, Manitoba and Nova Scotia), launched the pilot phase of the Enhanced Surveillance of Antimicrobial-Resistant Gonorrhea (ESAG). Alberta, which already collected data relevant to N. gonorrhoeae antimicrobial resistance (GC-AMR), was the first participating jurisdiction. Winnipeg and the Capital District Health Authority in Nova Scotia (now the Nova Scotia Health Authority – Central Zone), began collecting data in 2014. Additionally, in 2018, the Northwest Territories joined ESAG.
Project Goal
The overall goal of this integrated epidemiology-laboratory surveillance system is to improve the understanding of current levels and trends of antimicrobial resistant gonorrhea in Canada and to provide better evidence to inform the development of treatment guidelines and public health interventions to minimize the spread of antimicrobial resistant N. gonorrhoeae.
Project Deliverables
The objectives of this surveillance system are to:
- Increase the number of gonococcal cultures performed at participating sentinel sites in order to improve monitoring of gonorrhea AMR;
- Monitor antimicrobial susceptibilities of N. gonorrhoeae among newly diagnosed culture-confirmed gonorrhea cases and cases of potential treatment failureFootnote c;
- Collect additional epidemiological data (demographics and risk factors) on people who provided samples for a gonococcal culture, including newly diagnosed culture-confirmed gonorrhea cases and cases of treatment failure, to determine the risk factors for gonorrhea AMR in these populations;
- Collect data on the drugs prescribed to treat gonorrhea; and
- Identify the sequence types of circulating antimicrobial-resistant N. gonorrhoeae through NG-MAST typing.
Methods
Case Definitions
The national case definition for gonorrhea was used for ESAG cases and consists of laboratory evidence of detection of Neisseria gonorrhoeae by culture or nucleic acid testingReference 31.
An “ESAG case” refers to a patient 16 years of age and older from whom a specimen (or specimens) collected within thirty days that met the national case definition for gonorrhea. All positive cultures from participating sentinel sites were included in ESAG.
The case definition for treatment failure used in ESAG was the absence of sexual contact during the post-treatment period AND one of the following: (1) gram-negative intracellular diplococci at least 72 hours post-treatmentReference 7; (2) positive N. gonorrhoeae culture at least 72 hours post treatment; or (3) positive N. gonorrhoeae NAAT at least 2-3 weeks post treatmentReference 1.
Data Collection
Data were collected from sentinel sites in six jurisdictions: Calgary, Edmonton, Fort McMurray, Winnipeg, Halifax, and the Northwest Territories. Sentinel sites were selected by participating provincial/local health authorities and were sexual health or STI clinics or healthcare providers with the capacity to collect cultures for testing and to provide enhanced epidemiological and clinical data. Cultures were collected by sentinel sites according to their provincial guidelines on gonorrhea testing. Where possible, the number of gonococcal cultures performed was increased in order to improve monitoring of antimicrobial-resistant gonorrhea.
Data were extracted from routine/enhanced case report forms of ESAG-eligible gonorrhea cases reported to public health officials by participating sentinel sites. The data elements collected as part of epidemiological information included information on demographics (e.g., age, sex, site of infection, and province), sexual partner(s) characteristics, risk behaviours, reasons for visit, and treatment. These data were later linked to laboratory testing data from the NML, such as antimicrobial susceptibility and sequence typing data, further described below.
Sentinel sites submitted isolates to provincial public health laboratories for antimicrobial susceptibility testing, which were then forwarded on to the NML where sequence typing and susceptibility testing, on an expanded panel of antimicrobials, were performed. For jurisdictions that rely on the NML for their susceptibility testing, all isolates from the sentinel sites were sent to the NML for testing. Data for isolates that met the eligibility criteria were submitted to ESAG. Epidemiological data were also submitted for all susceptible isolates; however, only a portion of the susceptible isolates were sent to the NML for re-testing.
Both epidemiological and laboratory data were entered or uploaded into a password-protected, web-accessible, jurisdictionally-filtered database hosted on the Canadian Network for Public Health Intelligence (CNPHI) platform. Necessary steps were taken to ensure accurate linkage of epidemiological data, entered by the sentinel sites, to laboratory results, entered by the NML, in this database. A designated ID number, in lieu of that patient's name, was used to link the data.Laboratory Methods
Antimicrobial Susceptibility Testing for Isolates
Minimum inhibitory concentration (MIC), the minimum concentration of antibiotic that will inhibit the growth of the organism, was determined for ceftriaxone, cefixime, azithromycin, ciprofloxacin, erythromycin, penicillin, tetracycline and spectinomycin on all N. gonorrhoeae isolates using agar dilution or, for the Alberta susceptible isolates not sent to the NML, Etest® (BioMerieux, Laval, Quebec). Interpretations were based on the Clinical and Laboratory Standards Institute (CLSI) breakpointsFootnote 32 except for: cefixime decreased susceptibility MIC ≥ 0.25 mg/LReference 7; ceftriaxone decreased susceptibility MIC ≥ 0.125 mg/LReference 7; and erythromycin resistance MIC ≥ 2.0 mg/LReference 33 (refer to Appendix A and Appendix B for details).
Sequence Typing for Isolates
Sequence typing was determined for all cultures submitted to the NML using the N. gonorrhoeae multi-antigen sequence type (NG-MAST) methodReference 34 that incorporates the amplification of the porin gene (por) and the transferrin-binding protein gene (tbpB). DNA sequences of both strands were edited, assembled and compared using DNAStar, Inc. software. The resulting sequences were submitted to the NG-MAST website to determine the sequence types (ST). Concentrated NG-MAST porB and tbpB sequences were aligned using ClustalWReference 35 and a maximum likelihood phylogenetic tree was generated using MEGA 6.06 based on the Tamura-Nei modelReference 36. NG-MAST testing was not performed on the susceptible isolates whose cultures were not submitted to the NML.
Data Analysis
Although ESAG was initiated in 2013, this report is limited to 2015 through 2017 data when all five sites were active participants. Frequencies were calculated for cases with positive cultures. Negative cultures (such as those from a follow-up visit or test-of-cure) were excluded.
For most analyses, only one culture per case was included. When more than one culture per case was submitted, the culture retained for analysis was based on a hierarchy of site of infection: the pharyngeal isolate was prioritized, followed by rectal, urethral, and cervical samples in that order. This hierarchy was determined through consensus with ESAG sites and stakeholders. However, all cultures were retained for analysis when describing the sites of infection overall.
To improve data quality, a derived sexual behaviour variable was created to supplement the self-reported “sex of sexual partner.” In addition to including males who self-reported sexual partner as male or both male and female, the derived “gay, bisexual and other men who have sex with men (gbMSM)” variable includes males who did not provide information on the sex(es) of their sexual partner(s), but had a rectal infection. “Non-gbMSM” was defined as males who either only reported female partners or males who did not report any male sexual partners and did not have a rectal infection. “Male Unknown” refers to males who did not provide sexual partner information, who also did not have a rectal infection. Female and transgender cases were grouped together for antimicrobial susceptibility analysis due to there being only one transgender case, which had a pharyngeal site of infection. In the treatment section, cases are categorized as gbMSM (using the same derived gbMSM definition) and as Other Adults, which matches the categories used in the Canadian Guidelines on Sexually Transmitted InfectionsReference 1 (Other Adults includes non-gbMSM males and females, but excludes males with unknown sexual behaviour).
Table 1 shows how the ESAG data were categorized to arrive at the total number of cultures (including multiple isolates per case), and the total number of cases.
| Jurisdiction | Primary Culture | Duplicate Cultures | All Cultures | |||||||||
|---|---|---|---|---|---|---|---|---|---|---|---|---|
| 2015 | 2016 | 2017 | Overall | 2015 | 2016 | 2017 | Overall | 2015 | 2016 | 2017 | Overall | |
| Alberta | 641 | 629 | 726 | 1,996 | 123 | 143 | 145 | 411 | 764 | 772 | 871 | 2,407 |
| Manitoba | 12 | 23 | 8 | 43 | 3 | 3 | 2 | 8 | 15 | 26 | 10 | 51 |
| Nova Scotia | 14 | 28 | 29 | 71 | 0 | 2 | 3 | 5 | 14 | 30 | 32 | 76 |
| Northwest Territories | 1 | 4 | 5 | 10 | 0 | 0 | 0 | 0 | 1 | 4 | 5 | 10 |
| Total | 668 | 684 | 768 | 2,120 | 126 | 148 | 150 | 424 | 794 | 832 | 918 | 2,544 |
Results
Case Characteristics
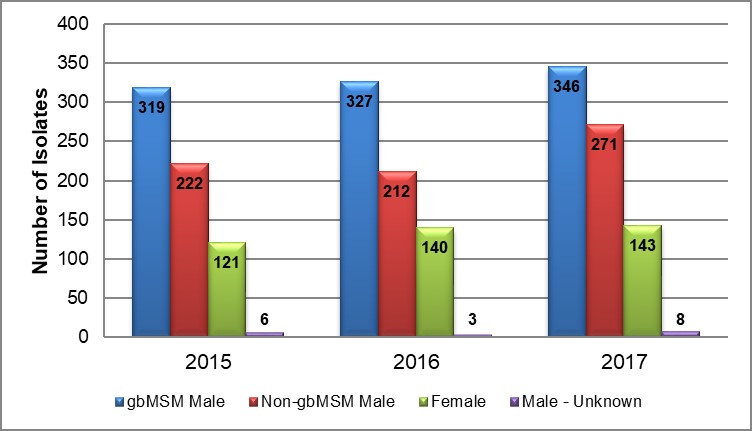
The proportion of gbMSM males to non-gbMSM males remained relatively constant from 2015 to 2017, with a ratio of 1.4:1 in 2015, 1.5:1 in 2016 and 1.3:1 in 2017. The proportion of males to females also remained relatively constant in both 2015 and 2017, after a slight decrease in 2016, with a ratio of 4.5:1 in 2015, 3.9:1 in 2016 and 4.4:1 in 2017 (Table 2 and Figure 1).
| Sex or Sexual Behaviour | Alberta | Manitoba | Nova Scotia | Northwest Territories | Overall | ||||||||||
|---|---|---|---|---|---|---|---|---|---|---|---|---|---|---|---|
| 2015 | 2016 | 2017 | 2015 | 2016 | 2017 | 2015 | 2016 | 2017 | 2015 | 2016 | 2017 | 2015 | 2016 | 2017 | |
| gbMSM Male | 307 | 297 | 331 | 5 | 13 | 1 | 7 | 17 | 14 | 0 | 0 | 0 | 319 | 327 | 346 |
| (47.9) | (47.2) | (45.6) | (41.7) | (56.5) | (12.5) | (50.0) | (60.7) | (48.3) | (0.0) | (0.0) | (0.0) | (47.8) | (47.8) | (45.1) | |
| Non-gbMSM Male | 217 | 202 | 261 | 5 | 3 | 0 | 0 | 3 | 7 | 0 | 4 | 3 | 222 | 212 | 271 |
| (33.9) | (32.1) | (36.0) | (41.7) | (13.0) | (0.0) | (0.0) | (10.7) | (24.1) | (0.0) | (100.0) | (60.0) | (33.2) | (31.0) | (35.3) | |
| Female | 116 | 127 | 132 | 1 | 5 | 1 | 4 | 8 | 8 | 0 | 0 | 2 | 121 | 140 | 143 |
| (18.1) | (20.2) | (18.2) | (8.3) | (21.7) | (12.5) | (28.6) | (28.6) | (27.6) | (0.0) | (0.0) | (40.0) | (18.1) | (20.5) | (18.6) | |
| Male - Unknown | 1 | 2 | 2 | 1 | 1 | 6 | 3 | 0 | 0 | 1 | 0 | 0 | 6 | 3 | 8 |
| (0.2) | (0.3) | (0.3) | (8.3) | (4.3) | (75.0) | (21.4) | (0.0) | (0.0) | (100.0) | (0.0) | (0.0) | (0.9) | (0.4) | (1.0) | |
| Total | 641 | 629 | 726 | 12 | 23 | 8 | 14 | 28 | 29 | 1 | 4 | 5 | 668 | 684 | 768 |
|
|||||||||||||||
Figure 1. Breakdown of ESAG isolates by year and sex or sexual behaviour, ESAG 2015-2017
Text description
The bar chart presents the number of ESAG isolates demonstrating either decreased susceptibility or resistance to selected antimicrobials by year and sex or sexual behaviour groupings. The horizontal axis represents the year while the vertical axis represents the number of isolates.
| Sex or Sexual Behaviour | 2015 | 2016 | 2017 |
|---|---|---|---|
| gbMSM male | 319 | 327 | 346 |
| Non-gbMSM male | 222 | 212 | 271 |
| Female | 121 | 140 | 143 |
| Male unknown | 6 | 3 | 8 |
From 2015 to 2017, ESAG captured 2,544 cultures from 2,120 cases. Twenty percent (n=424) of these cases had multiple (two or three) positive isolates from different sites of infection (Table 1). The age distribution was very similar in all years. From 2015 to 2017, the majority of cases were less than 40 years old (83.8% in 2015, 84.6% in 2016, and 81.5% in 2017) and the mean ages were 30.6 years in 2015, 31.3 years in 2016, and 32.6 in 2017. The largest increase was in the 35 to 39 year age group (81% increase from 2015 to 2017) (Table 3).
Risk behaviours for ESAG cases increased in 2017 with 7.6% reporting sex work in the last 60 days and 9.5% indicating that it was likely that they acquired the infection while travelling out of province (Table 3). This represents a 197% increase in those reporting sex work and a 1487% increase in those reporting travel-related infection, compared to 2015. These increases are most likely due to better reporting in 2017 when more information about out-of-province travel was collected more consistently in the reporting jurisdictions.
| Case Characteristics | 2015 | 2016 | 2017 | |||
|---|---|---|---|---|---|---|
| N | % | N | % | N | % | |
| Age | ||||||
| 16 - 19 years | 48 | 7.2 | 35 | 5.1 | 28 | 3.6 |
| 20 - 24 years | 150 | 22.5 | 129 | 18.9 | 109 | 14.2 |
| 25 - 29 years | 183 | 27.4 | 195 | 28.5 | 205 | 26.7 |
| 30 - 34 years | 121 | 18.1 | 150 | 21.9 | 163 | 21.2 |
| 35 - 39 years | 58 | 8.7 | 70 | 10.2 | 121 | 15.8 |
| 40 - 44 years | 33 | 4.9 | 34 | 5.0 | 58 | 7.6 |
| 45 - 49 years | 32 | 4.8 | 23 | 3.4 | 34 | 4.4 |
| 50 - 54 years | 17 | 2.5 | 26 | 3.8 | 22 | 2.9 |
| 55 - 59 years | 13 | 1.9 | 12 | 1.8 | 17 | 2.2 |
| 60+ years | 13 | 1.9 | 10 | 1.5 | 11 | 1.4 |
| Total | 668 | 684 | 768 | |||
| Sex Work | ||||||
| Yes | 17 | 2.5 | 24 | 3.5 | 58 | 7.6 |
| No | 646 | 96.7 | 631 | 92.3 | 661 | 86.1 |
| Refused to answer | 0 | 0.0 | 0 | 0.0 | 3 | 0.4 |
| Unknown | 5 | 0.7 | 29 | 4.2 | 18 | 2.3 |
| Total | 668 | 684 | 768 | |||
| Travel-Related Infection | ||||||
| Yes | 4 | 0.6 | 2 | 0.3 | 73 | 9.5 |
| No | 660 | 98.8 | 5 | 0.7 | 19 | 2.5 |
| Unknown | 4 | 0.6 | 677 | 99.0 | 676 | 88.0 |
| Total | 668 | 684 | 768 | |||
|
||||||
Reason for Visit
Among gbMSM, the primary reason for the initial clinic visit in all years was in response to signs/symptoms increasing from 41.7% in 2015 to 56.6% in 2017. There was a 50% decrease in visits due to case contact between 2015 and 2017 (from 30.1% to 15.0%, respectively). gbMSM were the group with the highest level of STI screening, accounting for approximately one-quarter of visits in all three years compared to less than 3% among non-gbMSM and approximately one-fifth among females. Non-gbMSM, conversely, rarely identified screening as the reason for seeking care; signs/symptoms remained the primary reason for non-gbMSM male visits in all years, accounting for more than 88% of cases in each year. The primary reason for visits among females was in response to signs/symptoms in 2016 (52.9%) and 2017 (54.5%), compared to case contact in 2015 (42.1%), with corresponding increases in the “unknown” and “other” categories (Table 4).
| Reason for Initial Visit | 2015 | 2016 | 2017 | Overall | ||||
|---|---|---|---|---|---|---|---|---|
| N | % | N | % | N | % | N | % | |
| gbMSM Male | ||||||||
| Signs/Symptoms | 133 | 41.7 | 159 | 48.6 | 196 | 56.6 | 488 | 49.2 |
| Case Contact | 96 | 30.1 | 64 | 19.6 | 52 | 15.0 | 212 | 21.4 |
| STI Screening | 74 | 23.2 | 84 | 25.7 | 86 | 24.9 | 244 | 24.6 |
| Unknown | 8 | 2.5 | 7 | 2.1 | 3 | 0.9 | 18 | 1.8 |
| OtherTable 4 Footnote a | 0 | 0.0 | 0 | 0.0 | 7 | 2.0 | 7 | 0.7 |
| Total | 319 | 327 | 346 | 992 | ||||
| Non-gbMSM Male | ||||||||
| Signs/Symptoms | 196 | 88.3 | 192 | 90.6 | 258 | 95.2 | 646 | 91.6 |
| Case Contact | 16 | 7.2 | 7 | 3.3 | 4 | 1.5 | 27 | 3.8 |
| STI Screening | 5 | 2.3 | 1 | 0.5 | 5 | 1.8 | 11 | 1.6 |
| Unknown | 0 | 0.0 | 5 | 2.4 | 1 | 0.4 | 6 | 0.9 |
| OtherTable 4 Footnote a | 0 | 0.0 | 0 | 0.0 | 0 | 0.0 | 0 | 0.0 |
| Total | 222 | 212 | 271 | 705 | ||||
| Female | ||||||||
| Signs/Symptoms | 47 | 38.8 | 74 | 52.9 | 78 | 54.5 | 199 | 49.3 |
| Case Contact | 51 | 42.1 | 27 | 19.3 | 22 | 15.4 | 100 | 24.8 |
| STI Screening | 16 | 13.2 | 31 | 22.1 | 22 | 15.4 | 69 | 17.1 |
| Unknown | 1 | 0.8 | 2 | 1.4 | 11 | 7.7 | 14 | 3.5 |
| OtherTable 4 Footnote a | 0 | 0.0 | 0 | 0.0 | 7 | 4.9 | 7 | 1.7 |
| Total | 121 | 140 | 143 | 404 | ||||
| OverallTable 4 Footnote b | ||||||||
| Signs/Symptoms | 377 | 56.4 | 425 | 62.1 | 532 | 69.3 | 1,334 | 62.9 |
| Case Contact | 164 | 24.6 | 98 | 14.3 | 78 | 10.2 | 340 | 16.0 |
| STI Screening | 95 | 14.2 | 116 | 17.0 | 113 | 14.7 | 324 | 15.3 |
| Unknown | 9 | 1.3 | 16 | 2.3 | 15 | 2.0 | 40 | 1.9 |
| OtherTable 4 Footnote a | 0 | 0.0 | 0 | 0.0 | 14 | 1.8 | 14 | 0.7 |
| TotalTable 4 Footnote c | 668 | 684 | 768 | 2,120 | ||||
|
||||||||
Site of Infection
From 2015 to 2017, there were 2,544 isolates from 2,120 culture-confirmed gonorrhea cases. Anatomic site samples were based on provincial screening guidelines or exposure. Isolates from female cases were primarily genital (47.0% in 2015, 46.4% in 2016 and 41.0% in 2017). Infections from non-gbMSM males were almost exclusively genital in all years (>95% each year). Isolates from gbMSM males were fairly equally distributed among the rectum, genital and pharynx in all three years but with a greater proportion of rectal isolates in 2015 (37.1%) and 2016 (41.4%) by a small margin (Table 5).
| Sex or Sexual Behaviour | 2015 | 2016 | 2017 | Overall | ||||
|---|---|---|---|---|---|---|---|---|
| N | % | N | % | N | % | N | % | |
| gbMSM Male | ||||||||
| Rectum | 147 | 37.1 | 164 | 41.4 | 144 | 33.7 | 455 | 37.3 |
| Pharynx | 119 | 30.1 | 105 | 26.5 | 145 | 34.0 | 369 | 30.3 |
| Genital | 130 | 32.8 | 127 | 32.1 | 138 | 32.3 | 395 | 32.4 |
| Total | 396 | 100 | 396 | 100 | 427 | 100 | 1,219 | 100 |
| Non-gbMSM Male | ||||||||
| Rectum | 0 | 0.0 | 5 | 2.3 | 1 | 0.4 | 6 | 0.8 |
| Pharynx | 4 | 1.8 | 7 | 3.2 | 5 | 1.8 | 16 | 2.2 |
| Genital | 220 | 98.2 | 207 | 94.5 | 267 | 97.8 | 694 | 96.9 |
| Total | 224 | 100 | 219 | 100 | 273 | 100 | 716 | 100 |
| Female | ||||||||
| Rectum | 37 | 22.0 | 54 | 25.8 | 62 | 30.0 | 153 | 26.2 |
| Pharynx | 52 | 31.0 | 58 | 27.8 | 59 | 28.5 | 169 | 28.9 |
| Genital | 79 | 47.0 | 97 | 46.4 | 85 | 41.0 | 261 | 44.7 |
| Other table 5 Footnote b | 0 | 0.0 | 0 | 0.0 | 1 | 0.5 | 1 | 0.2 |
| Total | 168 | 100 | 209 | 100 | 207 | 100 | 584 | 100 |
| Overall table 5 Footnote c | ||||||||
| Rectum | 184 | 23.2 | 226 | 27.2 | 210 | 22.9 | 620 | 24.4 |
| Pharynx | 177 | 22.3 | 173 | 20.8 | 211 | 23.0 | 561 | 22.1 |
| Genital | 433 | 54.5 | 432 | 51.9 | 496 | 54.0 | 1,361 | 53.5 |
| Other table 5 Footnote b | 0 | 0.0 | 1 | 0.1 | 1 | 0.1 | 2 | 0.0 |
| Grand Total | 794 | 100 | 832 | 100 | 918 | 100 | 2,544 | 100 |
|
||||||||
Antimicrobial Susceptibility
Overall, 37.0% (247/668) of the 2015 isolates, 34.2% (234/684) of the 2016 isolates and 41.8% (321/768) of the 2017 isolates were susceptible to all antimicrobials. The proportion of the 2015-2017 isolates that demonstrated decreased susceptibility or resistance to only one antimicrobial was 27.1% (181/668), 23.7% (162/684), and 38.7% (297/768) respectively. The proportion of 2015-2017 isolates that demonstrated decreased susceptibility or resistance to two or more antimicrobials was 35.9% (240/668), 42.1% (288/684), and 19.5% (150/768) respectively. (Table 6 and Figure 2).
| Susceptibility | Alberta | Manitoba | Nova Scotia | Northwest Territories | Overall | ||||||||||
|---|---|---|---|---|---|---|---|---|---|---|---|---|---|---|---|
| 2015 | 2016 | 2017 | 2015 | 2016 | 2017 | 2015 | 2016 | 2017 | 2015 | 2016 | 2017 | 2015 | 2016 | 2017 | |
| Susceptible to all | 240 | 219 | 305 | 4 | 6 | 2 | 3 | 8 | 13 | 0 | 1 | 1 | 247 | 234 | 321 |
| (37.4) | (34.8) | (42.0) | (30.8) | (26.1) | (25.0) | (21.4) | (28.6) | (44.8) | (0.0) | (25.0) | (20.0) | (37.0) | (34.2) | (41.8) | |
| R/DSTable 6 Footnote a to one | 172 | 144 | 288 | 4 | 11 | 2 | 5 | 7 | 7 | 1 | 0 | 0 | 181 | 162 | 297 |
| (26.8) | (22.9) | (39.7) | (30.8) | (47.8) | (25.0) | (35.7) | (25.0) | (24.1) | (100.0) | (0.0 | (0.0 | (27.1) | (23.7) | (38.7) | |
| R/DSTable 6 Footnote a to two or more | 229 | 266 | 133 | 5 | 6 | 4 | 6 | 13 | 9 | 0 | 3 | 4 | 240 | 288 | 150 |
| (35.7) | (42.3) | (18.3) | (38.5) | (26.1) | (50.0) | (42.9) | (46.4) | (31.0) | (0.0) | (75.0) | (80.0) | (35.9) | (42.1) | (19.5) | |
| Total | 641 | 629 | 726 | 13 | 23 | 8 | 14 | 28 | 29 | 1 | 4 | 5 | 668 | 684 | 768 |
|
|||||||||||||||
Figure 2. Drug resistance and decreased susceptibility to selected antimicrobials, ESAG 2015-2017
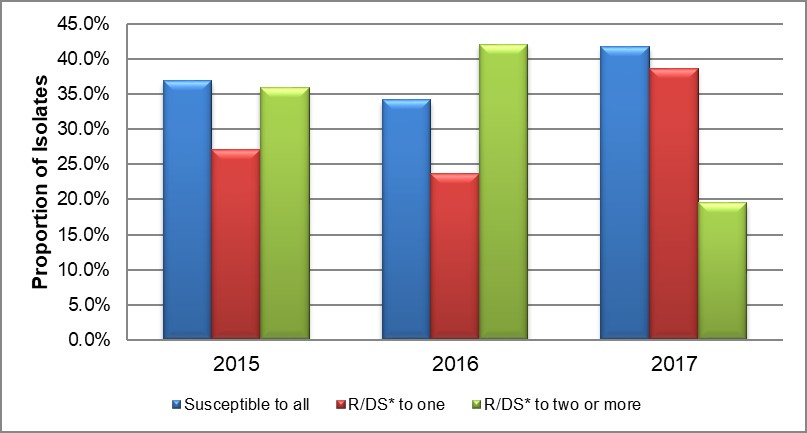
*R/DS: Resistance or Decreased Susceptibility
Text description
The bar chart presents the proportion of isolates that were either susceptible to all antimicrobials tested or demonstrated resistance or decreased susceptibility to one or more antimicrobials. The horizontal axis represents the year while the vertical axis represents the proportion of isolates.
| Susceptibility | 2015 | 2016 | 2017 |
|---|---|---|---|
| Susceptible to all | 37.0 | 34.2 | 41.8 |
| Resistant/Decreased susceptibility to one | 27.1 | 23.7 | 38.7 |
| Resistant/Decreased susceptibility to two or more | 35.9 | 42.1 | 19.5 |
CefiximeFootnote d
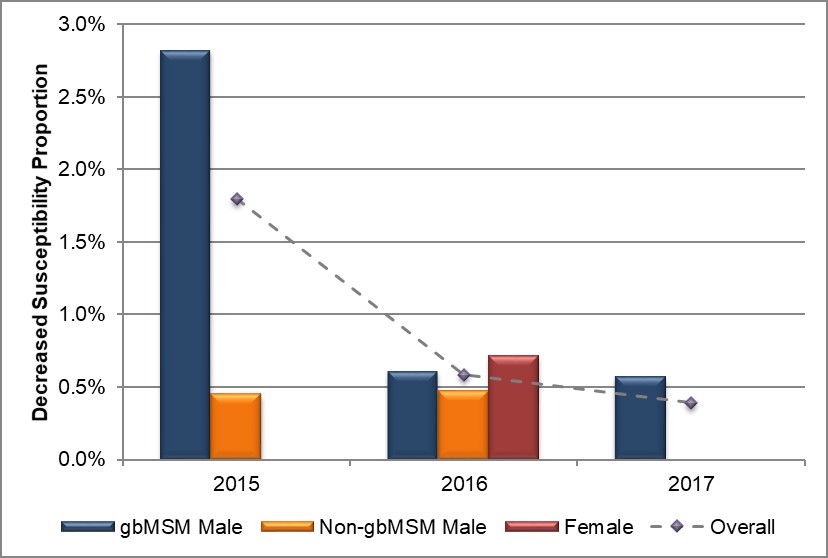
Overall, 0.8% (6/794) of isolates had decreased susceptibility to cefixime (MIC ≥ 0.25 mg/L) in 2015, declining to 0.3% (2/918) in 2017 with no isolates demonstrating decreased susceptibility in 2016 (Table 7, Appendix C and Appendix D). Seventy-five percent (6/8) of all isolates demonstrating decreased susceptibility were from Alberta with the remaining two isolates coming from Manitoba (1/8) and Nova Scotia (1/8). In 2015, 0.8% (3/396) of isolates from gbMSM and 0.4% (1/224) from non-gbMSM had decreased susceptibility to cefixime which dropped to 0.3% (1/348) and 0% (0/271) respectively in 2017, The proportion of female isolates demonstrating decreased susceptibility to cefixime increased to 0.7% (1/144) in 2017 from 0% in both 2015 and 2016 (Figure 3, Table 7, Table 8, Appendix C and Appendix D).
The proportion of pharyngeal isolates demonstrating decreased susceptibility to cefixime amongst all males dropped to 0.7% (1/152) in 2017 from 3.2% (4/125) in 2015 with zero cases reported in 2016. Among females, the proportion of decreased susceptibility to cefixime for pharyngeal isolates increased from 0% in both 2015 and 2016 to 1.7% (1/59) in 2017 (Figure 4, Table 8 and Appendix D).
Figure 3. Distribution of decreased susceptibility to cefixime by sex or sexual behaviour, ESAG 2015-2017
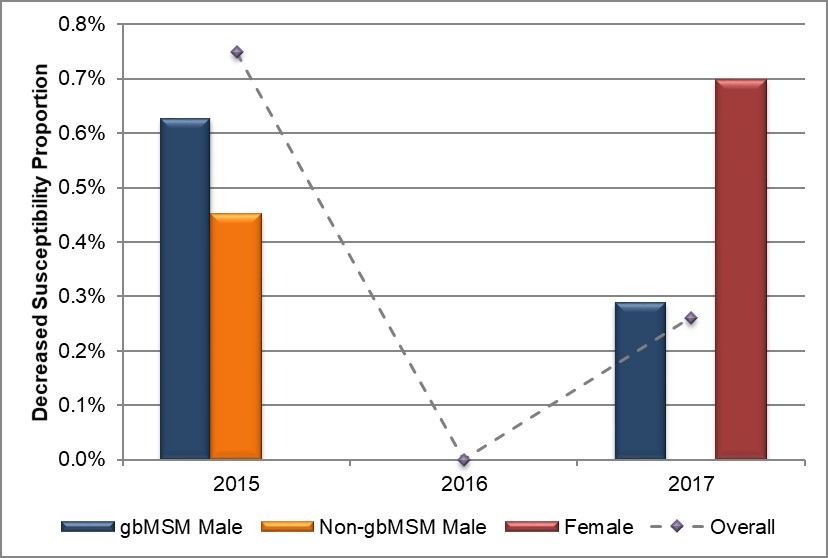
Text description
The bar chart presents the proportion of ESAG isolates with decreased susceptibility to cefixime by sex or sexual behaviour groupings. The horizontal axis represents the year while the vertical axis represents the decreased susceptibility proportion.
| Sex or Sexual Behaviour | 2015 | 2016 | 2017 |
|---|---|---|---|
| gbMSM male | 0.6 | 0.0 | 0.3 |
| Non-gbMSM male | 0.5 | 0.0 | 0.0 |
| Female | 0.0 | 0.0 | 0.7 |
| Overall | 0.7 | 0.0 | 0.3 |
Figure 4. Distribution of decreased susceptibility to cefixime by sex and infection site, ESAG 2015-2017
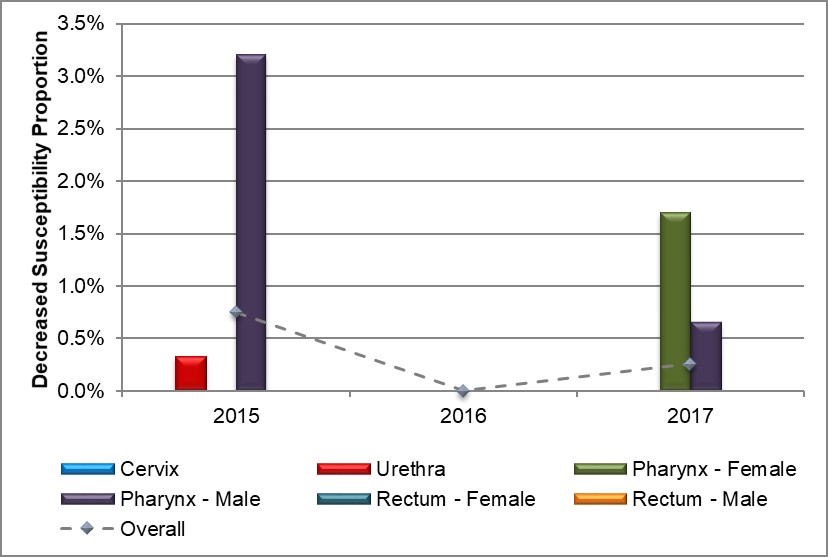
Text description
The bar chart presents the proportion of ESAG isolates with decreased susceptibility to cefixime by sex and infection site groupings. The horizontal axis represents the year while the vertical axis represents the decreased susceptibility proportion.
| Sex or Sexual Behaviour and Infection Site | 2015 | 2016 | 2017 |
|---|---|---|---|
| Cervix | 0.0 | 0.0 | 0.0 |
| Urethra | 0.3 | 0.0 | 0.0 |
| Pharynx – Female | 0.0 | 0.0 | 1.7 |
| Pharynx – Male | 3.2 | 0.0 | 0.7 |
| Rectum – Female | 0.0 | 0.0 | 0.0 |
| Rectum – Male | 0.0 | 0.0 | 0.0 |
| Overall | 0.7 | 0.0 | 0.3 |
CeftriaxoneFootnote d
Overall, 1.8% (14/794) of ESAG isolates had decreased susceptibility to ceftriaxone in 2015, dropping to 0.6% (4/684) in 2016 and 0.4% (3/771) in 2017 (Table 7, Appendix C and Appendix D). Eighty-eight percent (18/21) of all isolates demonstrating decreased susceptibility were from Alberta, 10% (2/21) were from Manitoba and the remaining 5% (1/21) were from Nova Scotia. There was an 80% decrease in occurrence of decreased susceptibility to ceftriaxone in isolates obtained from gbMSM males from 2.8% (11/396) to 0.6% in both 2016 and 2017 (2/327 and 2/348 respectively). There was only one ESAG isolate from a female demonstrating decreased susceptibility to ceftriaxone in 2016 (0.7%), with no isolates in either 2015 or 2017 (Figure 5, Table 7, Table 8, Appendix C and Appendix D).
The proportion of pharyngeal isolates demonstrating decreased susceptibility to ceftriaxone among males dropped to 1.3% (2/152) in 2017 from 6.4% (8/125) in 2015 with no cases reported in 2016. The proportion of rectal isolates from females was 2.9% (1/35) in 2016 with zero cases reported in both 2015 and 2017 (Figure 6 and Appendix D).
Figure 5. Distribution of decreased susceptibility to ceftriaxone by sex or sexual behaviour, ESAG 2015-2017
Text description
The bar chart presents the proportion of ESAG isolates with decreased susceptibility to ceftriaxone by sex or sexual behaviour groupings. The horizontal axis represents the year while the vertical axis represents the decreased susceptibility proportion.
| Sex or Sexual Behaviour | 2015 | 2016 | 2017 |
|---|---|---|---|
| gbMSM male | 2.8 | 0.6 | 0.6 |
| Non-gbMSM male | 0.5 | 0.5 | 0.0 |
| Female | 0.0 | 0.7 | 0.0 |
| Overall | 1.8 | 0.6 | 0.4 |
Figure 6. Distribution of decreased susceptibility to ceftriaxone by sex and infection site, ESAG 2015-2017
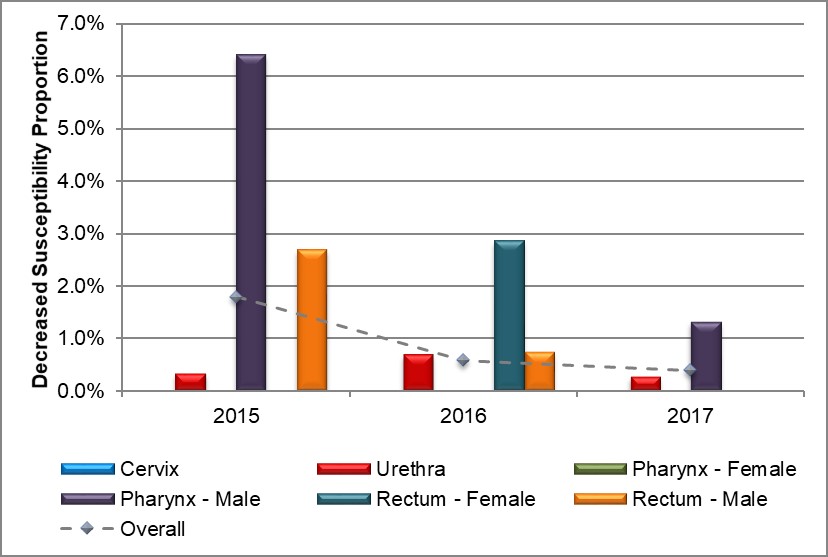
Text description
The bar chart presents the proportion of ESAG isolates with decreased susceptibility to ceftriaxone by sex and infection site groupings. The horizontal axis represents the year while the vertical axis represents the decreased susceptibility proportion.
| Sex or Sexual Behaviour and Infection Site | 2015 | 2016 | 2017 |
|---|---|---|---|
| Cervix | 0.0 | 0.0 | 0.0 |
| Urethra | 0.3 | 0.7 | 0.3 |
| Pharynx – Female | 0.0 | 0.0 | 0.0 |
| Pharynx – Male | 6.4 | 0.0 | 1.3 |
| Rectum – Female | 0.0 | 2.9 | 0.0 |
| Rectum – Male | 2.7 | 0.7 | 0.0 |
| Overall | 1.8 | 0.6 | 0.4 |
AzithromycinFootnote d
In 2015, 0.4% (3/794) of all isolates obtained from ESAG cases were resistant to azithromycin. The proportion increased to 1.9% (13/684) in 2016 and 1.6% (12/771) in 2017 (Table 7, Appendix C and Appendix D). Due to the sample size, almost 90% (25/28) of all azithromycin isolates identified were from Alberta, with the remaining three isolates identified as coming from Nova Scotia in 2016 (Table 7). The proportion of azithromycin resistant isolates from gbMSM males increased from 0.3% (1/396) in 2015 to 2.3% (8/348) in 2017. In isolates from non-gbMSM males, the proportion increased slightly from 0.4% (1/224) in 2015 to 0.7% (2/271) in 2017, with no isolates in 2016. The proportion of isolates from females increased from 0.6% (1/168) in 2015 to 2.9% (4/140) in 2016, before dropping to 1.4% (2/144) in 2017 (Figure 7, Table 7, Table 8, Appendix C and Appendix D).
The proportion of pharyngeal isolates resistant to azithromycin among males increased to 3.9% (6/152) from 3.6% (4/111) in 2016 with no isolates resistant to azithromycin in 2015. Conversely, the proportion of pharyngeal isolates from females experienced a slight decrease throughout the three years (1.9% (1/52) in 2015; 1.8% (1/57) in 2016, and 1.7% (1/59) in 2017). There were no anogenital isolates resistant to azithromycin among females in 2015, however, in 2016, 6.3% (3/48) of cervical isolates were resistant to azithromycin, dropping to 2.6% (1/39) in 2017 (Figure 8, Table 8 and Appendix D). Males with anogenital isolates resistant to azithromycin saw a decrease in 2017 to 0.8% (4/475) from 1.2% (5/431) in 2016 and 0.4% (2/501) in 2015 (Figure 8, Table 8 and Appendix D).
Figure 7. Distribution of azithromycin resistance by sex or sexual behaviour, ESAG 2015-2017
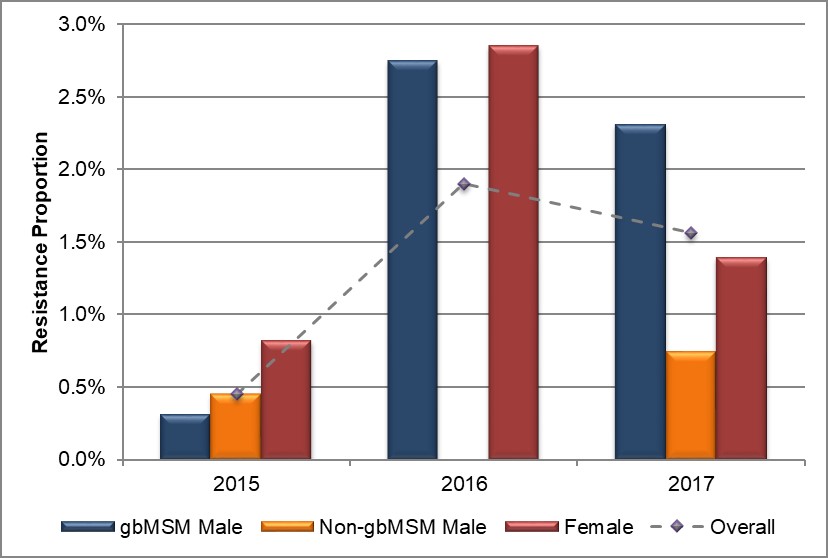
Text description
The bar chart presents the proportion of ESAG isolates with resistance to azithromycin by sex or sexual behaviour groupings. The horizontal axis represents the year while the vertical axis represents the resistance proportion.
| Sex or Sexual Behaviour | 2015 | 2016 | 2017 |
|---|---|---|---|
| gbMSM male | 0.3 | 2.8 | 2.3 |
| Non-gbMSM male | 0.5 | 0.0 | 0.7 |
| Female | 0.8 | 2.9 | 1.4 |
| Overall | 0.4 | 1.9 | 1.6 |
Figure 8. Distribution of azithromycin resistance by sex and infection site, ESAG 2015-2017
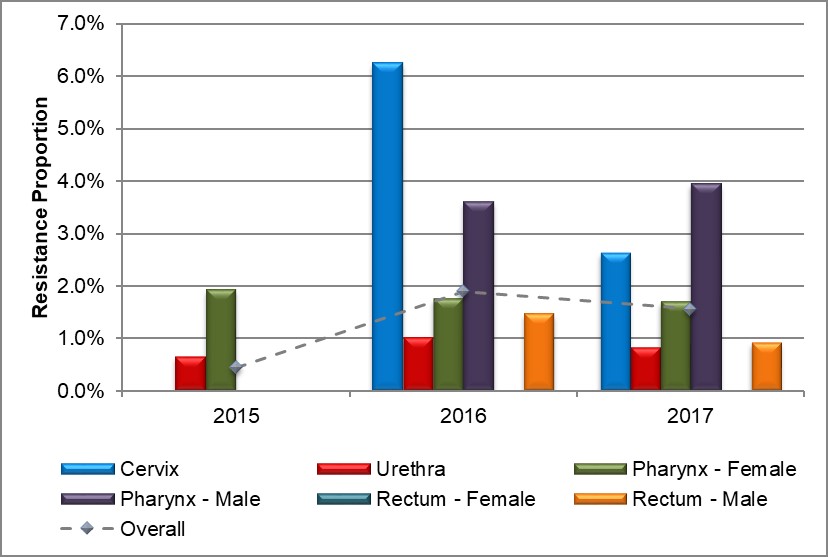
Text description
The bar chart presents the proportion of ESAG isolates with resistance to azithromycin by sex and infection site groupings. The horizontal axis represents the year while the vertical axis represents the resistance proportion.
| Sex or Sexual Behaviour and Infection Site | 2015 | 2016 | 2017 |
|---|---|---|---|
| Cervix | 0.0 | 6.3 | 2.6 |
| Urethra | 0.6 | 1.0 | 0.8 |
| Pharynx – Female | 1.9 | 1.8 | 1.7 |
| Pharynx – Male | 0.0 | 3.6 | 3.9 |
| Rectum – Female | 0.0 | 0.0 | 0.0 |
| Rectum – Male | 0.0 | 1.5 | 0.9 |
| Overall | 0.4 | 1.9 | 1.6 |
The Canadian Guidelines on Sexually Transmitted InfectionsReference 1 recommend combination therapy with 250 mg ceftriaxone injected intramuscularly (IM) and azithromycin 1 g orally (PO) as a first-line treatment for uncomplicated anogenital and pharyngeal gonorrhea infections in adults. The guidelines also recommended combination therapy of 800 mg cefixime orally (PO) and azithromycin 1 g orally (PO) for other adults with anogenital infections. The Agency's National Microbiology Laboratory tests for resistance to these key antimicrobials as well as a standard panel of other antimicrobials. Results for these are below.
Ciprofloxacin
The prevalence of ciprofloxacin resistance was 30.1% (239/794) in 2015 increasing to 43.4% (297/684) in 2016, before dropping to 27.9% (215/771) in 2017. A large increase was seen in isolates obtained from females (13/1% in 2015 to 25.0% in 2017) and non-gbMSM (13.9% in 2015 to 24.7% in 2017), while the proportion of isolates from gbMSM males experienced a 34% decrease (46.5% to 31.3%) (Figure 9 and Appendix C).
Tetracycline
Nearly 60% of the isolates in 2015 and 2016 were resistant to tetracycline (477/794 in 2015 and 388/684 in 2016), decreasing to 42.5% (328/771) in 2017. A large increase was seen in isolates from females (44.0% in 2015, 53.6% in 2016 and 54.9% in 2017) (Figure 9 and Appendix C).
Penicillin
Roughly 15% of isolates from ESAG cases were resistant to penicillin in 2015 (120/794) and 2016 (102/684) in 2016, which decreased to 5.7% (44/771) in 2017. The only group which saw an increase was females which increased from 5.4% (9/168) in 2015 to 19.3% (27/140) in 2016, before decreasing to 6.9% (10/144) in 2017. The largest decrease was seen in isolates from gbMSM males, which saw steady decreases from 2015 to 2017 (21.5%, 13.5% and 5.2% respectively) (Figure 9 and Appendix C).
Erythromycin
Resistance to erythromycin remained fairly constant from 2015 to 2016 with 26.5% (211/794) of isolates exhibiting resistance in 2015 and 25.7% (176/684) in 2016. There was an almost 50% decrease in 2017 with 13.5% (104/771) of isolates exhibiting resistance to erythromycin. This decrease mostly came from isolates from gbMSM cases, where a decrease from 42.4% (168/396) in 2015 to 30.0% (98/327) in 2016 and 14.9% (52/348) in 2017 was seen (Figure 9 and Appendix C).
Spectinomycin
No resistance to spectinomycin was identified in any of the submitted isolates from 2015 to 2017 (Figure 9 and Appendix C).
Multidrug Resistance
In all years, isolates that had decreased susceptibility to cefixime and/or ceftriaxone were also resistant to one or more other antimicrobials; however, none of these isolates was resistant to azithromycin.
Figure 9. Decreased susceptibility and resistance proportions to selected antimicrobials by province/territory, ESAG 2015-2017
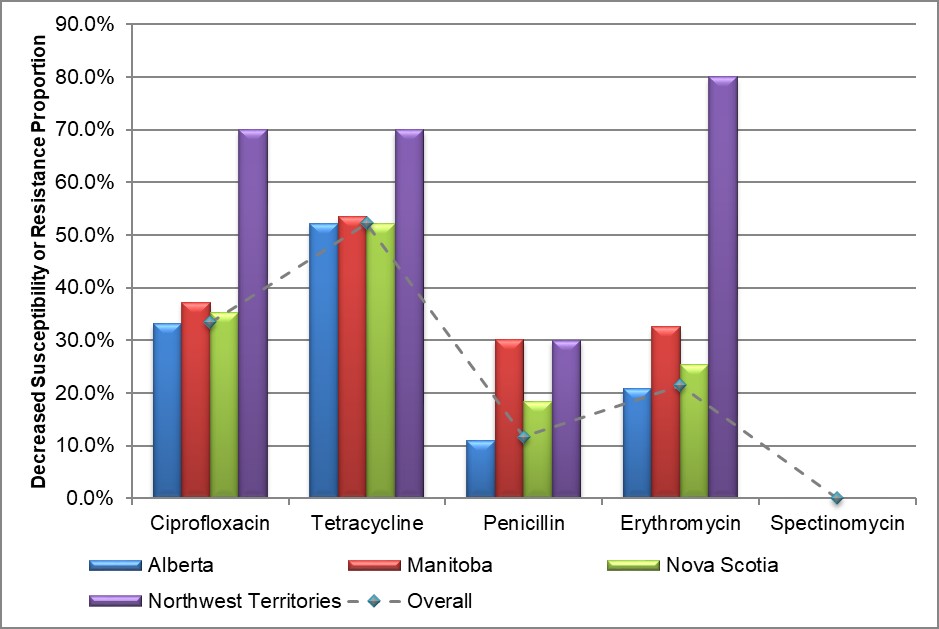
Text description
The bar chart presents to proportion of ESAG isolates with decreased susceptibility or resistance to ciprofloxacin, tetracycline, penicillin, erythromycin and spectinomycin by province/territory. The horizontal axis represents the antimicrobial while the vertical axis represents the decreased susceptibility or resistance proportion.
| Province/Territory | Ciprofloxacin | Tetracycline | Penicillin | Erythromycin | Spectinomycin |
|---|---|---|---|---|---|
| Alberta | 33.1 | 52.2 | 11.0 | 20.8 | 0.0 |
| Manitoba | 37.2 | 53.5 | 30.2 | 32.6 | 0.0 |
| Nova Scotia | 35.2 | 52.1 | 18.3 | 25.4 | 0.0 |
| Northwest Territories | 70.0 | 70.0 | 30.0 | 80.0 | 0.0 |
| Overall | 33.4 | 52.3 | 11.7 | 21.5 | 0.0 |
| Sex or Sexual Behaviour | Alberta | Manitoba | Nova Scotia | Northwest Territories | Overall | ||||||||||
|---|---|---|---|---|---|---|---|---|---|---|---|---|---|---|---|
| CefiximeDS | 2015 | 2016 | 2017 | 2015 | 2016 | 2017 | 2015 | 2016 | 2017 | 2015 | 2016 | 2017 | 2015 | 2016 | 2017 |
| gbMSM Male | 3 | 0 | 1 | 0 | 0 | 0 | 0 | 0 | 0 | 0 | 0 | 0 | 3 | 0 | 1 |
| (0.8) | (0.0) | (0.3) | (0.0) | (0.0) | (0.0) | (0.0) | (0.0) | (0.0) | (0.0) | (0.0) | (0.0) | (0.8) | (0.0) | (0.3) | |
| Non-gbMSM Male | 1 | 0 | 0 | 0 | 0 | 0 | 0 | 0 | 0 | 0 | 0 | 0 | 1 | 0 | 0 |
| (0.5) | (0.0) | (0.0) | (0.0) | (0.0) | (0.0) | (0.0) | (0.0) | (0.0) | (0.0) | (0.0) | (0.0) | (0.4) | (0.0) | (0.0) | |
| Female | 0 | 0 | 1 | 0 | 0 | 0 | 0 | 0 | 0 | 0 | 0 | 0 | 0 | 0 | 1 |
| (0.0) | (0.0) | (0.8) | (0.0) | (0.0) | (0.0) | (0.0) | (0.0) | (0.0) | (0.0) | (0.0) | (0.0) | (0.0) | (0.0) | (0.7) | |
| Male - Unknown | 0 | 0 | 0 | 1 | 0 | 0 | 1 | 0 | 0 | 0 | 0 | 0 | 2 | 0 | 0 |
| (0.0) | (0.0) | (0.0) | (100.0) | (0.0) | (0.0) | (33.3) | (0.0) | (0.0) | (0.0) | (0.0) | (0.0) | (33.3) | (0.0) | (0.0) | |
| Total | 4 | 0 | 2 | 1 | 0 | 0 | 1 | 0 | 0 | 0 | 0 | 0 | 6 | 0 | 2 |
| (0.5) | (0.0) | (0.3) | (6.7) | (0.0) | (0.0) | (7.1) | (0.0) | (0.0) | (0.0) | (0.0) | (0.0) | (0.8) | (0.0) | (0.3) | |
| CeftriaxoneDS | 2015 | 2016 | 2017 | 2015 | 2016 | 2017 | 2015 | 2016 | 2017 | 2015 | 2016 | 2017 | 2015 | 2016 | 2017 |
| gbMSM Male | 11 | 2 | 2 | 0 | 0 | 0 | 0 | 0 | 0 | 0 | 0 | 0 | 11 | 2 | 2 |
| (2.9) | (0.7) | (0.6) | (0.0) | (0.0) | (0.0) | (0.0) | (0.0) | (0.0) | (0.0) | (0.0) | (0.0) | (2.8) | (0.6) | (0.6) | |
| Non-gbMSM Male | 0 | 1 | 0 | 1 | 0 | 0 | 0 | 0 | 0 | 0 | 0 | 0 | 1 | 1 | 0 |
| (0.0) | (0.5) | (0.0) | (16.7) | (0.0) | (0.0) | (0.0) | (0.0) | (0.0) | (0.0) | (0.0) | (0.0) | (0.4) | (0.5) | (0.0) | |
| Female | 0 | 1 | 0 | 0 | 0 | 0 | 0 | 0 | 0 | 0 | 0 | 0 | 0 | 1 | 0 |
| (0.0) | (0.8) | (0.0) | (0.0) | (0.0) | (0.0) | (0.0) | (0.0) | (0.0) | (0.0) | (0.0) | (0.0) | (0.0) | (0.7) | (0.0) | |
| Male - Unknown | 0 | 0 | 1 | 1 | 0 | 0 | 1 | 0 | 0 | 0 | 0 | 0 | 2 | 0 | 1 |
| (0.0) | (0.0) | (50.0) | (100.0) | (0.0) | (0.0) | (33.3) | (0.0) | (0.0) | (0.0) | (0.0) | (0.0) | (33.3) | (0.0) | (12.5) | |
| Total | 11 | 4 | 3 | 2 | 0 | 0 | 1 | 0 | 0 | 0 | 0 | 0 | 14 | 4 | 3 |
| (1.4) | (0.6) | (0.4) | (13.3) | (0.0) | (0.0) | (7.1) | (0.0) | (0.0) | (0.0) | (0.0) | (0.0) | (1.8) | (0.6) | (0.4) | |
| AzithromycinR | 2015 | 2016 | 2017 | 2015 | 2016 | 2017 | 2015 | 2016 | 2017 | 2015 | 2016 | 2017 | 2015 | 2016 | 2017 |
| gbMSM Male | 1 | 7 | 8 | 0 | 0 | 0 | 0 | 2 | 0 | 0 | 0 | 0 | 1 | 9 | 8 |
| (0.3) | (2.4) | (2.4) | (0.0) | (0.0) | (0.0) | (0.0) | (11.8) | (0.0) | (0.0) | (0.0) | (0.0) | (0.3) | (2.8) | (2.3) | |
| Non-gbMSM Male | 1 | 0 | 2 | 0 | 0 | 0 | 0 | 0 | 0 | 0 | 0 | 0 | 1 | 0 | 2 |
| (0.5) | (0.0) | (0.8) | (0.0) | (0.0) | (0.0) | (0.0) | (0.0) | (0.0) | (0.0) | (0.0) | (0.0) | (0.4) | (0.0) | (0.7) | |
| Female | 1 | 3 | 2 | 0 | 0 | 0 | 0 | 1 | 0 | 0 | 0 | 0 | 1 | 4 | 2 |
| (0.6) | (2.4) | (1.5) | (0.0) | (0.0) | (0.0) | (0.0) | (12.5) | (0.0) | (0.0) | (0.0) | (0.0) | (0.6) | (2.9) | (1.4) | |
| Male - Unknown | 0 | 0 | 0 | 0 | 0 | 0 | 0 | 0 | 0 | 0 | 0 | 0 | 0 | 0 | 0 |
| (0.0) | (0.0) | (0.0) | (0.0) | (0.0) | (0.0) | (0.0) | (0.0) | (0.0) | (0.0) | (0.0) | (0.0) | (0.0) | (0.0) | (0.0) | |
| Total | 3 | 10 | 12 | 0 | 0 | 0 | 0 | 3 | 0 | 0 | 0 | 0 | 3 | 13 | 12 |
| (0.4) | (1.6) | (1.6) | (0.0) | (0.0) | (0.0) | (0.0) | (10.7) | (0.0) | (0.0) | (0.0) | (0.0) | (0.4) | (1.9) | (1.6) | |
| See Table 2 for denominators. R/DS: Resistance or Decreased Susceptibility. | |||||||||||||||
|
|||||||||||||||
| Sex or Sexual Behaviour | 2015 | 2016 | 2017 | |||
|---|---|---|---|---|---|---|
| N | % | N | % | N | % | |
| CefiximeDS | ||||||
| gbMSM Male | 3 | 0.8 | 0 | 0.0 | 1 | 0.3 |
| Non-gbMSM Male | 1 | 0.4 | 0 | 0.0 | 0 | 0.0 |
| Female | 0 | 0.0 | 0 | 0.0 | 1 | 0.7 |
| Male - Unknown | 2 | 33.3 | 0 | 0.0 | 0 | 0.0 |
| Total | 6 | 0.8 | 0 | 0.0 | 2 | 0.3 |
| CeftriaxoneDS | ||||||
| gbMSM Male | 11 | 2.8 | 2 | 0.6 | 2 | 0.6 |
| Non-gbMSM Male | 1 | 0.4 | 1 | 0.5 | 0 | 0.0 |
| Female | 0 | 0.0 | 1 | 0.7 | 0 | 0.0 |
| Male - Unknown | 2 | 33.3 | 0 | 0.0 | 1 | 12.5 |
| Total | 14 | 1.8 | 4 | 0.6 | 3 | 0.4 |
| AzithromycinR | ||||||
| gbMSM Male | 1 | 0.3 | 9 | 2.8 | 8 | 2.3 |
| Non-gbMSM Male | 1 | 0.4 | 0 | 0.0 | 2 | 0.7 |
| Female | 1 | 0.6 | 4 | 2.9 | 2 | 1.4 |
| Male - Unknown | 0 | 0.0 | 0 | 0.0 | 0 | 0.0 |
| Total | 3 | 0.4 | 13 | 1.9 | 12 | 1.6 |
| See Table 2 for denominators. R/DS: Resistance or Decreased Susceptibility. | ||||||
|
||||||
Figure 10. Decreased susceptibility to cefixime, ceftriaxone, or resistance to azithromycin by sex or sexual behaviour, ESAG 2015-2017
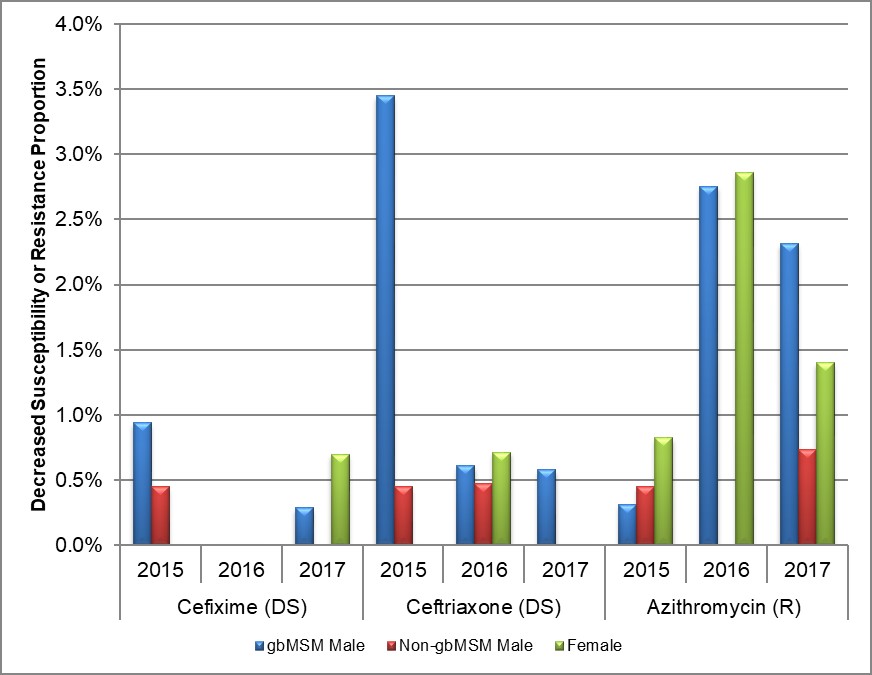
* DS: Decreased Susceptibility; R: Resistance
Text description
The bar chart presents the proportion of decreased susceptibility to cefixime or ceftriaxone or resistance to azithromycin by sex or sexual behaviour groupings and year. The horizontal axis represents the year and antimicrobial while the vertical axis represents the decreased susceptibility or resistance proportion.
| Year and Sex or Sexual Behaviour | Cefixime | Ceftriaxone | Azithromycin | |
|---|---|---|---|---|
| 2015 | gbMSM male | 0.9 | 3.4 | 0.3 |
| Non-gbMSM male | 0.5 | 0.5 | 0.5 | |
| Female | 0.0 | 0.0 | 0.8 | |
| 2016 | gbMSM male | 0.0 | 0.6 | 2.8 |
| Non-gbMSM male | 0.0 | 0.5 | 0.0 | |
| Female | 0.0 | 0.7 | 2.9 | |
| 2017 | gbMSM male | 0.3 | 0.6 | 2.3 |
| Non-gbMSM male | 0.0 | 0.0 | 0.7 | |
| Female | 0.7 | 0.0 | 1.4 | |
Sequence Typing
NG-MAST sequencing of 2,120 isolates identified 303 different sequence types (STs). The 20 most prevalent STs in 2015, 2016, and 2017 are represented in Figure 11. In 2015, ST7638 (23.0%, 11/483) was the most prevalent ST followed by ST11299 (9.5%, 46/483) and ST5985 (7.0%, 34/483). In 2016, ST7638 (11.4%, 31/533) was the most prevalent ST, followed by ST10451 (8.3%, 44/533) and ST11299 (6.8%, 36/533). In 2017, ST5985 (22.4%, 85/379) was the most prevalent ST, followed by ST10451 (7.4%, 28/379) and ST5441 (6.6%, 25/379). The three most prevalent sequence types from 2015 to 2017 combined were ST7638 at 12.5% (175/1395), ST5985 at 10.8% (150/1395) and ST11299 at 6.2% (86/1395). Figure 12 represents the genetic relationship between 20 of the most prevalent STs using the Maximum Likelihood method.
- ST7638 (N=175) was identified in 111 isolates in 2015, 61 isolates in 2016, and three isolates in 2017 and is primarily found in the non-gbMSM male population (N=152). The majority of isolates with this ST had low-level tetracycline resistance.
- ST5985 (N=150) was identified in 34 isolates in 2015, 31 isolates in 2016, and increased more than two-fold in 2017 to 85 isolates. Although 70% of ST5985 isolates were from non-gbMSM males, it was the primary ST identified among gbMSM males. TRNG was the predominant AMR of the isolates with this ST.
- ST11299 (N=86) and ST2318 (N=40) were identified in all three years. ST11299 was identified in 46 isolates in 2015 (9.5%), 36 isolates in 2016 (6.8%) and four isolates in 2017 (1.1%). ST2318 was identified in 13 isolates in 2015 (2.7%), 25 isolates in 2016 (4.7%), and two isolates in 2017 (0.5%) (Figure 11). This cluster was highest in the gbMSM population and resistant to ciprofloxacin, tetracycline, penicillin and erythromycin. A small number also showed decreased susceptibility to cephalosporins.
- ST10451 (N=81) was identified in nine isolates in 2015, 44 isolates in 2016 and decreased to 28 isolates in 2017. This ST was identified primarily in the non-gbMSM population. All of these isolates were resistant to ciprofloxacin and the majority (N=75) were also resistant to tetracycline. In addition, there was a high proportion (72.8% N=59) that were resistant to erythromycin, and over a third were resistant to penicillin (39.5% N=32). A small number of isolates were resistant to azithromycin (N=3) and one showed decreased susceptibility to cephalosporins.
- ST12302 (N=18) was identified in eight isolates in 2016 and ten isolates in 2017. This ST was found primarily in gbMSM males and these isolates were equally resistant to ciprofloxacin (N=18), erythromycin (N=18) and tetracycline (N=18). Half of the isolates with this ST were resistant to azithromycin (N=9). ST123020 has been identified in large numbers in central Canada since 2013. In 2013, it was the most prevalent ST across Canada at 24.1% (688/2,853)Reference 25.
Figure 11. Proportion of isolates for the top 20 NG-MAST sequence types in N. gonorrhoeae isolates, ESAG 2015-2017
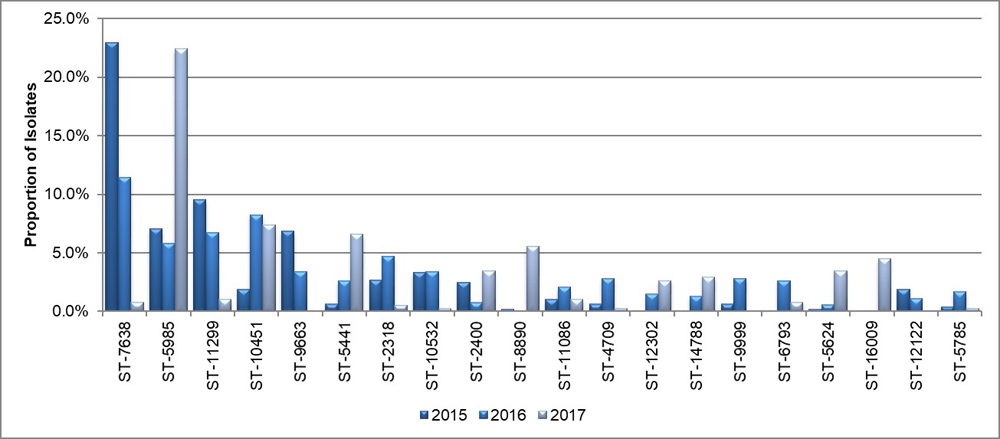
Text description
This bar chart presents the proportion of isolates for the 20 most frequent isolates that were tested using NG-MAST method. The horizontal axis represents the different sequence types while the vertical axis shows the proportion of isolates.
| Sequence Type | 2015 | 2016 | 2017 |
|---|---|---|---|
| ST-7638 | 23.0 | 11.4 | 0.8 |
| ST-5985 | 7.0 | 5.8 | 22.4 |
| ST-11299 | 9.5 | 6.8 | 1.1 |
| ST-10451 | 1.9 | 8.3 | 7.4 |
| ST-9663 | 6.8 | 3.4 | 0.0 |
| ST-5441 | 0.6 | 2.6 | 6.6 |
| ST-2318 | 2.7 | 4.7 | 0.5 |
| ST-10532 | 3.3 | 3.4 | 0.3 |
| ST-2400 | 2.5 | 0.8 | 3.4 |
| ST-8890 | 0.2 | 0.0 | 5.5 |
| ST-11086 | 1.0 | 2.1 | 1.1 |
| ST-4709 | 0.6 | 2.8 | 0.3 |
| ST-12302 | 0.0 | 1.5 | 2.6 |
| ST-14788 | 0.0 | 1.3 | 2.9 |
| ST-9999 | 0.6 | 2.8 | 0.0 |
| ST-6793 | 0.0 | 2.6 | 0.8 |
| ST-5624 | 0.2 | 0.6 | 3.4 |
| ST-16099 | 0.0 | 0.0 | 4.5 |
| ST-12122 | 1.9 | 1.1 | 0.0 |
| ST-5785 | 0.4 | 1.7 | 0.3 |
Figure 12. Genetic relationship of prevalent NG-MAST sequence types in N. gonorrhoeae, ESAG 2015-2017
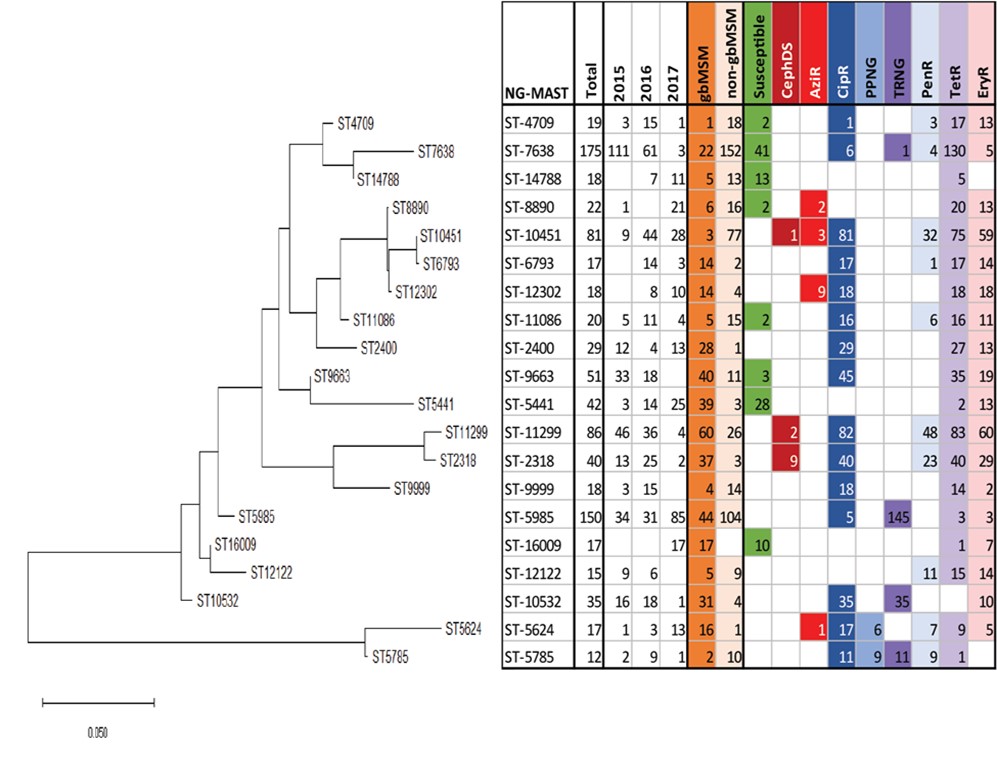
† non-gbMSM includes females in this figure.
Text description
This dendrogram shows the genetic relationship between 20 of the most prevalent sequence types using the maximum likelihood method. The left-most section of the figure shows the phylogenetic relationships and relatedness of each ST - the branch length of the tree represents the number of base pair substitutions per site. The corresponding table on the right shows the NG-MAST (STs) in the rows, and the number of each ST, the year, the sex/sexual behaviour, and the resistance characterization (CipR, CephDS, AzR, TRNG, PPNG, PenR, TetR, EryR) as the column labels. Each variable for the column is coloured and the presence of the variable corresponds to the matching colour present in the NG-MAST row.
- ST-7638
- This ST was identified in 175 isolates (111 in 2015, 61 in 2016 and 3 in 2017), is primarily found in non-gbMSM males and the majority of isolates with the ST show low-level tetracycline resistance
- ST-5985
- This ST, identified in all three years, is the primary ST identified among gbMSM males, and has high level resistance to tetracycline (TRNG)
- ST-11299 ST-2318
- This cluster is found primarily in gbMSM, is multi-drug resistant and a small number also shows decreased susceptibility to cephalosporins as well.
- ST-12302
- This ST was identified in 8 isolates in 2016 and 10 isolates in 2017 with no isolates in 2015. This ST is primarily found in gbMSM males and were equally resistant to ciprofloxacin, erythromycin and tetracycline. It has been identified in large numbers in central Canada since 2013.
Treatment
Treatment information was available for 99.7% (N=666), 96.8% (N=662), and 97.5% (N=749) of the gonorrhea cases in 2015, 2016, and 2017, respectively. Adherence to the treatment recommended in the Canadian Guidelines on Sexually Transmitted InfectionsReference 1 (Table 9) was above 85% for all treatment groups, except for other adultsFootnote e with pharyngeal infections. In this category, 19.6% of cases received a preferred treatment in 2015; this proportion rose to 23.3% in 2016 and 36.1% in 2017, an 84% increase. More than half of these cases received the alternative therapy recommended, 57.1% in 2015, 63.3% in 2016, and 50.8% in 2017 (Table 10, Table 11, Figure 13 and Appendix E).
Ninety-one percent of anogenital infections among other adults were treated with preferred therapies in all years (Table 10, Table 11, Figure 13 and Appendix E). The preferred combination therapy of cefixime and azithromycin was prescribed more frequently than the preferred combination therapy of ceftriaxone and azithromycin for anogenital infections among other adults in all years (81.9% vs 9.1% in 2015; 86.8% vs. 4.3% in 2016; and 88.0% vs. 2.9% in 2017) representing an overall decrease of 68% in prescribing the preferred therapy for other adults between 2015 to 2017 (Table 10, Table 11 and Appendix E).
Despite an 84% increase in the prescribing of the preferred combination therapy of ceftriaxone and azithromycin from 2015 to 2017 (19.6% in 2015, 23.3% in 2016, and 36.1% in 2017), nearly half of other adults with pharyngeal infections were prescribed the alternate combination therapy of cefixime and azithromycin in all years (51.8% in 2015, 51.7% in 2016, and 47.5% in 2017) (Table 10, Table 11 and Appendix E).
| Treatment | gbMSM Males | Other AdultsTable 9 Footnote b | |
|---|---|---|---|
| AnogenitalTable 9 Footnote a Infections | Preferred Therapy | Ceftriaxone 250 mg + Azithromycin 1 g | Ceftriaxone 250 mg + Azithromycin 1 g |
| n/a | Cefixime 800 mg + Azithromycin 1g | ||
| Alternative Therapy | Cefixime 800 mg + Azithromycin 1 g OR Azithromycin 2 g OR SpectinomycinTable 9 Footnote c 2 g + Azithromycin 1 g |
SpectinomycinTable 9 Footnote c 2 g + Azithromycin 1 g OR Azithromycin 2 g |
|
| Pharyngeal Infections | Preferred Therapy | Ceftriaxone 250 mg + Azithromycin 1 g | Ceftriaxone 250 mg + Azithromycin 1 g |
| Alternative Therapy | Cefixime 800 mg + Azithromycin 1 g | Cefixime 800 mg + Azithromycin 1g OR Azithromycin 2 g |
|
|
|||
| 2015 | 2016 | 2017 | ||||||
|---|---|---|---|---|---|---|---|---|
| N | % | N | % | N | % | |||
| AnogenitalTable 10 Footnote c | gbMSM Male | |||||||
| Preferred | Ceftriaxone 250 mg + Azithromycin 1 g | 175 | 87.5 | 182 | 82.7 | 161 | 80.9 | |
| Alternative | Cefixime 800 mg + Azithromycin 1 g | 10 | 5.0 | 8 | 3.6 | 6 | 3.0 | |
| Azithromycin 2 g | 6 | 3.0 | 12 | 5.5 | 10 | 5.0 | ||
| Spectinomycin 2 g + Azithromycin 1 g | 0 | 0.0 | 0 | 0.0 | 0 | 0.0 | ||
| Other combination therapyTable 10 Footnote a | 6 | 3.0 | 16 | 7.3 | 22 | 11.1 | ||
| Other monotherapyTable 10 Footnote b | 2 | 1.0 | 2 | 0.9 | 0 | 0.0 | ||
| Unknown | 1 | 0.5 | 0 | 0.0 | 0 | 0.0 | ||
| Total | 200 | 220 | 199 | |||||
| Other AdultsTable 10 Footnote d | ||||||||
| Preferred | Ceftriaxone 250 mg + Azithromycin 1 g | 26 | 9.1 | 12 | 4.3 | 10 | 2.9 | |
| Cefixime 800 mg + Azithromycin 1 g | 235 | 81.9 | 243 | 86.8 | 302 | 88.0 | ||
| Alternative | Spectinomycin 2 g + Azithromycin 1 g | 0 | 0.0 | 0 | 0.0 | 0 | 0.0 | |
| Azithromycin 2 g | 7 | 2.4 | 11 | 3.9 | 10 | 2.9 | ||
| Other combination therapyTable 10 Footnote a | 14 | 4.9 | 8 | 2.9 | 20 | 5.8 | ||
| Other monotherapyTable 10 Footnote b | 4 | 1.4 | 6 | 2.1 | 1 | 0.3 | ||
| Unknown | 1 | 0.3 | 0 | 0.0 | 0 | 0.0 | ||
| Total | 287 | 280 | 343 | |||||
| Pharyngeal | gbMSM Male | |||||||
| Preferred | Ceftriaxone 250 mg + Azithromycin 1 g | 108 | 90.8 | 84 | 83.2 | 124 | 85.5 | |
| Alternative | Cefixime 800 mg + Azithromycin 1 g | 2 | 1.7 | 5 | 5.0 | 4 | 2.8 | |
| Other combination therapyTable 10 Footnote a | 6 | 5.0 | 9 | 8.9 | 14 | 9.7 | ||
| Other monotherapyTable 10 Footnote b | 3 | 2.5 | 3 | 3.0 | 3 | 2.1 | ||
| Unknown | 0 | 0.0 | 0 | 0.0 | 0 | 0.0 | ||
| Total | 119 | 101 | 145 | |||||
| Other AdultsTable 10 Footnote d | ||||||||
| Preferred | Ceftriaxone 250 mg + Azithromycin 1 g | 11 | 19.6 | 14 | 23.3 | 22 | 36.1 | |
| Alternative | Cefixime 800 mg + Azithromycin 1 g | 29 | 51.8 | 31 | 51.7 | 29 | 47.5 | |
| Azithromycin 2 g | 3 | 5.4 | 7 | 11.7 | 2 | 3.3 | ||
| Other combination therapyTable 10 Footnote a | 8 | 14.3 | 4 | 6.7 | 8 | 13.1 | ||
| Other monotherapyTable 10 Footnote b | 2 | 3.6 | 4 | 6.7 | 0 | 0.0 | ||
| Unknown | 3 | 5.4 | 0 | 0.0 | 0 | 0.0 | ||
| Total | 56 | 60 | 61 | |||||
|
||||||||
Figure 13. Adherence to Canadian treatment guidelinesReference 1 for gbMSM males and other adults*
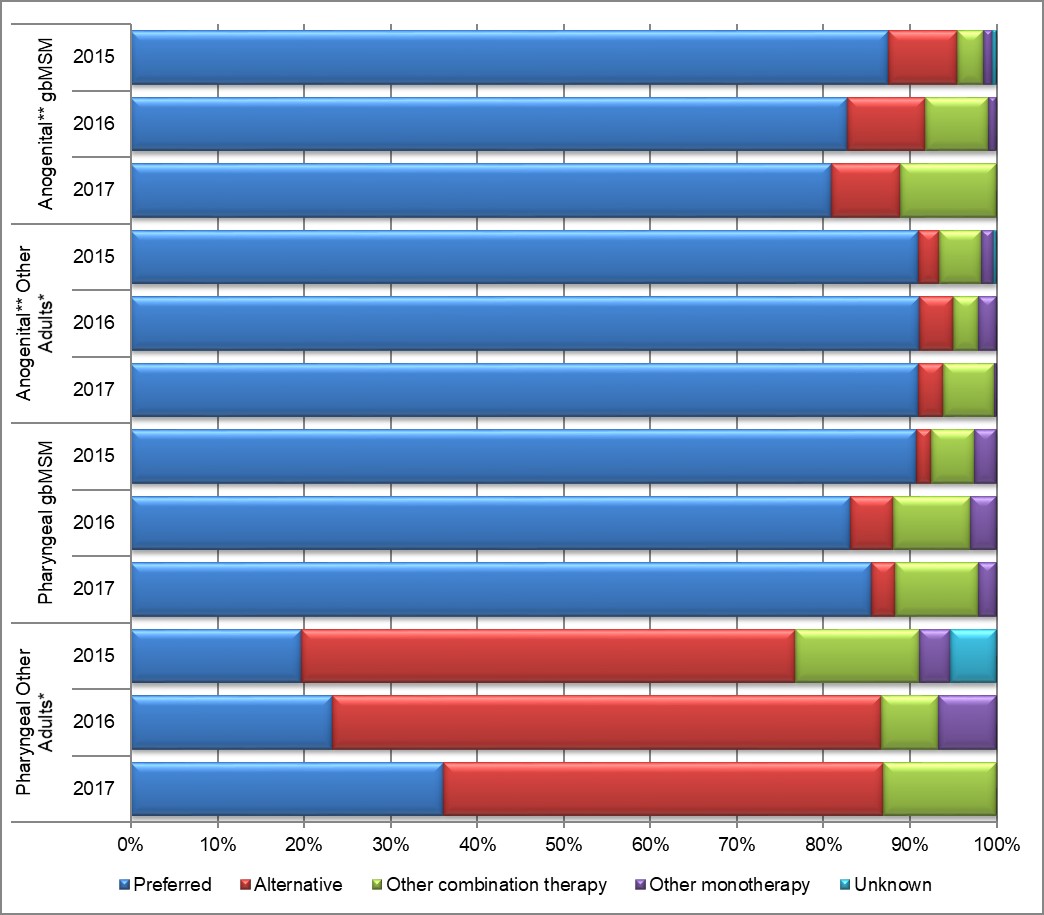
*Other Adults include non-gbMSM males, females and transgendered. It does not include males with unknown sexual behavior or unknown sex.
** Anogenital infections include genital and rectal infections.
Text description
This stacked bar graph displays the percentage of gbMSM and other adults with either anogenital or pharyngeal infections that were treated with the preferred, alternative, other combination and other monotherapy according to Canadian Treatment Guidelines. The horizontal axis represents the percent adherence to the treatment guidelines and the vertical axis represents the infection type (anogenital or pharyngeal) in gbMSM and other adults grouped by year.
| Treatment | Anogenital gbMSM | Anogenital Other Adults | Pharyngeal gbMSM | Pharyngeal Other Adults | ||||||||
|---|---|---|---|---|---|---|---|---|---|---|---|---|
| 2015 | 2016 | 2017 | 2015 | 2016 | 2017 | 2015 | 2016 | 2017 | 2015 | 2016 | 2017 | |
| Preferred | 87.5 | 82.7 | 80.9 | 90.9 | 91.1 | 91.0 | 90.8 | 83.2 | 85.5 | 19.6 | 23.3 | 36.1 |
| Alternative | 8.0 | 9.1 | 8.0 | 2.4 | 3.9 | 2.9 | 1.7 | 5.0 | 2.8 | 57.1 | 63.3 | 50.8 |
| Other Combination | 3.0 | 7.3 | 11.1 | 4.9 | 2.9 | 5.8 | 5.0 | 8.9 | 9.7 | 14.3 | 6.7 | 13.1 |
| Other Monotherapy | 1.0 | 0.9 | 0.0 | 1.4 | 2.1 | 0.3 | 2.5 | 3.0 | 2.1 | 3.6 | 6.7 | 0.0 |
| Unknown | 0.5 | 0.0 | 0.0 | 0.3 | 0.0 | 0.0 | 0.0 | 0.0 | 0.0 | 5.4 | 0.0 | 0.0 |
| Treatment | 2015Table 11 Footnote a | 2016Table 11 Footnote b | 2017Table 11 Footnote c | |||||
|---|---|---|---|---|---|---|---|---|
| N | % | N | % | N | % | |||
| AnogenitalTable 11 Footnote d | gbMSM Males | (P) Ceftriaxone 250 mg, Azithromycin 1 g | 175 | 87.5 | 182 | 82.7 | 161 | 80.9 |
| (A) Azithromycin 2 g | 6 | 3.0 | 12 | 5.5 | 10 | 5.0 | ||
| (A) Cefixime 800 mg, Azithromycin 1 g | 10 | 5.0 | 8 | 3.6 | 6 | 3.0 | ||
| (N) Ceftriaxone 250 mg, Doxycycline 100 mg | 0 | 0.0 | 13 | 5.9 | 14 | 7.0 | ||
| (N) Other | 9 | 4.5 | 5 | 2.3 | 8 | 4.0 | ||
| Total | 200 | 220 | 199 | |||||
| Other AdultsTable 11 Footnote e | (P) Cefixime 800 mg, Azithromycin 1 g | 235 | 81.9 | 243 | 86.8 | 302 | 88.0 | |
| (P) Ceftriaxone 250 mg, Azithromycin 1 g | 26 | 9.1 | 12 | 4.3 | 10 | 2.9 | ||
| (A) Azithromycin 2 g | 7 | 2.4 | 11 | 3.9 | 10 | 2.9 | ||
| (N) Ceftriaxone 250 mg, Cefixime 800 mg, Azithromycin 1 g | 6 | 2.1 | 0 | 0.0 | 0 | 0.0 | ||
| (N) Other | 13 | 4.5 | 14 | 5.0 | 21 | 6.1 | ||
| Total | 287 | 280 | 343 | |||||
| Pharyngeal | gbMSM Males | (P) Ceftriaxone 250 mg, Azithromycin 1 g | 108 | 90.8 | 84 | 83.2 | 124 | 85.5 |
| (A) Cefixime 800 mg, Azithromycin 1 g | 2 | 1.7 | 5 | 5.0 | 4 | 2.8 | ||
| (N) Ceftriaxone 250 mg, Doxycycline 100 mg | 1 | 0.8 | 5 | 5.0 | 7 | 4.8 | ||
| (N) Azithromycin 2 g | 3 | 2.5 | 2 | 2.0 | 3 | 2.1 | ||
| (N) Other | 5 | 4.2 | 5 | 5.0 | 7 | 4.8 | ||
| Total | 119 | 101 | 145 | |||||
| Other AdultsTable 11 Footnote e | (P) Ceftriaxone 250 mg, Azithromycin 1 g | 11 | 19.6 | 14 | 23.3 | 22 | 36.1 | |
| (A) Cefixime 800 mg, Azithromycin 1 g | 29 | 51.8 | 31 | 51.7 | 29 | 47.5 | ||
| (A) Azithromycin 2 g | 3 | 5.4 | 7 | 11.7 | 2 | 3.3 | ||
| (N) Ceftriaxone 250 mg, Doxycycline 100 mg | 0 | 0.0 | 2 | 3.3 | 4 | 6.6 | ||
| (N) Other | 13 | 23.2 | 6 | 10.0 | 4 | 6.6 | ||
| Total | 56 | 60 | 61 | |||||
|
||||||||
|
||||||||
From 2015-2017, nearly 7% (101/1529) of anogenital infections and 12% (64/542) of pharyngeal infections were prescribed treatments that were either “other combination” or “other monotherapies” not recommended in the Canadian Guidelines on Sexually Transmitted InfectionsReference 1. The proportion of cases who were prescribed either the preferred or alternative treatments with an extra antibiotic or increased dosage was 32.1% (53/165) and 67.9% (112/165) of the cases were prescribed a treatment that was not part of the guidelines. These plus an additional five treatments that were “unknown” results in 5.6% (117/2071) of all treatments that were not part of the treatment guidelines (Table 12).
| Treatment | Anogenital | Pharyngeal | ||||||
|---|---|---|---|---|---|---|---|---|
| gbMSM Males | Other Adults | gbMSM Males | Other Adults | |||||
| N | % | N | % | N | % | N | % | |
| Preferred plusTable 12 Footnote a | 13 | 2.1 | 16 | 1.8 | 5 | 1.4 | 8 | 4.5 |
| Alternative plusTable 12 Footnote a | 0 | 0.0 | 1 | 0.1 | 0 | 0.0 | 1 | 0.6 |
| Preferred but higher dosage | 0 | 0.0 | 1 | 0.1 | 1 | 0.3 | 1 | 0.6 |
| Preferred but higher dosage plusTable 12 Footnote a | 0 | 0.0 | 1 | 0.1 | 2 | 0.5 | 0 | 0.0 |
| Alternative but higher dosage | 0 | 0.0 | 2 | 0.2 | 1 | 0.3 | 0 | 0.0 |
| Preferred but lower dosage | 1 | 0.2 | 1 | 0.1 | 1 | 0.3 | 0 | 0.0 |
| Alternative but lower dosage | 1 | 0.2 | 0 | 0.0 | 0 | 0.0 | 0 | 0.0 |
| Only 1 of 2 preferred or alternative antibiotics | 1 | 0.2 | 8 | 0.9 | 0 | 0.0 | 3 | 1.7 |
| Only 1 of 2 preferred or alternative antibiotics plusTable 12 Footnote a | 29 | 4.7 | 18 | 2.0 | 16 | 4.4 | 9 | 5.1 |
| Not recommended | 3 | 0.5 | 5 | 0.5 | 12 | 3.3 | 4 | 2.3 |
| Unknown | 1 | 0.2 | 1 | 0.1 | 0 | 0.0 | 3 | 1.7 |
| Total Other Combination or MonotherapyTable 12 Footnote b | 48 | 7.8 | 53 | 5.8 | 38 | 10.4 | 29 | 16.4 |
|
||||||||
Treatment Failure
From 2015 to 2017, there were less than 1% of cases reporting treatment failure (0 in 2015, 0.4% (3/684)) in 2016 and 0.3% in 2017 (2/768). All of the cases of treatment failure in 2016 were from Manitoba (n=3) and all of the 2017 cases were from Alberta (n=2).
Discussion
This is the third ESAG report that summarizes gonococcal resistance and susceptibility data and describes the public health implications of emerging resistance to cephalosporins and azithromycin.
As a result of the ESAG initiative, partner laboratories submitted increased numbers of gonorrhea isolates to enable improved analysis and information. In 2013, there were 124 cultures from the two sites that were part of ESAGReference 37. In 2014, these same two sites submitted 534 cultures and two new sites began participating; 786 cultures were captured from four jurisdictions in 2015Reference 38. In 2019, a fifth jurisdiction submitted retrospective data for the 2015-2017 time period. The likelihood that these cultures could have been captured by routine laboratory surveillance by the NML cannot be ruled out; however, ESAG allows for the capturing of additional epidemiological information to better understand treatments, populations, and risk factors associated with gonorrheal infections.
Over 80% of cases captured in ESAG were male. This is consistent with historical data, which show that in 2017, 65% (18,734/29,034) of reported gonorrhea cases in Canada were among malesReference 5Reference 6Reference 31. This can also suggest that males, especially gay, bisexual and other men who have sex with men (gbMSM) are overrepresented in ESAG because gbMSM males are more likely to be asked for a specimen for culture in accordance with the recommendations from the Canadian Guidelines on Sexually Transmitted InfectionsReference 1.
More than half of ESAG cases who provided specimens for culture sought care due to signs and/or symptoms, which is consistent with the Canadian Guidelines on Sexually Transmitted InfectionsReference 1 recommendation for obtaining cultures from symptomatic gbMSM and non-gbMSM. However, among gbMSM, approximately one-quarter reported STI screening or being a case contact as the reason for visit. The most common reason for females seeking treatment was the presence of symptoms.
Treatment data from ESAG indicate that the single preferred treatment for treating both anogenital and pharyngeal infections in gbMSM (ceftriaxone (250 mg) and azithromycin (1 g) therapy) has remained the most prevalent treatment for these cases. However, this combination therapy has decreased in use for treating non-gbMSM (including females) from 9.1% in 2015, to 4.3% in 2016 and 2.9% in 2017 for anogenital infections and increased from 19.6% in 2015, to 23.3% in 2016 to 36.1% in 2017 for pharyngeal infections. For anogenital infections in non-gbMSM, this is not a problem as the second preferred therapy of cefixime (800 mg) and azithromycin (1g) has increased by 8% from 2015 to 2017 (81.9% in 2015, 86.8% in 2016 and 88.0% in 2017). There may be cause for concern, however, that pharyngeal infections in non-gbMSM (including females) were treated with alternate therapy (either cefixime 800 mg and azithromycin 1 g or a single dose of azithromycin 2 g) in more than half of the cases (57.1% in 2015, 63.3% in 2016 and 50.8% in 2017), with other therapies being used 13.1%. This may be the result of pharyngeal infections often being asymptomatic; with the clinician only finding a positive result after the treatment was prescribed for an anogenital infection or other co-infection(s) for which data is not collected for this surveillance program.
The majority of cases at the five participating jurisdictions were prescribed either preferred or alternative therapies as currently proposed by the Canadian Guidelines on Sexually Transmitted InfectionsReference 1. This high degree of consistency is likely the result of familiarity on the clinicians at STI clinics with the Canadian Guidelines on Sexually Transmitted Infections and may not necessarily be indicative of general practitioners' prescribing behaviours. As well, since co-infection and contraindication data is not always provided for the ESAG cases, it is difficult to determine the reasoning behind other combination or monotherapies being prescribed. Some cases may require the use of medications outside of the recommendations of the Canadian Guidelines on Sexually Transmitted Infections to treat these cases.
Limitations
Results from ESAG are not representative of all gonorrhea cases or culture-confirmed gonorrhea cases in Canada. Similarly, sentinel sites may not be representative of their jurisdictions. In addition to limited geographic representation, ESAG cases may have been over-represented by gbMSM. Because the majority of cases in ESAG were from Alberta, any aggregated results should be interpreted with caution. Moreover, the small number of ESAG cases in Winnipeg, Halifax and the Northwest Territories made some data difficult to interpret.
The relative representativeness of gbMSM, non-gbMSM and females may vary across these sub-populations. This variation may be associated with proportion of participation per sub-population and profile of those who visited the ESAG sites. For example, the participating gbMSM could represent all gbMSM cases from these jurisdictions in terms of behaviours, while the participating females and non-gbMSM could be more at risk compared to their source sub-populations.
The proportion of infection sites of the different sexes and behaviour groups may be biased according to the screening guidelines of each sentinel site or provincial jurisdiction. The low number of isolates with decreased susceptibility to cephalosporins and resistance to azithromycin made it difficult to determine significant increases and decreases between 2015 and 2017 or significant differences between isolates from different infection sites, sexes and sexual behaviours.
The collection of preferred and alternate treatment data from sentinel sites reflected the prescribing practices in the participating STI clinics and was not expected to reflect gonorrhea treatment practices in non-participating STI clinics in all four provincial jurisdictions where the majority of gonorrhea cases were diagnosed in 2015 to 2017. Also, provincial treatment guidelines and availability of preferred antimicrobials may influence chosen therapies; a client may have had other empiric therapies based on risks or presentations during an initial visit, prior to being diagnosed with gonorrhea.
The completion rate of some variables was low and/or limited to certain sentinel sites and this is another reason these results would not likely reflect the overall Canadian context. In addition, some of the variables rely of self-reported data, which may not be accurate and could result in under- or over-reporting.
All of the isolates from ESAG cases were from swabs taken during initial visits or call-backs after a positive nucleic acid amplification test (NAAT) from the initial visit. There were five cases of treatment failure and seven cases of possible treatment failure reported during the study period. Because detailed clinical information, such as allergies, other infections or contraindications, was not collected for ESAG, it was not possible to definitively determine why the preferred or alternative was not prescribed. Tests of cure and treatment failures can be difficult to measure using surveillance data because they rely on the ability to detect negative results.
Conclusion
The Enhanced Surveillance of Antimicrobial-Resistant Gonorrhea (ESAG) initiative monitored N. gonorrhoeae antimicrobial susceptibility from 2015 to 2017 in participating jurisdictions and provided additional information to supplement the laboratory-based passive surveillance of antimicrobial-resistant gonorrhea. The ESAG data for 2015 to 2017 demonstrated decreased susceptibility to antimicrobials recommended for preferred therapy such as ceftriaxone, cefixime, and resistance to azithromycin. This suggests that decreased susceptibility or resistance to these antimicrobials could complicate gonorrhea treatment substantially in the future.
The ESAG initiative provides useful integrated epidemiological and laboratory data describing the sexual partnering, clinical information, and antimicrobial susceptibility rates of gonococcal disease that would have otherwise not been available nationally. This project determined that it is possible to conduct surveillance of gonorrhea resistance at sentinel sites across Canada by integrating existing local/ provincial/ territorial surveillance. However, the number of sites able to collect such data remains limited and the expansion of ESAG's scope nationally remains a priority.
As Canada deals with increasing numbers of gonorrhea cases and the continued evolution, emergence and spread of antimicrobial resistance, efforts are ongoing to recruit additional ESAG sites to allow the collection of more representative data, which in turn would be more useful for informing treatment guidelines, clinical practice, and public health interventions. The ESAG program has allowed the monitoring of gonococcal antimicrobial susceptibility despite the decreasing use of culture in clinical practice for gonorrhea diagnosis and antimicrobial susceptibility testing. The recent reports of a N. gonorrhoeae strain resistant to ceftriaxone in Quebec and Alberta, Canada, poses a potential threat to the combination therapy currently being used to treat gonorrhea in CanadaReference 29. The continuous monitoring of antimicrobial resistance patterns via surveillance is of paramount importance to ensure the effectiveness of the recommended antimicrobials to treat gonococcal infection. The ESAG program can play an important role in assessing and monitoring the effectiveness of gonococcal treatment options and for the success of Canadian initiatives to combat AMR.
References
- Reference 1
-
Public Health Agency of Canada. Canadian guidelines on sexually transmitted infections, gonococcal infections: Revised July 2013. https://www.canada.ca/en/public-health/services/infectious-diseases/sexual-health-sexually-transmitted-infections/canadian-guidelines.html. 2013.
- Reference 2
-
World Health Organization. Report on global sexually transmitted infection surveillance, 2018. 2018.
- Reference 3
-
World Health Organization. Scientists warn that antibiotic-resistant gonorrhoea is on the rise. www.who.int/reproductivehealth/topics/rtis/amr-gonorrhoea-on-the-rise/en/. Accessed 12/18, 2018.
- Reference 4
-
Centers for Disease Control and Prevention. Antibiotic resistance threats in the United States, 2013.
- Reference 5
-
Public Health Agency of Canada. Notifiable diseases on-line. Notifiable Diseases On-Line Web site. http://diseases.canada.ca/notifiable/. 2019.
- Reference 6
-
Public Health Agency of Canada. Update on sexually transmitted infections in Canada, 2017. 2019.
- Reference 7
-
World Health Organization. Global action plan to control the spread and impact of antimicrobial resistance in Neisseria gonorrhoeae. 2012.
- Reference 8
-
Barry PM, Klausner JD. The use of cephalosporins for gonorrhea: The impending problem of resistance. Expert Opin Pharmacother. 2009;10(4):555-577.
- Reference 9
-
Public Health Agency of Canada. National surveillance of antimicrobial susceptibilities of Neisseria gonorrhoeae in Canada: Annual summary 2017. 2019.
- Reference 10
-
World Health Organization. WHO guidelines for the treatment of Neisseria gonorrhoeae. 2016.
- Reference 11
-
Tapsall J, Ndowa F, Lewis D, Unemo M. Meeting the public heatlh challenge of multidrug- and extensively drug-resistant Neisseria gonorrhoeae. Expert Rev Anti Infect Ther. 2009;7(7):821-834.
- Reference 12
-
Speers D. Gonococcal antimicrobial resistance: 80 years in the making. Microbiol Aust. 2019;40(2):57-62.
- Reference 13
-
Public Health Agency of Canada. National surveillance of antimicrobial susceptibilities of Neisseria gonorrhoeae: Annual summary 2016. 2017.
- Reference 14
-
Bodie M, Gale-Rowe M, Alexandre S, Auguste U, Tomas K, Martin I. Addressing the rising rates of gonorrhea and drug-resistant gonorrhea: there is no time like the present. CCDR. 2019;45(2/3):54-62.
- Reference 15
-
Kirkcaldy R, Harvey A, Papp J, et al. Neisseria gonorrhoeae antimicrobial susceptibility surveillance - the Gonococcal Isolate Surveillance Project, 27 sites, United States, 2014. MMWR Surveill Summ. 2016;65(SS-7):1-19.
- Reference 16
-
Wi T, Lahra M, Ndowa F, et al. Antimicrobial resistance in Neisseria gonorhoeae: Global surveillance and a call for international collaborative action. PLOS Medicine. 2017;14(7):e1002344.
- Reference 17
-
Martin I, Sawatzky P, Allen V, et al. Multidrug-resistant and extensively drug-resistant Neisseria gonorrhoeae in Canada, 2012-2016. CCDR. 2019;45(2/3):53.
- Reference 18
-
Unemo M, Jensen J. Antimicrobial-resistant sexually transmitted infections: gonorrhoeae and Mycoplasma genitalium. Nat Rev Urol. 2017;14(3):139-152.
- Reference 19
-
Allen VG, Mitterni L, Seah C, et al. Neisseria gonorrhoeae treatment failure and susceptibility to cefixime in Toronto, Canada. JAMA - Journal of the American Medical Association. 2013;309(2):163-170.
- Reference 20
-
Unemo M, Shafer WM. Antimicrobial resistance in Neisseria gonorrhoeae in the 21st century: Past, evolution, and future. Clin Microbiol Rev. 2014;27(3):587-613.
- Reference 21
-
Public Health Agency of Canada. 2017-18 Departmental Plan. 2017. https://www.canada.ca/content/dam/phac-aspc/documents/corporate/transparency/corporate-management-reporting/reports-plans-priorities/2017-2018-report-plans-priorities-eng.pdf.
- Reference 22
-
Public Health Agency of Canada. 2018-19 Departmental Plan. 2018. https://www.canada.ca/en/public-health/corporate/transparency/corporate-management-reporting/reports-plans-priorities/2018-2019-report-plans-priorities.html.
- Reference 23
-
Public Health Agency of Canada. 2019-20 Departmental Plan. 2019. https://www.canada.ca/en/public-health/corporate/transparency/corporate-management-reporting/reports-plans-priorities/2019-2020-report-plans-priorities.html.
- Reference 24
-
House of Commons, Standing Committee on Health (HESA). A study on the status of antimicrobial resistance in Canada and related recommendations. 2018.
- Reference 25
-
Public Health Agency of Canada. Canadian Antimicrobial Resistance Surveillance System 2017 report. 2017. https://www.canada.ca/content/dam/phac-aspc/documents/services/publications/drugs-health-products/canadian-antimicrobial-resistance-surveillance-system-2017-report-executive-summary/CARSS-Report-2017-En.pdf.
- Reference 26
-
Public Health Agency of Canada. Canadian Antimicrobial Resistance Surveillance System - update 2018: Executive summary. 2018.
- Reference 27
-
Public Health Agency of Canada. A pan-canadian framework for action: reducing the health impact of sexually transmitted and blood-borne infections in Canada by 2030. 2018. https://www.canada.ca/content/dam/phac-aspc/documents/services/infectious-diseases/sexual-health-sexually-transmitted-infections/reports-publications/sexually-transmitted-blood-borne-infections-action-framework/sexually-transmitted-blood-borne-infections-action-framework.pdf.
- Reference 28
-
Lahra M, Martin I, Demczuk W, et al. Cooperative recognition of internationally disseminated ceftriaxone-resistant Neisseria gonorrhoeae strain. Emerging Infectious Disease. 2018;24(4):735-743.
- Reference 29
-
Lefebvre B, Martin I, Demczuk W, et al. Ceftriaxone-resistant Neisseria gonorrhoeae, Canada, 2017. Emerging Infectious Diseases. 2018;24(2):381-383.
- Reference 30
-
Berenger B, Demczuk W, Gratrix J, Pabbaraju K, Smyczek P, Martin I. Genetic characterization and enhanced surveillance of ceftriaxone-resistant Neisseria gonorrhoeae strain, Alberta, Canada, 2018. Emerging Infectious Disease. 2019;25(9):1660-1667.
- Reference 31
-
Public Health Agency of Canada. Case definitions for communicable diseases under national surveillance. CCDR. 2009;3552.
- Reference 32
-
Clinical and Laboratory Standards Institute. Performance standards for antimicrobial susceptibility testing. Twenty-fifth international supplement. CLSI. 2015.
- Reference 33
-
Ehret JM, Nims LJ, Judson FN. A clinical isolate of Neisseria gonorrhoeae with in vitro resistance to erythromycin and decreased susceptibility to azithromycin. Sex Transm Dis. 1996;23(4):270-272.
- Reference 34
-
Martin IMC, Ison CA, Aanensen DM, Fenton KA, Spratt BG. Rapid sequence-based identification of gonococcal transmission clusters in a large metropolitan area. J Infect Dis. 2004;189(8):1497-1505.
- Reference 35
-
Larkin MA, Blackshields G, Brown NP, et al. Clustal W and Clustal X version 2.0. Bioinformatics. 2007;23(21):2947-2948.
- Reference 36
-
Tamura K, Nei M. Estimation of the number of nucleotide substitutions in the control region of mitochondrial DNA in humans and chimpanzees. Mol Biol Evol. 1993;10(3):512-526.
- Reference 37
-
Public Health Agency of Canada. Report on the Enhanced Surveillance of Antimicrobial-Resistant Gonorrhea (ESAG): Results from the 2014 pilot. 2018.
- Reference 38
-
Public Health Agency of Canada. Report on the Enhanced Surveillance of Antimicrobial-Resistant Gonorrhea (ESAG): Results from 2014 and 2015. 2019.
- Reference 39
-
Centers for Disease Control and Prevention. Sexually transmitted disease surveillance 2007 supplement, Gonococcal Isolate Surveillance Project (GISP) annual reports 2007. 2007.
Appendix A
Neisseria gonorrhoeae Antimicrobial Resistance Criteria
| Antibiotic | Recommended Testing Concentration Ranges (mg/L) | MIC Interpretive StandardAppendix A Footnote a | Sources of Antibiotics | |||
|---|---|---|---|---|---|---|
| SAppendix A Footnote b | DSAppendix A Footnote c | IAppendix A Footnote d | RAppendix A Footnote e | |||
| Penicillin | 0.032 - 128.0 | ≤ 0.06 | - | 0.12 - 1.0 | ≥ 2.0 | Sigma |
| Tetracycline | 0.064 - 64.0 | ≤ 0.25 | - | 0.5 - 1.0 | ≥ 2.0 | Sigma |
| Erythromycin | 0.032 - 32.0 | ≤ 1.0 | - | - | ≥ 2.0 | Sigma |
| Spectinomycin | 4.0 - 256.0 | ≤ 32.0 | - | 64.0 | ≥ 128.0 | Sigma |
| Ciprofloxacin | 0.001 - 64.0 | ≤ 0.06 | - | 0.12 - 0.5 | ≥ 1.0 | Bayer Health Care |
| Ceftriaxone | 0.001 - 2.0 | - | ≥ 0.125 | - | - | Sigma |
| Cefixime | 0.002 - 2.0 | - | ≥ 0.25 | - | - | Sigma |
| Azithromycin | 0.016 - 32.0 | ≤ 1.0 | - | - | ≥ 2.0 | Pfizer |
| Ertapenem | 0.002 - 2.0 | Interpretive Standards Not Available | Sequoia | |||
| Gentamicin | 0.5 - 128.0 | Interpretive Standards Not Available | MP Biomedicals | |||
|
||||||
Appendix B
Neisseria gonorrhoeae Antimicrobial Resistance Characterization Definitions
| Characterization | Description | Definition |
|---|---|---|
| PPNG | Penicillinase Producing Neisseria gonorrhoeae | Pen MIC ≥ 2.0 mg/L, ß-lactamase plasmid (3.05, 3.2 or 4.5 Mdal plasmid) |
| TRNG | Tetracycline Resistant Neisseria gonorrhoeae | Tet MIC ≥ 16.0 mg/L, 25.2 Mdal plasmid, TetM PCR positive |
| CMRNG | Chromosomal Medicated Resistant Neisseria gonorrhoeae | Pen MIC ≥ 2.0 mg/L, Tet MIC ≥ 2.0 mg/L but ≤ 8.0 mg/L, and Ery MIC ≥ 2.0 mg/L |
| Probable CMRNG | Probable Chromosomal Mediated Resistant Neisseria gonorrhoeae | One of the MIC values of Pen, Tet, Ery = 1 mg/L, the other two ≥ 2.0 mg/L |
| PenR | Penicillin Resistant Neisseria gonorrhoeae | Pen MIC ≥ 2.0 mg/L, ß-lactamase negative |
| TetR | Tetracycline Resistant Neisseria gonorrhoeae | Tet MIC ≥ 2.0 mg/L but ≤ 8.0 mg'L |
| EryR | Erythromycin Resistant Neisseria gonorrhoeae | Ery MIC ≥ 2.0 mg/L |
| CipR | Ciprofloxacin Resistant Neisseria gonorrhoeae | Cip MIC ≥ 1.0 mg/L |
| AzR | Azithromycin Resistant Neisseria gonorrhoeae | Az MIC ≥ 2.0 mg/L |
| SpecR | Spectinomycin Resistant Neisseria gonorrhoeae | Spec R ≥ 128 mg/L |
| CxDS | Neisseria gonorrhoeae with decreased susceptibility to Ceftriaxone | Cx MIC ≥ 0.125 mg/L |
| CeDS | Neisseria gonorrhoeae with decreased susceptibility to Cefixime | Ce MIC ≥ 0.25 mg/L |
| MDR-GC | Multidrug-resistant gonococci | Decreased susceptibility/Resistance to one currently recommended therapy (cephalosporin OR azithromycin) PLUS resistance to at least 2 other antimicrobials (penicillin, tetracycline, erythromycin, ciprofloxacin) |
| XDR-GC | Extensively drug-resistant gonococci | Decreased susceptibility/Resistance to two currently recommended therapies (cephalosporin AND azithromycin) plus resistance to at least two other antimicrobials (penicillin, tetracycline, erythromycin, ciprofloxacin) |
Appendix C
Distribution of Antimicrobial Resistance by Sex or Sexual Behaviour, ESAG 2015-2017Appendix c Footnote b
| Antimicrobial Resistance | 2015 | 2016 | 2017 | |||
|---|---|---|---|---|---|---|
| N | % | N | % | N | % | |
| gbMSM Male | ||||||
| CefiximeDS | 3 | 0.8 | 0 | 0.0 | 1 | 0.3 |
| CeftriaxoneDS | 11 | 2.8 | 2 | 0.6 | 2 | 0.6 |
| AzithromycinR | 1 | 0.3 | 9 | 2.8 | 8 | 2.3 |
| CiprofloxacinR | 184 | 46.5 | 161 | 49.2 | 109 | 31.3 |
| TetracyclineR | 285 | 72.0 | 190 | 58.1 | 102 | 29.3 |
| PenicillinR | 85 | 21.5 | 44 | 13.5 | 18 | 5.2 |
| ErythromycinR | 168 | 42.4 | 98 | 30.0 | 52 | 14.9 |
| SpectinomycinR | 0 | 0.0 | 0 | 0.0 | 0 | 0.0 |
| Susceptible to all antibiotics tested | 88 | 22.2 | 96 | 29.4 | 174 | 50.0 |
| Total gbMSM Male | 396 | 327 | 348 | |||
| Non-gbMSM Male | ||||||
| CefiximeDS | 1 | 0.4 | 0 | 0.0 | 0 | 0.0 |
| CeftriaxoneDS | 1 | 0.4 | 1 | 0.5 | 0 | 0.0 |
| AzithromycinR | 1 | 0.4 | 0 | 0.0 | 2 | 0.7 |
| CiprofloxacinR | 31 | 13.8 | 82 | 38.7 | 67 | 24.7 |
| TetracyclineR | 113 | 50.4 | 120 | 56.6 | 143 | 52.8 |
| PenicillinR | 24 | 10.7 | 30 | 14.2 | 15 | 5.5 |
| ErythromycinR | 27 | 12.1 | 45 | 21.2 | 34 | 12.5 |
| SpectinomycinR | 0 | 0.0 | 0 | 0.0 | 0 | 0.0 |
| Susceptible to all antibiotics tested | 107 | 47.8 | 80 | 37.7 | 96 | 35.4 |
| Total Non-gbMSM Male | 224 | 212 | 271 | |||
| Female | ||||||
| CefiximeDS | 0 | 0.0 | 0 | 0.0 | 1 | 0.7 |
| CeftriaxoneDS | 0 | 0.0 | 1 | 0.7 | 0 | 0.0 |
| AzithromycinR | 1 | 0.6 | 4 | 2.9 | 2 | 1.4 |
| CiprofloxacinR | 22 | 13.1 | 50 | 35.7 | 36 | 25.0 |
| TetracyclineR | 74 | 44.0 | 75 | 53.6 | 79 | 54.9 |
| PenicillinR | 9 | 5.4 | 27 | 19.3 | 10 | 6.9 |
| ErythromycinR | 13 | 7.7 | 33 | 23.6 | 16 | 11.1 |
| SpectinomycinR | 0 | 0.0 | 0 | 0.0 | 0 | 0.0 |
| Susceptible to all antibiotics tested | 90 | 53.6 | 58 | 41.4 | 50 | 34.7 |
| Total Female | 168 | 140 | 144 | |||
| OverallAppendix C Footnote a | ||||||
| CefiximeDS | 6 | 0.8 | 0 | 0.0 | 2 | 0.3 |
| CeftriaxoneDS | 14 | 1.8 | 4 | 0.6 | 3 | 0.4 |
| AzithromycinR | 3 | 0.4 | 13 | 1.9 | 12 | 1.6 |
| CiprofloxacinR | 239 | 30.1 | 297 | 43.4 | 215 | 27.9 |
| TetracyclineR | 477 | 60.1 | 388 | 56.7 | 328 | 42.5 |
| PenicillinR | 120 | 15.1 | 102 | 14.9 | 44 | 5.7 |
| ErythromycinR | 211 | 26.6 | 176 | 25.7 | 104 | 13.5 |
| SpectinomycinR | 0 | 0.0 | 0 | 0.0 | 0 | 0.0 |
| Susceptible to all antibiotics tested | 285 | 35.9 | 234 | 34.2 | 322 | 41.8 |
| Total Overall | 794 | 684 | 771 | |||
| DS: Decreased Susceptibility, R: Resistance | ||||||
|
||||||
Appendix D
Distribution of Antimicrobial Resistance by Sex and Infection Site, ESAG 2015-2017
| CefiximeDS | CeftriaxoneDS | AzithromycinR | PenicillinR | TetracyclineR | ErythromycinR | CiprofloxacinR | |||||||||
|---|---|---|---|---|---|---|---|---|---|---|---|---|---|---|---|
| N | % | N | % | N | % | N | % | N | % | N | % | N | % | ||
| Female | 168 | 0 | 0.0 | 0 | 0.0 | 1 | 0.6 | 9 | 5.4 | 74 | 44.0 | 13 | 7.7 | 22 | 13.1 |
| Cervix | 79 | 0 | 0.0 | 0 | 0.0 | 0 | 0.0 | 5 | 6.3 | 34 | 43.0 | 6 | 7.6 | 8 | 10.1 |
| Pharynx | 52 | 0 | 0.0 | 0 | 0.0 | 1 | 1.9 | 3 | 5.8 | 27 | 51.9 | 5 | 9.6 | 10 | 19.2 |
| Rectum | 37 | 0 | 0.0 | 0 | 0.0 | 0 | 0.0 | 1 | 2.7 | 13 | 35.1 | 2 | 5.4 | 4 | 10.8 |
| Male | 626 | 6 | 1.0 | 14 | 2.2 | 2 | 0.3 | 111 | 17.7 | 403 | 64.4 | 198 | 31.6 | 217 | 34.7 |
| Urethra | 354 | 2 | 0.6 | 2 | 0.6 | 2 | 0.6 | 49 | 13.8 | 208 | 58.8 | 76 | 21.5 | 89 | 25.1 |
| Pharynx | 125 | 4 | 3.2 | 8 | 6.4 | 0 | 0.0 | 24 | 19.2 | 86 | 68.8 | 54 | 43.2 | 58 | 46.4 |
| Rectum | 147 | 0 | 0.0 | 4 | 2.7 | 0 | 0.0 | 38 | 25.9 | 109 | 74.1 | 68 | 46.3 | 70 | 47.6 |
| DS: Decreased Susceptibility; R: Resistance | |||||||||||||||
| |||||||||||||||
| CefiximeDS | CeftriaxoneDS | AzithromycinR | PenicillinR | TetracyclineR | ErythromycinR | CiprofloxacinR | |||||||||
|---|---|---|---|---|---|---|---|---|---|---|---|---|---|---|---|
| N | % | N | % | N | % | N | % | N | % | N | % | N | % | ||
| Female | 140 | 0 | 0.0 | 1 | 0.7 | 4 | 2.9 | 27 | 19.3 | 75 | 53.6 | 33 | 23.6 | 50 | 35.7 |
| Cervix | 48 | 0 | 0.0 | 0 | 0.0 | 3 | 6.3 | 5 | 10.4 | 23 | 47.7 | 8 | 16.7 | 10 | 20.8 |
| Pharynx | 57 | 0 | 0.0 | 0 | 0.0 | 1 | 1.8 | 14 | 24.6 | 34 | 59.6 | 19 | 33.3 | 24 | 42.1 |
| Rectum | 35 | 0 | 0.0 | 1 | 2.9 | 0 | 0.0 | 8 | 22.9 | 18 | 51.4 | 6 | 17.1 | 16 | 45.7 |
| Male | 542 | 0 | 0.0 | 4 | 0.6 | 9 | 1.7 | 74 | 13.7 | 311 | 57.4 | 143 | 26.4 | 245 | 45.2 |
| Urethra | 295 | 0 | 0.0 | 2 | 0.7 | 3 | 1.0 | 48 | 14.9 | 169 | 57.3 | 72 | 24.4 | 124 | 42.0 |
| Pharynx | 111 | 0 | 0.0 | 0 | 0.0 | 4 | 3.6 | 14 | 12.6 | 61 | 55.0 | 31 | 27.9 | 55 | 49.5 |
| Rectum | 136 | 0 | 0.0 | 1 | 0.7 | 2 | 1.5 | 16 | 11.8 | 81 | 59.6 | 40 | 29.4 | 66 | 48.5 |
| DS: Decreased Susceptibility; R: Resistance | |||||||||||||||
|
|||||||||||||||
| CefiximeDS | CeftriaxoneDS | AzithromycinR | PenicillinR | TetracyclineR | ErythromycinR | CiprofloxacinR | |||||||||
|---|---|---|---|---|---|---|---|---|---|---|---|---|---|---|---|
| N | % | N | % | N | % | N | % | N | % | N | % | N | % | ||
| Female | 144 | 1 | 0.7 | 0 | 0.0 | 2 | 1.4 | 10 | 6.9 | 79 | 54.9 | 16 | 11.1 | 36 | 25.0 |
| Cervix | 39 | 0 | 0.0 | 0 | 0.0 | 1 | 2.6 | 3 | 7.7 | 12 | 30.8 | 2 | 5.1 | 7 | 17.9 |
| Pharynx | 59 | 1 | 1.7 | 0 | 0.0 | 1 | 1.7 | 5 | 8.5 | 37 | 62.7 | 11 | 18.6 | 22 | 37.3 |
| Rectum | 45 | 0 | 0.0 | 0 | 0.0 | 0 | 0.0 | 2 | 4.4 | 29 | 64.4 | 2 | 4.4 | 6 | 13.3 |
| Male | 627 | 1 | 0.2 | 3 | 0.5 | 10 | 1.6 | 34 | 5.4 | 249 | 39.7 | 88 | 14.0 | 179 | 28.5 |
| Urethra | 364 | 0 | 0.0 | 1 | 0.3 | 3 | 0.8 | 16 | 4.4 | 161 | 44.2 | 47 | 12.9 | 91 | 25.0 |
| Pharynx | 152 | 1 | 0.7 | 2 | 1.3 | 6 | 3.9 | 17 | 11.2 | 52 | 34.2 | 26 | 17.1 | 53 | 34.9 |
| Rectum | 111 | 0 | 0.0 | 0 | 0.0 | 1 | 0.9 | 1 | 0.9 | 36 | 32.4 | 15 | 13.5 | 35 | 31.5 |
| DS: Decreased Susceptibility; R: Resistance | |||||||||||||||
|
|||||||||||||||
Appendix E
Full List of Treatments Used by Treatment Category, ESAG 2015-2017
| 2015 | 2016 | 2017 | |
|---|---|---|---|
| AnogenitalAppendix E Footnote a gbMSM | |||
| (P) Ceftriaxone 250 mg, Azithromycin 1 g | 175 | 182 | 161 |
| (A) Cefixime 800 mg, Azithromycin 1 g | 10 | 8 | 6 |
| (A) Azithromycin 2 g | 6 | 12 | 10 |
| (N) Ceftriaxone 250 mg, Doxycycline 100 mg | 0 | 13 | 14 |
| (N) Ceftriaxone 250 mg, Azithromycin 1 g, Doxycycline 100 mg | 0 | 2 | 5 |
| (N) Ceftriaxone 250 mg, Azithromycin 1 g, Other | 2 | 1 | 0 |
| (N) Ceftriaxone 250 mg, Other | 0 | 0 | 2 |
| (N) Ceftriaxone 250 mg, Cefixime 800 mg, Azithromycin 1 g | 1 | 0 | 1 |
| (N) Cefixime 400 mg, Azithromycin 1 g | 1 | 0 | 0 |
| (N) Ceftriaxone 250 mg, Azithromycin 1 g, Ciprofloxacin 500 mg | 1 | 0 | 0 |
| (N) Ceftriaxone 125 mg, Azithromycin 1 g | 1 | 0 | 0 |
| (N) Doxycycline 100 mg | 0 | 2 | 0 |
| (N) Azithromycin 1 g | 1 | 0 | 0 |
| (N) Ciprofloxacin 500 mg | 1 | 0 | 0 |
| Unknown | 1 | 0 | 0 |
| AnogenitalAppendix E Footnote a Other AdultsAppendix E Footnote b | |||
| (P) Cefixime 800 mg, Azithromycin 1 g | 235 | 243 | 302 |
| (P) Ceftriaxone 250 mg, Azithromycin 1 g | 26 | 12 | 10 |
| (A) Azithromycin 2 g | 7 | 11 | 10 |
| (N) Ceftriaxone 250 mg, Cefixime 800 mg, Azithromycin 1 g | 6 | 0 | 0 |
| (N) Ceftriaxone 250 mg, Other | 1 | 0 | 5 |
| (N) Cefixime 800 mg, Doxycycline 100 mg | 0 | 1 | 3 |
| (N) Ceftriaxone 250 mg, Doxycycline 100 mg | 0 | 2 | 2 |
| (N) Ceftriaxone 250 mg, Cefixime 800 mg, Azithromycin 1 g, Doxycycline 100 mg | 0 | 0 | 2 |
| (N) Cefixime 800 mg, Other | 1 | 1 | 0 |
| (N) Ceftriaxone 250 mg, Azithromycin 1 g, Other | 1 | 0 | 1 |
| (N) Azithromycin 1 g, Azithromycin 2 g | 0 | 0 | 2 |
| (N) Cefixime 800 mg, Azithromycin 1 g, Azithromycin 2 g | 0 | 0 | 1 |
| (N) Ceftriaxone 250 mg, Doxycycline 100 mg, Other | 0 | 1 | 0 |
| (N) Ceftriaxone 250 mg, Ciprofloxacin 500 mg, Other | 1 | 0 | 0 |
| (N) Cefixime 400 mg, Azithromycin 1 g | 1 | 0 | 0 |
| (N) Azithromycin 2 g, Doxycycline 100 mg | 0 | 0 | 1 |
| (N) Doxycycline 100 mg, Other | 0 | 1 | 0 |
| (N) Ceftriaxone 250 mg, Cefixime 800 mg, Other | 1 | 0 | 0 |
| (N) Cefixime 400 mg, Cefixime 800 mg, Azithromycin 1 g | 0 | 1 | 0 |
| (N) Cefixime 400 mg, Cefixime 800 mg, Azithromycin 1 g | 1 | 0 | 0 |
| (N) Ceftriaxone 250 mg, Azithromycin 2 g, Doxycycline 100 mg | 0 | 0 | 1 |
| (N) Cefixime 800 mg, Ceftriaxone 250 mg, Azithromycin 1 g | 0 | 0 | 1 |
| (N) Cefixime 400 mg, Cefixime 800 mg, Ceftriaxone 250 mg, Azithromycin 1 g | 1 | 0 | 0 |
| (N) Ceftriaxone 250 mg, Cefixime 800 mg, Azithromycin 1 g | 0 | 0 | 1 |
| (N) Ceftriaxone 250 mg, Azithromycin 1 g, Doxycycline 100 mg | 0 | 1 | 0 |
| (N) Doxycycline 100 mg | 1 | 4 | 0 |
| (N) Azithromycin 1 g | 2 | 1 | 0 |
| (N) Cefixime 800 mg | 1 | 1 | 1 |
| Unknown | 1 | 0 | 0 |
| Pharyngeal gbMSM | |||
| (P) Ceftriaxone 250 mg, Azithromycin 1 g | 108 | 84 | 124 |
| (A) Cefixime 800 mg, Azithromycin 1 g | 2 | 5 | 4 |
| (N) Ceftriaxone 250 mg, Doxycycline 100 mg | 1 | 5 | 7 |
| (N) Ceftriaxone 250 mg, Azithromycin 1 g, Doxycycline 100 mg | 0 | 0 | 3 |
| (N) Ceftriaxone 250 mg, Other | 2 | 0 | 0 |
| (N) Ceftriaxone 250 mg, Azithromycin 2 g, Doxycycline 100 mg | 0 | 2 | 0 |
| (N) Azithromycin 2 g, Ciprofloxacin 500 mg | 0 | 0 | 1 |
| (N) Cefixime 800 mg, Azithromycin 2 g | 0 | 0 | 1 |
| (N) Ceftriaxone 250 mg, Ciprofloxacin 500 mg | 1 | 0 | 0 |
| (N) Ceftriaxone 250 mg, Azithromycin 1 g | 0 | 1 | 0 |
| (N) Azithromycin 1 g, Spectinomycin 2 g | 1 | 0 | 0 |
| (N) Ceftriaxone 250 mg, Azithromycin 1 g, Ciprofloxacin 500 mg, Doxycycline 100 mg | 0 | 1 | 0 |
| (N) Ciprofloxacin 500 mg, Other | 1 | 0 | 0 |
| (N) Azithromycin 1 g, Other | 0 | 0 | 1 |
| (N) Ceftriaxone 250 mg, Azithromycin 1 g, Other | 0 | 0 | 1 |
| (N) Azithromycin 2 g | 3 | 2 | 3 |
| (N) Doxycycline 100 mg | 0 | 1 | 0 |
| Pharyngeal Other AdultsAppendix E Footnote b | |||
| (P) Ceftriaxone 250 mg, Azithromycin 1 g | 11 | 14 | 22 |
| (A) Cefixime 800 mg, Azithromycin 1 g | 29 | 31 | 29 |
| (A) Azithromycin 2 g | 3 | 7 | 2 |
| (N) Ceftriaxone 250 mg, Doxycycline 100 mg | 0 | 2 | 4 |
| (N) Ceftriaxone 250 mg, Cefixime 800 mg, Azithromycin 1 g | 4 | 0 | 0 |
| (N) Ceftriaxone 250 mg, Other | 1 | 0 | 1 |
| (N) Ceftriaxone 250 mg, Ciprofloxacin 500 mg | 0 | 1 | 0 |
| (N) Cefixime 800 mg, Ceftriaxone 250 mg, Azithromycin 1 g | 0 | 1 | 0 |
| (N) Ceftriaxone 250 mg, Azithromycin 1 g, Azithromycin 2 g | 1 | 0 | 0 |
| (N) Cefixime 800 mg, Azithromycin 1 g, Doxycycline 100 mg | 0 | 0 | 1 |
| (N) Ceftriaxone 250 mg, Azithromycin 1 g, Other | 0 | 0 | 1 |
| (N) Ciprofloxacin 500 mg, Spectinomycin 2 g | 1 | 0 | 0 |
| (N) Azithromycin 2 g, Spectinomycin 2 g, Other | 0 | 0 | 1 |
| (N) Ceftriaxone 250 mg, Cefixime 800 mg, Azithromycin 1 g, Doxycycline 100 mg | 1 | 0 | 0 |
| (N) Doxycycline 100 mg | 0 | 3 | 0 |
| (N) Azithromycin 1 g | 1 | 1 | 0 |
| (N) Cefixime 800 mg | 1 | 0 | 0 |
| Unknown | 3 | 0 | 0 |
|
(P) Preferred treatment in the Canadian Guidelines on Sexually Transmitted Infections – Gonococcal Infections Chapter, Revised July 2013 (treatment guidelines)1. (A) Alternative treatment in the treatment guidelines. (N) Not recommended in the treatment guidelines. |
|||
|
|||
Footnotes
- Footnote a
-
MDR-GC: decreased susceptibility/resistance to one currently recommended therapy (cephalosporin or azithromycin) PLUS resistance to at least two other antimicrobials (penicillin, tetracycline, erythromycin, ciprofloxacin)11.
- Footnote b
-
XDR-GC: decreased susceptibility/resistance to two currently recommended therapies (cephalosporin and azithromycin) PLUS resistance to at least two other antimicrobials (penicillin, tetracycline, erythromycin, ciprofloxacin)11.
- Footnote c
-
In the absence of a pan-Canadian consensus on the definition of treatment failure, the proposed case definition for treatment failure is the absence of sexual contact AND one of the following: (1) gram-negative intracellular diplococci at least 72 hours post treatment7 (2) positive N. gonorrhoeae culture at least 72 hours post treatment; or (3) positive N. gonorrhoeae NAAT at least 2-3 weeks post treatment1.
- Footnote d
-
Cefixime, ceftriaxone and azithromycin are part of the preferred treatments for gonorrhea in Canada1.
- Footnote e
-
Other Adults include non-gbMSM males, females, and transgendered. It does not include males with unknown sexual behaviour or unknown sex.