
Progress in Canada on the 90-90-90 HIV Targets
Canada supports the global targets established by the Joint United Nations Programme on HIV/AIDS and the World Health Organization, including the 90-90-90 targets that by 2020, 90% of all people living with HIV know their status, 90% of those diagnosed receive antiretroviral treatment, and 90% of those on treatment achieve viral suppression.
This document summarizes national estimates of progress on these targets and highlights information on recent work done in two provinces and federal departments.
National Estimates
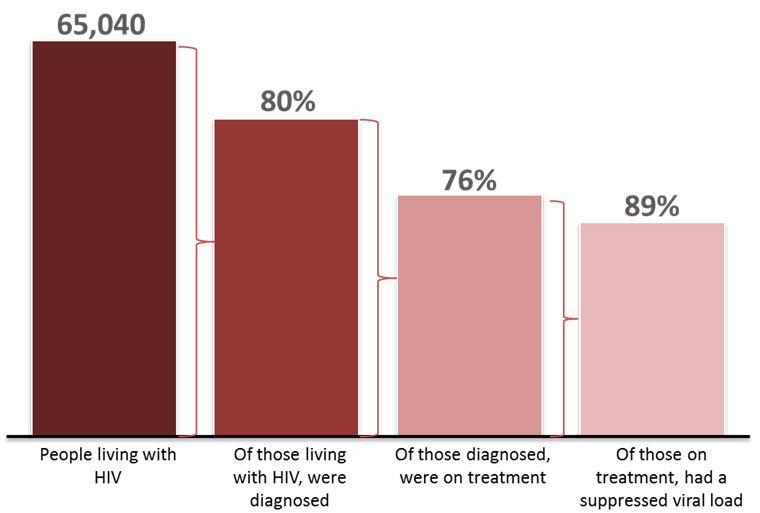
An estimated 65,000 people were living with HIV in Canada at the end of 2014. Of those, approximately 80% knew their status, 76% of those diagnosed were on treatment, and 89% of people on treatment had achieved viral suppression, which means that the amount of the virus in their blood has been reduced to very low, often undetectable, levels.
Canada's estimates of progress on the 90-90-90 targetsFootnote 1 are similar to those reported by other high-income countries. Updated national estimates will be published in summer 2018.
NOTE: Comparisons of Federal and Provincial 90-90-90 measures should be interpreted with caution, as definitions, methods, and data completeness vary between jurisdictions.
Estimates in Federal Correctional Facilities
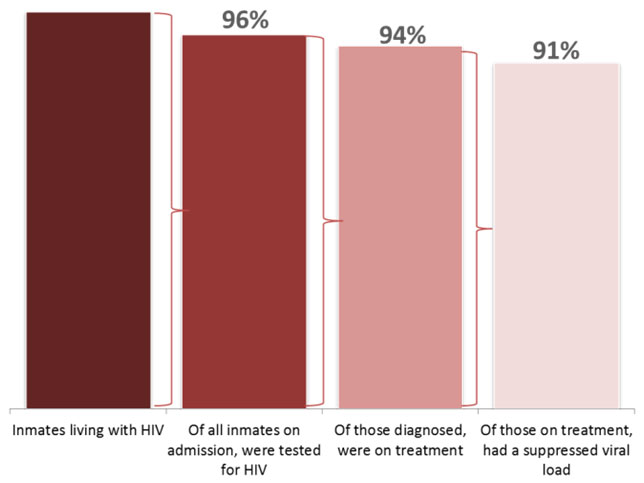
All inmates in federal correctional facilities are offered a health assessment on admission and, in 2016, 96% of newly admitted inmates accepted a voluntary HIV test to know their status. Inmates are also referred for, or can request, HIV testing anytime during incarceration. As of April 2017, among the 170 inmates diagnosed with HIV, 94% were on treatment, and 91% of those on treatment (with known viral load results) had suppressed viral loads.
Estimates for selected First Nations populations
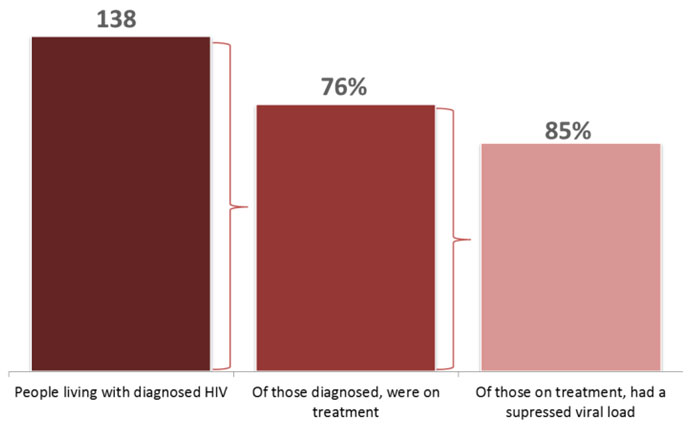
Data from more than 30 First Nations communities in Western Canada showed that at the end of 2016, there were 138 individuals diagnosed with HIV. Among these, 76% were on treatment, and 85% of those had achieved viral suppression.
Ontario
HIV/AIDS estimates for the second and third 90s have been published by the Province of Ontario based on 2015 data, along with historical trends, from a population-based cohort using a centralized public health laboratory databaseFootnote 3. Steady progress has been made annually since 2011 on the proportion of people on treatment and who have suppressed viral loads.
treatment and with suppressed viral load, Ontario, 2011-2015
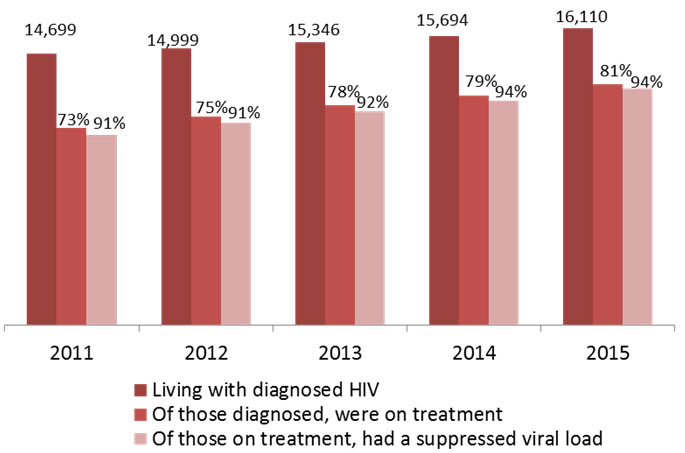
Figure 4 - Text Equivalent
| Year | Estimated number of persons diagnosed with HIV | Percentage diagnosed on treatment | Percentage on treatment with a suppressed viral load |
|---|---|---|---|
| 2011 | 14,699 | 73 | 91 |
| 2012 | 14,999 | 75 | 91 |
| 2013 | 15,436 | 78 | 92 |
| 2014 | 15,694 | 79 | 94 |
| 2015 | 16,110 | 81 | 94 |
These measures have been further broken down by different factors including age group. Figure 5 shows that the proportion of individuals on treatment is higher among older age groups compared to younger age groups.
treatment and with suppressed viral load, by age group, Ontario, 2015
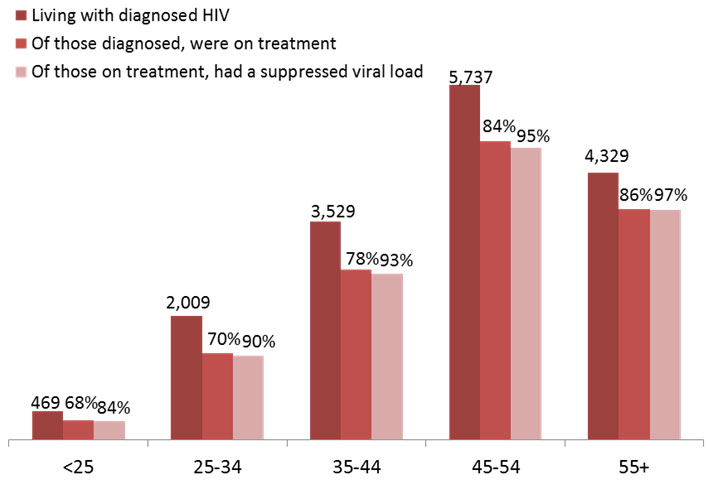
Figure 5 - Text Equivalent
| Age group | Estimated number of persons diagnosed with HIV | Percentage diagnosed on treatment | Percentage on treatment with a suppressed viral load |
|---|---|---|---|
| <25 | 469 | 68 | 84 |
| 25-34 | 2,009 | 70 | 90 |
| 35-44 | 3,529 | 78 | 93 |
| 45-54 | 5,737 | 84 | 84 |
| 55+ | 4,329 | 86 | 97 |
British Columbia
British Columbia (BC) publishes estimates of its progress against the second and third 90s quarterly using population based methodology with a wide range of linked health care databasesFootnote 4. Similar to Ontario, over time there has been an increase in the percentage of people on treatment and with suppressed viral load. BC's data also show that higher proportions of HIV+ males are on treatment and have achieved viral suppression compared to females.
treatment and with suppressed viral load, by sex, British Columbia, 2016
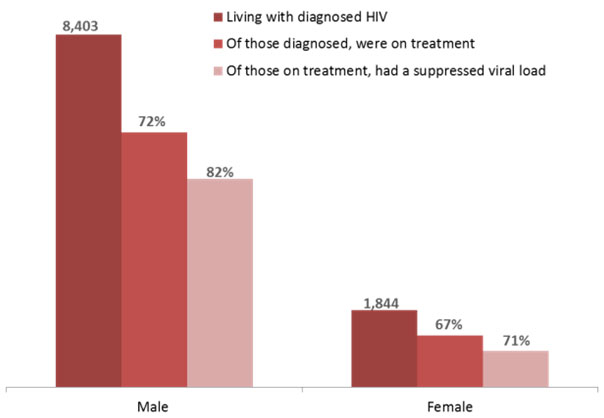
Figure 6 - Text Equivalent
| Sex | Estimated number of persons diagnosed with HIV | Percentage diagnosed on treatment | Percentage on treatment with a suppressed viral load |
|---|---|---|---|
| Male | 8,403 | 72 | 82 |
| Female | 1,844 | 67 | 71 |
A higher proportion of the men who have sex with men (MSM) group have achieved viral suppression compared to the non-MSM group, and a lower proportion of people who inject drugs (PWID) have achieved viral suppression compared to the non-PWID group.
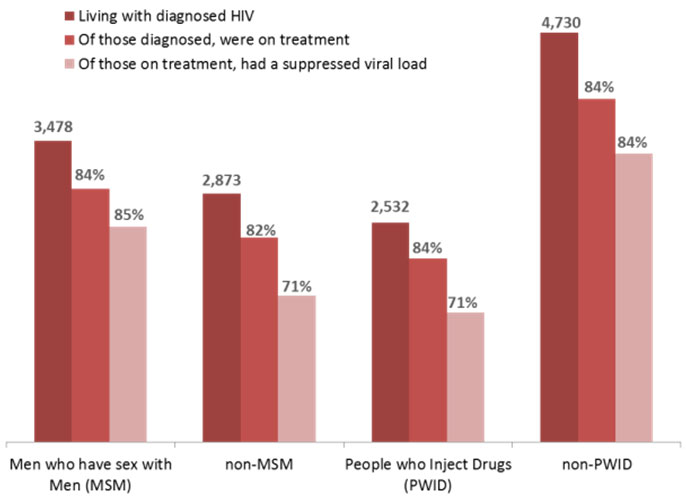
Figure 7 - Text Equivalent
| By exposure category | Estimated number of persons diagnosed with HIV | Percentage diagnosed on treatment | Percentage on treatment with a suppressed viral load |
|---|---|---|---|
| Men who have sec with men (MSM) | 3,478 | 84 | 85 |
| Non-MSM | 2,873 | 82 | 71 |
| People who inject drugs (PWID) | 2,532 | 84 | 71 |
| Non-PWID | 4,730 | 84 | 84 |
Footnotes
- Footnote 1
-
Summary: Measuring Canada's Progress on the 90-90-90 HIV Targetshttps://www.canada.ca/en/public-health/services/publications/diseases-conditions/summary-measuring-canada-progress-90-90-90-hiv-targets.html
- Footnote 2
-
Source: Correctional Service of Canada, Health Services
- Footnote 3
-
THE ONTARIO HIV EPIDEMIOLOGY AND SURVEILLANCE INITIATIVE. HIV care cascade in Ontario, 2015. http://ohesi.ca/reports.html
- Footnote 4
-
STOP HIV/AIDS Technical Monitoring Committee, BC Centre for Excellence in HIV/AIDS, HIV Monitoring Quarterly Report for British Columbia, Fourth Quarter 2016. http://www.cfenet.ubc.ca/