FluWatch report: October 16 to October 22, 2016 (week 42)
Download the alternative format
(PDF format, 834 KB, 6 pages)
Organization: Public Health Agency of Canada
Date published: 2016-10-28
Related Topics
Overall Summary
- Influenza activity is at interseasonal levels with the majority regions in Canada reporting low or no influenza activity.
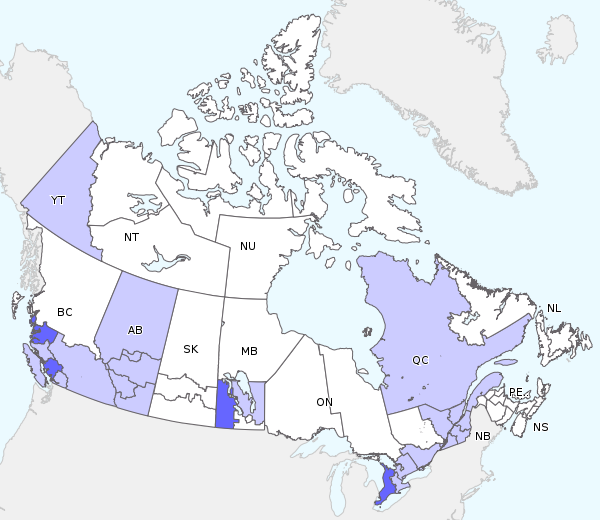
- In week 42, sporadic or localized influenza activity were reported in 23 regions across six provinces or territories (BC, AB, MB, ON, QC and YK).
- A total of 80 positive influenza detections were reported in week 42. Influenza A(H3N2) continues to be the most common subtype detected.
- In week 42, 1.1% of visits to sentinel healthcare professionals were due to influenza-like symptoms.
- Three laboratory-confirmed influenza outbreaks were reported in week 42.
- Less than five hospitalizations due to influenza A(H3N2) were reported in week 42. All hospitalizations were reported in adults ≥65 years.
- For more information on the flu, see our Flu(influenza) web page.
On this page
- Influenza/Influenza-like Illness (ILI) Activity (geographic spread)
- Laboratory Confirmed Influenza Detections
- Syndromic/Influenza-like Illness Surveillance
- Influenza Outbreak Surveillance
- Provincial/Territorial Influenza Hospitalizations and Deaths
- Sentinel Hospital Influenza Surveillance
- Influenza Strain Characterizations
- Antiviral Resistance
- Provincial and International Influenza Reports
- FluWatch definitions for the 2016-2017 season
Influenza/Influenza-like Illness (ILI) Activity (geographic spread)
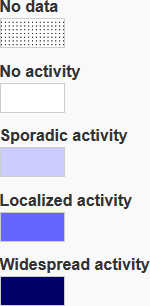
In week 42, a total of 31 regions in Canada reported no influenza activity. Sporadic influenza activity was reported in 20 regions across five provinces (BC, AB, MB, ON, QC and YK). Localized activity was reported in one region in BC, one region in MB and one region in ON. For more details on a specific region, click on the map.
Figure 1 - Text Description
In week 42, a total of 31 regions in Canada reported no influenza activity. Sporadic influenza activity was reported in 20 regions across five provinces (BC, AB, MB, ON, QC and YK). Localized activity was reported in one region in BC, one region in MB and one region in ON.
Laboratory Confirmed Influenza Detections
The percentage of tests positive for influenza remained at interseasonal levels, with 2.5% of tests positive in week 42. For data on other respiratory virus detections, see the Respiratory Virus Detections in Canada Report on the Public Health Agency of Canada (PHAC) website..
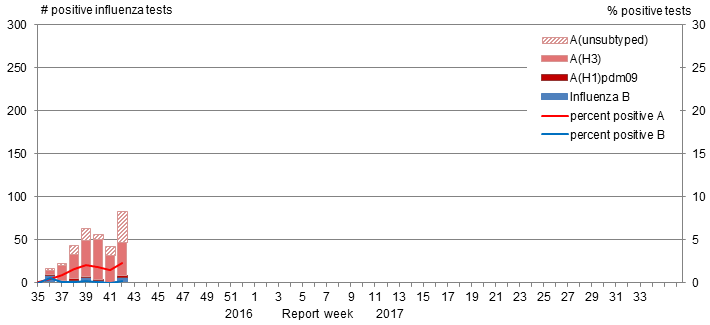
Figure 2 - Text Description
| Report Week | A(Unsubtyped) | A(H3) | A(H1)pdm09 | Influenza B |
|---|---|---|---|---|
| 35 | 0 | <5 | 0 | 0 |
| 36 | <5 | 0 | <5 | 9 |
| 37 | <5 | 17 | 0 | <5 |
| 38 | 11 | 28 | <5 | <5 |
| 39 | 14 | 41 | <5 | 7 |
| 40 | 0 | 47 | <5 | <5 |
| 41 | 10 | 31 | 0 | <5 |
| 42 | 36 | 38 | <5 | 6 |
| 43 | 0 | 0 | 0 | 0 |
| 44 | 0 | 0 | 0 | 0 |
| 45 | 0 | 0 | 0 | 0 |
| 46 | 0 | 0 | 0 | 0 |
| 47 | 0 | 0 | 0 | 0 |
| 48 | 0 | 0 | 0 | 0 |
| 49 | 0 | 0 | 0 | 0 |
| 50 | 0 | 0 | 0 | 0 |
| 51 | 0 | 0 | 0 | 0 |
| 52 | 0 | 0 | 0 | 0 |
| 1 | 0 | 0 | 0 | 0 |
| 2 | 0 | 0 | 0 | 0 |
| 3 | 0 | 0 | 0 | 0 |
| 4 | 0 | 0 | 0 | 0 |
| 5 | 0 | 0 | 0 | 0 |
| 6 | 0 | 0 | 0 | 0 |
| 7 | 0 | 0 | 0 | 0 |
| 8 | 0 | 0 | 0 | 0 |
| 9 | 0 | 0 | 0 | 0 |
| 10 | 0 | 0 | 0 | 0 |
| 11 | 0 | 0 | 0 | 0 |
| 12 | 0 | 0 | 0 | 0 |
| 13 | 0 | 0 | 0 | 0 |
| 14 | 0 | 0 | 0 | 0 |
| 15 | 0 | 0 | 0 | 0 |
| 16 | 0 | 0 | 0 | 0 |
| 17 | 0 | 0 | 0 | 0 |
| 18 | 0 | 0 | 0 | 0 |
| 19 | 0 | 0 | 0 | 0 |
| 20 | 0 | 0 | 0 | 0 |
| 21 | 0 | 0 | 0 | 0 |
| 22 | 0 | 0 | 0 | 0 |
| 23 | 0 | 0 | 0 | 0 |
| 24 | 0 | 0 | 0 | 0 |
| 25 | 0 | 0 | 0 | 0 |
| 26 | 0 | 0 | 0 | 0 |
| 27 | 0 | 0 | 0 | 0 |
| 28 | 0 | 0 | 0 | 0 |
| 29 | 0 | 0 | 0 | 0 |
| 30 | 0 | 0 | 0 | 0 |
| 31 | 0 | 0 | 0 | 0 |
| 32 | 0 | 0 | 0 | 0 |
| 33 | 0 | 0 | 0 | 0 |
| 34 | 0 | 0 | 0 | 0 |
in week 42, there were 80 positive influenza tests. Influenza A(H3N2) was the most common subtype detected. BC accounted for the majority (52%) of influenza detections in week 42. To date, influenza A(H3N2) is the most common subtype detected, representing 74% of laboratory-confirmed cases. For more detailed weekly and cumulative influenza data, see the text descriptions for Figures 2 and 3 or the Respiratory Virus Detections in Canada Report.
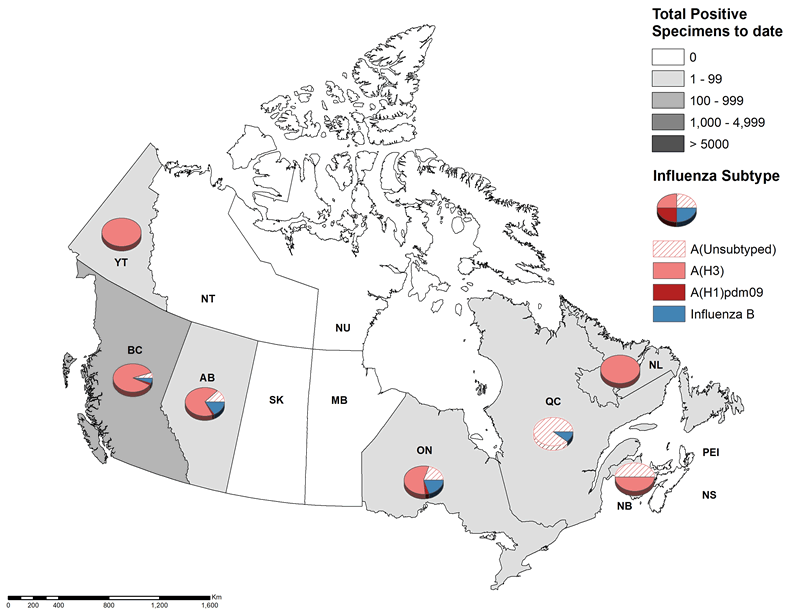
Figure 3 - Text Description
| Reporting provincesTable Figure 3 - Footnote 1 |
Weekly (October 16, 2016 to October 22, 2016) | Cumulative (August 28, 2016 to October 22, 2016) | |||||||||
|---|---|---|---|---|---|---|---|---|---|---|---|
| Influenza A | B | Influenza A | B | A & B Total |
|||||||
| A Total |
A (H1)pdm09 |
A (H3) |
ATable Figure 3 - Footnote UnS | B Total |
A Total |
A (H1)pdm09 |
A (H3) |
ATable Figure 3 - Footnote UnS | B Total |
||
| BC | >37 | <5 | 25 | 12 | <5 | 129 | <5 | 113 | 13 | 6 | 135 |
| AB | <5 | <5 | <5 | <5 | <5 | 55 | <5 | 47 | 6 | 10 | 65 |
| SK | 0 | 0 | 0 | 0 | 0 | 0 | 0 | 0 | 0 | 0 | 0 |
| MB | <5 | 0 | <5 | 0 | 0 | <5 | 0 | <5 | 0 | 0 | <5 |
| ON | >16 | <5 | 6 | 10 | <5 | 58 | <5 | 36 | 19 | 11 | 69 |
| QC | 5 | 0 | 0 | 5 | <5 | 22 | 0 | 0 | 22 | <5 | >22 |
| NB | 0 | 0 | 0 | 0 | 0 | <5 | 0 | <5 | <5 | 0 | <5 |
| NS | <5 | 0 | <5 | 0 | 0 | <5 | 0 | <5 | 0 | 0 | <5 |
| PE | 0 | 0 | 0 | 0 | 0 | 0 | 0 | 0 | 0 | 0 | 0 |
| NL | 0 | 0 | 0 | 0 | 0 | <5 | 0 | <5 | 0 | 0 | <5 |
| YT | 5 | 0 | <5 | <5 | 0 | 10 | 0 | 6 | <5 | 0 | 10 |
| NT | 0 | 0 | 0 | 0 | 0 | 0 | 0 | 0 | 0 | 0 | 0 |
| NU | 0 | 0 | 0 | 0 | 0 | 0 | 0 | 0 | 0 | 0 | 0 |
| Canada | 75 | <5 | 38 | 34 | 5 | 280 | 8 | 207 | 65 | >27 | >301 |
| PercentageTable Figure 3 - Footnote 2 | 94% | 6% | 90% | 3% | 74% | 23% | 10% | 100% | |||
To date this season, detailed information on age and type/subtype has been received for over 324 laboratory confirmed influenza cases. Adults aged 65+ accounted 48% of reported influenza cases. Among cases of influenza A(H3N2), adults aged 65+ accounted for 52% of cases.
| Age groups (years) | Weekly (October 16, 2016 to October 22, 2016) | Cumulative (August 28, 2016 to October 22, 2016) | |||||||||
|---|---|---|---|---|---|---|---|---|---|---|---|
| Influenza A | B | Influenza A | B | Influenza A and B | |||||||
| A Total | A(H1) pdm09 | A(H3) | ATable 1 - Footnote UnS | Total | A Total | A(H1) pdm09 | A(H3) | ATable 1 - Footnote UnS | Total | % | |
| <5 | 0 | 0 | 0 | 0 | <5 | 21 | 0 | 12 | 9 | 5 | 8% |
| 5-19 | <5 | 0 | <5 | <5 | 0 | >12 | 0 | 12 | <5 | <5 | 5% |
| 20-44 | 12 | <5 | <5 | 9 | <5 | >49 | <5 | 29 | 20 | 8 | 17% |
| 45-64 | 7 | 0 | <5 | <5 | <5 | >66 | <5 | 41 | 25 | 6 | 22% |
| 65+ | 26 | 0 | 10 | 16 | 0 | >149 | <5 | 102 | 47 | 8 | 48% |
| Total | >45 | <5 | >10 | >25 | <5 | >297 | <5 | 196 | >101 | >27 | 100% |
| PercentageTable 1 - Footnote 2 | 92% | 2% | 34% | 64% | 8% | 91% | 1% | 65% | 34% | 9% | |
Syndromic/Influenza-like Illness Surveillance
Healthcare Professionals Sentinel Syndromic Surveillance
In week 42, 1.1% of visits to healthcare professionals were due to ILI, a decrease from the previous week.
Figure 4 - Percentage of visits for ILI reported by sentinels by report week, Canada, 2016-17
Number of Sentinels Reporting Week 42: 90
 Delays in the reporting of data may cause data to change retrospectively. In BC, AB, and SK, data are compiled by a provincial sentinel surveillance program for reporting to FluWatch. Not all sentinel physicians report every week.
Figure 4 - Text Description
| Report week | % Visits for ILI |
|---|---|
| 35 | 0.99 |
| 36 | 0.98 |
| 37 | 0.99 |
| 38 | 0.98 |
| 39 | 0.96 |
| 40 | 1.04 |
| 41 | 2.50 |
| 42 | 1.08 |
Are you a primary healthcare practitioner (General Practitioner, Nurse Practitioner or Registered Nurse) interested in becoming a FluWatch sentinel?
Please visit our Influenza Sentinel page for more details.
Influenza Outbreak Surveillance
In week 42, three laboratory confirmed influenza outbreaks were reported. Two outbreaks were reported in a long-term care facility and due to to influenza A(H3N2) and one outbreak was due to influenza A (unsubtyped). To date this season, 16 outbreaks have been reported.
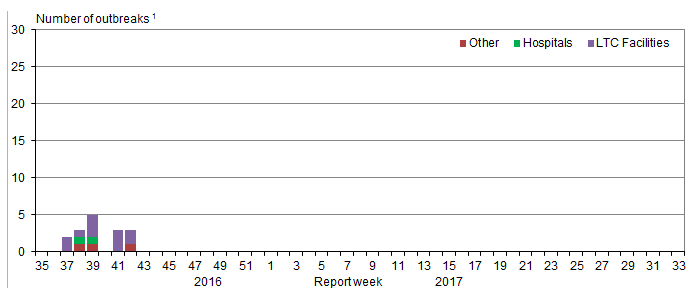
Figure 5 - Text Description
| Report week | Hospitals | Long Term Care Facilities | Other |
|---|---|---|---|
| 35 | 0 | 0 | 0 |
| 36 | 0 | 0 | 0 |
| 37 | 0 | 2 | 0 |
| 38 | 1 | 1 | 0 |
| 39 | 1 | 3 | 0 |
| 40 | 0 | 0 | 0 |
| 41 | 0 | 3 | 0 |
| 42 | 0 | 2 | 0 |
| 43 | 0 | 0 | 0 |
| 44 | 0 | 0 | 0 |
| 45 | 0 | 0 | 0 |
| 46 | 0 | 0 | 0 |
| 47 | 0 | 0 | 0 |
| 48 | 0 | 0 | 0 |
| 49 | 0 | 0 | 0 |
| 50 | 0 | 0 | 0 |
| 51 | 0 | 0 | 0 |
| 52 | 0 | 0 | 0 |
| 1 | 0 | 0 | 0 |
| 2 | 0 | 0 | 0 |
| 3 | 0 | 0 | 0 |
| 4 | 0 | 0 | 0 |
| 5 | 0 | 0 | 0 |
| 6 | 0 | 0 | 0 |
| 7 | 0 | 0 | 0 |
| 8 | 0 | 0 | 0 |
| 9 | 0 | 0 | 0 |
| 10 | 0 | 0 | 0 |
| 11 | 0 | 0 | 0 |
| 12 | 0 | 0 | 0 |
| 13 | 0 | 0 | 0 |
| 14 | 0 | 0 | 0 |
| 15 | 0 | 0 | 0 |
| 16 | 0 | 0 | 0 |
| 17 | 0 | 0 | 0 |
| 18 | 0 | 0 | 0 |
| 19 | 0 | 0 | 0 |
| 20 | 0 | 0 | 0 |
| 21 | 0 | 0 | 0 |
| 22 | 0 | 0 | 0 |
| 23 | 0 | 0 | 0 |
| 24 | 0 | 0 | 0 |
| 25 | 0 | 0 | 0 |
| 26 | 0 | 0 | 0 |
| 27 | 0 | 0 | 0 |
| 28 | 0 | 0 | 0 |
| 29 | 0 | 0 | 0 |
| 30 | 0 | 0 | 0 |
| 31 | 0 | 0 | 0 |
| 32 | 0 | 0 | 0 |
| 33 | 0 | 0 | 0 |
| 34 | 0 | 0 | 0 |
Provincial/Territorial Influenza Hospitalizations and Deaths
In week 42, less than five influenza-associated hospitalizations were reported by participating provinces and territoriesFootnote *.
To date this season, 40 hospitalizations have been reported, of which 27 (68%) were due to influenza A(H3N2) and 70% were in adults 65+. Less than five ICU admissions or deaths have been reported.
| Age Groups (years) | Cumulative (August 28, 2016 to October 22, 2016) | ||||||
|---|---|---|---|---|---|---|---|
| Hospitalizations | ICU Admissions | Deaths | |||||
| Influenza A Total | Influenza B Total | Total (#) | Influenza A and B Total | % | Influenza A and B Total | % | |
| 0-4 | <5 | 0 | <5 | 0 | 0% | 0 | 0% |
| 5-19 | <5 | <5 | <5 | 0 | 0% | 0 | 0% |
| 20-44 | <5 | <5 | <5 | 0 | 0% | 0 | 0% |
| 45-64 | <5 | <5 | <5 | 0 | 0% | 0 | 0% |
| 65+ | 28 | <5 | >28 | 0 | 100% | 0 | 0% |
| Total | >40 | <5 | 40 | 0 | 100% | 0 | 0% |
Sentinel Hospital Influenza Surveillance
Pediatric Influenza Hospitalizations and Deaths
To date this season, less than five laboratory-confirmed influenza-associated pediatric (≤16 years of age) hospitalizations were reported by the Immunization Monitoring Program Active (IMPACT) network.
Influenza Strain Characterizations
During the 2016-17 influenza season, the National Microbiology Laboratory (NML) has characterized 34 influenza viruses [29 A(H3N2), 1 A(H1N1), 4 influenza B].
| Strain Characterization ResultsTable 3 - Footnote 1 | Count | Description |
|---|---|---|
| Influenza A (H3N2) | ||
| Antigenically A/Hong Kong/4801/2014-like |
14 | Viruses antigenically similar to A/Hong Kong/4801/2014, the A(H3N2) component of the 2016-17 Northern Hemisphere's trivalent and quadrivalent vaccine. |
| GeneticallyTable 3 - Footnote 2 A/Hong Kong/4801/2014-like |
15 | Viruses belonging to a genetic group for which most viruses were antigenically related to A/Hong Kong/4801/2014, the A(H3N2) component of the 2016-17 Northern Hemisphere's trivalent and quadrivalent vaccine. |
| Influenza A (H1N1) | ||
| A/California/7/2009-like | 1 | Viruses antigenically similar to A/California/7/2009, the A(H1N1) component of the 2016-17 Northern Hemisphere's trivalent and quadrivalent vaccine influenza vaccine. |
| Influenza B | ||
| B/Brisbane/60/2008-like (Victoria lineage) |
3 | Viruses antigenically similar to B/Brisbane/60/2008, the influenza B component of the 2016-17 Northern Hemisphere's trivalent and quadrivalent influenza vaccine |
| B/Phuket/3073/2013-like (Yamagata lineage) |
1 | Viruses antigenically similar to B/Phuket/3073/2013, the additional influenza B component of the 2016-17 Northern Hemisphere quadrivalent influenza vaccine. |
Antiviral Resistance
During the 2016-17 season, the National Microbiology Laboratory (NML) has tested 40 influenza viruses for resistance to oseltamivir and zanamivir and 26 influenza viruses for resistance to amantadine. All viruses weres sensitive to oseltamivir and zanamivir. All 26 influenza A viruses were resistant to amantadine (Table 4).
| Virus type and subtype | Oseltamivir | Zanamivir | Amantadine | |||
|---|---|---|---|---|---|---|
| # tested | # resistant (%) | # tested | # resistant (%) | # tested | # resistant (%) | |
| A (H3N2) | 35 | 0 (0%) | 35 | 0 (0%) | 25 | 25 (100%) |
| A (H1N1) | 1 | 0 (0%) | 1 | 0 (0%) | 1 | 1 (100%) |
| B | 4 | 0 (0%) | 4 | 0 (0%) | N/ATable 4 - Footnote * | N/ATable 4 - Footnote * |
| TOTAL | 40 | 0 (0%) | 40 | 0 (0%) | 26 | 26 (100%) |
Provincial and International Influenza Reports
- World Health Organization influenza update
- World Health Organization FluNet
- WHO Influenza at the human-animal interface
- Centers for Disease Control and Prevention seasonal influenza report
- European Centre for Disease Prevention and Control - epidemiological data
- South Africa Influenza surveillance report
- New Zealand Public Health Surveillance
- Australia Influenza Report
- Pan-American Health Organization Influenza Situation Report
- Alberta Health - Influenza Surveillance Report
- BC - Centre for Disease Control (BCCDC) - Influenza Surveillance
- New Brunswick - Influenza Surveillance Reports
- Newfoundland and Labrador - Surveillance and Disease Reports
- Nova Scotia - Flu Information
- Public Health Ontario - Ontario Respiratory Pathogen Bulletin
- Quebec - Système de surveillance de la grippe
- Manitoba - Epidemiology and Surveillance - Influenza Reports
- Saskatchewan - influenza Reports
- PEI - Influenza Summary
FluWatch definitions for the 2016-2017 season
Abbreviations: Newfoundland/Labrador (NL), Prince Edward Island (PE), New Brunswick (NB), Nova Scotia (NS), Quebec (QC), Ontario (ON), Manitoba (MB), Saskatchewan (SK), Alberta (AB), British Columbia (BC), Yukon (YT), Northwest Territories (NT), Nunavut (NU).
Influenza-like-illness (ILI): Acute onset of respiratory illness with fever and cough and with one or more of the following - sore throat, arthralgia, myalgia, or prostration which is likely due to influenza. In children under 5, gastrointestinal symptoms may also be present. In patients under 5 or 65 and older, fever may not be prominent.
ILI/Influenza outbreaks
- Schools:
-
Greater than 10% absenteeism (or absenteeism that is higher (e.g. >5-10%) than expected level as determined by school or public health authority) which is likely due to ILI.
Note: it is recommended that ILI school outbreaks be laboratory confirmed at the beginning of influenza season as it may be the first indication of community transmission in an area. - Hospitals and residential institutions:
- two or more cases of ILI within a seven-day period, including at least one laboratory confirmed case. Institutional outbreaks should be reported within 24 hours of identification. Residential institutions include but not limited to long-term care facilities (LTCF) and prisons.
- Workplace:
- Greater than 10% absenteeism on any day which is most likely due to ILI.
- Other settings:
- two or more cases of ILI within a seven-day period, including at least one laboratory confirmed case; i.e. closed communities.
Note that reporting of outbreaks of influenza/ILI from different types of facilities differs between jurisdictions.
Influenza/ILI activity level
1 = No activity: no laboratory-confirmed influenza detections in the reporting week, however, sporadically occurring ILI may be reported
2 = Sporadic: sporadically occurring ILI and lab confirmed influenza detection(s) with no outbreaks detected within the influenza surveillance region Footnote †
3 = Localized:
- evidence of increased ILIFootnote * and
- lab confirmed influenza detection(s) together with
- outbreaks in schools, hospitals, residential institutions and/or other types of facilities occurring in less than 50% of the influenza surveillance regionFootnote †
4 = Widespread:
- evidence of increased ILIFootnote * and
- lab confirmed influenza detection(s) together with
- outbreaks in schools, hospitals, residential institutions and/or other types of facilities occurring in greater than or equal to 50% of the influenza surveillance regionFootnote †
Note: ILI data may be reported through sentinel physicians, emergency room visits or health line telephone calls.
Page details
- Date modified:
