
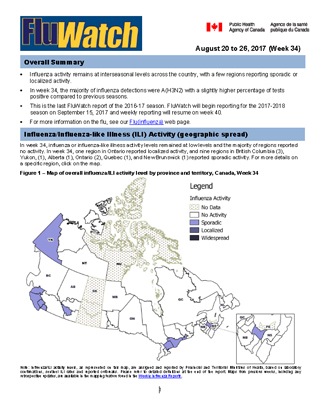
FluWatch report: August 20 – August 26, 2017 (week 34)
Overall Summary
- Influenza activity remains at interseasonal levels across the country, with a few regions reporting sporadic or localized activity.
- In week 34, the majority of influenza detections were A(H3N2) with a slightly higher percentage of tests positive compared to previous seasons.
- This is the last FluWatch report of the 2016-17 season. FluWatch will begin reporting for the 2017-2018 season on September 15, 2017 and weekly reporting will resume on week 40.
- For more information on the flu, see our Flu(influenza) web page.
On this page
- Influenza/ILI Activity (geographic spread)
- Laboratory Confirmed Influenza Detections
- Syndromic/Influenza-like Illness Surveillance
- Influenza Outbreak Surveillance
- Provincial/Territorial Influenza Hospitalizations and Deaths
- Sentinel Hospital Influenza Surveillance
- Influenza Strain Characterizations
- Antiviral Resistance
- Provincial and International Influenza Reports
- FluWatch definitions for the 2016-2017 season
Influenza/Influenza-like Illness Activity (geographic spread)
In week 34, influenza or influenza-like illness activity levels remained at low levels and the majority of regions reported no activity. In week 34, one region in Ontario reported localized activity, and nine regions in British Columbia (3), Yukon, (1), Alberta (1), Ontario (2), Quebec (1), and New Brunswick (1) reported sporadic activity. For more details on a specific region, click on the map.
Download the alternative format
(PDF format, 527 KB, 29 pages)
Organization:
Date published: 2017-09-01
Related Topics
Figure 1 – Map of overall influenza/ILI activity level by province and territory, Canada, Week 34
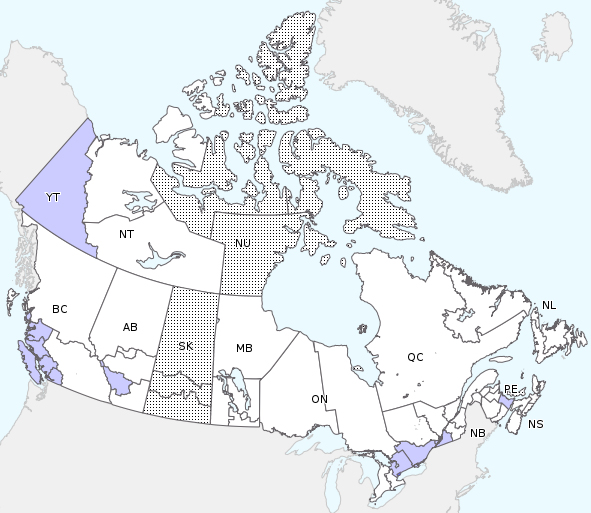
Note: Influenza/ILI activity levels, as represented on this map, are assigned and reported by Provincial and Territorial Ministries of Health, based on laboratory confirmations, sentinel ILI rates and reported outbreaks. Please refer to detailed definitions at the end of the report. Maps from previous weeks, including any retrospective updates, are available in the mapping feature found in the Weekly Influenza Reports.
Figure 1 - Text Description
In week 34, influenza or influenza-like illness activity levels remained at low levels and the majority of regions reported no activity. In week 34, one region in Ontario reported localized activity, and nine regions in British Columbia (3), Yukon, (1), Alberta (1), Ontario (2), Quebec (1), and New Brunswick (1) reported sporadic activity.
Laboratory Confirmed Influenza Detections
In week 34, the number of tests positive for influenza remained at interseasonal levels. The percentage of tests positive was low at 1.1%, although slightly higher than in the previous six seasons. The number of detections of influenza A has been relatively stable over the past 6 weeks; and influenza B detections have remained low. The majority of influenza A viruses subtyped were A(H3N2). For data on other respiratory virus detections, see the Respiratory Virus Detections in Canada Report on the Public Health Agency of Canada (PHAC) website.
Figure 2 – Number of positive influenza tests and percentage of tests positive, by type, subtype and report week, Canada, 2016-17, week 34
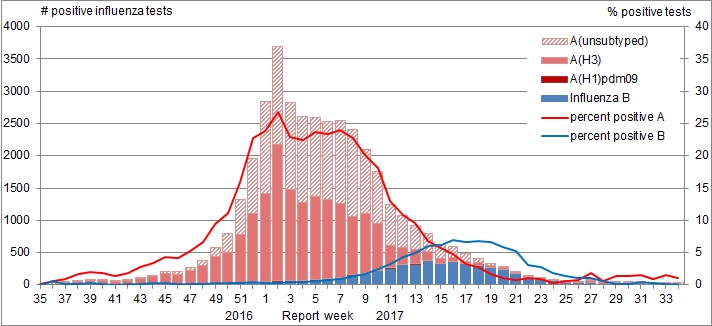
The shaded area indicates weeks where the positivity rate was at least 5% and a minimum of 15 positive tests were observed, signalling the start and end of seasonal influenza activity.
Figure 2 - Text Description
| Report Week | A(Unsubtyped) | A(H3) | A(H1)pdm09 | Influenza B |
|---|---|---|---|---|
| 35 | 0 | <5 | 0 | 0 |
| 36 | <5 | 6 | <5 | 9 |
| 37 | <5 | 17 | 0 | <5 |
| 38 | 11 | 28 | <5 | <5 |
| 39 | 14 | 41 | <5 | 7 |
| 40 | 0 | 47 | <5 | <5 |
| 41 | 10 | 31 | 0 | <5 |
| 42 | 14 | 49 | <5 | 6 |
| 43 | 16 | 76 | <5 | <5 |
| 44 | 19 | 110 | <5 | 9 |
| 45 | 31 | 150 | <5 | 11 |
| 46 | 52 | 140 | <5 | 7 |
| 47 | 45 | 200 | 0 | 9 |
| 48 | 91 | 272 | <5 | 7 |
| 49 | 141 | 414 | <5 | 12 |
| 50 | 297 | 467 | <5 | 18 |
| 51 | 535 | 750 | <5 | 17 |
| 52 | 852 | 1064 | <5 | 33 |
| 1 | 1438 | 1360 | <5 | 38 |
| 2 | 1510 | 2118 | 10 | 39 |
| 3 | 1350 | 1412 | 0 | 47 |
| 4 | 1334 | 1220 | <5 | 47 |
| 5 | 1222 | 1290 | 7 | 62 |
| 6 | 1200 | 1225 | 9 | 81 |
| 7 | 1291 | 1141 | 11 | 97 |
| 8 | 1344 | 899 | 17 | 128 |
| 9 | 977 | 935 | 7 | 159 |
| 10 | 802 | 726 | 14 | 203 |
| 11 | 629 | 347 | 13 | 242 |
| 12 | 498 | 259 | <5 | 302 |
| 13 | 369 | 221 | 0 | 309 |
| 14 | 273 | 134 | 6 | 365 |
| 15 | 216 | 73 | 0 | 321 |
| 16 | 167 | 59 | 9 | 347 |
| 17 | 112 | 39 | <5 | 316 |
| 18 | 62 | 49 | 0 | 283 |
| 19 | 36 | 30 | 0 | 259 |
| 20 | 13 | 26 | <5 | 228 |
| 21 | 13 | 12 | 0 | 168 |
| 22 | 9 | 14 | 7 | 94 |
| 23 | 13 | 8 | <5 | 75 |
| 24 | 0 | <5 | <5 | 48 |
| 25 | 7 | <5 | <5 | 29 |
| 26 | 9 | <5 | <5 | 21 |
| 27 | 9 | 23 | <5 | 21 |
| 28 | 0 | 8 | 0 | 12 |
| 29 | 6 | 16 | <5 | <5 |
| 30 | 7 | 13 | <5 | <5 |
| 31 | 7 | 16 | <5 | 6 |
| 32 | 0 | 9 | <5 | <5 |
| 33 | 16 | 9 | 0 | <5 |
| 34 | 10 | 6 | 0 | <5 |
To date this season, 39,355 laboratory-confirmed influenza detections have been reported, of which 88% have been influenza A. Influenza A(H3N2) has been the most common subtype detected this season, representing over 99% of influenza A detections. For more detailed weekly and cumulative influenza data, see the text descriptions for Figures 2 and 3 or the Respiratory Virus Detections in Canada Report.
Figure 3 – Cumulative numbers of positive influenza specimens by type/subtype and province/territory, Canada, 2016-17, Week 34
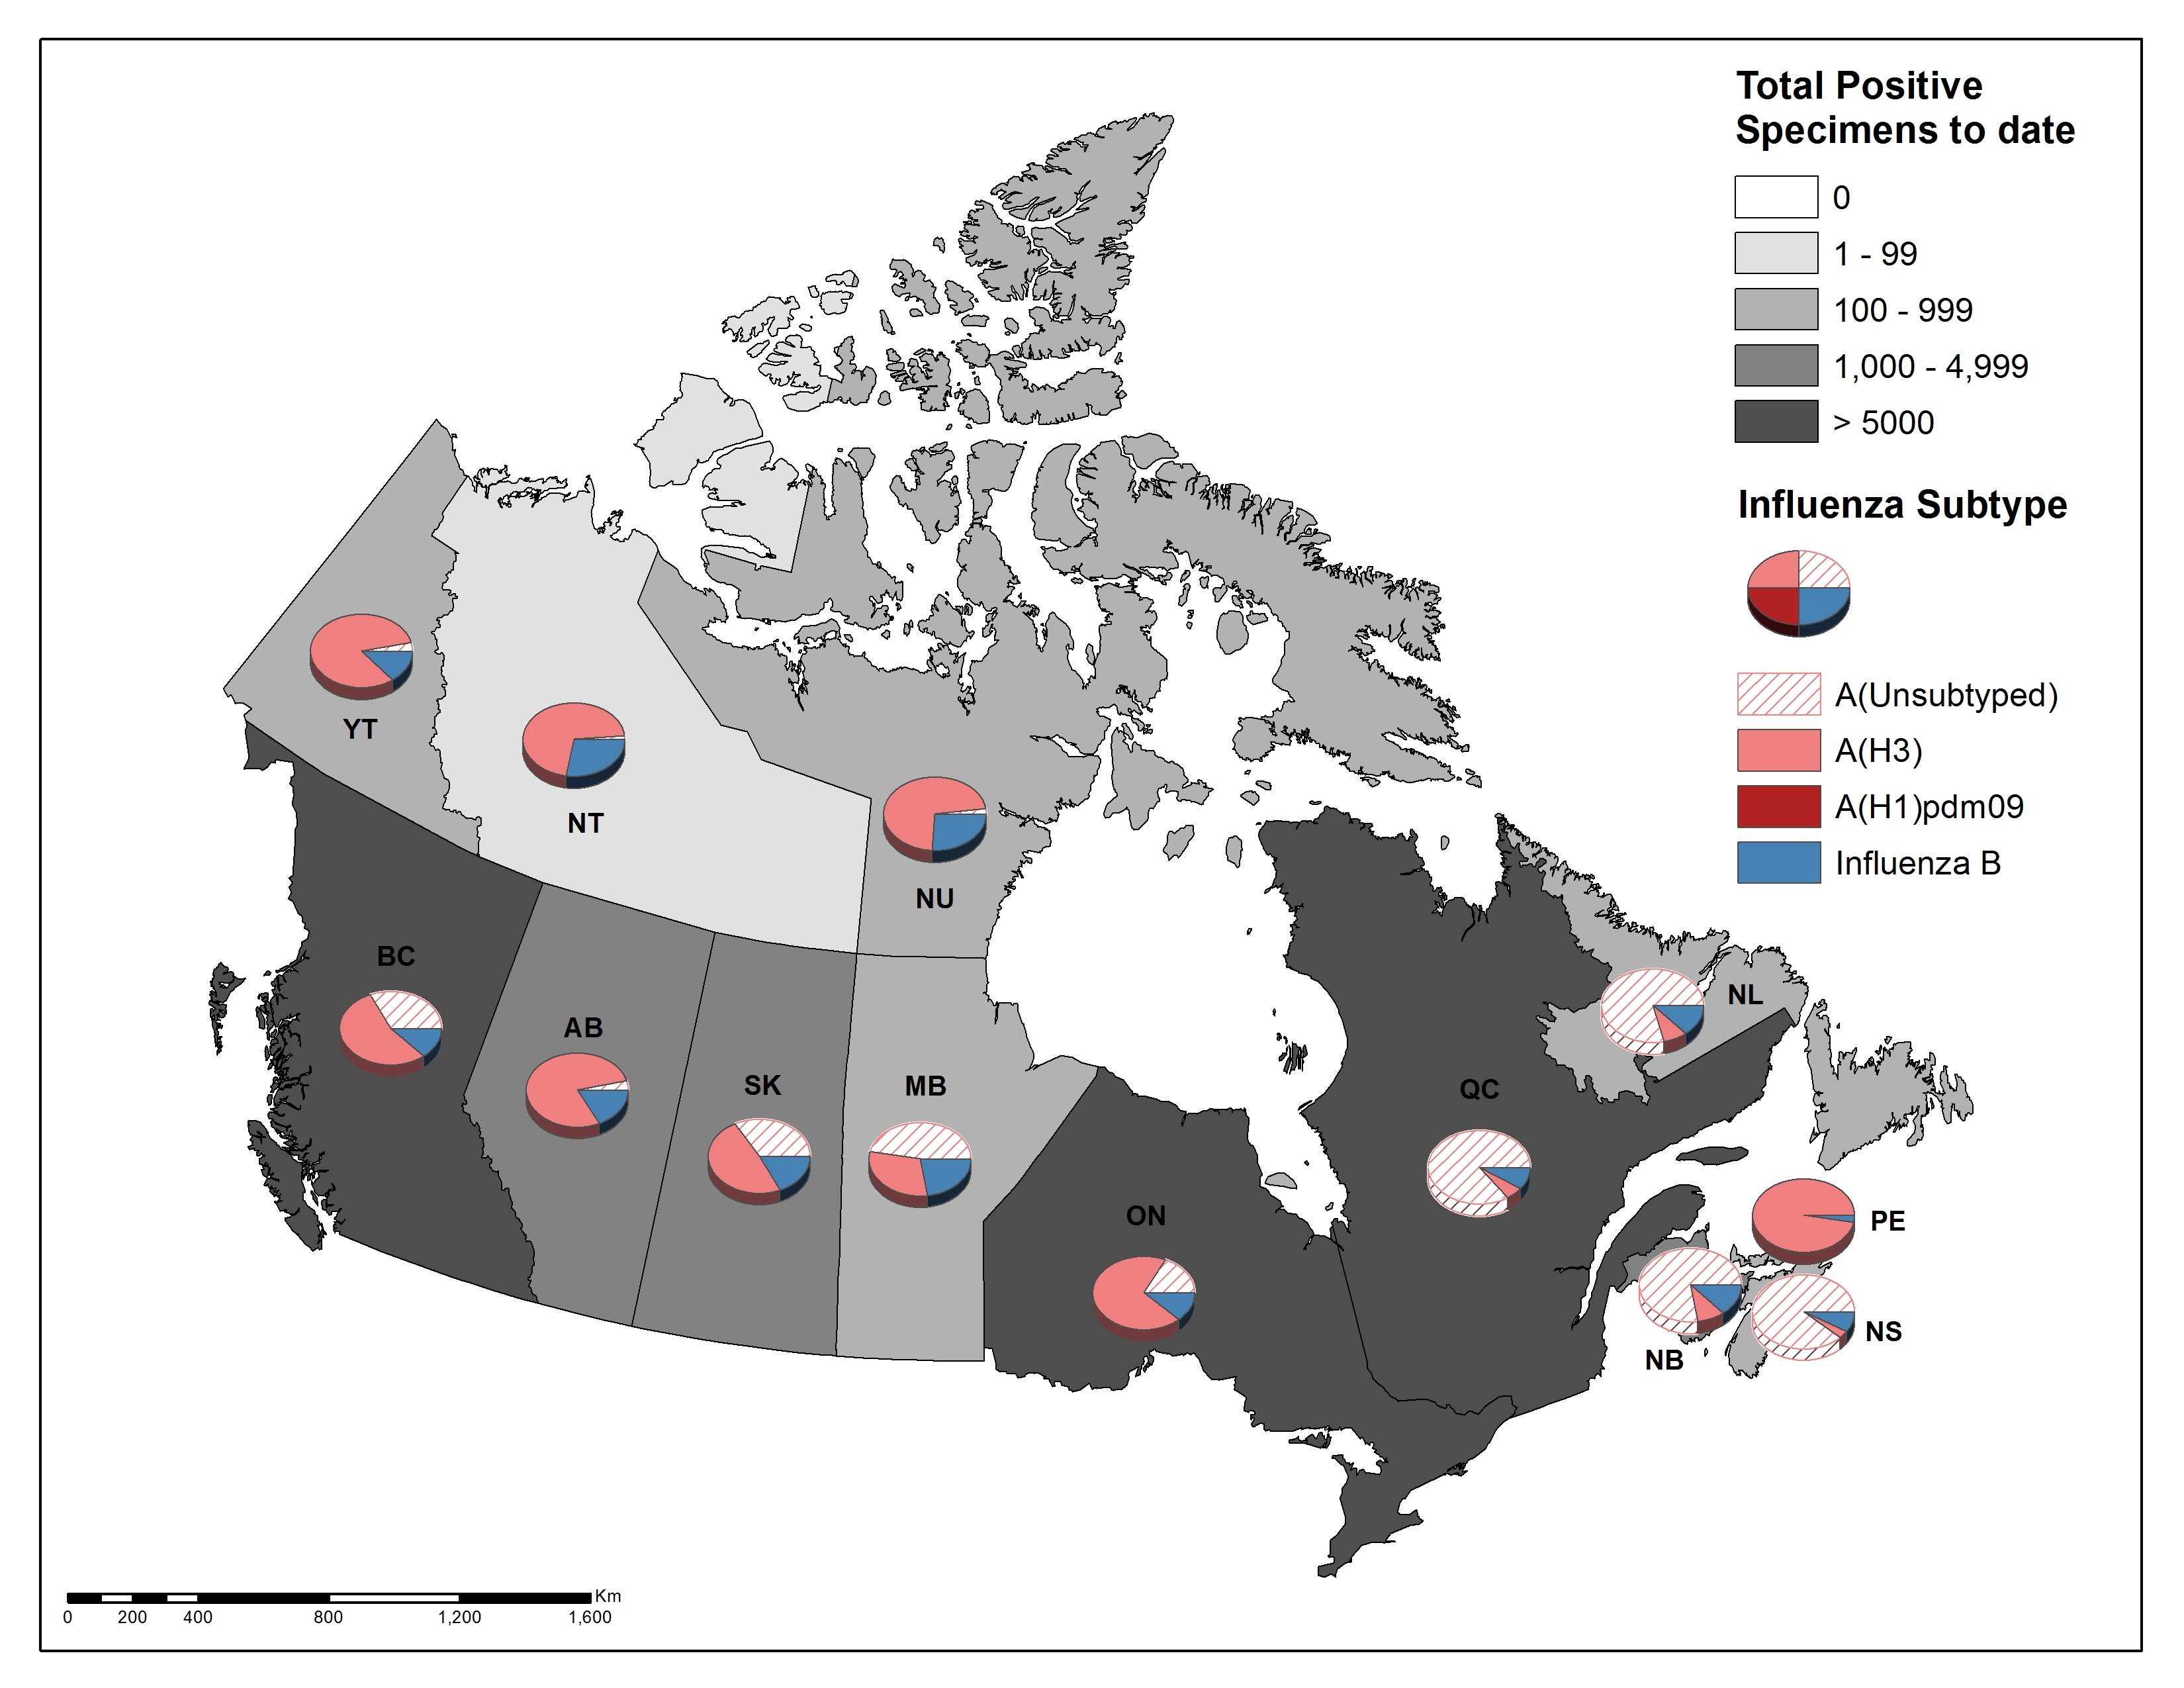
Figure 3 - Text Description
| Reporting provincesTable Figure 3 - Footnote 1 |
Weeks (August 20, 2017 to August 26, 2017) | Cumulative (August 28, 2016 to August 26, 2017) | |||||||||
|---|---|---|---|---|---|---|---|---|---|---|---|
| Influenza A | B | Influenza A | B | A & B Total |
|||||||
| A Total |
A (H1)pdm09 |
A (H3) |
ATable Figure 3 - Footnote UnS | B Total |
A Total |
A (H1)pdm09 |
A (H3) |
ATable Figure 3 - Footnote UnS | B Total |
||
| BC | 3 | 0 | 0 | 3 | 1 | 5389 | 49 | 3338 | 2002 | 727 | 6116 |
| AB | 6 | 0 | 5 | 1 | 0 | 3877 | 34 | 3690 | 153 | 763 | 4640 |
| SK | 0 | 0 | 0 | 0 | 0 | 1798 | 5 | 1049 | 744 | 363 | 2161 |
| MB | 0 | 0 | 0 | 0 | 0 | 485 | 1 | 190 | 294 | 137 | 622 |
| ON | 4 | 0 | 1 | 3 | 0 | 9824 | 83 | 7935 | 1806 | 1211 | 11035 |
| QC | 1 | 0 | 0 | 1 | 0 | 10906 | 0 | 650 | 10254 | 985 | 11891 |
| NB | 0 | 0 | 0 | 0 | 0 | 1168 | 3 | 131 | 1034 | 162 | 1330 |
| NS | 0 | 0 | 0 | 0 | 0 | 417 | 0 | 13 | 404 | 34 | 451 |
| PE | 0 | 0 | 0 | 0 | 0 | 196 | 2 | 194 | 0 | 5 | 201 |
| NL | 0 | 0 | 0 | 0 | 0 | 448 | 0 | 43 | 405 | 62 | 510 |
| YT | 1 | 0 | 0 | 1 | 0 | 175 | 0 | 169 | 6 | 26 | 201 |
| NT | 0 | 0 | 0 | 0 | 0 | 59 | 0 | 58 | 1 | 23 | 82 |
| NU | 0 | 0 | 0 | 0 | 0 | 85 | 0 | 83 | 2 | 30 | 115 |
| Canada | 15 | 0 | 6 | 9 | 1 | 34827 | 177 | 17543 | 17105 | 4528 | 39355 |
| PercentageTable Figure 3 - Footnote 2 | 94% | 0% | 40% | 60% | 6% | 88% | 1% | 50% | 49% | 12% | 100% |
Discrepancies in values in Figures 2 and 3 may be attributable to differing data sources. Cumulative data includes updates to previous weeks. |
|||||||||||
To date this season, detailed information on age and type/subtype has been received for 27,345 laboratory-confirmed influenza cases (Table 1). Among cases with reported age and type/subtype information, adults aged 65+ accounted for nearly half of the reported influenza cases. Adults aged 65+ accounted for 51% of influenza A detections; however the majority of influenza B cases were among those less than 65 years of age.
| Age groups (years) | weeks 34 (August 20, 2017 to August 26, 2017) | Cumulative (August 28, 2016 to August 26, 2017) | ||||||||||
|---|---|---|---|---|---|---|---|---|---|---|---|---|
| Influenza A | B | Influenza A | B | Influenza A and B | ||||||||
| A Total | A(H1) pdm09 | A(H3) | ATable 1 - Footnote UnS | Total | A Total | A(H1) pdm09 | A(H3) | ATable 1 - Footnote UnS | Total | # | % | |
| 0-4 | <5 | 0 | 0 | <5 | 0 | 2262 | 23 | 839 | 1400 | 299 | 2561 | 9% |
| 5-19 | <5 | 0 | <5 | 0 | 0 | 2223 | 19 | 1081 | 1123 | 558 | 2781 | 10% |
| 20-44 | <5 | 0 | 0 | <5 | 0 | 3471 | 38 | 1816 | 1617 | 543 | 4014 | 15% |
| 45-64 | 0 | 0 | 0 | 0 | <5 | 3974 | 38 | 1986 | 1950 | 752 | 4726 | 17% |
| 65+ | 7 | 0 | <5 | <5 | 0 | 12177 | 23 | 5487 | 6667 | 1086 | 13263 | 49% |
| Total | 11 | 0 | 5 | 6 | <5 | 24107 | 141 | 11209 | 12757 | 3238 | 27345 | 100% |
| PercentageTable 1 - Footnote 2 | x% | x% | x% | x% | x% | 88% | 1% | 46% | 53% | 12% | ||
|
||||||||||||
Syndromic/Influenza-like Illness Surveillance
Healthcare Professionals Sentinel Syndromic Surveillance
In weeks 34, the proportion of visits to healthcare professionals due to influenza-like illness decreased from 1.8% in week 33 to 0.8% in week 34.
Figure 4 - Percentage of visits for ILI reported by sentinels by report week, Canada, 2016-17, week 34
Number of Sentinels Reporting Week 34: 88
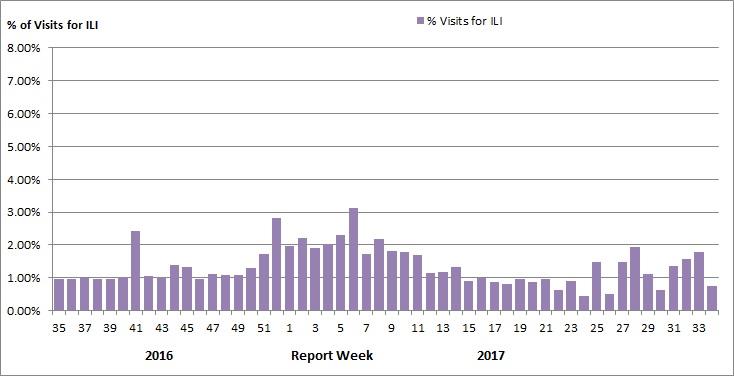
Delays in the reporting of data may cause data to change retrospectively. In BC, AB, and SK, data are compiled by a provincial sentinel surveillance program for reporting to FluWatch. Not all sentinel physicians report every week.
Figure 4 - Text Description
| Report week | % Visits for ILI |
|---|---|
| 35 | 0.96% |
| 36 | 0.96% |
| 37 | 0.98% |
| 38 | 0.96% |
| 39 | 0.94% |
| 40 | 1.03% |
| 41 | 2.41% |
| 42 | 1.04% |
| 43 | 1.01% |
| 44 | 1.39% |
| 45 | 1.32% |
| 46 | 0.97% |
| 47 | 1.11% |
| 48 | 1.07% |
| 49 | 1.08% |
| 50 | 1.30% |
| 51 | 1.73% |
| 52 | 2.83% |
| 1 | 1.96% |
| 2 | 2.22% |
| 3 | 1.92% |
| 4 | 2.02% |
| 5 | 2.31% |
| 6 | 3.13% |
| 7 | 1.73% |
| 8 | 2.19% |
| 9 | 1.82% |
| 10 | 1.77% |
| 11 | 1.70% |
| 12 | 1.13% |
| 13 | 1.18% |
| 14 | 1.31% |
| 15 | 0.88% |
| 16 | 0.98% |
| 17 | 0.86% |
| 18 | 0.81% |
| 19 | 0.96% |
| 20 | 0.85% |
| 21 | 0.94% |
| 22 | 0.64% |
| 23 | 0.89% |
| 24 | 0.43% |
| 25 | 1.48% |
| 26 | 0.49% |
| 27 | 1.49% |
| 28 | 1.93% |
| 29 | 1.12% |
| 30 | 0.63% |
| 31 | 1.37% |
| 32 | 1.57% |
| 33 | 1.79% |
| 34 | 0.75% |
Are you a primary healthcare practitioner (General Practitioner, Nurse Practitioner or Registered Nurse) interested in becoming a FluWatch sentinel?
Please visit our Influenza Sentinel page for more details.
Influenza Outbreak Surveillance
During week 34, no new laboratory-confirmed influenza outbreaks were reported.
To date this season, 1,198 outbreaks have been reported and the majority (66%) have occurred in LTC facilities. Fewer outbreaks were reported this season compared to the same period in the most recent previous A(H3N2)-predominant season (2014-15) when 1,735 outbreaks were reported, of which 74% occurred in LTC facilities.
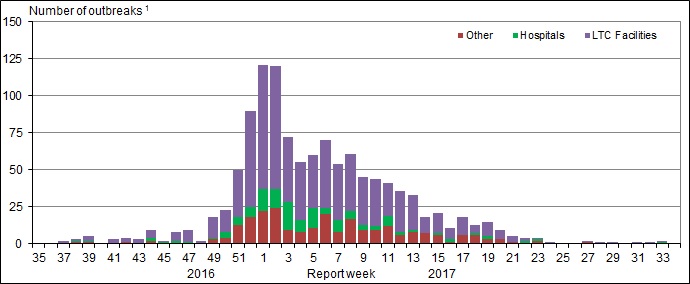
- Figure 5 - Footnote 1
-
All provinces and territories except NU report influenza outbreaks in long-term care facilities. All provinces and territories with the exception of NU and QC report outbreaks in hospitals. Outbreaks of influenza or influenza-like-illness in other facilities are reported to FluWatch but reporting varies between jurisdictions. Outbreak definitions are included at the end of this report.
Figure 5 - Text Description
| Report week | Hospitals | Long Term Care Facilities | Other |
|---|---|---|---|
| 35 | 0 | 0 | 0 |
| 36 | 0 | 0 | 0 |
| 37 | 0 | 2 | 0 |
| 38 | 1 | 1 | 1 |
| 39 | 1 | 3 | 1 |
| 40 | 0 | 0 | 0 |
| 41 | 0 | 3 | 0 |
| 42 | 0 | 3 | 1 |
| 43 | 0 | 3 | 0 |
| 44 | 2 | 5 | 2 |
| 45 | 1 | 1 | 0 |
| 46 | 2 | 6 | 0 |
| 47 | 1 | 8 | 0 |
| 48 | 0 | 2 | 0 |
| 49 | 1 | 14 | 3 |
| 50 | 4 | 15 | 4 |
| 51 | 5 | 32 | 13 |
| 52 | 7 | 65 | 18 |
| 1 | 15 | 84 | 22 |
| 2 | 13 | 83 | 24 |
| 3 | 19 | 44 | 9 |
| 4 | 8 | 39 | 8 |
| 5 | 13 | 36 | 11 |
| 6 | 4 | 46 | 20 |
| 7 | 8 | 38 | 8 |
| 8 | 5 | 39 | 17 |
| 9 | 4 | 32 | 9 |
| 10 | 3 | 32 | 9 |
| 11 | 7 | 22 | 12 |
| 12 | 2 | 28 | 6 |
| 13 | 1 | 24 | 8 |
| 14 | 0 | 11 | 7 |
| 15 | 1 | 14 | 6 |
| 16 | 2 | 8 | 1 |
| 17 | 0 | 12 | 6 |
| 18 | 1 | 6 | 6 |
| 19 | 2 | 10 | 3 |
| 20 | 0 | 6 | 3 |
| 21 | 0 | 4 | 1 |
| 22 | 2 | 2 | 0 |
| 23 | 1 | 1 | 2 |
| 24 | 0 | 1 | 0 |
| 25 | 0 | 0 | 0 |
| 26 | 0 | 0 | 0 |
| 27 | 0 | 1 | 1 |
| 28 | 0 | 1 | 0 |
| 29 | 0 | 1 | 0 |
| 30 | 0 | 0 | 0 |
| 31 | 0 | 1 | 0 |
| 32 | 0 | 1 | 0 |
| 33 | 1 | 1 | 0 |
| 34 | 0 | 0 | 0 |
Provincial/Territorial Influenza Hospitalizations and Deaths
During week 34, the number of influenza-associated hospitalizations reported by participating provinces and territoriesTable 1 - Footnote * remained at low levels. In week 34, five hospitalizations were reported, all were cases of influenza A in adults 65+. No intensive care unit (ICU) admissions and no deaths were reported.
To date this season, 6,546 hospitalizations have been reported, of which 88% were due to influenza A. Among cases for which the subtype of influenza A was reported, 99% were influenza A(H3N2). Adults 65+ accounted for 67% of the hospitalizations. A total of 274 ICU admissions and 388 deaths have been reported. The majority of deaths (88%) were reported in adults aged 65+ years.
| Age Groups (years) | Cumulative (August 28, 2016 to August 26, 2017) | ||||||
|---|---|---|---|---|---|---|---|
| Hospitalizations | ICU Admissions | Deaths | |||||
| Influenza A Total | Influenza B Total | Total [# (%)] | Influenza A and B Total | % | Influenza A and B Total | % | |
| 0-4 | 448 | 95 | 543 (8%) | 20 | 7% | 2 | 1% |
| 5-19 | 241 | 99 | 340 (5%) | 20 | 7% | 3 | 1% |
| 20-44 | 298 | 53 | 351 (5%) | 27 | 10% | 5 | 1% |
| 45-64 | 766 | 143 | 909 (14%) | 83 | 30% | 37 | 10% |
| 65+ | 3976 | 427 | 4403 (67%) | 124 | 45% | 341 | 88% |
| Total | 5729 | 817 | 6546 (100%) | 274 | 100% | 388 | 100% |
|
|||||||
Sentinel Hospital Influenza Surveillance
Pediatric Influenza Hospitalizations and Deaths
In week 34, no laboratory-confirmed influenza-associated pediatric (≤16 years of age) hospitalizations were reported by the Immunization Monitoring Program Active (IMPACT) network.
To date this season, 595 laboratory-confirmed influenza-associated pediatric hospitalizations were reported by the IMPACT network. Children aged 0-23 months accounted for approximately 37% of hospitalizations and influenza A accounted for 78% of the reported hospitalizations. Among the 130 hospitalizations due to influenza B, 69 (52%) were in children 5 to 16 years of age. In comparison, children over the age of 5 years accounted for 33% of influenza A hospitalizations. Additionally, 100 intensive care unit (ICU) admissions have been reported. A total of 67 ICU cases (67%) reported at least one underlying condition or comorbidity. Less than five deaths have been reported this season.
Figure 6 - Cumulative numbers of pediatric hospitalizations (≤16 years of age) with influenza by type and age-group reported by the IMPACT network, Canada, 2016-17, week 34
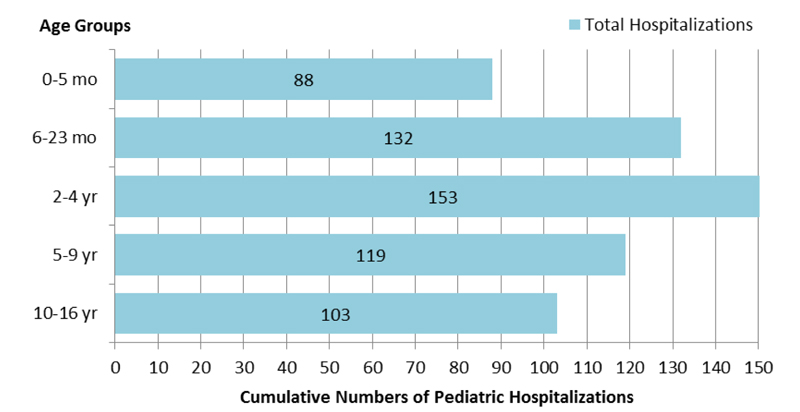
Figure 6 - Text Description
| Age Group | Total |
|---|---|
| 0-5 mo | 88 |
| 6-23 mo | 132 |
| 2-4 yr | 153 |
| 5-9 yr | 119 |
| 10-16 yr | 103 |
Figure 7 – Number of pediatric hospitalizations (≤16 years of age) with influenza reported by the IMPACT network, by week, Canada, 2016-17, week 34
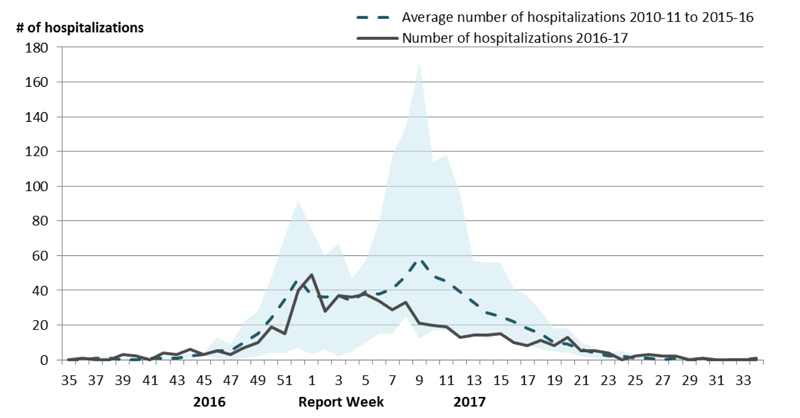
The shaded area represents the maximum and minimum number of cases reported by week from seasons 2010-11 to 2015-16.
The number of hospitalizations reported through IMPACT represents a subset of all influenza-associated pediatric and adult hospitalizations in Canada. Delays in the reporting of data may cause data to change retrospectively.
Figure 7 - Text Description
| Report week | 2016-17 | Average | Min | Max |
|---|---|---|---|---|
| 35 | 0 | 0 | 0 | 0 |
| 36 | 1 | 0 | 0 | 0 |
| 37 | 0 | 1 | 0 | 2 |
| 38 | 0 | 1 | 0 | 2 |
| 39 | 3 | 0 | 0 | 1 |
| 40 | 2 | 0 | 0 | 1 |
| 41 | 0 | 1 | 0 | 2 |
| 42 | 4 | 1 | 0 | 1 |
| 43 | 3 | 1 | 0 | 3 |
| 44 | 6 | 2 | 1 | 4 |
| 45 | 3 | 3 | 2 | 4 |
| 46 | 5 | 5 | 1 | 13 |
| 47 | 3 | 5 | 0 | 9 |
| 48 | 7 | 10 | 1 | 22 |
| 49 | 10 | 15 | 2 | 28 |
| 50 | 19 | 24 | 4 | 47 |
| 51 | 15 | 35 | 4 | 71 |
| 52 | 39 | 47 | 7 | 92 |
| 1 | 49 | 37 | 3 | 75 |
| 2 | 28 | 36 | 6 | 60 |
| 3 | 37 | 37 | 2 | 67 |
| 4 | 36 | 34 | 5 | 47 |
| 5 | 38 | 39 | 10 | 57 |
| 6 | 34 | 38 | 15 | 79 |
| 7 | 30 | 41 | 15 | 118 |
| 8 | 32 | 48 | 25 | 134 |
| 9 | 21 | 59 | 12 | 172 |
| 10 | 20 | 48 | 17 | 114 |
| 11 | 19 | 45 | 17 | 118 |
| 12 | 13 | 39 | 14 | 96 |
| 13 | 14 | 33 | 14 | 57 |
| 14 | 14 | 27 | 12 | 56 |
| 15 | 15 | 25 | 14 | 56 |
| 16 | 10 | 22 | 10 | 41 |
| 17 | 8 | 18 | 9 | 37 |
| 18 | 11 | 15 | 6 | 28 |
| 19 | 10 | 10 | 5 | 18 |
| 20 | 13 | 9 | 4 | 18 |
| 21 | 5 | 6 | 2 | 10 |
| 22 | 6 | 4 | 1 | 7 |
| 23 | 3 | 2 | 0 | 4 |
| 24 | 0 | 2 | 0 | 5 |
| 25 | 2 | 1 | 0 | 3 |
| 26 | 3 | 1 | 0 | 2 |
| 27 | 2 | 0 | 0 | 2 |
| 28 | 2 | 1 | 0 | 1 |
| 29 | 0 | 0 | 0 | 2 |
| 30 | 1 | 0 | 0 | 0 |
| 31 | 0 | 0 | 0 | 0 |
| 32 | 0 | 0 | 0 | 1 |
| 33 | 0 | 0 | 0 | 0 |
| 34 | 0 | 1 | 0 | 2 |
Adult Influenza Hospitalizations and Deaths
Surveillance for the 2016-2017 influenza season ended on April 30th, 2017 (week 20).
This season, 1,535 laboratory-confirmed influenza-associated adult (≥20 years of age) hospitalizations have been reported by the Canadian Immunization Research Network (CIRN). Influenza A accounted for 92% of hospitalizations. Adults aged 65+ accounted for 78% of hospitalizations. A total of 143 intensive care unit (ICU) admissions have been reported. Among ICU cases with available data, 126 cases (88%) reported at least one underlying condition or comorbidity. The median age of patients admitted to the ICU was 71 years. More than 86 deaths have been reported this season, the majority in adults aged 65+. The median age of reported deaths was 85 years.
Figure 8 - Cumulative numbers of adult hospitalizations (≥20 years of age) with influenza by type and age-group reported by CIRN, Canada, 2016-17, week 20
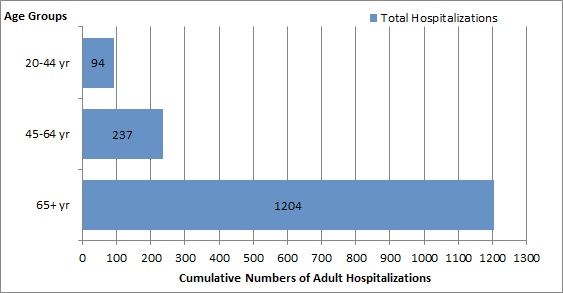
Figure 8 - Text Description
| Age Group | Total |
|---|---|
| 20-44 yr | 94 |
| 45-64 yr | 237 |
| 65+ yr | 1204 |
Figure 9 – Percentage of hospitalizations, ICU admissions and deaths with influenza by age-group (≥20 years of age) reported by CIRN, Canada 2016-17, week 20
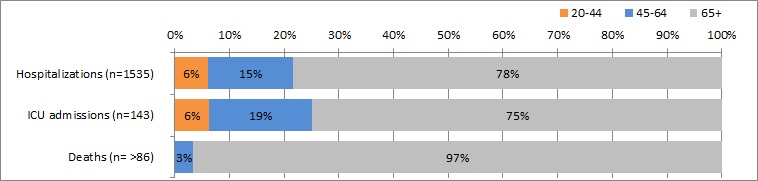
The number of hospitalizations reported through CIRN represents a subset of all influenza-associated adult hospitalizations in Canada. Delays in the reporting of data may cause data to change retrospectively.
Figure 9 - Text Description
| Age-group (years) | Hospitalizations (n= 1535) | ICU admissions (n= 143) | Deaths (> 86) |
|---|---|---|---|
| 20-44 | 6.1% | 6.3% | - |
| 45-64 | 15.4% | 18.9% | 3.0% |
| 65+ | 78.4% | 74.8% | 96.6% |
- Supressed due to small values |
|||
Influenza Strain Characterizations
During the 2016-17 influenza season, the National Microbiology Laboratory (NML) has characterized 2,352 influenza viruses [1,658 A(H3N2), 62 A(H1N1), 632 influenza B]. Among viruses characterized during the 2016-17 season, all seasonal influenza A viruses and 20% of influenza B viruses were antigenically or genetically similar to the vaccine strains included in both the trivalent and quadrivalent vaccines. Eighty percent of influenza B viruses characterized were similar to the strain which is only included in the quadrivalent vaccine.
| Strain Characterization ResultsTable 3 - Footnote 1 | Count | Description |
|---|---|---|
| Influenza A (H3N2) | ||
| Antigenically A/Hong Kong/4801/2014-like |
396 | Viruses antigenically similar to A/Hong Kong/4801/2014, the A(H3N2) component of the 2016-17 Northern Hemisphere's trivalent and quadrivalent vaccine. |
| GeneticallyTable 3 - Footnote 2 A/Hong Kong/4801/2014-like |
1261 | Viruses belonging to genetic group 3C.2a. A/Hong Kong/4801/2014-like virus belongs to genetic group 3C.2a and is the influenza A(H3N2) component of the 2016-17 Northern Hemisphere's trivalent and quadrivalent vaccine. Additionally, one virus belonged to genetic group 3C.3a. Genetic characterization of the 396 influenza A (H3N2) viruses that underwent HI testing determined that 331 viruses belonged to genetic group 3C.2a and 65 viruses belonged to genetic group 3C.3a. The majority of viruses belonging to genetic group 3C.3a are inhibited by antisera raised against A/Hong Kong/4801/2014Table 3 - Footnote 3. |
| Antigenically A/Indiana/10/2011-likeTable 3 - Footnote 4 |
1 | Viruses antigenically similar to A/Indiana/10/2011, a candidate H3N2v vaccine virus. |
| Influenza A (H1N1) | ||
| A/California/7/2009-like | 62 | Viruses antigenically similar to A/California/7/2009, the A(H1N1) component of the 2016-17 Northern Hemisphere's trivalent and quadrivalent influenza vaccine. |
| Influenza B | ||
| B/Brisbane/60/2008-like (Victoria lineage) |
128 | Viruses antigenically similar to B/Brisbane/60/2008, the influenza B component of the 2016-17 Northern Hemisphere's trivalent and quadrivalent influenza vaccine |
| B/Phuket/3073/2013-like (Yamagata lineage) |
504 | Viruses antigenically similar to B/Phuket/3073/2013, the additional influenza B component of the 2016-17 Northern Hemisphere quadrivalent influenza vaccine. |
|
||
Antiviral Resistance
During the 2016-17 season, the National Microbiology Laboratory (NML) has tested 1,260 influenza viruses for resistance to oseltamivir, 1,260 influenza viruses for resistance to zanamivir and 288 influenza viruses for resistance to amantadine. All but two influenza A(H3N2) viruses and one of the A(H1N1) viruses were sensitive to oseltamivir and all viruses were sensitive to zanamivir. All 288 influenza A viruses were resistant to amantadine (Table 4).
| Virus type and subtype | Oseltamivir | Zanamivir | Amantadine | |||
|---|---|---|---|---|---|---|
| # tested | # resistant (%) | # tested | # resistant (%) | # tested | # resistant (%) | |
| A (H3N2) | 765 | 2 (0.3%) | 764 | 0 (0%) | 232 | 232 (100%) |
| A (H3N2v) | 1 | 0 (0%) | 1 | 0 (0%) | 1 | 1 (100%) |
| A (H1N1) | 52 | 1 (1.9%) | 51 | 0 (0%) | 55 | 55 (100%) |
| B | 442 | 0 (0%) | 444 | 0 (0%) | N/ATable 4 - Footnote * | N/ATable 4 - Footnote * |
| TOTAL | 1260 | 3 (0.2%) | 1260 | 0 (0%) | 288 | 288 (100%) |
|
||||||
Provincial and International Influenza Reports
- World Health Organization influenza update
- World Health Organization FluNet
- WHO Influenza at the human-animal interface
- Centers for Disease Control and Prevention seasonal influenza report
- European Centre for Disease Prevention and Control - epidemiological data
- South Africa Influenza surveillance report
- New Zealand Public Health Surveillance
- Australia Influenza Report
- Pan-American Health Organization Influenza Situation Report
- Alberta Health - Influenza Surveillance Report
- BC - Centre for Disease Control (BCCDC) - Influenza Surveillance
- New Brunswick - Influenza Surveillance Reports
- Newfoundland and Labrador - Surveillance and Disease Reports
- Nova Scotia - Flu Information
- Public Health Ontario - Ontario Respiratory Pathogen Bulletin
- Quebec - Système de surveillance de la grippe
- Manitoba - Epidemiology and Surveillance - Influenza Reports
- Saskatchewan - influenza Reports
- PEI - Influenza Summary
FluWatch definitions for the 2016-2017 season
Abbreviations: Newfoundland/Labrador (NL), Prince Edward Island (PE), New Brunswick (NB), Nova Scotia (NS), Quebec (QC), Ontario (ON), Manitoba (MB), Saskatchewan (SK), Alberta (AB), British Columbia (BC), Yukon (YT), Northwest Territories (NT), Nunavut (NU).
Influenza-like-illness (ILI): Acute onset of respiratory illness with fever and cough and with one or more of the following - sore throat, arthralgia, myalgia, or prostration which is likely due to influenza. In children under 5, gastrointestinal symptoms may also be present. In patients under 5 or 65 and older, fever may not be prominent.
ILI/Influenza outbreaks
- Schools:
- Greater than 10% absenteeism (or absenteeism that is higher (e.g. >5-10%) than expected level as determined by school or public health authority) which is likely due to ILI.
Note: it is recommended that ILI school outbreaks be laboratory confirmed at the beginning of influenza season as it may be the first indication of community transmission in an area. - Hospitals and residential institutions:
- two or more cases of ILI within a seven-day period, including at least one laboratory confirmed case. Institutional outbreaks should be reported within 24 hours of identification. Residential institutions include but not limited to long-term care facilities (LTCF) and prisons.
- Workplace:
- Greater than 10% absenteeism on any day which is most likely due to ILI.
- Other settings:
- two or more cases of ILI within a seven-day period, including at least one laboratory confirmed case; i.e. closed communities.
Note that reporting of outbreaks of influenza/ILI from different types of facilities differs between jurisdictions.
Influenza/ILI activity level
1 = No activity: no laboratory-confirmed influenza detections in the reporting week, however, sporadically occurring ILI may be reported
2 = Sporadic: sporadically occurring ILI and lab confirmed influenza detection(s) with no outbreaks detected within the influenza surveillance region Footnote †
3 = Localized:
- evidence of increased ILIFootnote * and
- lab confirmed influenza detection(s) together with
- outbreaks in schools, hospitals, residential institutions and/or other types of facilities occurring in less than 50% of the influenza surveillance regionFootnote †
4 = Widespread:
- evidence of increased ILIFootnote * and
- lab confirmed influenza detection(s) together with
- outbreaks in schools, hospitals, residential institutions and/or other types of facilities occurring in greater than or equal to 50% of the influenza surveillance regionFootnote †
Note: ILI data may be reported through sentinel physicians, emergency room visits or health line telephone calls.
- Footnote *
-
More than just sporadic as determined by the provincial/territorial epidemiologist.
- Footnote †
-
Influenza surveillance regions within the province or territory as defined by the provincial/territorial epidemiologist.