
FluWatch report: April 15, 2018 to April 21, 2018 (Week 16)
Overall Summary
- Overall, influenza activity in Canada continued to decrease, but parts of the country are still reporting localized activity.
- All indicators of influenza activity have either decreased or remained similar to the previous week.
- Detections of influenza A were greater than those of influenza B.
- To date this season, the majority of laboratory-confirmed cases, hospitalizations and deaths with influenza have been among adults 65 years of age and older.
- For more information on the flu, see our Flu(influenza) web page.
On this page
- Influenza/ILI Activity (geographic spread)
- Laboratory Confirmed Influenza Detections
- Syndromic/Influenza-like Illness Surveillance
- Influenza Outbreak Surveillance
- Severe Outcomes Influenza Surveillance
- Influenza Strain Characterizations
- Antiviral Resistance
- Provincial and International Influenza Reports
- FluWatch Surveillance System Description and Definitions, 2017-18
Download the alternative format
(PDF format, 1.7 MB, 11 pages)
Organization:
Public Health Agency of Canada
Date published: 2018-04-27
Related Topics
Influenza/Influenza-like Illness Activity (geographic spread)
In week 16, 14 regions ( ON(7), QC(1), NB(2), NL(2), NS(1) and NT(1)) reported localized activity. Six regions reported no influenza activity.
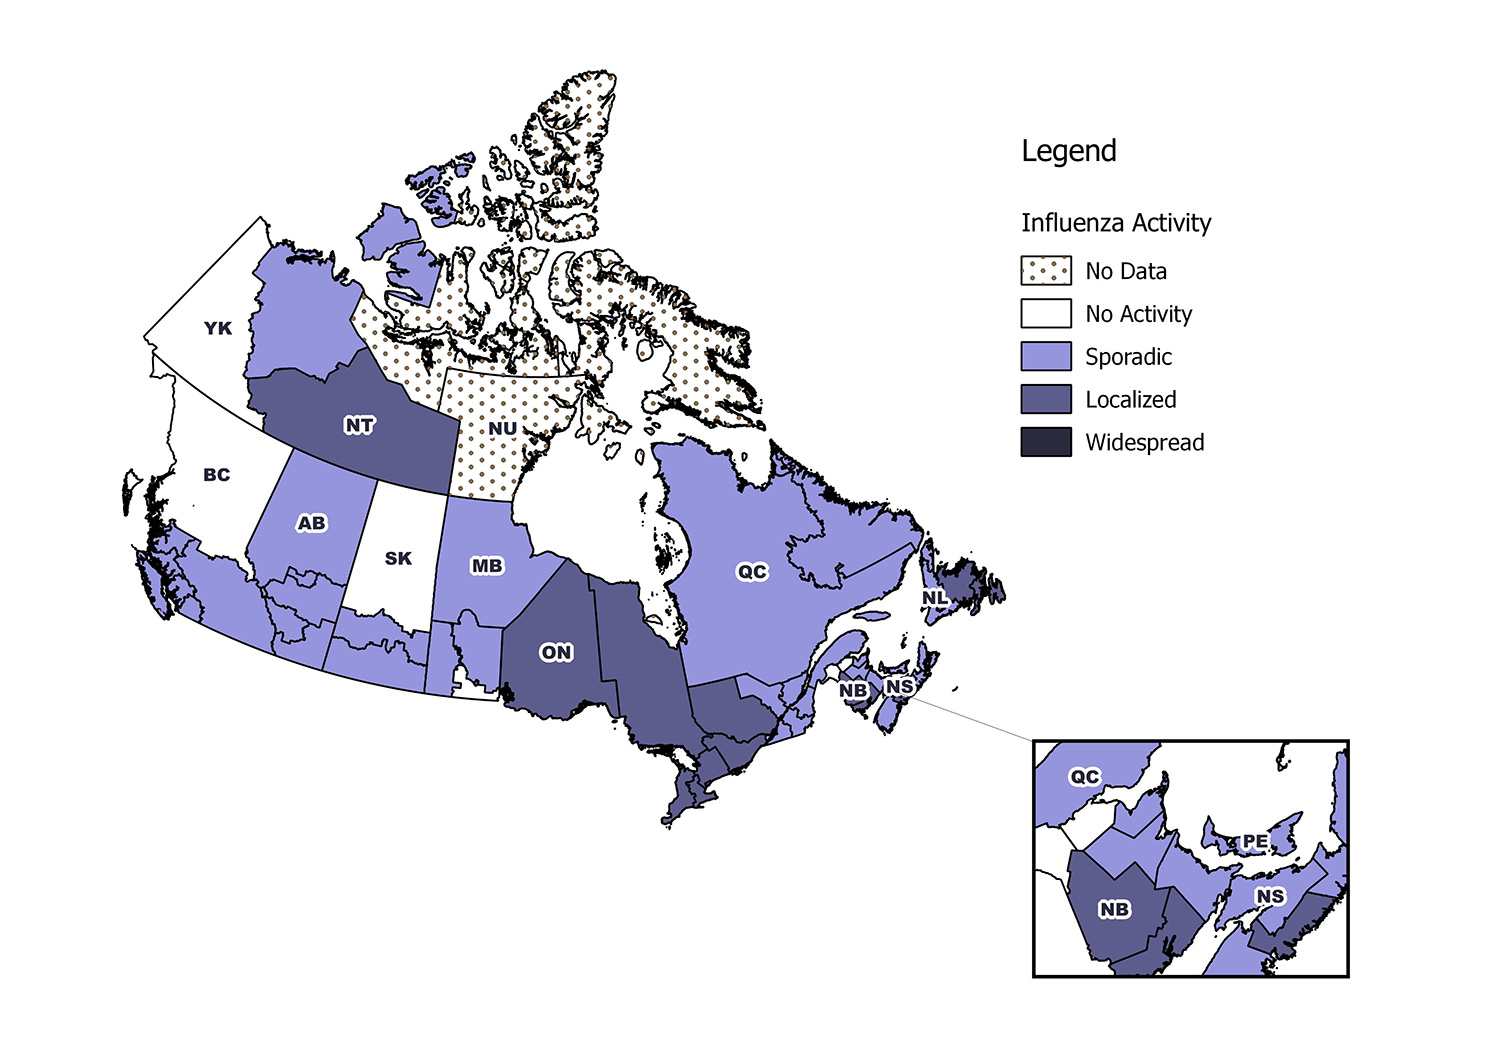
Note: Influenza/ILI activity levels, as represented on this map, are assigned and reported by Provincial and Territorial Ministries of Health, based on laboratory confirmations, sentinel ILI rates and reported outbreaks. Please refer to detailed definitions at the end of the report. Maps from previous weeks, including any retrospective updates, are available in the mapping feature found in the Weekly Influenza Reports.
Figure 1 - Text description
| Influenza Surveillance Region | Activity Level |
|---|---|
| Newfoundland - Central | Localized |
| Newfoundland - Eastern | Localized |
| Grenfell Labrador | Sporadic |
| Newfoundland - Western | Sporadic |
| Prince Edward Island | Sporadic |
| Nova Scotia - Central (Zone 4) | Localized |
| Nova Scotia - Western (Zone 1) | Sporadic |
| Nova Scotia - Northern (Zone 2) | Sporadic |
| Nova Scotia - Eastern (Zone 3) | Sporadic |
| New Brunswick - Public Health Region 1 | Sporadic |
| New Brunswick - Public Health Region 2 | Localized |
| New Brunswick - Public Health Region 3 | Localized |
| New Brunswick - Public Health Region 4 | No Activity |
| New Brunswick - Public Health Region 5 | No Activity |
| New Brunswick - Public Health Region 6 | Sporadic |
| New Brunswick - Public Health Region 7 | Sporadic |
| Nord-est Québec | Sporadic |
| Québec et Chaudieres-Appalaches | Sporadic |
| Centre-du-Québec | Sporadic |
| Montréal et Laval | Sporadic |
| Ouest-du-Québec | Localized |
| Montérégie | Sporadic |
| Ontario - Central East | Localized |
| Ontario - Central West | Localized |
| Ontario - Eastern | Localized |
| Ontario - North East | Localized |
| Ontario - North West | Localized |
| Ontario - South West | Localized |
| Ontario - Toronto | Localized |
| Manitoba - Interlake-Eastern | Sporadic |
| Manitoba - Northern Regional | Sporadic |
| Manitoba - Prairie Mountain | Sporadic |
| Manitoba - South | No Activity |
| Manitoba - Winnipeg | Sporadic |
| Saskatchewan - North | No Activity |
| Saskatchewan - Central | Sporadic |
| Saskatchewan - South | Sporadic |
| Alberta - North Zone | Sporadic |
| Alberta - Edmonton | Sporadic |
| Alberta - Central Zone | Sporadic |
| Alberta - Calgary | Sporadic |
| Alberta - South Zone | Sporadic |
| British Columbia - Interior | Sporadic |
| British Columbia - Fraser | Sporadic |
| British Columbia - Vancouver Coastal | Sporadic |
| British Columbia - Vancouver Island | Sporadic |
| British Columbia - Northern | No Activity |
| Yukon | No Activity |
| Northwest Territories - North | Sporadic |
| Northwest Territories - South | Localized |
| Nunavut - Baffin | No Data |
| Nunavut - Kivalliq | No Data |
| Nunavut - Kitimeot | No Data |
Laboratory-Confirmed Influenza Detections
In week 16, the overall percentage of tests positive for influenza was 12%, a decrease from the previous week. Overall, laboratory detections of influenza are steadily decreasing. In week 16, 719 positive influenza tests were reported, down from 955 tests reported in week 15. Influenza A accounted for 57% of influenza detections in week 16.
Overall, laboratory detections of influenza are around the average for this time of year. For data on other respiratory virus detections, see the Respiratory Virus Detections in Canada Report.
Figure 2 - Number of positive influenza tests and percentage of tests positive, by type, subtype and report week, Canada, weeks 2017-35 to 2018-16
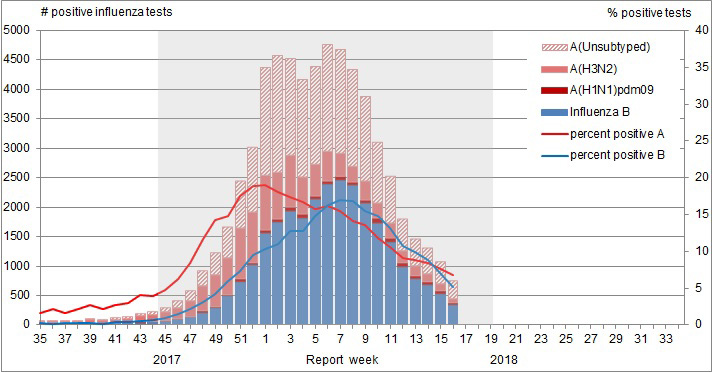
The shaded area indicates weeks where the positivity rate was at least 5% and a minimum of 15 positive tests were observed, signalling the period of seasonal influenza activity.
Figure 2 - Text description
| Report Week | A(Unsubtyped) | A(H3N2) | A(H1N1)pdm09 | Influenza B |
|---|---|---|---|---|
| 35 | 3 | 20 | 6 | 5 |
| 36 | 7 | 28 | 1 | 3 |
| 37 | 7 | 14 | 13 | 4 |
| 38 | 18 | 31 | 3 | 5 |
| 39 | 18 | 53 | 1 | 8 |
| 40 | 24 | 41 | 1 | 5 |
| 41 | 32 | 50 | 0 | 11 |
| 42 | 27 | 73 | 1 | 15 |
| 43 | 44 | 107 | 3 | 21 |
| 44 | 52 | 114 | 3 | 30 |
| 45 | 71 | 153 | 7 | 47 |
| 46 | 113 | 187 | 13 | 75 |
| 47 | 157 | 272 | 13 | 112 |
| 48 | 259 | 417 | 33 | 190 |
| 49 | 370 | 544 | 16 | 274 |
| 50 | 523 | 633 | 16 | 473 |
| 51 | 800 | 864 | 51 | 719 |
| 52 | 1105 | 856 | 33 | 1008 |
| 1 | 1836 | 925 | 60 | 1539 |
| 2 | 1987 | 808 | 49 | 1730 |
| 3 | 1649 | 870 | 80 | 1912 |
| 4 | 1675 | 632 | 57 | 1802 |
| 5 | 1664 | 542 | 54 | 2125 |
| 6 | 1819 | 506 | 49 | 2383 |
| 7 | 1754 | 405 | 63 | 2443 |
| 8 | 1642 | 279 | 51 | 2354 |
| 9 | 1437 | 325 | 51 | 2057 |
| 10 | 1023 | 265 | 80 | 1714 |
| 11 | 807 | 246 | 73 | 1387 |
| 12 | 551 | 189 | 76 | 966 |
| 13 | 458 | 183 | 40 | 767 |
| 14 | 436 | 143 | 49 | 661 |
| 15 | 370 | 127 | 57 | 500 |
| 16 | 306 | 79 | 29 | 318 |
To date this season, 62,933 laboratory-confirmed influenza detections have been reported, of which 56% have been influenza A. Influenza A(H3N2) has been the most common subtype detected this season, representing 91% of subtyped influenza A detections. For more detailed weekly and cumulative influenza data, see the text descriptions for Figures 2 and 3 or the Respiratory Virus Detections in Canada Report.
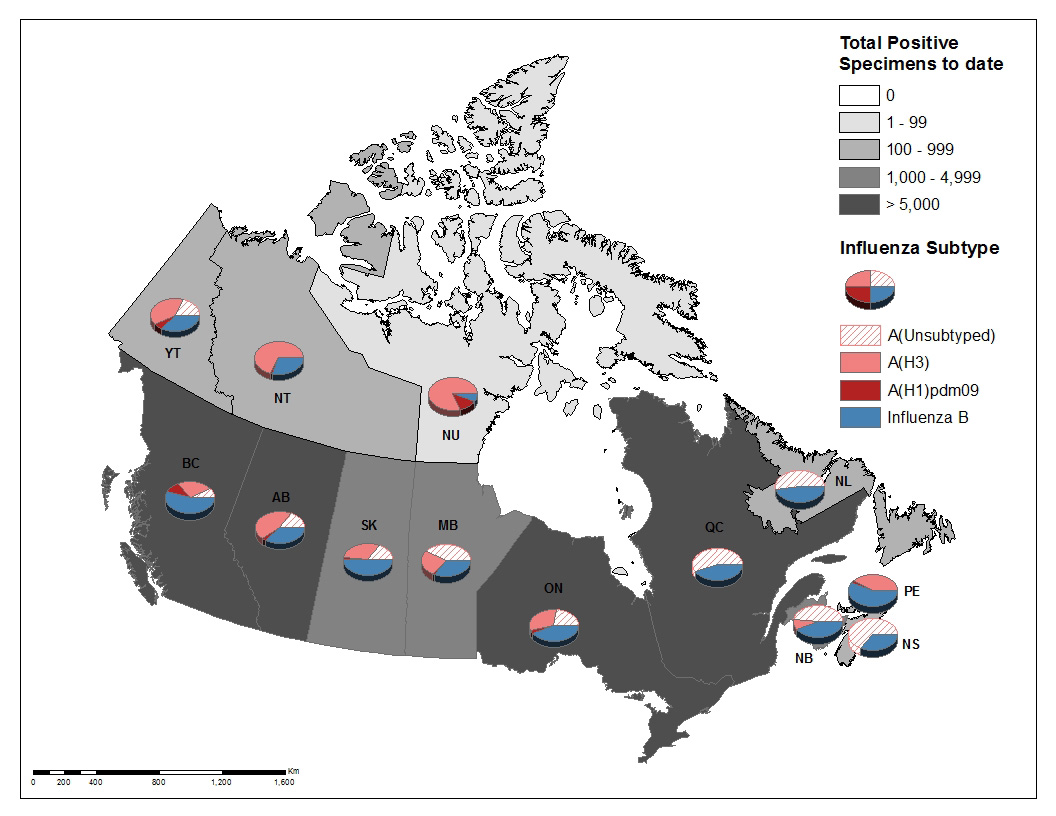
Figure 3 - Text description
| Reporting provincesTable Figure 3 - Footnote 1 | Week (April 15, 2018 to April 21, 2018) | Cumulative (August 27, 2017 to April 21, 2018) | |||||||||
|---|---|---|---|---|---|---|---|---|---|---|---|
| Influenza A | B | Influenza A | B | A & B | |||||||
| A Total | A(H1N1)pdm09 | A(H3N2) | A(UnS)Table Figure 3 - Footnote 3 | B Total | A Total | A(H1N1)pdm09 | A(H3N2) | A(UnS)Table Figure 3 - Footnote 3 | B Total | Total | |
| BC | 16 | 6 | 9 | 1 | 15 | 2437 | 503 | 1497 | 437 | 2992 | 5429 |
| AB | 12 | 7 | 3 | 2 | 40 | 5617 | 226 | 3988 | 1403 | 3319 | 8936 |
| SK | 4 | 1 | 1 | 2 | 17 | 1722 | 63 | 1149 | 510 | 1707 | 3429 |
| MB | 2 | 2 | 0 | 0 | 16 | 1131 | 18 | 377 | 736 | 613 | 1744 |
| ON | 118 | 11 | 55 | 52 | 66 | 6178 | 276 | 3410 | 2492 | 4722 | 10900 |
| QC | 128 | 0 | 0 | 128 | 77 | 15276 | 0 | 0 | 15276 | 12250 | 27526 |
| NB | 89 | 0 | 9 | 80 | 57 | 1511 | 22 | 216 | 1273 | 1155 | 2666 |
| NS | 13 | 0 | 0 | 13 | 4 | 518 | 0 | 0 | 518 | 286 | 804 |
| PE | 2 | 0 | 2 | 0 | 4 | 129 | 7 | 121 | 1 | 165 | 294 |
| NL | 27 | 0 | 0 | 27 | 11 | 449 | 0 | 3 | 446 | 403 | 852 |
| YT | 0 | 0 | 0 | 0 | 0 | 75 | 7 | 47 | 21 | 43 | 118 |
| NT | 0 | 0 | 0 | 0 | 1 | 130 | 4 | 126 | 0 | 56 | 186 |
| NU | 0 | 0 | 0 | 0 | 0 | 46 | 6 | 40 | 0 | 3 | 49 |
| Canada | 411 | 27 | 79 | 305 | 308 | 35219 | 1132 | 10974 | 23113 | 27714 | 62933 |
| PercentageTable figure 3 Footnote 2 | 57% | 7% | 19% | 74% | 43% | 56% | 3% | 31% | 66% | 44% | 100% |
Discrepancies in values in Figures 2 and 3 may be attributable to differing data sources. Cumulative data includes updates to previous weeks. |
|||||||||||
To date this season, detailed information on age and type/subtype has been received for 50,729 laboratory-confirmed influenza cases (Table 1). Adults 65 years of age and older represent the largest proportion of cases overall (50%), and among cases of influenza A(H3N2) (59%) and influenza B (48%). Adults aged 20-64 represent 32% of cases overall and 29% of influenza A(H3N2) and 34% of influenza B cases. Although much smaller in numbers (898), the majority of influenza A(H1N1)pdm09 cases are among adults less than 65 years of age, with adults aged 20-64 and children 0-19 years accounting for 54% and 30% of cases respectively.
| Age groups (years) | Cumulative (August 27, 2017 to April 21, 2018) | ||||||
|---|---|---|---|---|---|---|---|
| Influenza A | B | Influenza A and B | |||||
| A Total | A(H1N1) pdm09 | A(H3N2) | A (UnS)table 1 note 1 | Total | # | % | |
| 0-4 | 3099 | 148 | 556 | 2395 | 1461 | 4560 | 9% |
| 5-19 | 2273 | 125 | 538 | 1610 | 2536 | 4809 | 9% |
| 20-44 | 4179 | 251 | 1183 | 2745 | 2732 | 6911 | 14% |
| 45-64 | 4605 | 231 | 1432 | 2942 | 4628 | 9233 | 18% |
| 65+ | 14791 | 143 | 5392 | 9256 | 10425 | 25216 | 50% |
| Total | 28947 | 898 | 9101 | 18948 | 21782 | 50729 | 100% |
Table 1 Notes
|
|||||||
Syndromic/Influenza-like Illness Surveillance
Healthcare Practitioners Sentinel Syndromic Surveillance
In week 16, 1.7% of visits to healthcare professionals were due to influenza-like illness (ILI); a decrease from the previous week.
Figure 4 - Percentage of visits for ILI reported by sentinels by report week, Canada, weeks 2017-35 to 2018-16
Number of participants in week 16: 158
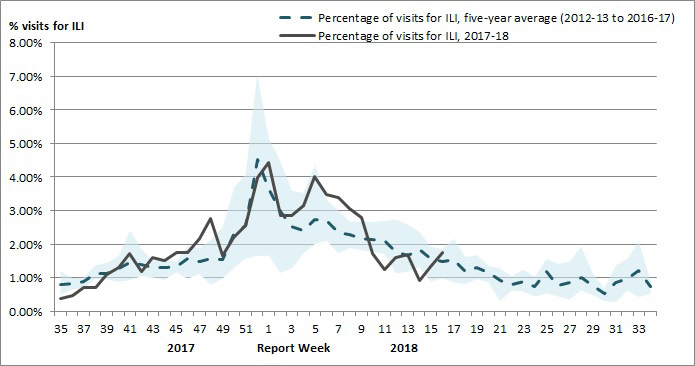
The shaded area represents the maximum and minimum percentage of visits for ILI reported by week from seasons 2012-13 to 2016-17
Figure 4 - Text description
| Semaine de déclaration | 2017-18 | Moyenne | Min | Max |
|---|---|---|---|---|
| 35 | 0.4% | 0.8% | 0.5% | 1.2% |
| 36 | 0.5% | 0.8% | 0.7% | 1.0% |
| 37 | 0.7% | 0.9% | 0.7% | 1.0% |
| 38 | 0.7% | 1.1% | 1.0% | 1.4% |
| 39 | 1.1% | 1.1% | 0.9% | 1.4% |
| 40 | 1.3% | 1.3% | 0.9% | 1.6% |
| 41 | 1.7% | 1.4% | 0.9% | 2.4% |
| 42 | 1.2% | 1.4% | 1.0% | 1.9% |
| 43 | 1.6% | 1.3% | 1.0% | 1.5% |
| 44 | 1.5% | 1.3% | 0.9% | 1.6% |
| 45 | 1.8% | 1.3% | 1.2% | 1.5% |
| 46 | 1.7% | 1.6% | 1.0% | 2.0% |
| 47 | 2.2% | 1.5% | 1.1% | 1.9% |
| 48 | 2.8% | 1.6% | 0.8% | 2.1% |
| 49 | 1.7% | 1.5% | 1.0% | 2.5% |
| 50 | 2.2% | 2.3% | 1.3% | 3.7% |
| 51 | 2.6% | 2.5% | 1.6% | 4.1% |
| 52 | 4.0% | 4.5% | 1.7% | 7.1% |
| 1 | 4.4% | 3.7% | 1.7% | 5.2% |
| 2 | 2.8% | 3.0% | 1.1% | 4.5% |
| 3 | 2.9% | 2.5% | 1.3% | 3.6% |
| 4 | 3.1% | 2.4% | 1.7% | 3.5% |
| 5 | 4.0% | 2.7% | 2.0% | 4.4% |
| 6 | 3.5% | 2.7% | 2.1% | 3.3% |
| 7 | 3.4% | 2.4% | 1.7% | 3.0% |
| 8 | 3.1% | 2.3% | 1.9% | 2.7% |
| 9 | 2.8% | 2.2% | 1.8% | 2.7% |
| 10 | 1.7% | 2.1% | 1.8% | 2.7% |
| 11 | 1.2% | 2.1% | 1.7% | 2.7% |
| 12 | 1.6% | 1.8% | 1.1% | 2.7% |
| 13 | 1.7% | 1.7% | 1.2% | 2.6% |
| 14 | 0.9% | 1.8% | 1.3% | 2.4% |
| 15 | 1.3% | 1.6% | 0.9% | 1.9% |
| 16 | 1.7% | 1.5% | 1.0% | 1.9% |
Participatory Syndromic Surveillance
FluWatchers is a participatory ILI surveillance system that relies on weekly voluntary submissions of syndromic information from Canadians across Canada.
In week 16, 1,314 participants reported to FluWatchers, of which 1% reported symptoms of cough and fever, and 19% of these consulted a healthcare professional. Among participants who reported cough and fever, 88% reported days missed from work or school, resulting in a combined total of 43 missed days of work or school.
| Number of Participants Reporting | Percentage participants reporting Cough and Fever | Percentage of participants with cough and fever who consulted a healthcare professional | Percentage of participants with cough and fever who reported missed days from work or school | Number of missed days from work or school |
|---|---|---|---|---|
| 1314 | 1% | 19% | 88% | 43 |
Influenza Outbreak Surveillance
In week 16, 14 laboratory-confirmed outbreaks of influenza were reported. Among the reported influenza outbreaks, nine were reported in long-term care facilities (LTC), one in a hospital, and four in other settings. In addition, one ILI outbreak was reported in a school. Among the 11 outbreaks with influenza type/subtype reported, eight (73%) were associated with influenza A and three (27%) were associated with influenza B.
To date this season, 1,767 influenza/ILI outbreaks have been reported, of which 1,091 (62%) occurred in LTC facilities. Among the 1,512 outbreaks for which the influenza type/subtype was reported, 834 (55%) were associated with influenza A and 609 (40%) were associated with influenza B, and 69 (5%) were associated with a mix of A and B.
Figure 5 - Number of new outbreaks of laboratory-confirmed influenza by report week, Canada, weeks 2017-35 to 2018-16
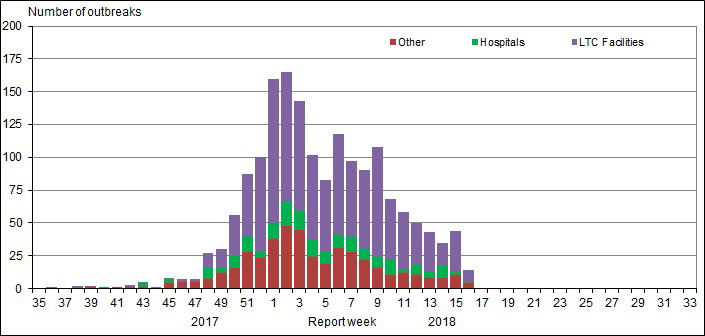
Figure 5 - Text description
| Report week | Hospitals | Long Term Care Facilities | Other |
|---|---|---|---|
| 35 | 0 | 0 | 0 |
| 36 | 0 | 1 | 0 |
| 37 | 0 | 0 | 0 |
| 38 | 0 | 2 | 0 |
| 39 | 0 | 1 | 1 |
| 40 | 1 | 0 | 0 |
| 41 | 0 | 0 | 1 |
| 42 | 0 | 2 | 1 |
| 43 | 3 | 1 | 1 |
| 44 | 0 | 1 | 0 |
| 45 | 3 | 1 | 4 |
| 46 | 0 | 2 | 5 |
| 47 | 0 | 2 | 5 |
| 48 | 9 | 11 | 7 |
| 49 | 4 | 14 | 12 |
| 50 | 9 | 31 | 16 |
| 51 | 11 | 48 | 28 |
| 52 | 5 | 72 | 23 |
| 1 | 12 | 110 | 38 |
| 2 | 18 | 99 | 48 |
| 3 | 14 | 84 | 45 |
| 4 | 13 | 65 | 24 |
| 5 | 9 | 55 | 19 |
| 6 | 10 | 77 | 31 |
| 7 | 11 | 58 | 28 |
| 8 | 8 | 60 | 22 |
| 9 | 8 | 84 | 16 |
| 10 | 12 | 46 | 10 |
| 11 | 2 | 44 | 12 |
| 12 | 8 | 32 | 10 |
| 13 | 5 | 30 | 8 |
| 14 | 9 | 18 | 8 |
| 15 | 3 | 31 | 10 |
| 16 | 1 | 9 | 4 |
Severe Outcomes Influenza Surveillance
Provincial/Territorial Influenza Hospitalizations and Deaths
To date this season, 4,928 influenza-associated hospitalizations were reported by participating provinces and territoriesFootnote 1. Among the hospitalizations, 3,305 (67%) were associated with influenza A, and 3,232 cases (66%) were in adults 65 years of age or older.
Additionally, 496 ICU admissions and 271 deaths have been reported to date. Adults aged 65 years of age or older accounted for the greatest proportion of ICU cases (44%), followed by adults aged 20-64 (40%). Adults aged 65 years of age or older accounted the majority of deaths (85%).
Figure 6 - Cumulative numbers of hospitalizations by age-group reported by participating provinces and territoriesfigure 6 note 1, weeks 2017-35 to 2018-16
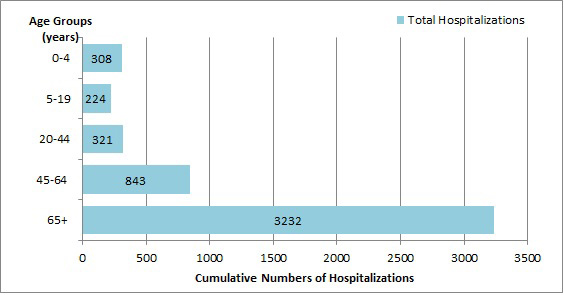
Figure 6 - Text description
| Age group | Total |
|---|---|
| 0-4 | 308 |
| 5-19 | 224 |
| 20-44 | 321 |
| 45-64 | 843 |
| 65+ | 3232 |
- Figure 6 note 1
-
Influenza-associated hospitalizations are reported by NL, PE, NS, NB, MB, AB, YT and NT. Only hospitalizations that require intensive medical care are reported by SK.
Pediatric Influenza Hospitalizations and Deaths
In week 16, seven laboratory-confirmed influenza-associated pediatric (≤16 years of age) hospitalizations were reported by the Immunization Monitoring Program Active (IMPACT) network. Influenza A accounted for 57% of the hospitalizations. Pediatric hospitalizations have been on a general decline since week 07. The number of weekly reported hospitalizations has finally fallen to levels that are below the seven-season average.
To date this season, 1,040 pediatric hospitalizations have been reported by the IMPACT network, 645 (62%) of which were associated with influenza A. Children 0-23 months accounted for the largest proportion of influenza A hospitalizations (40%). Among the 395 hospitalizations due to influenza B, children 5-9 years accounted for the largest proportion of cases (31%).
Additionally, 177 ICU admissions and nine deaths have been reported to date. Children aged 0-23 months accounted for the greatest proportion of ICU cases (29%), followed by children aged 5-9 years (30%). Among the ICU cases with available information, 25% were due to influenza A and approximately 46% had no reported previous or concurrent medical conditions. All but one reported deaths were among children over the age of two.
Figure 7 - Cumulative numbers of pediatric hospitalizations (≤16 years of age) with influenza by type and age-group reported by the IMPACT network, Canada, weeks 2017-35 to 2018-16
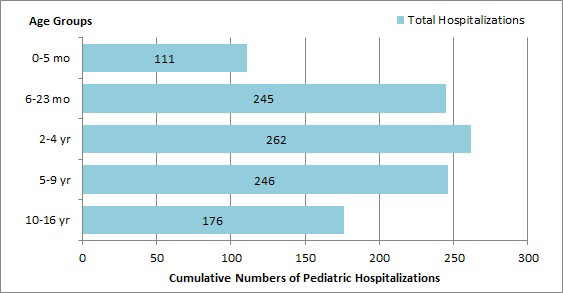
Figure 7 - Text description
| Age Group | Total |
|---|---|
| 0-5 mo | 111 |
| 6-23 mo | 245 |
| 2-4 yr | 262 |
| 5-9 yr | 246 |
| 10-16 yr | 176 |
Figure 8 - Number of pediatric hospitalizations (≤16 years of age) with influenza reported by the IMPACT network, by week, Canada, weeks 2017-35 to 2018-16
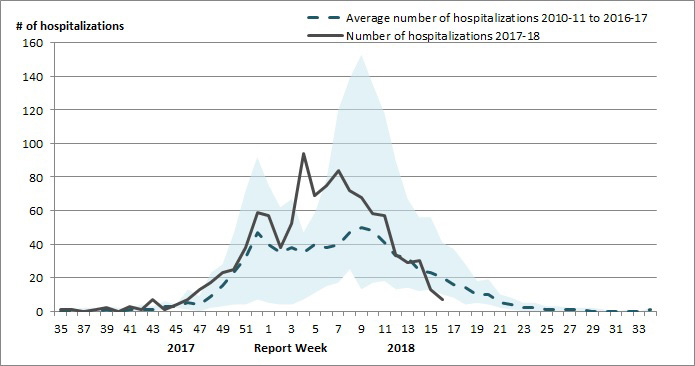
The shaded area represents the maximum and minimum number of cases reported by week from seasons 2010-11 to 2016-17
Figure 8 - Text description
| Report week | 2017-18 | Average | Min | Max |
|---|---|---|---|---|
| 35 | 0 | 0 | 0 | 0 |
| 36 | 1 | 0 | 0 | 1 |
| 37 | 0 | 0 | 0 | 2 |
| 38 | 1 | 0 | 0 | 2 |
| 39 | 2 | 1 | 0 | 3 |
| 40 | 0 | 0 | 0 | 2 |
| 41 | 3 | 1 | 0 | 2 |
| 42 | 1 | 1 | 0 | 4 |
| 43 | 7 | 1 | 0 | 3 |
| 44 | 1 | 3 | 1 | 6 |
| 45 | 4 | 3 | 2 | 4 |
| 46 | 7 | 5 | 1 | 13 |
| 47 | 13 | 4 | 0 | 9 |
| 48 | 17 | 9 | 2 | 23 |
| 49 | 23 | 15 | 3 | 28 |
| 50 | 25 | 23 | 4 | 47 |
| 51 | 38 | 32 | 4 | 72 |
| 52 | 59 | 47 | 7 | 92 |
| 1 | 57 | 40 | 5 | 75 |
| 2 | 38 | 35 | 4 | 62 |
| 3 | 52 | 38 | 4 | 67 |
| 4 | 94 | 35 | 7 | 47 |
| 5 | 69 | 40 | 11 | 59 |
| 6 | 75 | 38 | 15 | 79 |
| 7 | 84 | 40 | 17 | 120 |
| 8 | 72 | 47 | 25 | 139 |
| 9 | 68 | 50 | 13 | 153 |
| 10 | 58 | 48 | 17 | 135 |
| 11 | 57 | 41 | 18 | 118 |
| 12 | 34 | 33 | 13 | 89 |
| 13 | 29 | 32 | 14 | 67 |
| 14 | 30 | 24 | 12 | 56 |
| 15 | 13 | 23 | 13 | 56 |
| 16 | 7 | 20 | 10 | 41 |
Influenza Strain Characterizations
During the 2017-18 influenza season, the National Microbiology Laboratory (NML) has characterized 3,317 influenza viruses [1,420 A(H3N2), 247 A(H1N1)pdm09 and 1,650 B viruses] that were received from Canadian laboratories.
Antigenic Characterization
Among influenza viruses characterized by hemagglutination inhibition (HI) assay during the 2017-18 season, most viruses were antigenically similar to the cell-culture propagated reference strains recommended by WHO.
| Strain Characterization Results | Count | Description |
|---|---|---|
| Influenza A (H3N2) | ||
| A/Hong Kong/4801/2014-like | 287 | Viruses antigenically similar to A/Hong Kong/4801/2014, the A(H3N2) component of the 2017-18 Northern Hemisphere's trivalent and quadrivalent vaccine. |
| Reduced titer to A/Hong Kong/4801/2014 | 82 | These A(H3N2) viruses reacted poorly with antisera raised against cell-propagated A/Hong Kong/4801/2014, suggesting some antigenic differences |
| Influenza A (H1N1)pdm09 | ||
| A/Michigan/45/2015-like | 247 | Viruses antigenically similar to A/Michigan/45/2015, the A(H1N1)pdm09 component of the 2017-18 Northern Hemisphere's trivalent and quadrivalent influenza vaccine. |
| Influenza B | ||
| B/Brisbane/60/2008-like (Victoria lineage) |
20 | Viruses antigenically similar to B/Brisbane/60/2008. B/Brisbane/60/2008 is the influenza B component of the 2017-18 Northern Hemisphere's trivalent and quadrivalent influenza vaccine. |
| Reduced titer to B/Brisbane/60/2008 (Victoria lineage) |
49 | These B/Victoria lineage viruses reacted poorly with antisera raised against cell-propagated B/Brisbane/60/2008, suggesting some antigenic differences |
| B/Phuket/3073/2013-like (Yamagata lineage) |
1581 | Viruses antigenically similar to B/Phuket/3073/2013, the additional influenza B component of the 2017-18 Northern Hemisphere quadrivalent influenza vaccine. |
Genetic Characterization of A(H3N2) viruses
During the 2017-18 season, 1,051 A(H3N2) viruses did not grow to sufficient titers for antigenic characterization by HI assay. Therefore, genetic characterization was performed to determine to which genetic group they belong. Sequence analysis showed that 942 A(H3N2) viruses belonged to genetic group 3C.2a, 107 viruses belonged to subclade 3C.2a1 and two viruses belonged to the clade 3C.3a.
Additionally, of the 369 influenza A(H3N2) viruses that were characterized antigenically as similar to A/Hong Kong/4801/2014, 251 belonged to genetic group 3C.2a and 26 viruses belonged to subclade 3C.2a1. The 82 viruses that showed reduced titer to A/Hong Kong/4801/2014 belonged to genetic clade 3C.3a. Sequencing is pending for the remaining 10 isolates.
A/Hong Kong/4801/2014-like virus belongs to genetic group 3C.2a and is the influenza A/H3N2 component of the 2017-18 Northern Hemisphere influenza vaccine.
Genetic Characterization of Influenza B viruses
Among the viruses characterized antigenically as having reduced titer to ferret antisera produced against cell-propagated B/Brisbane/60/2008, sequence analysis showed that 48 viruses had a two amino acid deletion in the HA gene. Sequencing is pending for the remaining virus isolate.
Antiviral Resistance
During the 2017-18 season, the National Microbiology Laboratory (NML) has tested 1,379 influenza viruses for resistance to oseltamivir and 1,376 viruses for resistance to zanamivir. All but three viruses (1 A(H1N1)pdm09,1 A(H3N2) and 1 influenza B) were sensitive to oseltamivir and all but two influenza B viruses were sensitive to zanamivir (Table 4).
| Virus type and subtype | Oseltamivir | Zanamivir | ||
|---|---|---|---|---|
| # tested | # resistant (%) | # tested | # resistant (%) | |
| A (H3N2) | 522 | 1 (0.2%) | 518 | 0 (0%) |
| A (H1N1) | 199 | 1 (0.5%) | 200 | 0 (0%) |
| B | 658 | 1 (0.2%) | 658 | 2 (0.3%) |
| TOTAL | 1379 | 3 (0.2%) | 1376 | 2 (0.1%) |
Note: Since the 2009 pandemic, all circulating influenza A viruses have been resistant to amantadine, and it is therefore not currently recommended for use in the treatment of influenza. During the 2017-18 season, all but eight influenza A viruses that were tested for resistance to amantadine were resistant. |
||||
Provincial and International Influenza Reports
Provincial Influenza Reports
- Alberta - Influenza Surveillance Report
- British Columbia - Influenza Surveillance
- Manitoba - Seasonal Influenza Reports
- New Brunswick - Influenza Surveillance Reports
- Newfoundland and Labrador - Surveillance and Disease Reports
- Nova Scotia - Respiratory Watch Report
- Ontario - Respiratory Pathogen Bulletin
- Prince Edward Island - Influenza Summary
- Saskatchewan - Influenza Reports
- Québec - Flash Grippe
International Influenza Reports
- Australia - Influenza Surveillance Report
- European Centre for Disease Prevention and Control - Surveillance reports and disease data on seasonal influenza
- New Zealand - Influenza Weekly Update
- Public Health England - Weekly national flu reports
- Pan-American Health Organization - Influenza Situation Report
- United States Centres for Disease Control and Prevention - Weekly Influenza Surveillance Report
- World Health Organization - Influenza update
- World Health Organization - FluNet
FluWatch Surveillance System Description and Definitions, 2017-18
The FluWatch report is compiled from a number of data sources. Surveillance information contained in this report is a reflection of the surveillance data available to FluWatch at the time of production. Delays in reporting of data may cause data to change retrospectively.
Influenza/Influenza-like Illness (ILI) Activity
Influenza/ILI activity levels, as represented on the map, are assigned and reported by Provincial and Territorial Ministries of Health, based on laboratory confirmations, primary care consultations for ILI and reported outbreaks. ILI data may be reported through sentinel physicians, emergency room visits or health line telephone calls, and the determination of an increase is based on the assessment of the provincial/territorial epidemiologist. Maps from previous weeks, including any retrospective updates, are available in the mapping feature found in the Weekly Influenza Reports.
Influenza/ILI Activity Level definitions
- 1 = No activity:
- no laboratory-confirmed influenza detections in the reporting week, however, sporadically occurring ILI may be reported
- 2 = Sporadic:
- sporadically occurring ILI and lab confirmed influenza detection(s) with no outbreaks detected within the influenza
surveillance region† - 3 = Localized:
- (1) evidence of increased ILI*; (2) lab confirmed influenza detection(s); (3) outbreaks in schools, hospitals, residential
institutions and/or other types of facilities occurring in less than 50% of the influenza surveillance region† - 4 = Widespread:
- (1) evidence of increased ILI*; (2) lab confirmed influenza detection(s);(3) outbreaks in schools, hospitals, residential institutions and/or other types of facilities occurring in greater than or equal to 50% of the influenza surveillance region†;
* More than just sporadic as determined by the provincial/territorial epidemiologist. †Influenza surveillance regions within the province or territory as defined by the provincial/territorial epidemiologist
Laboratory-Confirmed Influenza Detections
Provincial, regional and some hospital laboratories report the weekly number of tests and detections of influenza and other respiratory viruses. Provincial public health laboratories submit demographic information for cases of influenza. This case-level data represents a subset of influenza detections reported through aggregate reporting. Specimens from NT, YT, and NU are sent to reference laboratories in the provinces for testing. Cumulative data includes updates to previous weeks. Discrepancies in values in Figures 2 and 3 may be attributable to differing data sources.
Syndromic/Influenza-like Illness Surveillance
FluWatch maintains a network of primary care practitioners who report the weekly proportion of ILI cases seen in their practice. Independent sentinel networks in BC, AB, and SK compile their data for reporting to FluWatch. Not all sentinel physicians report every week.
- Definition of Influenza-like-illness (ILI):
- Acute onset of respiratory illness with fever and cough and with one or more of the following - sore throat, arthralgia, myalgia, or prostration which is likely due to influenza. In children under 5 years of age, gastrointestinal symptoms may also be present. In patients under 5 or 65 years and older, fever may not be prominent.
Influenza Outbreak Surveillance
Outbreaks of influenza or ILI are reported from all provinces and territories, according to the definitions below. However, reporting of outbreaks of influenza/ILI from different types of facilities differs between jurisdictions. All provinces and territories with the exception of NU report influenza outbreaks in long-term care facilities. All provinces and territories with the exception of NU and QC report outbreaks in hospitals.
Outbreak definitions:
- Schools:
- Greater than 10% absenteeism (or absenteeism that is higher (e.g. >5-10%) than expected level as determined by school or public health authority) which is likely due to ILI.
- Hospitals and residential institutions:
- two or more cases of ILI within a seven-day period, including at least one laboratory-confirmed case of influenza. Residential institutions include but are not limited to long-term care facilities (LTCF) and prisons.
- Workplace:
- Greater than 10% absenteeism on any day which is most likely due to ILI.
- Other settings:
- two or more cases of ILI within a seven-day period, including at least one laboratory-confirmed case of influenza; i.e. closed communities.
Serious Outcome Influenza Surveillance
Provincial/Territorial Influenza Hospitalizations and Deaths
Influenza-associated hospitalizations and deaths are reported by 8 Provincial and Territorial Ministries of Health (excluding BC, NU, ON and QC). The hospitalization or death does not have to be attributable to influenza, a positive laboratory test is sufficient for reporting. Only hospitalizations that require intensive medical care are reported by SK.
Due to changes in participating provinces and territories, comparisons to previous years should be done with caution.
Pediatric Influenza Hospitalizations and Deaths
The Immunization Monitoring Program Active (IMPACT) network reports the weekly number of hospitalizations with influenza among children admitted to one of the 12 participating paediatric hospitals in 8 provinces. These represent a subset of all influenza-associated pediatric hospitalizations in Canada.
Influenza Strain Characterizations and Antiviral Resistance
Provincial public health laboratories send a subset of influenza virus isolates to the National Microbiology Laboratory for strain characterization and antiviral resistance. These represent a subset of all influenza detections in Canada and the proportion of isolates of each type and subtype is not necessarily representative of circulating viruses.
Antigenic strain characterization data reflect the results of hemagglutination inhibition (HI) testing compared to the reference influenza strains recommended by WHO. Genetic strain characterization data are based on analysis of the sequence of the viral hemagglutinin (HA) gene.
Antiviral resistance testing is conducted by phenotypic and genotypic methods on influenza virus isolates submitted to the National Microbiology Laboratory. All isolates are tested for oseltamivir and zanamivir and a subset are tested for resistance to amantadine.
Abbreviations: Newfoundland/Labrador (NL), Prince Edward Island (PE), New Brunswick (NB), Nova Scotia (NS), Quebec (QC), Ontario (ON), Manitoba (MB), Saskatchewan (SK), Alberta (AB), British Columbia (BC), Yukon (YT), Northwest Territories (NT), Nunavut (NU).
This report is available on the Government of Canada Influenza webpage.
We would like to thank all the FluWatch surveillance partners who are participating in this year's influenza surveillance program.