
FluWatch report: February 17 to 23, 2019 (Week 08)
Download the alternative format
(PDF format, 1.20 MB, 9 pages)
Organization: Public Health Agency of Canada
Date published: 2019-03-01
Related Topics
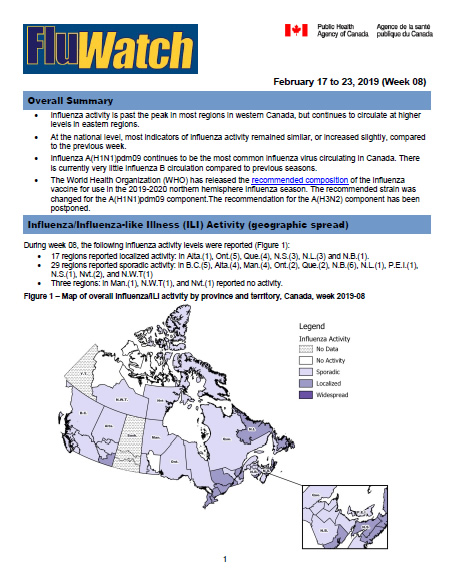
Overall Summary
- Influenza activity is past the peak in most regions in western Canada, but continues to circulate at higher levels in eastern regions.
- At the national level, most indicators of influenza activity remained similar, or increased slightly, compared to the previous week.
- Influenza A(H1N1)pdm09 continues to be the most common influenza virus circulating in Canada. There is currently very little influenza B circulation compared to previous seasons.
- The World Health Organization (WHO) has released the recommended composition of the influenza vaccine for use in the 2019-2020 northern hemisphere influenza season. The recommended strain was changed for the A(H1N1)pdm09 component.The recommendation for the A(H3N2) component has been postponed.
On this page
- Influenza/ILI Activity (geographic spread)
- Laboratory Confirmed Influenza Detections
- Syndromic/Influenza-like Illness Surveillance
- Participatory Syndromic Surveillance
- Influenza Outbreak Surveillance
- Severe Outcomes Influenza Surveillance
- Influenza Strain Characterizations
- Antiviral Resistance
- Provincial and International Influenza Reports
Influenza/Influenza-like Illness Activity (geographic spread)
During week 08, the following influenza activity levels were reported (Figure 1):
- 17 regions reported localized activity: in Alta.(1), Ont.(5), Que.(4), N.S.(3), N.L.(3) and N.B.(1).
- 29 regions reported sporadic activity: in B.C.(5), Alta.(4), Man.(4), Ont.(2), Que.(2), N.B.(6), N.L.(1), P.E.I.(1), N.S.(1), Nvt.(2), and N.W.T(1)
- Three regions: in Man.(1), N.W.T(1), and Nvt.(1) reported no activity.
Figure 1 – Map of overall influenza/ILI activity by province and territory, Canada, week 2019-08
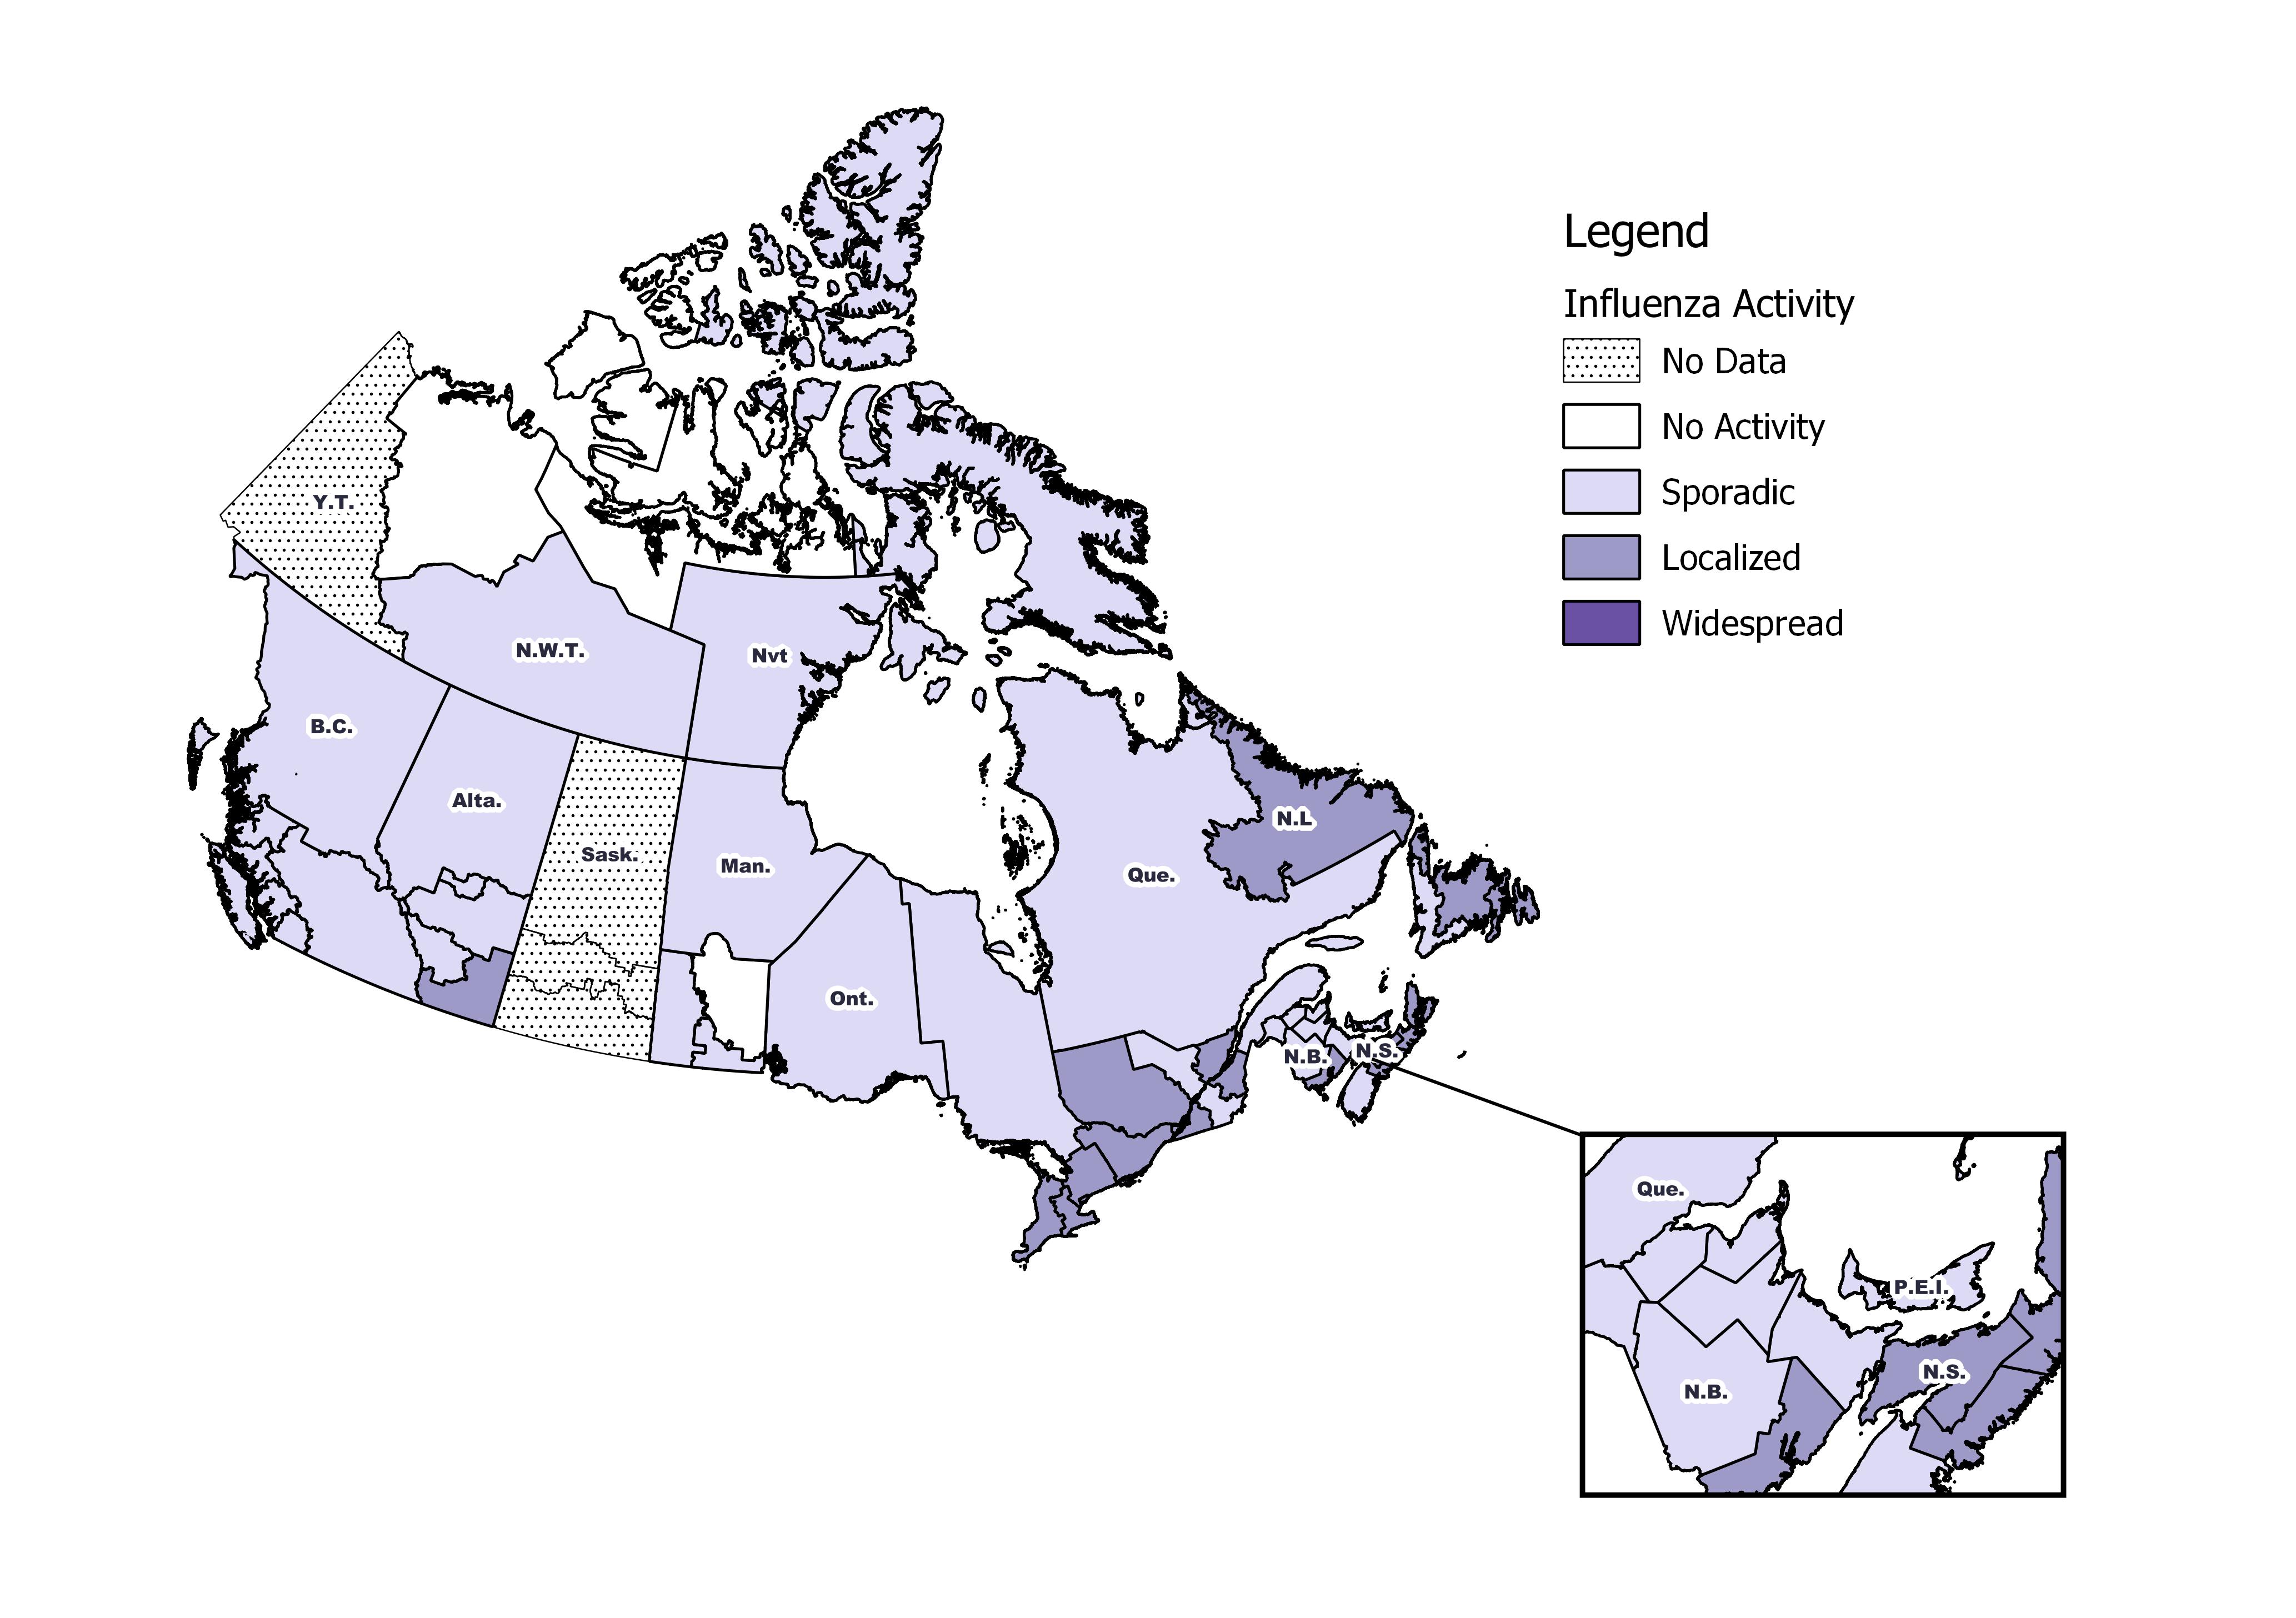
Figure 1 - Text equivalent
| Province | Influenza Surveillance Region | Activity Level |
|---|---|---|
| N.L. | Eastern | Localized |
| N.L. | Labrador-Grenfell | Localized |
| N.L. | Central | Localized |
| N.L. | Western | Sporadic |
| P.E.I. | Prince Edward Island | Sporadic |
| N.S. | Zone 1 - Western | Sporadic |
| N.S. | Zone 2 - Northern | Localized |
| N.S. | Zone 3 - Eastern | Localized |
| N.S. | Zone 4 - Central | Localized |
| N.B. | Region 1 | Sporadic |
| N.B. | Region 2 | Localized |
| N.B. | Region 3 | Sporadic |
| N.B. | Region 4 | Sporadic |
| N.B. | Region 5 | Sporadic |
| N.B. | Region 6 | Sporadic |
| N.B. | Region 7 | Sporadic |
| Que. | Nord-est | Sporadic |
| Que. | Québec et Chaudieres-Appalaches | Localized |
| Que. | Centre-du-Québec | Sporadic |
| Que. | Montréal et Laval | Localized |
| Que. | Ouest-du-Québec | Localized |
| Que. | Montérégie | Localized |
| Ont. | Central East | Localized |
| Ont. | Central West | Localized |
| Ont. | Eastern | Localized |
| Ont. | North East | Sporadic |
| Ont. | North West | Sporadic |
| Ont. | South West | Localized |
| Ont. | Toronto | Localized |
| Man. | Northern Regional | Sporadic |
| Man. | Prairie Mountain | Sporadic |
| Man. | Interlake-Eastern | No Activity |
| Man. | Winnipeg | Sporadic |
| Man. | Southern Health | Sporadic |
| Sask. | North | No Data |
| Sask. | Central | No Data |
| Sask. | South | No Data |
| Alta. | North Zone | Sporadic |
| Alta. | Edmonton | Sporadic |
| Alta. | Central Zone | Sporadic |
| Alta. | Calgary | Sporadic |
| Alta. | South Zone | Localized |
| B.C. | Interior | Sporadic |
| B.C. | Fraser | Sporadic |
| B.C. | Vancouver Coastal | Sporadic |
| B.C. | Vancouver Island | Sporadic |
| B.C. | Northern | Sporadic |
| Y.T. | Yukon | No Data |
| N.W.T. | North | No Activity |
| N.W.T. | South | Sporadic |
| Nvt. | Qikiqtaaluk | Sporadic |
| Nvt. | Kivalliq | Sporadic |
| Nvt. | Kitimeot | No Activity |
Laboratory-Confirmed Influenza Detections
In week 08, the following results were reported from sentinel laboratories across Canada (Figures 2 and 3):
- The percentage of tests positive for influenza was 17.9%.
- A total 1,535 laboratory detections of influenza were reported, of which 98% were influenza A.
- Influenza A(H1N1)pdm09 and A(H3N2) accounted for equal proportions of subtyped influenza A detections.
- Detections of influenza A(H3N2) have been steadily increasing, from 93 detections in week 4 (mid-January) to 199 this week.
To date this season, 32,429 laboratory-confirmed influenza detections have been reported:
- 99% have been influenza A.
- Among the 11,210 influenza A viruses subtyped, 89% have been A(H1N1)pdm09.
- Influenza B often circulates later in the season in Canada (Feb-Apr). Fewer influenza B detections have been reported this season compared to recent seasons at this time of year.
To date this season, detailed information on age and type/subtype has been received for 25,393 laboratory-confirmed influenza cases (Table 1):
- 85% of all influenza A(H1N1)pdm09 detections have been reported in individuals younger than 65 years of age.
- 61% of all influenza A(H3N2) detections have been reported in adults 65 years of age and older.
For more detailed weekly and cumulative influenza data, see the text descriptions for Figures 2 and 3 or the Respiratory Virus Detections in Canada Report.
Figure 2 – Number of positive influenza tests and percentage of tests positive, by type, subtype and report week, Canada, weeks 2018-35 to 2019-08
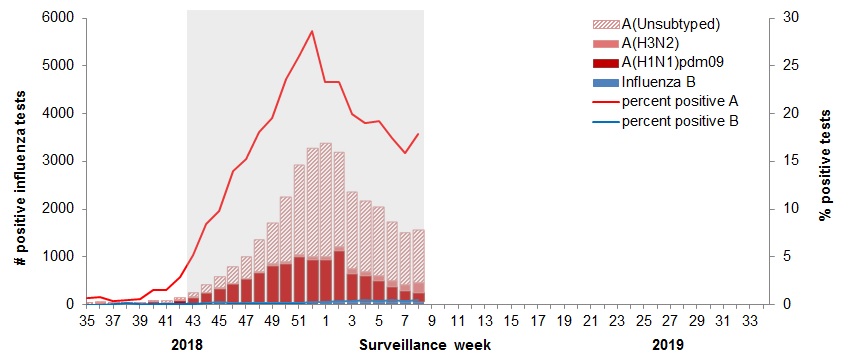
The shaded area indicates weeks where the positivity rate was at least 5% and a minimum of 15 positive tests were observed, signalling the period of seasonal influenza activity.
Figure 2 - Text equivalent
| Surveillance Week | A(Unsubtyped) | A(H3) | A(H1)pdm09 | Influenza B |
|---|---|---|---|---|
| 35 | 3 | 2 | 7 | 0 |
| 36 | 4 | 7 | 4 | 0 |
| 37 | 3 | 2 | 3 | 1 |
| 38 | 6 | 3 | 2 | 3 |
| 39 | 11 | 5 | 1 | 3 |
| 40 | 16 | 7 | 29 | 3 |
| 41 | 27 | 6 | 21 | 3 |
| 42 | 40 | 19 | 55 | 2 |
| 43 | 83 | 23 | 128 | 4 |
| 44 | 169 | 13 | 214 | 6 |
| 45 | 244 | 18 | 295 | 15 |
| 46 | 346 | 10 | 404 | 9 |
| 47 | 449 | 17 | 507 | 8 |
| 48 | 679 | 29 | 632 | 10 |
| 49 | 851 | 35 | 785 | 16 |
| 50 | 1368 | 35 | 828 | 14 |
| 51 | 1890 | 54 | 953 | 21 |
| 52 | 2292 | 55 | 903 | 26 |
| 1 | 2387 | 58 | 893 | 31 |
| 2 | 1985 | 93 | 1061 | 43 |
| 3 | 1613 | 101 | 585 | 40 |
| 4 | 1483 | 93 | 532 | 48 |
| 5 | 1449 | 112 | 433 | 43 |
| 6 | 1234 | 118 | 315 | 42 |
| 7 | 1091 | 123 | 234 | 31 |
| 8 | 1105 | 199 | 200 | 39 |
Figure 3 – Cumulative numbers of positive influenza specimens by type/subtype and province/territory, Canada, weeks 2018-35 to 2019-08
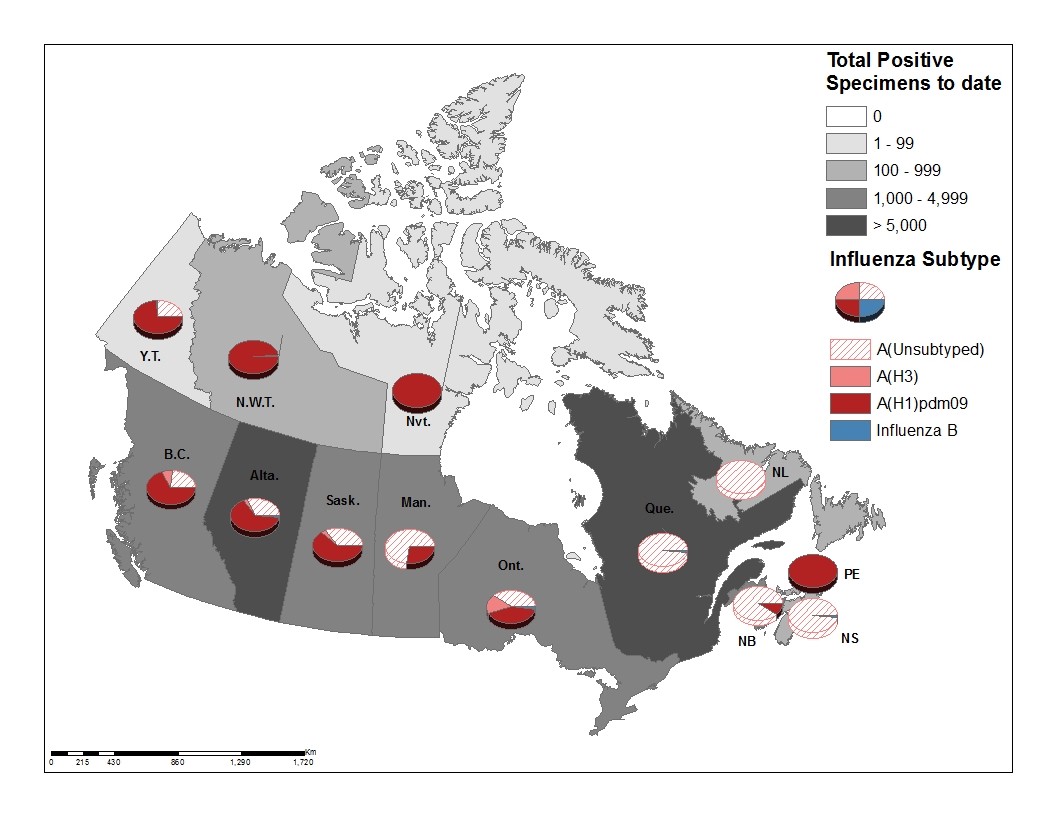
Figure 3 - Text equivalent
| Reporting provincesTable Figure 3 - Footnote 1 |
Week (February 17, 2019 to February 23, 2019) | Cumulative (August 26, 2018 to February 23, 2019) | |||||||||
|---|---|---|---|---|---|---|---|---|---|---|---|
| Influenza A | B | Influenza A | B | A & B Total |
|||||||
| A Total |
A (H1N1)pdm09 |
A (H3N2) |
A(UnS)Table Figure 3 - Footnote 3 | B Total |
A Total |
A (H1N1)pdm09 |
A (H3N2) |
A(UnS)Table Figure 3 - Footnote 3 | B Total |
||
| BC | 300 | 83 | 101 | 116 | 5 | 3678 | 2473 | 329 | 876 | 33 | 3711 |
| AB | 72 | 28 | 27 | 17 | 10 | 5382 | 3485 | 178 | 1719 | 74 | 5456 |
| SK | 0 | 0 | 0 | 0 | 0 | 2173 | 1349 | 60 | 764 | 10 | 2183 |
| MB | 12 | 0 | 2 | 10 | 0 | 994 | 270 | 8 | 716 | 6 | 1000 |
| ON | 268 | 67 | 66 | 135 | 4 | 4119 | 1800 | 637 | 1682 | 81 | 4200 |
| QC | 594 | 0 | 0 | 594 | 15 | 12544 | 0 | 0 | 12544 | 240 | 12784 |
| NB | 136 | 14 | 2 | 120 | 0 | 1967 | 197 | 15 | 1755 | 2 | 1969 |
| NS | 76 | 0 | 0 | 76 | 2 | 336 | 0 | 0 | 336 | 6 | 342 |
| PEI | 2 | 2 | 0 | 0 | 0 | 185 | 185 | 0 | 0 | 0 | 185 |
| NL | 32 | 0 | 0 | 32 | 0 | 357 | 1 | 0 | 356 | 2 | 359 |
| YT | 5 | 3 | 0 | 2 | 0 | 68 | 50 | 1 | 17 | 0 | 68 |
| N.W.T | 1 | 1 | 0 | 0 | 0 | 153 | 151 | 2 | 0 | 0 | 153 |
| NU | 1 | 1 | 0 | 0 | 0 | 19 | 19 | 0 | 0 | 0 | 19 |
| Canada | 1499 | 199 | 198 | 1102 | 36 | 31975 | 9980 | 1230 | 20765 | 454 | 32429 |
| PercentageTable Figure 3 - Footnote 2 | 98% | 13% | 13% | 74% | 2% | 99% | 31% | 4% | 65% | 1% | 100% |
Discrepancies in values in Figures 2 and 3 may be attributable to differing data sources. Cumulative data includes updates to previous weeks. |
|||||||||||
| Age groups (years) | Cumulative (August 26, 2018 to February 23, 2019) | ||||||
|---|---|---|---|---|---|---|---|
| Influenza A | B | Influenza A and B | |||||
| A Total | A(H1) pdm09 | A(H3) | A (UnS)Footnote 1 | Total | # | % | |
| 0-4 | 5452 | 1570 | 42 | 3840 | 62 | 5514 | 22% |
| 5-19 | 3724 | 1300 | 58 | 2366 | 70 | 3794 | 15% |
| 20-44 | 5064 | 1699 | 139 | 3226 | 55 | 5119 | 20% |
| 45-64 | 5018 | 1597 | 139 | 3282 | 49 | 5067 | 20% |
| 65+ | 5755 | 1110 | 596 | 4049 | 144 | 5899 | 23% |
| Total | 25013 | 7276 | 974 | 16763 | 380 | 25393 | 100% |
|
|||||||
Syndromic/Influenza-like Illness Surveillance
Healthcare Professionals Sentinel Syndromic Surveillance
In week 08, 1.2% of visits to healthcare professionals were due to influenza-like illness (ILI) (Figure 4). The percentage of visits for ILI is low compared to previous seasons.
Figure 4 – Percentage of visits for ILI reported by sentinels by report week, Canada, weeks 2018-35 to 2019-08
Number of Sentinels Reporting in Week 08: 117
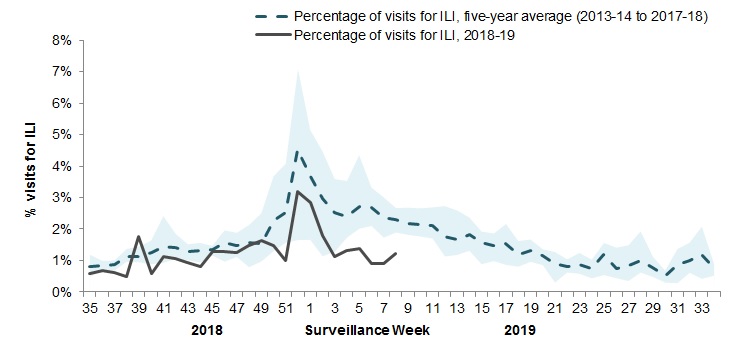
The shaded area represents the maximum and minimum percentage of visits for ILI reported by week from seasons 2013-14 to 2017-18
Figure 4 - Text equivalent
| Surveillance Week | 2018-19 | Average | Min | Max |
|---|---|---|---|---|
| 35 | 0.6% | 0.6% | 0.4% | 0.9% |
| 36 | 0.7% | 0.8% | 0.5% | 1.0% |
| 37 | 0.6% | 0.9% | 0.7% | 1.1% |
| 38 | 0.5% | 1.0% | 0.7% | 1.4% |
| 39 | 1.8% | 1.1% | 0.8% | 1.5% |
| 40 | 0.6% | 1.6% | 0.9% | 3.4% |
| 41 | 1.1% | 1.6% | 1.1% | 2.1% |
| 42 | 1.0% | 1.4% | 0.8% | 1.8% |
| 43 | 0.9% | 1.4% | 0.7% | 1.8% |
| 44 | 0.8% | 1.4% | 1.1% | 1.6% |
| 45 | 1.3% | 1.5% | 1.2% | 1.8% |
| 46 | 1.3% | 1.7% | 1.1% | 2.2% |
| 47 | 1.3% | 1.6% | 1.1% | 2.2% |
| 48 | 1.5% | 1.8% | 1.0% | 2.8% |
| 49 | 1.6% | 1.5% | 1.1% | 1.8% |
| 50 | 1.5% | 2.1% | 1.4% | 2.7% |
| 51 | 1.0% | 2.3% | 1.6% | 3.2% |
| 52 | 3.2% | 3.6% | 1.9% | 5.0% |
| 1 | 2.8% | 3.8% | 1.8% | 5.6% |
| 2 | 1.8% | 2.6% | 1.3% | 3.9% |
| 3 | 1.1% | 2.5% | 1.4% | 3.6% |
| 4 | 1.3% | 2.5% | 1.6% | 3.1% |
| 5 | 1.4% | 2.6% | 1.9% | 4.0% |
| 6 | 0.9% | 2.7% | 2.1% | 3.5% |
| 7 | 0.9% | 2.7% | 1.9% | 3.4% |
| 8 | 1.2% | 2.6% | 2.1% | 3.1% |
Participatory Syndromic Surveillance
In week 08, 2,131 participants reported to FluWatchers, of which 53 (2.5%) reported symptoms of cough and fever (Figure 5).
Among the 53 participants who reported fever and cough:
- 9% consulted a healthcare professional;
- 74% reported days missed from work or school, resulting in a combined total of 102 missed days of work or school.
Figure 5 - Percentage of participants reporting cough and fever, Canada, weeks 2018-40 to 2019-08
Number of Participants Reporting in Week 08: 2,131
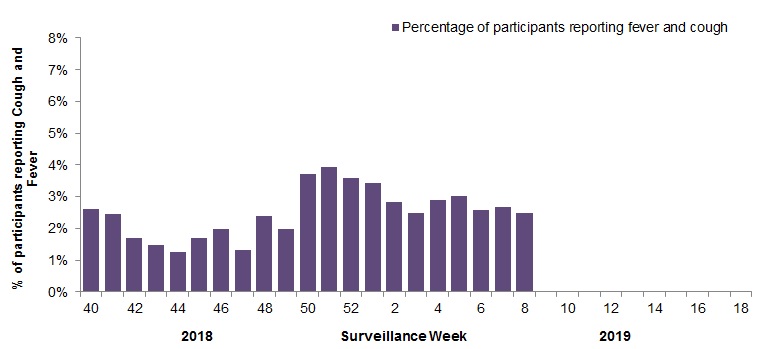
Figure 5 - Text equivalent
| Surveillance week | % cough and fever |
|---|---|
| 40 | 2.6% |
| 41 | 2.5% |
| 42 | 1.7% |
| 43 | 1.5% |
| 44 | 1.3% |
| 45 | 1.7% |
| 46 | 2.0% |
| 47 | 1.3% |
| 48 | 2.4% |
| 49 | 2.0% |
| 50 | 3.7% |
| 51 | 3.9% |
| 52 | 3.6% |
| 1 | 3.4% |
| 2 | 2.8% |
| 3 | 2.5% |
| 4 | 2.9% |
| 5 | 3.0% |
| 6 | 2.6% |
| 7 | 2.7% |
| 8 | 2.5% |
Influenza Outbreak Surveillance
In week 08, 37 new laboratory-confirmed influenza outbreaks were reported: long-term care facilities (LTCF) (20), acute care facilities (4), schools and daycares (4) and other settings (9). Two new ILI outbreaks in long-term care facilities were also reported in week 08.
To date this season, 446 laboratory-confirmed influenza outbreaks have been reported (Figure 6):
- 269 (60%) outbreaks were in LTCF, 27 were in schools, 61 in acute care facilities, and 89 were in other settings.
- Among the 408 outbreaks for which the influenza type was available, 99% (402) were associated with influenza A.
- Among the 177 outbreaks for which the influenza A subtype was available, 63% (112) were associated with influenza A(H1N1)pdm09;
To date this season, 107 ILI outbreaks have been reported; 56 occurred in LTCF, 47 in schools, and four in acute care facilities.
Figure 6 – Number of new outbreaks of laboratory-confirmed influenza by report week, Canada, weeks 2018-35 to 2019-08
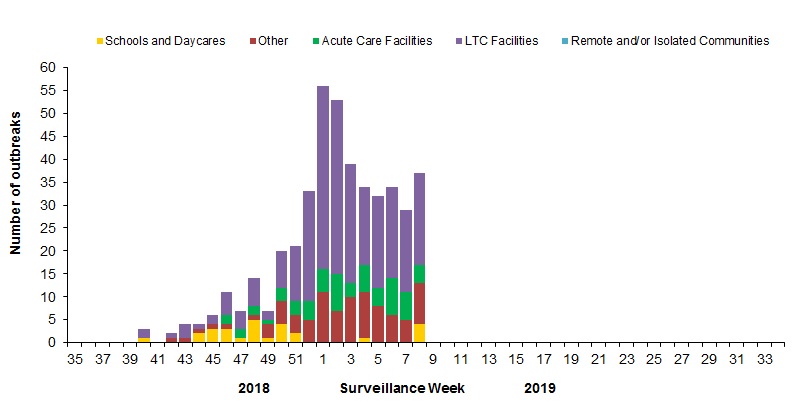
Figure 6 - Text equivalent
| Surveillance Week | Acute Care Facilities | Long Term Care Facilities | Other | Schools and Daycares | Remote and/or Isolated Communities |
|---|---|---|---|---|---|
| 35 | 0 | 0 | 0 | 0 | 0 |
| 36 | 0 | 0 | 0 | 0 | 0 |
| 37 | 0 | 0 | 0 | 0 | 0 |
| 38 | 0 | 0 | 0 | 0 | 0 |
| 39 | 0 | 0 | 0 | 0 | 0 |
| 40 | 0 | 2 | 0 | 1 | 0 |
| 41 | 0 | 0 | 0 | 0 | 0 |
| 42 | 0 | 1 | 1 | 0 | 0 |
| 43 | 0 | 3 | 1 | 0 | 0 |
| 44 | 0 | 1 | 1 | 2 | 0 |
| 45 | 0 | 2 | 1 | 3 | 0 |
| 46 | 2 | 5 | 1 | 3 | 0 |
| 47 | 2 | 4 | 0 | 1 | 0 |
| 48 | 2 | 6 | 1 | 5 | 0 |
| 49 | 1 | 2 | 3 | 1 | 0 |
| 50 | 3 | 8 | 5 | 4 | 0 |
| 51 | 3 | 12 | 4 | 2 | 0 |
| 52 | 4 | 24 | 5 | 0 | 0 |
| 1 | 5 | 40 | 11 | 0 | 0 |
| 2 | 8 | 38 | 7 | 0 | 0 |
| 3 | 3 | 26 | 10 | 0 | 0 |
| 4 | 6 | 17 | 10 | 1 | 0 |
| 5 | 4 | 20 | 8 | 0 | 0 |
| 6 | 8 | 20 | 6 | 0 | 0 |
| 7 | 6 | 18 | 5 | 0 | 0 |
| 8 | 4 | 20 | 9 | 4 | 0 |
Severe Outcomes Influenza Surveillance
Provincial/Territorial Influenza Hospitalizations and Deaths
To date this season, 2,093 influenza-associated hospitalizations have been reported by participating provinces and territoriesFootnote 1.
Hospitalizations (Table 2):
- 99.6% (2,085) were associated with influenza A
- The highest estimated rate of hospitalization is among children under 5 years of age.
Intensive Care Unit (ICU) cases and deaths:
- To date this season 384 ICU admissions and 93 deaths have been reported.
- 42% (163) of reported ICU admissions were in adults aged 45-64 years.
- All the ICU admissions, and all but one of the deaths were associated with influenza A.
| Age Groups (years) | Cumulative (August 26, 2018 to February 23, 2019) | ||
|---|---|---|---|
| Influenza A | Influenza B | Rate per 100,000 population | |
| 0-4 | 316 | 2 | 66.81 |
| 5-19 | 179 | 2 | 13.04 |
| 20-44 | 287 | 0 | 10.09 |
| 45-64 | 581 | 1 | 26.74 |
| 65+ | 722 | 3 | 59.59 |
| Total | 2085 | 8 | |
| % | 99.6% | 0.4% | |
|
|||
Pediatric Influenza Hospitalizations and Deaths
In week 08, 43 pediatric (≤16 years of age) hospitalizations with influenza have been reported by the Immunization Monitoring Program Active (IMPACT) network (Figure 7).
To date this season, 928 pediatric hospitalizations have been reported (Figure 8):
- 69% of cases were in children under 5 years of age.
- 98% (914) of cases have been associated with influenza A.
- Among the 295 cases for which the influenza subtype was available, 280 (95%) were associated with A(H1N1)pdm09.
To date this season, 159 ICU admissions, and 10 deaths have been reported.
- 63% (101) of ICU admissions were in children under 5 years of age.
- All but two of the ICU admissions have been associated with influenza A.
- 80% (8) of deaths occurred in children 2 to 4 years of age.
- All deaths have been associated with influenza A.
Figure 7 – Number of pediatric (≤16 years of age) hospitalizations reported by the IMPACT network, by week, Canada, weeks 2018-35 to 2019-08
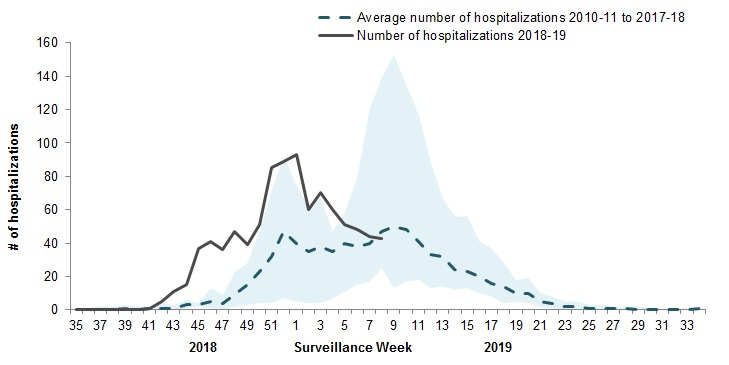
The shaded area represents the maximum and minimum number of cases reported by week from seasons 2010-11 to 2017-18
Figure 7 - Text equivalent
| Surveillance week | 2018-19 | Average | Min | Max |
|---|---|---|---|---|
| 35 | 0 | 0 | 0 | 0 |
| 36 | 0 | 0 | 0 | 1 |
| 37 | 0 | 0 | 0 | 2 |
| 38 | 0 | 0 | 0 | 2 |
| 39 | 0 | 1 | 0 | 3 |
| 40 | 0 | 0 | 0 | 2 |
| 41 | 1 | 1 | 0 | 2 |
| 42 | 5 | 1 | 0 | 4 |
| 43 | 11 | 1 | 0 | 3 |
| 44 | 15 | 3 | 1 | 6 |
| 45 | 37 | 3 | 2 | 4 |
| 46 | 41 | 5 | 1 | 13 |
| 47 | 36 | 4 | 0 | 9 |
| 48 | 47 | 9 | 2 | 23 |
| 49 | 39 | 15 | 3 | 28 |
| 50 | 51 | 23 | 4 | 47 |
| 51 | 85 | 32 | 4 | 72 |
| 52 | 89 | 47 | 7 | 92 |
| 1 | 93 | 40 | 5 | 75 |
| 2 | 60 | 35 | 4 | 62 |
| 3 | 70 | 38 | 4 | 67 |
| 4 | 60 | 35 | 7 | 47 |
| 5 | 51 | 40 | 11 | 59 |
| 6 | 48 | 38 | 15 | 79 |
| 7 | 44 | 40 | 17 | 120 |
| 8 | 43 | 47 | 25 | 139 |
Figure 8 - Cumulative numbers of pediatric hospitalizations (≤16 years of age) with influenza by age-group reported by the IMPACT network, Canada, weeks 2018-35 to 2019-08
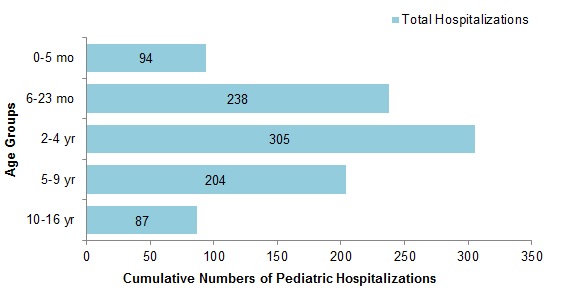
Figure 8 - Text equivalent
| Age Group | Total |
|---|---|
| 0-5 mo | 94 |
| 6-23 mo | 238 |
| 2-4 yr | 305 |
| 5-9 yr | 204 |
| 10-16 yr | 87 |
Adult Influenza Hospitalizations and Deaths
Surveillance of laboratory-confirmed influenza-associated adult (≥16 years of age) hospitalizations by the Canadian Immunization Research Network (CIRN) Serious Outcomes Surveillance (SOS) network began on November 1st for the 2018-19 season.
To date this season, 590 hospitalizations, 65 ICU admissions and 22 deaths have been reported (Figure 9):
- 543 (92%) hospitalizations were associated with influenza A.
- A greater proportion of hospitalizations have been reported among adults ≥65 years of age (58%) compared to adults <65 years of age (42%).
- 84% of hospitalized cases reported more than one type of comorbid condition.
- The most commonly reported comorbidity was endocrine disorders, which were reported in 80% of hospitalized cases.
Figure 9 - Cumulative numbers of adult hospitalizations (>20 years of age) with influenza by age-group reported by CIRN, Canada, 2018-19, weeks 2018-44 to 2019-08
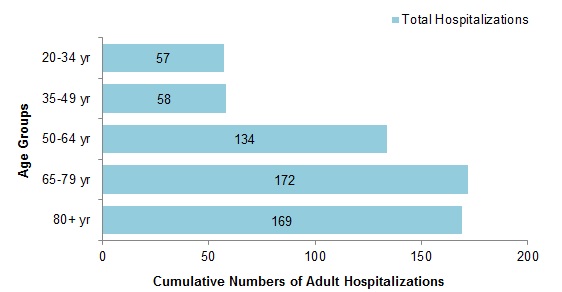
Figure 9 - Text equivalent
| Age Group | Total |
|---|---|
| 20-34 yr | 57 |
| 35-49 yr | 58 |
| 50-64 yr | 134 |
| 65-79 yr | 172 |
| 80+ yr | 169 |
Influenza Strain Characterizations
Since September 1, 2018, the National Microbiology Laboratory (NML) has characterized 1,412 influenza viruses (150 A(H3N2), 1,234 A(H1N1) and 28 B) that were received from Canadian laboratories.
Genetic Characterization of Influenza A(H3N2):
79 influenza A(H3N2) viruses did not grow to sufficient hemagglutination titer for antigenic characterization by hemagglutination inhibition (HI) assay. Therefore, NML has performed genetic characterization to determine the genetic group identity of these viruses.
Sequence analysis of the HA gene of the viruses showed that:
- 15 viruses belonged to genetic group 3C.2a.
- 63 viruses belonged to subclade 3C.2a1.
- One isolate could not be sequenced.
A/Singapore/INFIMH-16-0019/2016-like virus belongs to genetic group 3C.2a1 and is the influenza A(H3N2) component of the 2018-19 Northern Hemisphere influenza vaccine.
Antigenic Characterization:
Influenza A (H3N2):
- 55 influenza A(H3N2) viruses were antigenically characterized as A/Singapore/INFIMH-16-0019/2016-like by HI testing using antiserum raised against egg-propagated A/Singapore/INFIMH-16-0019/2016.
- 16 viruses showed reduced titer with ferret antisera raised against egg-propagated A/Singapore/INFIMH-16-0019/2016.
- A/Singapore/INFIMH-16-0019/2016-like virus is the influenza A(H3N2) component of the 2018-19 Northern Hemisphere influenza vaccine.
- 33 influenza A(H3N2) viruses characterized belonged to genetic group 3C.2a1. 15 viruses belonged to genetic group 3C.2a and 11 to 3C.3a. Sequencing is pending for the remaining isolates.
Influenza A(H1N1):
- 1,201 A(H1N1) viruses characterized were antigenically similar to A/Michigan/45/2015, which is the influenza A(H1N1) component of the 2018-19 Northern Hemisphere influenza vaccine.
- 33 viruses showed reduced titer with ferret antisera raised against cell culture-propagated A/Michigan/45/2015
Influenza B:
Influenza B viruses can be divided into two antigenically distinct lineages represented by B/Yamagata/16/88 and B/Victoria/2/87 viruses. The recommended influenza B components for the 2018-19 Northern Hemisphere influenza vaccine are B/Colorado/06/2017 (Victoria lineage) and B/Phuket/3073/2013 (Yamagata lineage).
- Nine influenza B viruses were characterized as B/Colorado/06/2017, which belong to the Victoria lineage and are included as an influenza B component of the 2018-19 Northern Hemisphere influenza vaccine.
- Two viruses showed reduced titer with ferret antisera raised against cell culture-propagated B/Colorado/06/2017.
- 17 influenza B viruses were characterized as B/Phuket/3073/2013-like, which belongs to the Yamagata lineage and is included as an influenza B component of the 2018-19 Northern Hemisphere quadrivalent influenza vaccine.
Antiviral Resistance
Antiviral Resistance – Amantadine:
356 influenza A (51 A(H3N2) and 305 A(H1N1)) viruses were tested for resistance to amantadine and it was found that:
- All 356 influenza A viruses were resistant to amantadine.
Antiviral Resistance – Oseltamivir:
842 influenza viruses (76 A(H3N2), 740 A(H1N1) and 26 B) were tested for resistance to oseltamivir and it was found that:
- All 76 A(H3N2) viruses were sensitive to oseltamivir.
- Of the 740 A(H1N1) viruses tested, 738 were sensitive to oseltamivir and two viruses were resistant to oseltamivir with a H275Y mutation.
- All 26 B viruses were sensitive to oseltamivir.
Antiviral Resistance – Zanamivir:
841 influenza viruses (76 A(H3N2), 739 H1N1 and 26 B) were tested for resistance to zanamivir and it was found that:
- All 841 influenza viruses were sensitive to zanamivir.