
FluWatch report: June 14, 2020 to July 18, 2020 (weeks 25-29)
Download the alternative format
(PDF format, 1.3 MB, 14 pages)
Organization: Public Health Agency of Canada
Date published: 2020-06-15
Related Topics
Overall Summary
- In weeks 25 to 29 exceptionally low levels of influenza activity were reported across Canada.
- During weeks 25 to 29, the percentage of tests positive for influenza (0.03%) remained at the lowest level recorded for the past nine seasons. The proportion of primary care visits for ILI were lower than average; no outbreaks and very few influenza-related hospitalizations were reported.
- Many influenza surveillance indicators may be influenced by the COVID-19 pandemic, including changes in healthcare-seeking behaviour, impacts of public health measures (e.g. social distancing) and influenza testing capacity. Current data should be interpreted with consideration for this context. See the COVID-19 Epidemiology update for information on COVID-19 cases in Canada.
- The next monthly FluWatch report will be published on August 28, 2020. Weekly reporting of laboratory detections of respiratory viruses will continue via our Respiratory Virus Detections Surveillance System
On this page
- Influenza/ILI Activity (geographic spread)
- Laboratory Confirmed Influenza Detections
- Syndromic/Influenza-like Illness Surveillance
- FluWatchers
- Influenza Outbreak Surveillance
- Severe Outcomes Influenza Surveillance
- Influenza Strain Characterizations
- Antiviral Resistance
- Vaccine Monitoring
- Provincial and International Influenza Reports
Influenza/Influenza-like Illness (ILI) Activity (geographic spread)
During week 29, influenza/ILI activity was reported in only one region in BC (Figure 1).
Figure 1 - Map of influenza/ILI activity by province and territory, Canada, week 2020-29
Number of Regions Reporting in week 29: 41 out of 53
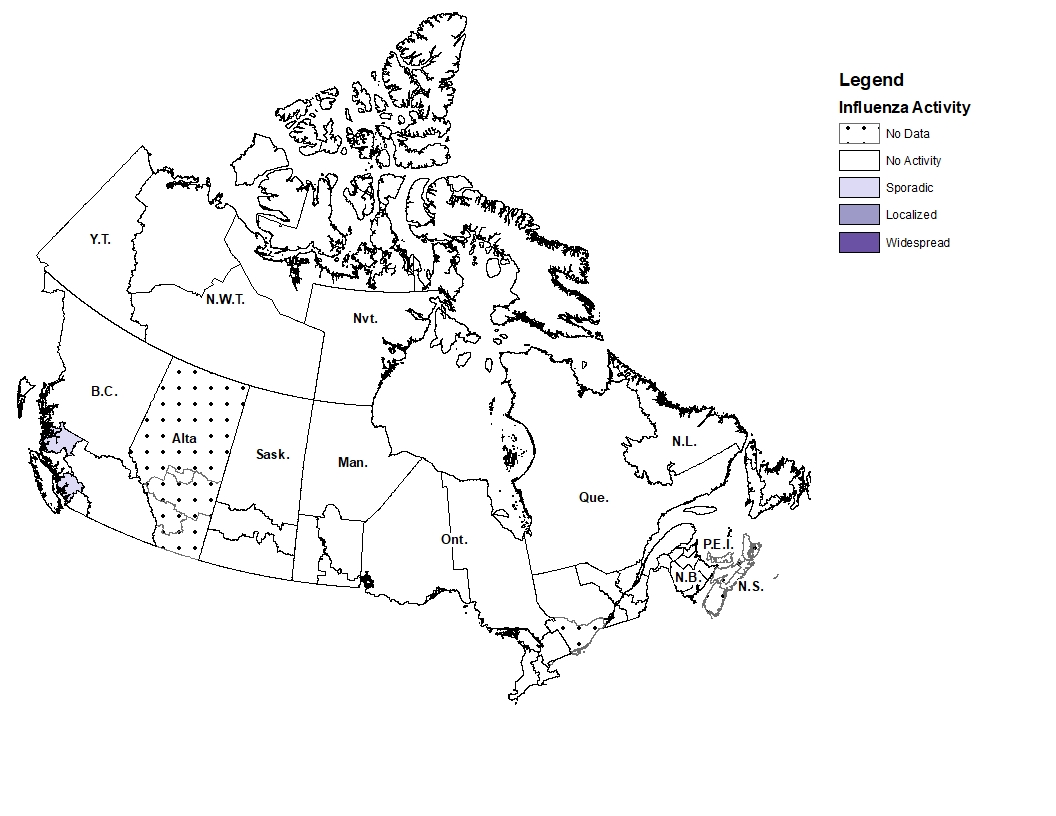
Figure 1 - Text equivalent
| Province | Influenza Surveillance Region | Activity Level |
|---|---|---|
| N.L. | Eastern | No Activity |
| N.L. | Labrador-Grenfell | No Activity |
| N.L. | Central | No Activity |
| N.L. | Western | No Activity |
| P.E.I. | Prince Edward Island | No Data |
| N.S. | Zone 1 - Western | No Data |
| N.S. | Zone 2 - Northern | No Data |
| N.S. | Zone 3 - Eastern | No Data |
| N.S. | Zone 4 - Central | No Data |
| N.B. | Region 1 | No Activity |
| N.B. | Region 2 | No Activity |
| N.B. | Region 3 | No Activity |
| N.B. | Region 4 | No Activity |
| N.B. | Region 5 | No Activity |
| N.B. | Region 6 | No Activity |
| N.B. | Region 7 | No Activity |
| Que. | Nord-est | No Activity |
| Que. | Québec et Chaudieres-Appalaches | No Activity |
| Que. | Centre-du-Québec | No Activity |
| Que. | Montréal et Laval | No Activity |
| Que. | Ouest-du-Québec | No Activity |
| Que. | Montérégie | No Activity |
| Ont. | Central East | No Activity |
| Ont. | Central West | No Activity |
| Ont. | Eastern | No Data |
| Ont. | North East | No Activity |
| Ont. | North West | No Activity |
| Ont. | South West | No Activity |
| Ont. | Toronto | No Data |
| Man. | Northern Regional | No Activity |
| Man. | Prairie Mountain | No Activity |
| Man. | Interlake-Eastern | No Activity |
| Man. | Winnipeg | No Activity |
| Man. | Southern Health | No Activity |
| Sask. | North | No Activity |
| Sask. | Central | No Activity |
| Sask. | South | No Activity |
| Alta. | North Zone | No Data |
| Alta. | Edmonton | No Data |
| Alta. | Central Zone | No Data |
| Alta. | Calgary | No Data |
| Alta. | South Zone | No Data |
| B.C. | Interior | No Activity |
| B.C. | Fraser | No Activity |
| B.C. | Vancouver Coastal | Sporadic |
| B.C. | Vancouver Island | No Activity |
| B.C. | Northern | No Activity |
| Y.T. | Yukon | No Activity |
| N.W.T. | North | No Activity |
| N.W.T. | South | No Activity |
| Nvt. | Qikiqtaaluk | No Activity |
| Nvt. | Kivalliq | No Activity |
| Nvt. | Kitimeot | No Activity |
Laboratory-Confirmed Influenza Detections
In weeks 25 to 29, the percentage of laboratory tests positive for influenza remained at the lowest level observed compared the past 9 seasons (Figure 2). The average percentage of tests positive for influenza during this 5-week period was 0.03% compared to 1.43% during the past 5 seasons.
In weeks 25-29, an average of 6,066 tests for influenza were performed at reporting laboratories, which is three times the average for this period over the past 5 seasons.
The percentage of positive tests crossed the seasonal threshold of 5% in week 12 (mid-March), indicating the end of the influenza season at the national level, 9 weeks earlier than average compared to the past 5 seasons. An abrupt end to the 2019-20 influenza season was observed in several countries, concurrent with the implementation of public health measures to reduce the spread of COVID-19.
Testing for influenza and other respiratory viruses has been influenced by the current COVID-19 pandemic. Changes in laboratory testing practices from March to June may affect the comparability of data to previous weeks or previous seasons.
To date this season (weeks 35 to 29), all influenza types and subtypes have circulated (Figure 3). Among the 55,364 laboratory detections of influenza reported:
- 59% (32,686) were influenza A.
- Among subtyped influenza A detections (7,332), A(H1N1) is the predominant subtype this season (68%).
Detailed information on age and type/subtype has been received for 42,538 laboratory-confirmed influenza cases (Table 1). To date this season (weeks 35 to 29):
- Cases of influenza A(H1N1) (3,739) were primarily in adults; 26% 20-44 years, 26% 45-64 years and 28% 65 years of age and older.
- Among cases of influenza A(H3N2) (2,057), the largest proportion of cases was in adults 65 years of age and older (46%).
- Cases of influenza B (18,193) were primarily in younger age groups; 22% under 5 years of age, 34% 5-19 years and 31% between 20 and 44 years of age.
For more detailed weekly and cumulative influenza data, see the text descriptions for Figures 2 and 3 or the Respiratory Virus Detections in Canada Report.
Figure 2 - Number of positive influenza tests and percentage of tests positive, by type, subtype and report week, Canada, weeks 2019-35 to 2020-29
Number of Laboratories Reporting in Week 29: 32 out of 36
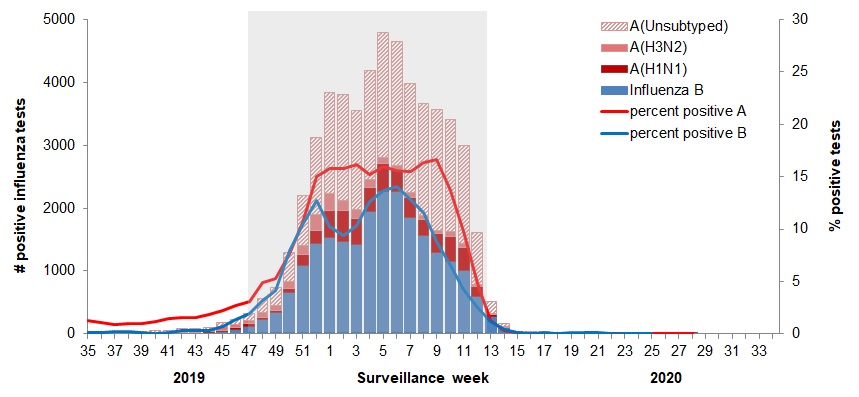
The shaded area indicates weeks where the positivity rate was at least 5% and a minimum of 15 positive tests were observed, signalling the period of seasonal influenza activity.
Figure 2 - Text equivalent
| Surveillance Week | A(Unsubtyped) | A(H3N2) | A(H1N1) | Influenza B | Percent Positive A | Percent Positive B |
|---|---|---|---|---|---|---|
| 35 | 10 | 16 | 0 | 2 | 1.3 | 0.1 |
| 36 | 11 | 13 | 2 | 2 | 1.1 | 0.1 |
| 37 | 5 | 17 | 2 | 5 | 0.9 | 0.2 |
| 38 | 11 | 15 | 3 | 6 | 1.0 | 0.2 |
| 39 | 11 | 21 | 2 | 3 | 1.0 | 0.1 |
| 40 | 34 | 9 | 1 | 2 | 1.2 | 0.1 |
| 41 | 34 | 18 | 0 | 5 | 1.4 | 0.1 |
| 42 | 54 | 12 | 1 | 14 | 1.6 | 0.3 |
| 43 | 44 | 13 | 7 | 17 | 1.6 | 0.3 |
| 44 | 43 | 23 | 16 | 17 | 1.8 | 0.3 |
| 45 | 57 | 57 | 20 | 39 | 2.2 | 0.7 |
| 46 | 82 | 43 | 23 | 77 | 2.7 | 1.4 |
| 47 | 118 | 49 | 33 | 124 | 3.1 | 1.9 |
| 48 | 225 | 67 | 42 | 223 | 4.9 | 3.2 |
| 49 | 281 | 79 | 41 | 336 | 5.3 | 4.1 |
| 50 | 463 | 100 | 73 | 654 | 7.7 | 8.0 |
| 51 | 794 | 149 | 169 | 1094 | 10.6 | 10.4 |
| 52 | 1223 | 267 | 197 | 1439 | 15.0 | 12.7 |
| 1 | 1620 | 261 | 431 | 1533 | 15.8 | 10.3 |
| 2 | 1690 | 165 | 493 | 1463 | 15.8 | 9.4 |
| 3 | 1575 | 139 | 417 | 1418 | 16.2 | 10.3 |
| 4 | 1727 | 133 | 370 | 1952 | 15.2 | 12.7 |
| 5 | 1983 | 97 | 440 | 2269 | 16.0 | 13.7 |
| 6 | 1970 | 75 | 344 | 2265 | 15.6 | 14.1 |
| 7 | 1741 | 76 | 321 | 1851 | 15.5 | 12.8 |
| 8 | 1768 | 74 | 255 | 1559 | 16.3 | 11.6 |
| 9 | 1928 | 58 | 303 | 1287 | 16.7 | 8.9 |
| 10 | 1772 | 81 | 399 | 1152 | 13.6 | 6.5 |
| 11 | 1552 | 70 | 354 | 1015 | 9.8 | 4.3 |
| 12 | 832 | 38 | 154 | 595 | 4.8 | 2.5 |
| 13 | 185 | 19 | 39 | 269 | 1.3 | 1.2 |
| 14 | 48 | 5 | 11 | 97 | 0.3 | 0.4 |
| 15 | 14 | 1 | 7 | 19 | 0.1 | 0.1 |
| 16 | 1 | 0 | 3 | 11 | 0.0 | 0.1 |
| 17 | 5 | 1 | 0 | 14 | 0.0 | 0.1 |
| 18 | 4 | 0 | 0 | 9 | 0.0 | 0.1 |
| 19 | 0 | 0 | 0 | 12 | 0.0 | 0.1 |
| 20 | 6 | 0 | 0 | 11 | 0.1 | 0.1 |
| 21 | 1 | 0 | 1 | 9 | 0.0 | 0.1 |
| 22 | 5 | 0 | 0 | 4 | 0.1 | 0.0 |
| 23 | 2 | 0 | 3 | 2 | 0.1 | 0.0 |
| 24 | 0 | 0 | 0 | 2 | 0.0 | 0.0 |
| 25 | 3 | 0 | 0 | 1 | 0.1 | 0.0 |
| 26 | 0 | 0 | 0 | 0 | 0 | 0 |
| 27 | 1 | 0 | 1 | 0 | 0 | 0 |
| 28 | 0 | 0 | 1 | 0 | 0 | 0 |
| 29 | 0 | 0 | 0 | 0 | 0 | 0 |
Figure 3 - Distribution of positive influenza specimens by type/subtype and province/territory, Canada, weeks 2019-35 to 2020-29
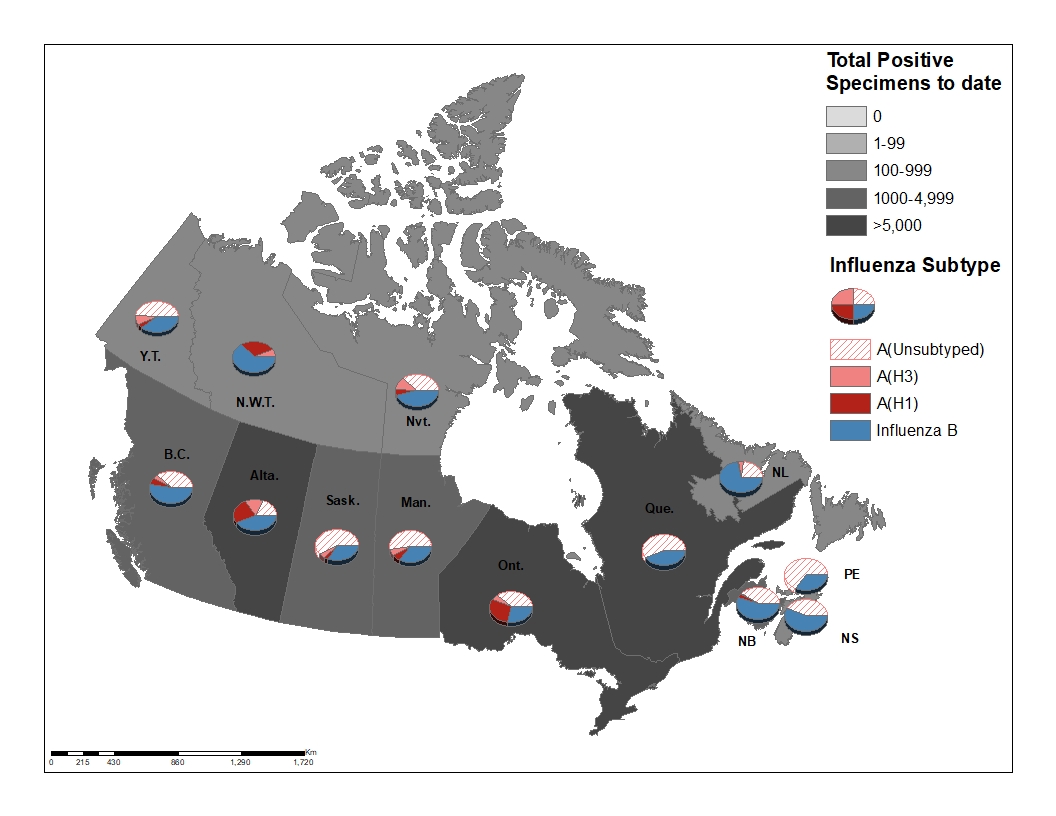
Figure 3 - Text equivalent
| ProvincesTable Figure 3 - Footnote 1 | Cumulative (August 25, 2019 to July 18, 2020) | |||||
|---|---|---|---|---|---|---|
| A Total | A(H1N1) | A(H3N2) | A(UnS)Table Figure 3 - Footnote 3 | B Total | A & B Total | |
| B.C. | 4091 | 277 | 244 | 1852 | 2575 | 6666 |
| Alta. | 4374 | 1741 | 1287 | 1346 | 3417 | 7791 |
| Sask. | 1370 | 59 | 102 | 1209 | 700 | 2070 |
| Man. | 1648 | 174 | 134 | 1340 | 889 | 2537 |
| Ont. | 6513 | 2573 | 465 | 3475 | 2630 | 9143 |
| Que. | 12846 | 0 | 0 | 12846 | 10027 | 22873 |
| N.B. | 1047 | 61 | 29 | 957 | 1292 | 2339 |
| N.S. | 201 | 3 | 2 | 196 | 248 | 449 |
| P.E.I. | 144 | 0 | 0 | 144 | 78 | 222 |
| N.L. | 208 | 8 | 33 | 167 | 513 | 721 |
| Y.T. | 73 | 4 | 8 | 55 | 45 | 118 |
| N.W.T | 110 | 90 | 19 | 1 | 191 | 301 |
| Nvt. | 61 | 5 | 14 | 42 | 73 | 134 |
| Canada | 32686 | 4995 | 2337 | 23630 | 22678 | 55364 |
| PercentageTable Figure 3 - Footnote 2 | 59% | 15% | 7% | 72% | 41% | 100% |
|
||||||
| Age groups (years) | Cumulative (August 25, 2019 to July 18, 2020) | ||||||
|---|---|---|---|---|---|---|---|
| Influenza A | B | Influenza A and B | |||||
| A Total | A(H1N1) | A(H3N2) | A (Un subtyped) Table 1 Footnote 1 | Total | # | % | |
| 0-4 | 3798 | 441 | 213 | 3144 | 4050 | 7849 | 18% |
| 5-19 | 2745 | 298 | 261 | 2186 | 5992 | 8737 | 21% |
| 20-44 | 5227 | 961 | 331 | 3935 | 5583 | 10810 | 25% |
| 45-64 | 5033 | 983 | 304 | 3746 | 1160 | 6193 | 15% |
| 65+ | 7542 | 1056 | 948 | 5538 | 1408 | 8950 | 21% |
| Total | 24345 | 3739 | 2057 | 18549 | 18193 | 42538 | 100% |
|
|||||||
Syndromic / Influenza-like Illness Surveillance
Healthcare Professionals Sentinel Syndromic Surveillance
In weeks 25 to 29, an average of 0. 2% of visits to healthcare professionals were due to influenza-like illness (ILI) which continues to follow the downward trend observed since mid-March. In these five weeks, the proportion of visits for ILI was the lowest observed for this period compared to the past 5 seasons (Figure 4). This trend should be interpreted with caution as there have been changes in healthcare seeking behavior of individuals and a decreasing number of sentinels reporting in recent weeks. Given the evolving Canadian situation with COVID-19, we will continue to monitor this indicator closely.
Figure 4 – Percentage of visits for ILI reported by sentinels by report week, Canada, weeks 2019-35 to 2020-29
Number of Sentinels Reporting in week 29: 54
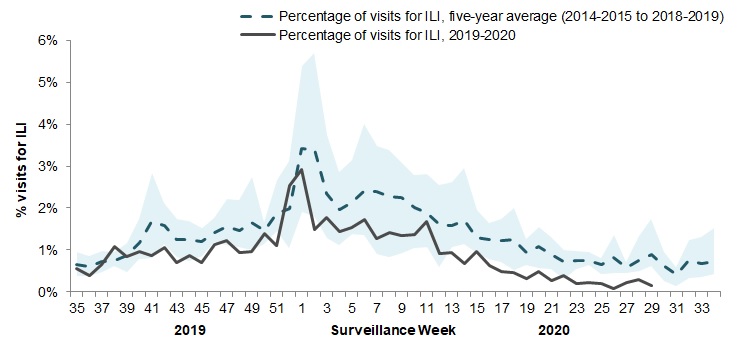
The shaded area represents the maximum and minimum percentage of visits for ILI reported by week from seasons 2014-2015 to 2018-2019
Figure 4 - Text equivalent
| Surveillance Week | 2019-2020 | Average | Min | Max |
|---|---|---|---|---|
| 35 | 0.6% | 0.6% | 0.4% | 0.9% |
| 36 | 0.4% | 0.6% | 0.4% | 0.9% |
| 37 | 0.7% | 0.7% | 0.5% | 1.0% |
| 38 | 1.1% | 0.7% | 0.6% | 1.0% |
| 39 | 0.8% | 0.9% | 0.5% | 1.2% |
| 40 | 1.0% | 1.2% | 0.8% | 1.7% |
| 41 | 0.9% | 1.7% | 0.8% | 2.8% |
| 42 | 1.1% | 1.6% | 1.2% | 2.1% |
| 43 | 0.7% | 1.2% | 0.8% | 1.7% |
| 44 | 0.9% | 1.2% | 0.7% | 1.7% |
| 45 | 0.7% | 1.2% | 0.9% | 1.5% |
| 46 | 1.1% | 1.4% | 1.2% | 1.8% |
| 47 | 1.2% | 1.6% | 1.1% | 2.2% |
| 48 | 0.9% | 1.5% | 1.1% | 2.2% |
| 49 | 1.0% | 1.7% | 1.0% | 2.8% |
| 50 | 1.4% | 1.5% | 1.1% | 1.7% |
| 51 | 1.1% | 1.9% | 1.4% | 2.7% |
| 52 | 2.5% | 2.0% | 1.0% | 3.1% |
| 1 | 2.9% | 3.4% | 1.9% | 5.4% |
| 2 | 1.5% | 3.4% | 1.8% | 5.7% |
| 3 | 1.8% | 2.3% | 1.3% | 3.7% |
| 4 | 1.4% | 2.0% | 1.1% | 2.9% |
| 5 | 1.5% | 2.1% | 1.4% | 3.1% |
| 6 | 1.7% | 2.4% | 1.4% | 4.0% |
| 7 | 1.3% | 2.4% | 0.9% | 3.5% |
| 8 | 1.4% | 2.3% | 0.8% | 3.4% |
| 9 | 1.3% | 2.3% | 0.9% | 3.1% |
| 10 | 1.4% | 2.0% | 1.0% | 2.8% |
| 11 | 1.7% | 1.9% | 1.1% | 2.8% |
| 12 | 0.9% | 1.6% | 0.6% | 2.6% |
| 13 | 0.9% | 1.6% | 1.1% | 2.6% |
| 14 | 0.7% | 1.7% | 1.1% | 3.0% |
| 15 | 1.0% | 1.3% | 0.9% | 1.9% |
| 16 | 0.6% | 1.2% | 0.8% | 1.7% |
| 17 | 0.5% | 1.2% | 0.7% | 1.7% |
| 18 | 0.5% | 1.3% | 0.5% | 2.0% |
| 19 | 0.3% | 0.9% | 0.6% | 1.3% |
| 20 | 0.5% | 1.1% | 0.6% | 1.5% |
| 21 | 0.3% | 0.9% | 0.5% | 1.3% |
| 22 | 0.4% | 0.7% | 0.3% | 1.0% |
| 23 | 0.2% | 0.8% | 0.6% | 1.0% |
| 24 | 0.2% | 0.7% | 0.6% | 1.0% |
| 25 | 0.2% | 0.6% | 0.4% | 0.8% |
| 26 | 0.1% | 0.8% | 0.5% | 1.4% |
| 27 | 0.2% | 0.6% | 0.5% | 0.7% |
| 28 | 0.3% | 0.7% | 0.5% | 1.3% |
| 29 | 0.2% | 0.9% | 0.6% | 1.7% |
FluWatchers
In week 29, 9,927 participants reported to FluWatchers. During weeks 25 to 29, the proportion of participants reporting symptoms of cough and fever was low at an average of 0.10% (Figure 5). The percentage of participants reporting cough and fever are at the lowest levels ever observed. This decline was concurrent with public health measures to reduce the spread of COVID-19, which coincides with the abrupt end of the influenza season at the national level. Given the ongoing Canadian response to the COVID-19 pandemic, monitoring of this indicator will continue throughout the summer.
Among the 11 participants who reported cough and fever in week 29, 72% (8) consulted a healthcare professionalIf you are interested in becoming a FluWatcher, sign up today.
Figure 5 - Percentage of FluWatchers participants reporting cough and fever, Canada, weeks 2019-40 to 2020-29
Number of participants reporting in week 29 : 9,927
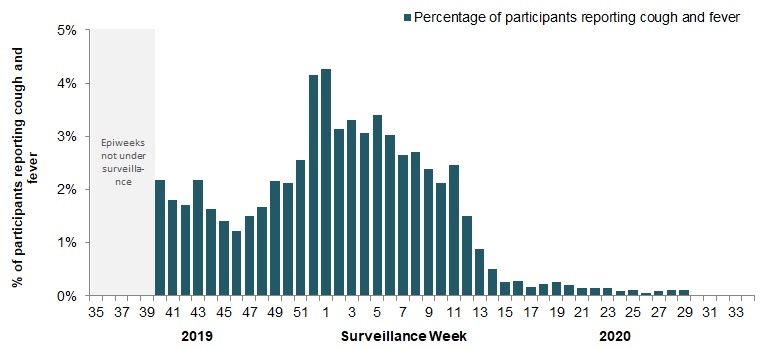
Figure 5 - Text equivalent
| Surveillance Week | % cough and fever |
|---|---|
| 40 | 2.2% |
| 41 | 1.8% |
| 42 | 1.7% |
| 43 | 2.2% |
| 44 | 1.6% |
| 45 | 1.4% |
| 46 | 1.2% |
| 47 | 1.5% |
| 48 | 1.7% |
| 49 | 2.2% |
| 50 | 2.1% |
| 51 | 2.6% |
| 52 | 4.1% |
| 1 | 4.3% |
| 2 | 3.1% |
| 3 | 3.3% |
| 4 | 3.1% |
| 5 | 3.4% |
| 6 | 3.0% |
| 7 | 2.7% |
| 8 | 2.7% |
| 9 | 2.4% |
| 10 | 2.1% |
| 11 | 2.5% |
| 12 | 1.5% |
| 13 | 0.9% |
| 14 | 0.5% |
| 15 | 0.3% |
| 16 | 0.3% |
| 17 | 0.2% |
| 18 | 0.2% |
| 19 | 0.3% |
| 20 | 0.2% |
| 21 | 0.1% |
| 22 | 0.2% |
| 23 | 0.1% |
| 24 | 0.1% |
| 25 | 0.1% |
| 26 | 0.1% |
| 27 | 0.1% |
| 28 | 0.1% |
| 29 | 0.1% |
Online Figure - Geographic distribution of FluWatchers participants reporting cough and fever, Canada, week 2020-29
Click on the map to access the link
Influenza Outbreak Surveillance
In weeks 25 to 29, no outbreaks of influenza or influenza-like illness were reported (Figure 6).
To date this season, a total of 974 laboratory-confirmed influenza outbreaks have been reported; 64% (627) in long-term care facilities, 25% (244) in facilities categorized as ‘other’, 9% (88) in acute care facilities, and 2% (15) in schools/daycares. Of the 912 outbreaks where influenza type was reported, 87% (789) were due to influenza A. Among the 324 outbreaks for which the influenza A subtype was reported, 54% were associated with A(H1N1) and 46% with A(H3N2). To date this season, 176 ILI outbreaks have also been reported; 98% (173) in schools/daycares and 2% (3) in facilities categorized as ‘other’.
Figure 6 - Number of new outbreaks of laboratory-confirmed influenza by report week, Canada, weeks 2019-35 to 2020-29
Number of provinces and territories reporting in week 29: 10 out of 13
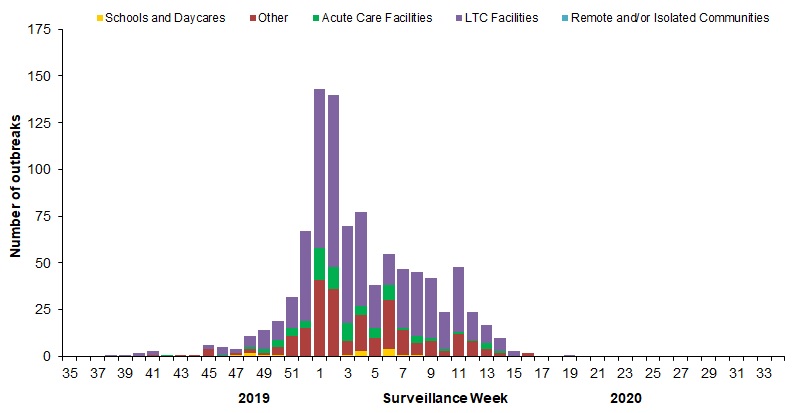
Figure 6 - Text equivalent
| Surveillance Week | Acute Care Facilities | Long Term Care Facilities | Other | Schools and Daycares | Remote and/or Isolated Communities |
|---|---|---|---|---|---|
| 35 | 0 | 0 | 0 | 0 | 0 |
| 36 | 0 | 0 | 0 | 0 | 0 |
| 37 | 0 | 0 | 0 | 0 | 0 |
| 38 | 0 | 1 | 0 | 0 | 0 |
| 39 | 0 | 1 | 0 | 0 | 0 |
| 40 | 0 | 2 | 0 | 0 | 0 |
| 41 | 0 | 2 | 1 | 0 | 0 |
| 42 | 1 | 0 | 0 | 0 | 0 |
| 43 | 0 | 0 | 1 | 0 | 0 |
| 44 | 0 | 0 | 1 | 0 | 0 |
| 45 | 0 | 2 | 4 | 0 | 0 |
| 46 | 1 | 4 | 0 | 0 | 0 |
| 47 | 0 | 2 | 1 | 1 | 0 |
| 48 | 1 | 6 | 2 | 2 | 0 |
| 49 | 2 | 10 | 1 | 1 | 0 |
| 50 | 4 | 10 | 4 | 1 | 0 |
| 51 | 4 | 17 | 11 | 0 | 0 |
| 52 | 4 | 48 | 15 | 0 | 0 |
| 1 | 17 | 85 | 40 | 0 | 0 |
| 2 | 12 | 92 | 36 | 0 | 0 |
| 3 | 10 | 52 | 7 | 1 | 0 |
| 4 | 5 | 50 | 19 | 3 | 0 |
| 5 | 5 | 23 | 9 | 0 | 0 |
| 6 | 8 | 17 | 26 | 4 | 0 |
| 7 | 1 | 32 | 13 | 1 | 0 |
| 8 | 4 | 34 | 6 | 1 | 0 |
| 9 | 2 | 31 | 8 | 0 | 0 |
| 10 | 1 | 20 | 3 | 0 | 0 |
| 11 | 1 | 34 | 13 | 0 | 0 |
| 12 | 1 | 15 | 8 | 0 | 0 |
| 13 | 3 | 9 | 2 | 0 | 0 |
| 14 | 0 | 6 | 2 | 0 | 0 |
| 15 | 0 | 3 | 0 | 0 | 0 |
| 16 | 0 | 0 | 2 | 0 | 0 |
| 17 | 0 | 0 | 0 | 0 | 0 |
| 18 | 0 | 0 | 0 | 0 | 0 |
| 19 | 0 | 1 | 0 | 0 | 0 |
| 20 | 0 | 0 | 0 | 0 | 0 |
| 21 | 0 | 0 | 0 | 0 | 0 |
| 22 | 0 | 0 | 0 | 0 | 0 |
| 23 | 0 | 0 | 0 | 0 | 0 |
| 24 | 0 | 0 | 0 | 0 | 0 |
| 25 | 0 | 0 | 0 | 0 | 0 |
| 26 | 0 | 0 | 0 | 0 | 0 |
| 27 | 0 | 0 | 0 | 0 | 0 |
| 28 | 0 | 0 | 0 | 0 | 0 |
| 29 | 0 | 0 | 0 | 0 | 0 |
Severe Outcomes Influenza Surveillance
Provincial/Territorial Influenza Hospitalizations and Deaths
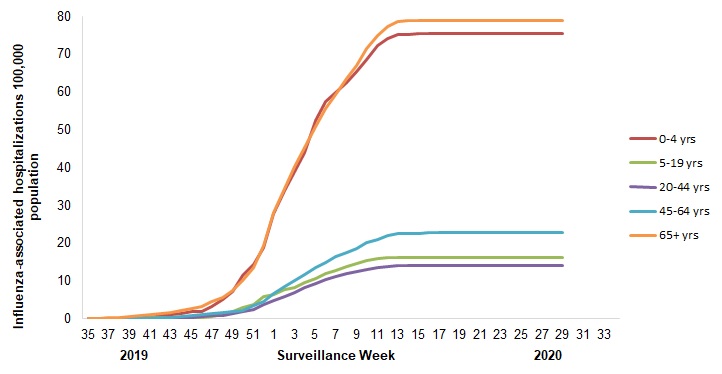
To date this season, 2,483 influenza-associated hospitalizations were reported by participating provinces and territories Footnote 1.
- 69% of the cases were associated with influenza A.
- Of the 1,098 cases for which subtype was reported, half were associated with influenza A(H3N2) and the other half were associated with A(H1N1).
- The highest cumulative hospitalization rates up to week 29 were among adults 65 years of age and older (78/100,000 population) and children under 5 years of age (75/100,000 population).
308 ICU admissions and 116 deaths have been reported.
- 70% of the ICU admissions and 73% of the deaths were associated with influenza A.
Figure 7 - Cumulative rates of influenza-associated hospitalization by age group and epidemiological week, Canada, participating provinces and territories Footnote 1 weeks 2019-35 to 2020-29
Number of provinces and territories reporting in week 29: 8 out of 9
- Footnote 1
-
Influenza-associated hospitalizations are reported by Alberta, Manitoba, New Brunswick, Newfoundland and Labrador, Northwest Territories, Nova Scotia, Prince Edward Island and Yukon. Only hospitalizations that require intensive medical care are reported by Saskatchewan.
Figure 7 - Text equivalent
| Surveillance Week | 0-4 yrs | 5-19 yrs | 20-44 yrs | 45-64 yrs | 65+ yrs |
|---|---|---|---|---|---|
| 35 | 0.0 | 0.0 | 0.0 | 0.0 | 0.0 |
| 36 | 0.0 | 0.0 | 0.0 | 0.0 | 0.2 |
| 37 | 0.0 | 0.0 | 0.0 | 0.1 | 0.2 |
| 38 | 0.0 | 0.0 | 0.0 | 0.1 | 0.4 |
| 39 | 0.2 | 0.0 | 0.0 | 0.1 | 0.6 |
| 40 | 0.2 | 0.0 | 0.0 | 0.1 | 0.8 |
| 41 | 0.4 | 0.2 | 0.1 | 0.2 | 1.1 |
| 42 | 0.8 | 0.2 | 0.1 | 0.2 | 1.3 |
| 43 | 1.0 | 0.2 | 0.2 | 0.3 | 1.6 |
| 44 | 1.5 | 0.2 | 0.2 | 0.5 | 2.1 |
| 45 | 1.9 | 0.4 | 0.4 | 0.8 | 2.8 |
| 46 | 1.9 | 0.4 | 0.6 | 1.1 | 3.3 |
| 47 | 3.1 | 0.6 | 0.8 | 1.5 | 4.6 |
| 48 | 5.0 | 1.1 | 1.0 | 1.6 | 5.7 |
| 49 | 7.1 | 1.9 | 1.3 | 2.0 | 7.5 |
| 50 | 11.1 | 3.0 | 1.8 | 2.3 | 10.2 |
| 51 | 14.3 | 3.7 | 2.5 | 3.5 | 13.6 |
| 52 | 18.7 | 5.8 | 3.7 | 4.5 | 19.3 |
| 1 | 27.7 | 6.5 | 4.8 | 6.6 | 28.1 |
| 2 | 33.8 | 7.6 | 6.0 | 8.4 | 34.5 |
| 3 | 38.8 | 8.4 | 7.0 | 10.0 | 40.4 |
| 4 | 43.7 | 9.6 | 8.2 | 11.8 | 45.4 |
| 5 | 52.3 | 10.8 | 9.4 | 13.5 | 50.9 |
| 6 | 57.3 | 11.9 | 10.5 | 15.0 | 55.7 |
| 7 | 59.4 | 12.8 | 11.2 | 16.3 | 59.5 |
| 8 | 62.1 | 13.8 | 11.9 | 17.4 | 63.4 |
| 9 | 65.1 | 14.5 | 12.4 | 18.5 | 67.0 |
| 10 | 68.0 | 15.3 | 13.0 | 19.8 | 71.3 |
| 11 | 71.4 | 15.7 | 13.4 | 20.8 | 74.8 |
| 12 | 72.4 | 15.9 | 13.7 | 21.4 | 76.7 |
| 13 | 73.3 | 16.0 | 13.8 | 21.7 | 77.5 |
| 14 | 73.3 | 16.0 | 13.8 | 21.7 | 77.7 |
| 15 | 73.3 | 16.0 | 13.8 | 21.7 | 77.7 |
| 16 | 73.3 | 16.0 | 13.8 | 21.7 | 77.7 |
| 17 | 73.3 | 16.0 | 13.8 | 21.7 | 77.7 |
| 18 | 73.3 | 16.0 | 13.8 | 21.7 | 77.7 |
| 19 | 73.3 | 16.0 | 13.8 | 21.7 | 77.7 |
| 20 | 73.3 | 16.0 | 13.8 | 21.7 | 77.7 |
| 21 | 73.3 | 16.0 | 13.8 | 21.7 | 77.7 |
| 22 | 73.3 | 16.0 | 13.8 | 21.7 | 77.7 |
| 23 | 73.3 | 16.0 | 13.8 | 21.7 | 77.7 |
| 24 | 75.4 | 16.3 | 14.2 | 22.8 | 79.0 |
| 25 | 75.4 | 16.3 | 14.2 | 22.8 | 79.0 |
| 26 | 75.4 | 16.3 | 14.2 | 22.8 | 79.0 |
| 27 | 75.4 | 16.3 | 14.2 | 22.8 | 79.0 |
| 28 | 75.4 | 16.3 | 14.2 | 22.8 | 79.0 |
| 29 | 75.4 | 16.3 | 14.2 | 22.8 | 79.0 |
Pediatric Influenza Hospitalizations and Deaths
In weeks 25 to 29, less than five pediatric (≤16 years of age) laboratory-confirmed influenza-associated hospitalizations were reported by the Immunization Monitoring Program Active (IMPACT) network (Figure 8). Since the end of March, the weekly number of reported cases has been at the lowest level observed during this period over the past 5 seasons.
To date this season (weeks 35 to 29):
- 1,222 pediatric hospitalizations have been reported by the IMPACT network, of which 52% (631) were associated with influenza A and 48% (591) with influenza B.
- The largest proportion of hospitalizations (65%) were among children under 5 years of age (Figure 9).
- 209 ICU admissions were reported, of which 56% were associated with influenza A, and 81% were among children under 5 years of age.
- Seven pediatric deaths have been reported.
Figure 8 - Number of pediatric (≤16 years of age) hospitalizations reported by the IMPACT network, by week, Canada, weeks 2019-35 to 2020-29
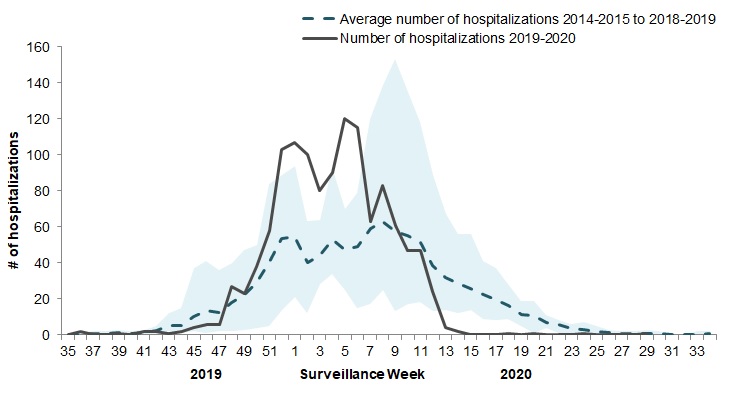
The shaded area represents the maximum and minimum number of cases reported by week from seasons 2014-15 to 2018-24
Figure 8 - Text equivalent
| Surveillance week | 2019-2020 | Average | Min | Max |
|---|---|---|---|---|
| 35 | 0 | 0 | 0 | 1 |
| 36 | 2 | 0 | 0 | 1 |
| 37 | 0 | 1 | 0 | 2 |
| 38 | 0 | 1 | 0 | 2 |
| 39 | 1 | 1 | 0 | 3 |
| 40 | 0 | 1 | 0 | 2 |
| 41 | 2 | 1 | 0 | 3 |
| 42 | 2 | 2 | 0 | 5 |
| 43 | 1 | 5 | 2 | 12 |
| 44 | 2 | 5 | 1 | 15 |
| 45 | 3 | 10 | 2 | 37 |
| 46 | 6 | 13 | 1 | 41 |
| 47 | 6 | 13 | 2 | 36 |
| 48 | 27 | 18 | 2 | 40 |
| 49 | 23 | 22 | 3 | 47 |
| 50 | 38 | 29 | 4 | 50 |
| 51 | 58 | 41 | 5 | 84 |
| 52 | 102 | 54 | 14 | 89 |
| 1 | 105 | 55 | 21 | 94 |
| 2 | 100 | 40 | 12 | 63 |
| 3 | 79 | 44 | 28 | 64 |
| 4 | 90 | 53 | 34 | 93 |
| 5 | 116 | 47 | 25 | 70 |
| 6 | 115 | 49 | 15 | 79 |
| 7 | 63 | 59 | 17 | 120 |
| 8 | 83 | 63 | 25 | 139 |
| 9 | 61 | 58 | 13 | 153 |
| 10 | 47 | 55 | 17 | 135 |
| 11 | 47 | 51 | 18 | 118 |
| 12 | 24 | 39 | 13 | 89 |
| 13 | 4 | 32 | 14 | 67 |
| 14 | 2 | 29 | 12 | 56 |
| 15 | 0 | 26 | 14 | 56 |
| 16 | 0 | 22 | 9 | 41 |
| 17 | 0 | 20 | 8 | 37 |
| 18 | 1 | 16 | 9 | 28 |
| 19 | 0 | 11 | 5 | 19 |
| 20 | 1 | 11 | 1 | 19 |
| 21 | 0 | 7 | 4 | 11 |
| 22 | 0 | 6 | 1 | 8 |
| 23 | 0 | 3 | 1 | 6 |
| 24 | 1 | 3 | 0 | 7 |
| 25 | 0 | 2 | 0 | 5 |
| 26 | 0 | 1 | 0 | 3 |
| 27 | 0 | 1 | 0 | 2 |
| 28 | 0 | 1 | 0 | 2 |
| 29 | 1 | 1 | 0 | 3 |
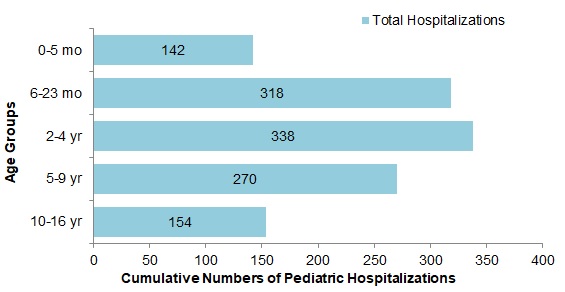
Figure 9 - Text Description
| Age Group | Total |
|---|---|
| 0-5 mo | 142 |
| 6-23 mo | 318 |
| 2-4 yr | 338 |
| 5-9 yr | 270 |
| 10-16 yr | 154 |
Adult Influenza Hospitalizations and Deaths
Surveillance of laboratory-confirmed influenza-associated adult (≥16 years of age) hospitalizations by the Canadian Immunization Research Network (CIRN) Serious Outcomes Surveillance (SOS) network began on November 1st and ended May 9th for the 2019-20 season.
To date this season, 802 hospitalizations, 89 intensive care unit admissions, and 44 deaths have been reported (Figure 10).
- The majority of hospitalizations have been due to influenza A (78%), and among those subtyped (171) 92% were influenza A(H1N1).
- Among the 629 cases with influenza A, the largest proportion of hospitalizations were in adults 65 years of age and older (66%). Among the 170 cases with influenza B, 52% were in adults 65 years of age and older, and 26% of cases were between 16 and 34 years of age (Figure 11).
- 90% of hospitalized cases reported at least one type of comorbid condition.
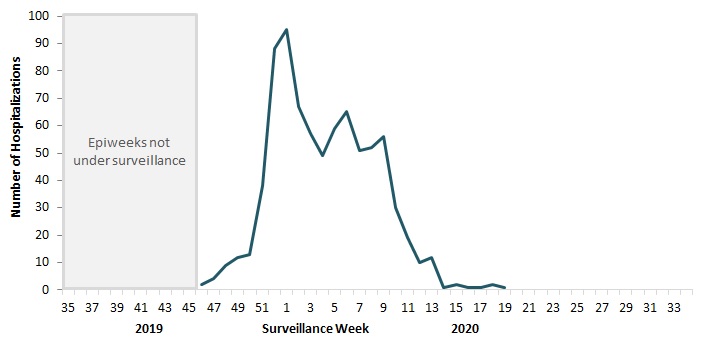
Figure 10 - Text Description
| Surveillance Week | Number of Hospitalizations |
|---|---|
| 35 | No data |
| 36 | No data |
| 37 | No data |
| 38 | No data |
| 39 | No data |
| 40 | No data |
| 41 | No data |
| 42 | No data |
| 43 | No data |
| 44 | No data |
| 45 | No data |
| 46 | 2 |
| 47 | 4 |
| 48 | 9 |
| 49 | 12 |
| 50 | 13 |
| 51 | 38 |
| 52 | 88 |
| 1 | 95 |
| 2 | 67 |
| 3 | 57 |
| 4 | 49 |
| 5 | 59 |
| 6 | 65 |
| 7 | 51 |
| 8 | 52 |
| 9 | 56 |
| 10 | 30 |
| 11 | 19 |
| 12 | 10 |
| 13 | 12 |
| 14 | 1 |
| 15 | 2 |
| 16 | 1 |
| 17 | 1 |
| 18 | 2 |
| 19 | 1 |
| 20 | 0 |
| 21 | 0 |
| 22 | 0 |
| 23 | 0 |
| 24 | 0 |
| 25 | 0 |
| 26 | 0 |
| 27 | 0 |
| 28 | 0 |
| 29 | 0 |
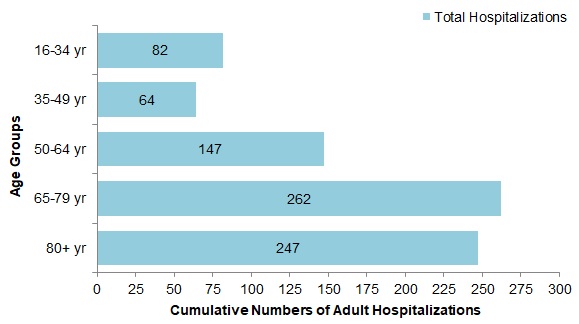
Figure 11 - Text Description
| Age Group | Total hospitalizations |
|---|---|
| 16-34 yr | 82 |
| 35-49 yr | 64 |
| 50-64 yr | 147 |
| 65-79 yr | 262 |
| 80+ yr | 247 |
Influenza Strain Characterizations
From September 1, 2019 to July 18, 2020, the National Microbiology Laboratory (NML) has characterized 12,21 influenza viruses (760 A(H1N1), 368 A(H3N2) and 893 influenza B) that were received from Canadian laboratories.
Influenza A(H3N2)
Over recent years, circulating strains of A(H3N2) have evolved, and are increasingly difficult to characterize by hemagglutination inhibition (HI) assay. Genetic characterization is established by sequencing the hemagglutinin (HA) gene of the influenza viruses to compare their genetic properties.
Antigenic Characterization:
Among the 109 influenza A(H3N2) viruses antigenically characterized to date, the majority (79%) showed reduced titer by HI assay to A Kansas/14/2017 using antiserum raised against egg-propagated A Kansas/14/2017. Twenty-three viruses were characterized as A Kansas/14/2017-like (Figure 12a).
Genetic Characterization:
Nearly all (96%) of the 368 A(H3N2) viruses genetically characterized this season belonged to genetic group 3C.2a1b based on sequence analysis of the HA gene. Fifteen viruses belonged to the genetic group 3C.3a (Figure 13).
Group 3C.2a1b viruses analysed represent:
- 86% (94 out of 109) viruses that were also antigenically characterized.
- 100% (259 out of 259) viruses which did not grow to sufficient hemagglutination titer for antigenic characterization by HI assay.
A/Kansas/14/2017 belongs to genetic group 3C.3a and is the influenza A(H3N2) component of the 2019-20 Northern Hemisphere influenza vaccine.
Influenza A(H1N1)
Among the 760 A(H1N1) viruses characterized to date, 48% were antigenically similar to A/Brisbane/02/2018 by HI testing using antiserum raised against egg-propagated A/Brisbane/02/2018 (Figure 12b).
A/Brisbane/02/2018 is the influenza A(H1N1) component of the 2019-20 Northern Hemisphere influenza vaccine.
Influenza B
Antigenic Characterization:
Among the 184 influenza B viruses antigenically characterized this season, the vast majority (181) belonged to the B/Victoria lineage. Three viruses were antigenically characterized as similar to B/Phuket/3073/2013 (B/Yamagata lineage).
The majority (90%, 162) of B/Victoria lineage viruses showed reduced titer by HI assay to B/Colorado/06/2017 using antiserum raised against cell culture-propagated B/Colorado/06/2017 (Figure 12c).
Sequence analysis of 161 B/Victoria lineage viruses with reduced titre to B/Colorado/06/2017 showed that 100% had a three amino acid deletion (162-164) in the HA gene and belong to the genetic subclade V1A.3 (3Del). Sequencing is pending for the remaining viruses.
Genetic Characterization:
Genetic characterization was also performed on 481 B/Victoria lineage viruses. All of these viruses had a three amino acid deletion (162-164) in the HA gene and belong to the genetic subclade V1A.3 (3Del).
To date, 100% (709) of influenza B/Victoria viruses genetically characterized belong to the genetic subclade V1A.3 (3Del) (Fig 13b). Viruses in this genetic subclade are antigenically distinct from the vaccine strain B/Colorado/06/2017, which belongs to genetic subclade V1A.1 (2Del).
The recommended influenza B components for the 2019-20 Northern Hemisphere influenza vaccine are B/Colorado/06/2017 (Victoria lineage) and B/Phuket/3073/2013 (Yamagata lineage). B/Phuket/3073/2013 is included in the quadrivalent influenza vaccine. The vaccine strain B/Colorado/06/2017 belongs to genetic subclade V1A.1.
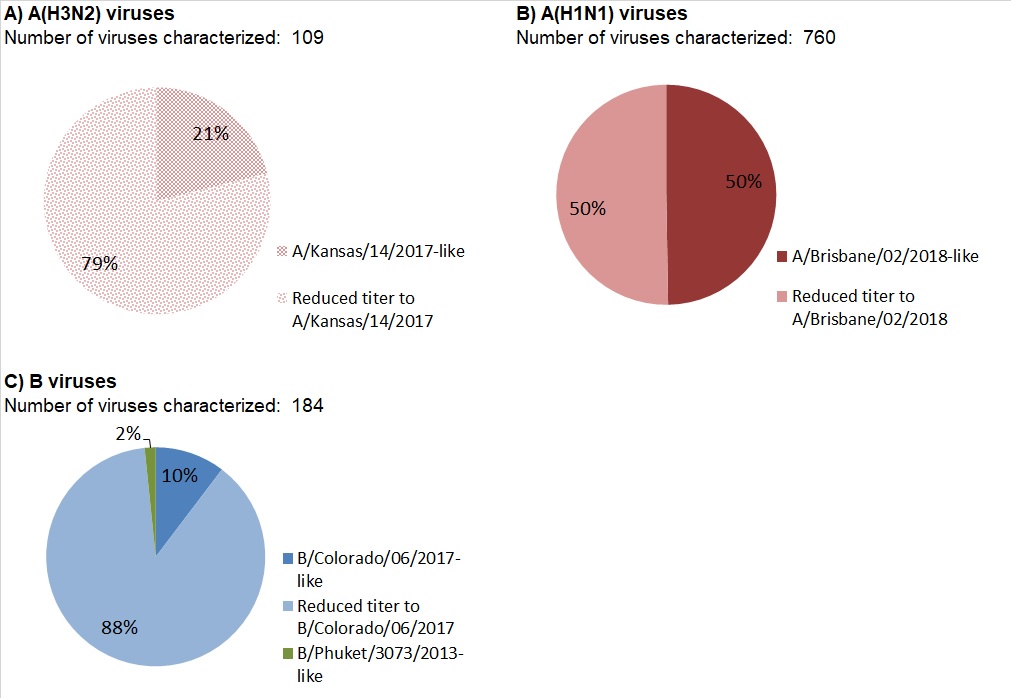
Figure 12 - Text Description
| Number of viruses characterized: 109 | ||
| Antigenic phenotype of A(H3N2) virus | Number of viruses | Percentage |
|---|---|---|
| A/Kansas/14/2017-like | 23 | 21% |
| Reduced titer to A/Kansas/14/2017 | 86 | 79% |
| Number of viruses characterized: 760 | ||
| Antigenic phenotype of A(H1N1) virus | Number of viruses | Percentage |
|---|---|---|
| A/Brisbane/02/2018-like | 378 | 50% |
| Reduced titer to A/Brisbane/02/2018 | 382 | 52% |
| Number of viruses characterized: 184 | ||
| Antigenic phenotype of influenza B virus | Number of viruses | Percentage |
|---|---|---|
| B/Colorado/06/2017-like | 19 | 10% |
| Reduced titer to B/Colorado/06/2017 | 162 | 88% |
| B/Phuket/3073/2013-like | 3 | 2% |
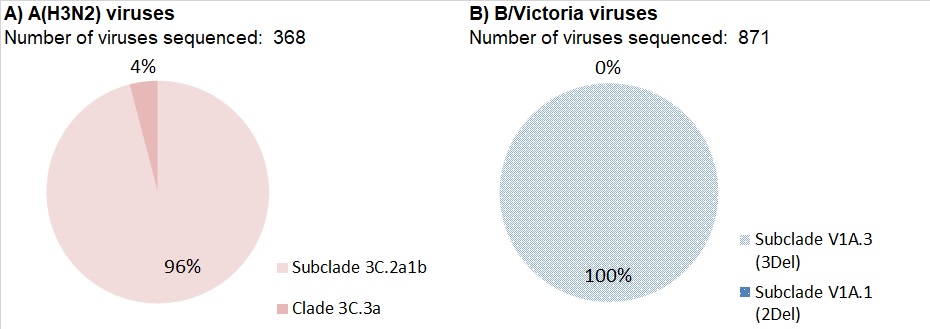
Figure 13 - Text Description
| Number of viruses sequenced: 368 | ||
| Genetic Clade of A(H3N2) virus | Number of viruses | Percentage |
|---|---|---|
| Subclade 3C.2a1b | 353 | 96% |
| Clade 3C.3a | 15 | 4% |
| Number of viruses sequenced: 871 | ||
| Genetic Clade of influenza B/Victoria virus | Number of viruses | Percentage |
|---|---|---|
| Subclade V1A.3 (3Del) | 871 | 100% |
| Subclade V1A.1 (2Del) | 0 | 0% |
Antiviral Resistance
The National Microbiology Laboratory (NML) also tests influenza viruses received from Canadian laboratories for antiviral resistance. From September 1, 2019 to April 9, 2020, the following results were reported:
Oseltamivir:
733 influenza viruses (164 A(H3N2), 283 A(H1N1) and 286 B) were tested for resistance to oseltamivir:
- All influenza A(H3N2) and B viruses were sensitive to oseltamivir.
- Among the A(H1N1) viruses tested, 282 (99.6%) were sensitive to oseltamivir and one virus was resistant to oseltamivir with the H275Y mutation in the neuraminidase gene.
Zanamivir:
733 influenza viruses (164 A(H3N2), 283 A(H1N1) and 286 B) were tested for resistance to zanamivir:
- All influenza viruses tested were sensitive to zanamivir.
Amantadine:
High levels of resistance to amantadine persist among influenza A(H1N1) and influenza A(H3N2) viruses. All viruses tested this season were resistant.
Vaccine Monitoring
Vaccine monitoring refers to activities related to the monitoring of influenza vaccine coverage and effectiveness.
Vaccine Coverage
The Seasonal Influenza Immunization Coverage Survey is an annual telephone survey conducted between January and February that collects information from Canadians on whether they received the annual seasonal influenza vaccine that season. Vaccine coverage is measured as the percentage of people who received the influenza vaccine in a specific influenza season.
In the 2019-20 influenza season, coverage was similar to the 2018-19 season, at:
- 34% among adults aged 18 to 64 years.
- 30% among adults aged 18-64 without chronic diseases.
- 44% among adults aged 18 to 64 years with chronic diseases.
- 70% among seniors (aged 65 years and older).
| Age group (years) | All | Male | Female | |||
|---|---|---|---|---|---|---|
| N | Vaccine Coverage % (95% CI) |
N | Vaccine Coverage % (95% CI) |
N | Vaccine Coverage % (95% CI) |
|
| All adults (≥18) | 3023 | 41.8 (39.7-43.9) | 1320 | 37.2 (34.1-40.2) | 1691 | 46.1 (43.2-49.0) |
| 18-64 | 2234 | 34.1 (31.8-36.5) | 1005 | 29.8 (26.5-33.1) | 1218 | 38.4 (35.1-41.7) |
| with chronic diseases | 668 | 43.6 (39.0-48.1) | 268 | 38.3 (31.5-45.2) | 397 | 47.9 (41.7-54.0) |
| without chronic diseases | 1558 | 30.0 (27.3-32.7) | 732 | 26.7 (22.9-30.5) | 818 | 33.5 (29.6-37.3) |
| ≥65 | 789 | 70.3 (66.7-73.8) | 315 | 67.2 (61.5-72.9) | 473 | 72.7 (68.3-77.1) |
CI: 95% confidence interval
|
||||||
Vaccine Effectiveness
The Canadian Sentinel Practitioner Surveillance Network (SPSN) provides estimates of the effectiveness of the seasonal influenza vaccine in preventing medically-attended illness due to laboratory-confirmed influenza among Canadians.
Based on data collected between November 1, 2019 and February 1, 2020, vaccine effectiveness (VE) was estimated to be 58% for any influenza, 44% for influenza A(H1N1), 62% for influenza A(H3N2), and 69% for influenza B. Substantial protection was observed among children 1 to 19 years of age against both influenza A and B. A good level of protection was also observed among working age adults (20-64 yrs) across all influenza types (Table 2). VE among adults 65 years and older, although imprecise due to small numbers, was lower at 18% (95% CI -59 to 58). The SPSN interim estimates are published and available online.
More information on the network and past VE findings can be viewed on the SPSN website.
Updated influenza vaccine effectiveness estimates will be published at the end of the 2019/2020 influenza season. At that time, sufficient data will likely be available to estimate VE by age-group, including adults 65 years and older with greater precision, as well as for influenza A subtypes.
| All ages | 1-19 years | 20-64 years | ||
|---|---|---|---|---|
| VE(%) (CI)Table 3 - Footnote * | N | VE(%) (CI)Table 3 - Footnote * | VE(%) (CI)Table 3 - Footnote * | |
| All Influenza | 58 (47, 66) | 2808 | 74 (59, 84) | 55 (41, 66) |
| Influenza A | 49 (34, 60) | 2128 | 70 (44, 84) | 45 (25, 59) |
| Influenza A(H1N1) | 44 (26, 58) | 1948 | - | - |
| Influenza A(H3N2) | 62 (37, 77) | 1561 | - | - |
| Influenza B | 69 (57, 77) | 2080 | 77 (59, 87) | 68 (51, 79) |
|
||||