
FluWatch report: September 20, 2020 to October 3, 2020 (weeks 39-40)
Download the alternative format
(PDF format, 562 kb, 6 pages)
Organization: Public Health Agency of Canada
Date published: 2020-10-09
Related Topics
Overall Summary
- Testing for influenza continues at elevated levels, no influenza detections and no influenza activity was reported across Canada in weeks 39 to 40.
- During weeks 39 to 40, 15 influenza-like-illness (ILI) outbreaks were reported in schools and daycares which is higher than typically reported in these settings at this time of year. These elevated levels are not unexpected and are a signal of public health effectively leveraging existing flu surveillance systems to monitor respiratory viral illness in schools.
- Influenza surveillance indicators may be influenced by the COVID-19 pandemic, including changes in healthcare-seeking behaviour, impacts of public health measures and influenza testing capacity. Current data should be interpreted with consideration to this context. See the COVID-19 Epidemiology update for information on COVID-19 cases in Canada.
- FluWatch will resume weekly reporting next week. Weekly reporting of laboratory detections of respiratory viruses continues year-round via our Respiratory Virus Detections Surveillance System.
On this page
- Influenza/ILI Activity (geographic spread)
- Laboratory Confirmed Influenza Detections
- Syndromic/Influenza-like Illness Surveillance
- FluWatchers
- Influenza Outbreak Surveillance
- Severe Outcomes Influenza Surveillance
- Influenza Strain Characterizations
- Antiviral Resistance
- Vaccine Monitoring
- Provincial and International Influenza Reports
Influenza/Influenza-like Illness (ILI) Activity (geographic spread)
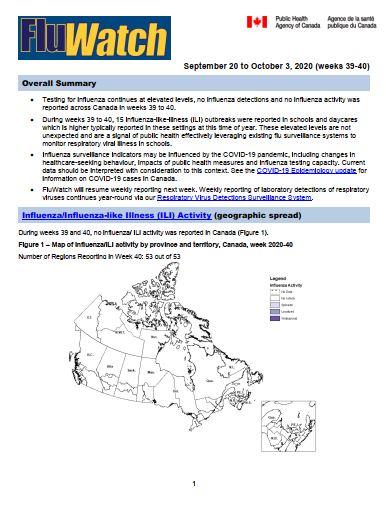
During weeks 39 and 40, no influenza/ ILI activity was reported in Canada (Figure 1).
Figure 1 - Map of influenza/ILI activity by province and territory, Canada, week 2020-40
Number of Regions Reporting in week 40: 53 out of 53
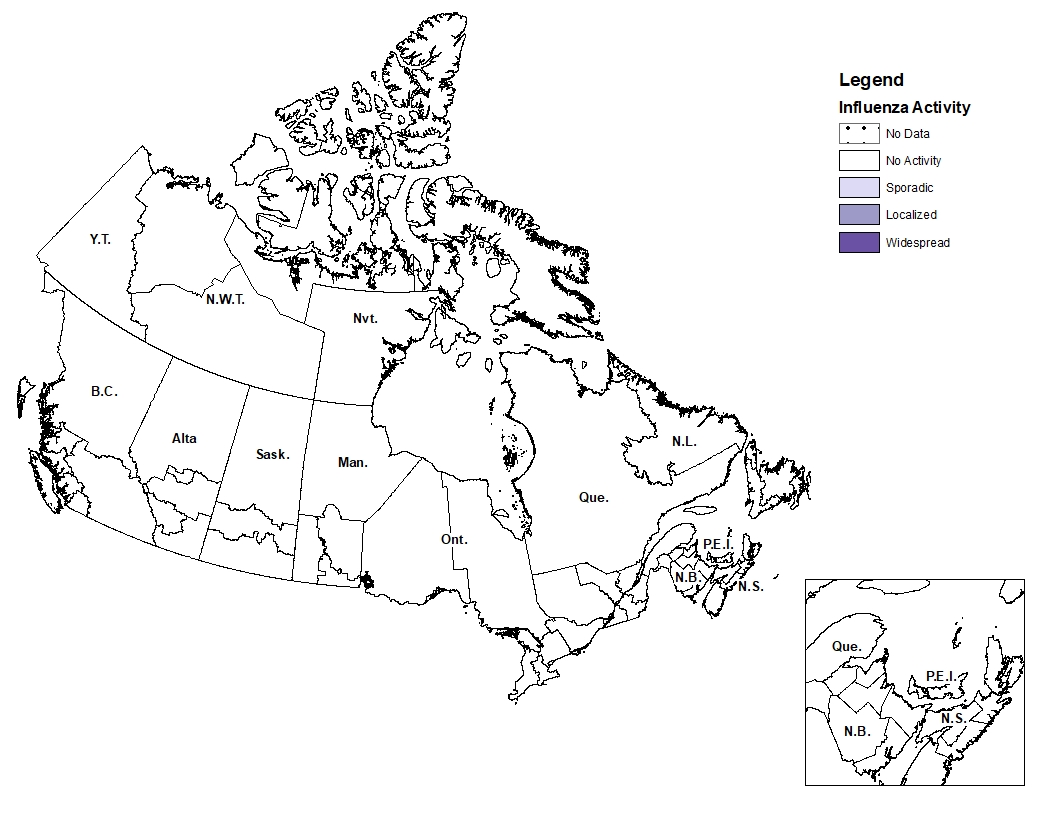
Figure 1 - Text equivalent
| Province | Influenza Surveillance Region | Activity Level |
|---|---|---|
| N.L. | Eastern | No Activity |
| N.L. | Labrador-Grenfell | No Activity |
| N.L. | Central | No Activity |
| N.L. | Western | No Activity |
| P.E.I. | Prince Edward Island | No Activity |
| N.S. | Zone 1 - Western | No Activity |
| N.S. | Zone 2 - Northern | No Activity |
| N.S. | Zone 3 - Eastern | No Activity |
| N.S. | Zone 4 - Central | No Activity |
| N.B. | Region 1 | No Activity |
| N.B. | Region 2 | No Activity |
| N.B. | Region 3 | No Activity |
| N.B. | Region 4 | No Activity |
| N.B. | Region 5 | No Activity |
| N.B. | Region 6 | No Activity |
| N.B. | Region 7 | No Activity |
| Que. | Nord-est | No Activity |
| Que. | Québec et Chaudieres-Appalaches | No Activity |
| Que. | Centre-du-Québec | No Activity |
| Que. | Montréal et Laval | No Activity |
| Que. | Ouest-du-Québec | No Activity |
| Que. | Montérégie | No Activity |
| Ont. | Central East | No Activity |
| Ont. | Central West | No Activity |
| Ont. | Eastern | No Activity |
| Ont. | North East | No Activity |
| Ont. | North West | No Activity |
| Ont. | South West | No Activity |
| Ont. | Toronto | No Activity |
| Man. | Northern Regional | No Activity |
| Man. | Prairie Mountain | No Activity |
| Man. | Interlake-Eastern | No Activity |
| Man. | Winnipeg | No Activity |
| Man. | Southern Health | No Activity |
| Sask. | North | No Activity |
| Sask. | Central | No Activity |
| Sask. | South | No Activity |
| Alta. | North Zone | No Activity |
| Alta. | Edmonton | No Activity |
| Alta. | Central Zone | No Activity |
| Alta. | Calgary | No Activity |
| Alta. | South Zone | No Activity |
| B.C. | Interior | No Activity |
| B.C. | Fraser | No Activity |
| B.C. | Vancouver Coastal | No Activity |
| B.C. | Vancouver Island | No Activity |
| B.C. | Northern | No Activity |
| Y.T. | Yukon | No Activity |
| N.W.T. | North | No Activity |
| N.W.T. | South | No Activity |
| Nvt. | Qikiqtaaluk | No Activity |
| Nvt. | Kivalliq | No Activity |
| Nvt. | Kitimeot | No Activity |
Laboratory-Confirmed Influenza Detections
In weeks 39 to 40, no laboratory detections of influenza were reported (Figure 2). Despite elevated levels of testing for influenza, the percentage of laboratory tests positive for influenza has remained at exceptionally low levels throughout the period of March to October. In weeks 39-40, an average of 6,294 tests for influenza were performed at reporting laboratories, which is 2.1 times the average for this period over the past 6 seasons. The average weekly percentage of tests positive for influenza during this 2-week period was 0%, compared to 1.7% during the past 6 seasons.
The 2019-20 influenza season in Canada ended abruptly in mid-March, concurrent with the implementation of public health measures to reduce the spread of COVID-19. Testing for influenza and other respiratory viruses has been influenced by the current COVID-19 pandemic. Changes in laboratory testing practices may affect the comparability of data to previous weeks or previous seasons.
For more detailed weekly and cumulative influenza data, see the text descriptions for Figure 2 or the Respiratory Virus Detections in Canada Report.
Figure 2 - Number of positive influenza tests and percentage of tests positive, by type, subtype and report week, Canada, weeks 2020-35 to 2020-40
The shaded area indicates weeks where the positivity rate was at least 5% and a minimum of 15 positive tests were observed, signalling the period of seasonal influenza activity.
Figure 2 - Text equivalent
| Surveillance Week | A(Unsubtyped) | A(H3N2) | A(H1N1) | Influenza B | Percent Positive A | Percent Positive B |
|---|---|---|---|---|---|---|
| 35 | 0 | 0 | 0 | 1 | 0.0 | 0.0 |
| 36 | 0 | 0 | 0 | 2 | 0.0 | 0.0 |
| 37 | 0 | 0 | 0 | 2 | 0.0 | 0.0 |
| 38 | 1 | 0 | 0 | 5 | 0.0 | 0.1 |
| 39 | 0 | 0 | 0 | 0 | 0.0 | 0.0 |
| 40 | 0 | 0 | 0 | 0 | 0.0 | 0.0 |
Figure 3 - Distribution of positive influenza specimens by type/subtype and province/territoryFootnote *, Canada, weeks 2020-35 to 2020-40
There is insufficient data for weeks 35-40 to present influenza detections by type/subtype and province/territory.
- Footnote *
-
Specimens from NWT, YT, and Nvt are sent to reference laboratories in other provinces.
Syndromic / Influenza-like Illness Surveillance
Healthcare Professionals Sentinel Syndromic Surveillance
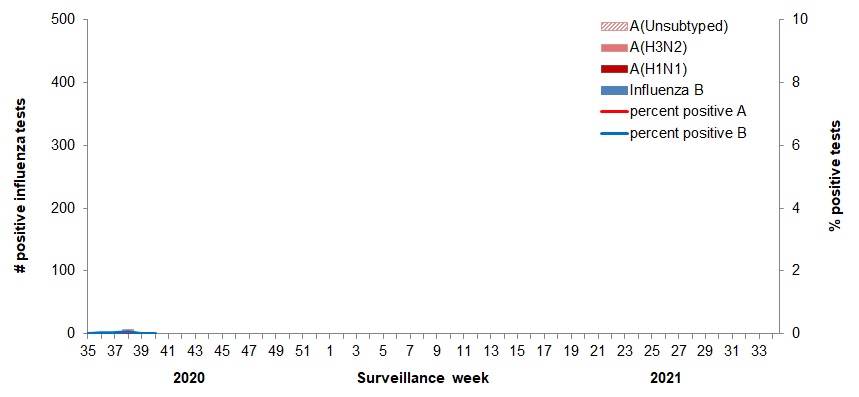
In weeks 39 to 40, an average of 0.36% of visits to healthcare professionals were due to influenza-like illness (ILI) which is similar to previous weeks, and continues to be lower than average compared to recent seasons. In these two weeks, the proportion of visits for ILI was the lowest observed for this period compared to the past six seasons (Figure 4). This trend should be interpreted with caution as there have been changes in healthcare seeking behavior of individuals and a smaller number of sentinels reporting in recent weeks compared to previous seasons.
Figure 4 – Percentage of visits for ILI reported by sentinels by report week, Canada, weeks 2020-35 to 2020-40
Number of participants reporting in week 40: 54
The shaded area represents the maximum and minimum percentage of visits for ILI reported by week from seasons 2014-2015 to 2020-2021
Figure 4 - Text equivalent
| Surveillance Week | 2020-2021 | Average | Min | Max |
|---|---|---|---|---|
| 35 | 0.1% | 0.6% | 0.4% | 0.9% |
| 36 | 0.2% | 0.7% | 0.4% | 1.0% |
| 37 | 0.4% | 0.7% | 0.6% | 1.0% |
| 38 | 0.3% | 0.9% | 0.5% | 1.2% |
| 39 | 0.4% | 1.1% | 0.8% | 1.7% |
| 40 | 0.2% | 1.6% | 0.8% | 2.8% |
| 41 | #N/A | 1.5% | 0.9% | 2.1% |
| 42 | #N/A | 1.2% | 0.8% | 1.7% |
| 43 | #N/A | 1.1% | 0.7% | 1.7% |
| 44 | #N/A | 1.1% | 0.9% | 1.5% |
| 45 | #N/A | 1.3% | 0.7% | 1.8% |
| 46 | #N/A | 1.5% | 1.1% | 2.2% |
| 47 | #N/A | 1.4% | 1.1% | 2.2% |
| 48 | #N/A | 1.5% | 0.9% | 2.8% |
| 49 | #N/A | 1.4% | 1.0% | 1.7% |
| 50 | #N/A | 1.8% | 1.4% | 2.7% |
| 51 | #N/A | 1.8% | 1.0% | 3.1% |
| 52 | #N/A | 3.3% | 1.9% | 5.4% |
| 53 | #N/A | 3.3% | 1.9% | 5.5% |
| 1 | #N/A | 3.3% | 1.8% | 5.7% |
| 2 | #N/A | 2.2% | 1.3% | 3.7% |
| 3 | #N/A | 1.9% | 1.1% | 2.9% |
| 4 | #N/A | 2.0% | 1.4% | 3.1% |
| 5 | #N/A | 2.3% | 1.4% | 4.0% |
| 6 | #N/A | 2.3% | 0.9% | 3.5% |
| 7 | #N/A | 2.1% | 0.8% | 3.4% |
| 8 | #N/A | 2.1% | 0.9% | 3.1% |
| 9 | #N/A | 1.9% | 1.0% | 2.8% |
| 10 | #N/A | 1.8% | 1.1% | 2.8% |
| 11 | #N/A | 1.6% | 0.6% | 2.6% |
| 12 | #N/A | 1.6% | 1.1% | 2.6% |
| 13 | #N/A | 1.7% | 1.1% | 3.0% |
| 14 | #N/A | 1.3% | 0.9% | 1.9% |
| 15 | #N/A | 1.2% | 0.8% | 1.7% |
| 16 | #N/A | 1.2% | 0.7% | 1.7% |
| 17 | #N/A | 1.3% | 0.5% | 2.0% |
| 18 | #N/A | 0.9% | 0.6% | 1.3% |
| 19 | #N/A | 1.1% | 0.6% | 1.5% |
| 20 | #N/A | 0.9% | 0.5% | 1.3% |
| 21 | #N/A | 0.7% | 0.3% | 1.0% |
| 22 | #N/A | 0.8% | 0.6% | 1.0% |
| 23 | #N/A | 0.7% | 0.6% | 1.0% |
| 24 | #N/A | 0.6% | 0.4% | 0.8% |
| 25 | #N/A | 0.8% | 0.5% | 1.4% |
| 26 | #N/A | 0.6% | 0.5% | 0.7% |
| 27 | #N/A | 0.7% | 0.5% | 1.3% |
| 28 | #N/A | 0.9% | 0.6% | 1.7% |
| 29 | #N/A | 0.6% | 0.2% | 0.9% |
| 30 | #N/A | 0.4% | 0.2% | 0.6% |
| 31 | #N/A | 0.8% | 0.3% | 1.2% |
| 32 | #N/A | 0.7% | 0.4% | 1.3% |
| 33 | #N/A | 0.7% | 0.4% | 1.5% |
| 34 | #N/A | 0.6% | 0.4% | 0.9% |
FluWatchers
In week 40, 10,171participants reported to FluWatchers. A total of 50 participants (0.49%) reported symptoms of cough and fever (Figure 5). The percentage of participants reporting cough and fever is at very low levels and may be a direct effect of individual and public health measures enacted to reduce the spread of COVID-19. FluWatchers reporting is not impacted by changes in health services or health seeking behaviours.
If you are interested in becoming a FluWatcher, sign up today.
Figure 5 - Percentage of participants reporting fever and cough, Canada, 2020-2021, weeks 2020-35 to 2020-40
Number of participants reporting in week 40: 10,171
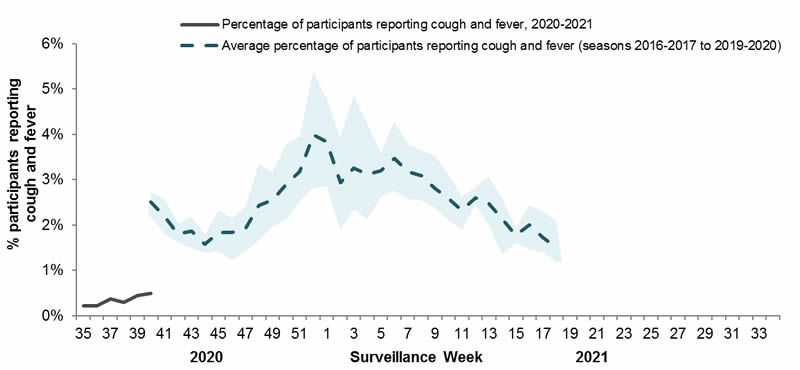
Figure 5 - Text equivalent
| Surveillance Week | 2020-2021 | Average | Min | Max |
|---|---|---|---|---|
| 35 | 0.22% | N/A | N/A | N/A |
| 36 | 0.21% | N/A | N/A | N/A |
| 37 | 0.38% | N/A | N/A | N/A |
| 38 | 0.29% | N/A | N/A | N/A |
| 39 | 0.45% | N/A | N/A | N/A |
| 40 | 0.49% | 2.51% | 2.18% | 2.71% |
| 41 | 0.00% | 2.18% | 1.81% | 2.57% |
| 42 | 0.00% | 1.80% | 1.61% | 2.03% |
| 43 | 0.00% | 1.87% | 1.49% | 2.18% |
| 44 | 0.00% | 1.57% | 1.39% | 1.78% |
| 45 | 0.00% | 1.83% | 1.42% | 2.32% |
| 46 | 0.00% | 1.83% | 1.22% | 2.15% |
| 47 | 0.00% | 1.93% | 1.44% | 2.39% |
| 48 | 0.00% | 2.43% | 1.67% | 3.35% |
| 49 | 0.00% | 2.56% | 1.97% | 3.16% |
| 50 | 0.00% | 2.91% | 2.12% | 3.79% |
| 51 | 0.00% | 3.18% | 2.53% | 3.95% |
| 52 | 0.00% | 3.98% | 2.81% | 5.38% |
| 1 | 0.00% | 3.84% | 2.85% | 4.76% |
| 2 | 0.00% | 2.94% | 1.90% | 3.93% |
| 3 | 0.00% | 3.25% | 2.35% | 4.84% |
| 4 | 0.00% | 3.12% | 2.13% | 4.23% |
| 5 | 0.00% | 3.19% | 2.62% | 3.59% |
| 6 | 0.00% | 3.47% | 2.76% | 4.28% |
| 7 | 0.00% | 3.18% | 2.58% | 3.79% |
| 8 | 0.00% | 3.09% | 2.54% | 3.65% |
| 9 | 0.00% | 2.81% | 2.38% | 3.53% |
| 10 | 0.00% | 2.58% | 2.12% | 3.11% |
| 11 | 0.00% | 2.33% | 1.89% | 2.63% |
| 12 | 0.00% | 2.60% | 2.46% | 2.82% |
| 13 | 0.00% | 2.48% | 1.99% | 3.06% |
| 14 | 0.00% | 2.13% | 1.35% | 2.58% |
| 15 | 0.00% | 1.78% | 1.60% | 1.93% |
| 16 | 0.00% | 2.00% | 1.47% | 2.44% |
| 17 | 0.00% | 1.73% | 1.40% | 2.31% |
| 18 | 0.00% | 1.50% | 1.19% | 2.09% |
| 19 | 0.00% | N/A | N/A | N/A |
| 20 | 0.00% | N/A | N/A | N/A |
| 21 | 0.00% | N/A | N/A | N/A |
| 22 | 0.00% | N/A | N/A | N/A |
| 23 | 0.00% | N/A | N/A | N/A |
| 24 | 0.00% | N/A | N/A | N/A |
| 25 | 0.00% | N/A | N/A | N/A |
| 26 | 0.00% | N/A | N/A | N/A |
| 27 | 0.00% | N/A | N/A | N/A |
| 28 | 0.00% | N/A | N/A | N/A |
| 29 | 0.00% | N/A | N/A | N/A |
| 30 | 0.00% | N/A | N/A | N/A |
| 31 | 0.00% | N/A | N/A | N/A |
| 32 | 0.00% | N/A | N/A | N/A |
| 33 | 0.00% | N/A | N/A | N/A |
| 34 | 0.00% | N/A | N/A | N/A |
Online Figure - Geographic distribution of FluWatchers participants reporting cough and fever, Canada, week 2020-40
Click on the map to access the link
Influenza Outbreak Surveillance
To date this season, 15 influenza-like-illness (ILI) outbreaks have been reported. All outbreaks were reported in weeks 39 and 40 and all were in schools and/or daycares. No influenza or ILI outbreaks have been reported in any other setting. Outbreaks of ILI in schools and daycares are identified based on whether greater than 10% absenteeism due to ILI has been reported in these settings. Although the number of ILI outbreaks in schools and daycares reported is higher compared to the same time period in the previous two seasons, this is not unexpected given changes to outbreak surveillance and the increased restrictions on attendance for children with symptoms of viral respiratory illness.
Outbreaks of ILI are not specific to any one respiratory pathogen and can be due influenza, or other respiratory viruses, including rhinovirus and even COVID-19. Rhinovirus commonly circulates during the fall, and can cause clusters of cases with respiratory illness which could be captured as ILI. For more information on the respiratory viruses currently circulating in Canada, please refer to the Respiratory Virus Detections in Canada Report.
Number of provinces and territories reporting in week 40Footnote 1: 13 out of 13
- Footnote 1
-
All Provinces and Territories (PTs) participate in FluWatch’s outbreak surveillance system. This outbreak system monitors influenza and ILI outbreaks in long-term care facilities, acute care facilities, schools and daycares, remote and/or isolated communities, and facilities categorized as ‘other’. Not all reporting PTs report outbreaks in all these settings. All PTs report laboratory confirmed outbreaks in LTCF. Four PTs (NB, NL, NS and YK) report ILI outbreaks in schools and/or daycares.
Severe Outcomes Influenza Surveillance
Provincial/Territorial Influenza Hospitalizations and Deaths
In weeks 39 to 40, no influenza-associated hospitalizations were reported by participating provinces and territoriesFootnote 1.
Number of provinces and territories reporting in week 40: 9 out of 9
- Footnote 1
-
Influenza-associated hospitalizations are reported by Alberta, Manitoba, New Brunswick, Newfoundland and Labrador, Northwest Territories, Nova Scotia, Prince Edward Island and Yukon. Only hospitalizations that require intensive medical care are reported by Saskatchewan.
Pediatric Influenza Hospitalizations and Deaths
In weeks 39 to 40 no influenza-associated hospitalizations were reported. To date this season, less than five pediatric (≤16 years of age) hospitalizations with influenza were reported by the Immunization Monitoring Program Active (IMPACT) network.
Adult Influenza Hospitalizations and Deaths
Surveillance of laboratory-confirmed influenza-associated adult (≥16 years of age) hospitalizations by the Canadian Immunization Research Network (CIRN) Serious Outcomes Surveillance (SOS) network has not yet begun for the 2020-21 season.
Influenza Strain Characterizations
The National Microbiology Laboratory has not yet reported influenza strain characterization results for influenza viruses collected during the 2020-21 season.
Antiviral Resistance
The National Microbiology Laboratory has not yet reported antiviral resistance results for influenza viruses collected during the 2020-21 season.
Vaccine Monitoring
Vaccine monitoring refers to activities related to the monitoring of influenza vaccine coverage and effectiveness.
Vaccine Coverage
Influenza vaccine coverage estimates for the 2020-21 season are anticipated to be available in February or March 2021.
Vaccine Effectiveness
Influenza vaccine effectiveness estimates are typically available in February or March of each year, however this may be delayed for the 2020-21 season if low influenza circulation continues.