
FluWatch report: November 29, 2020 to December 5, 2020 (week 49)
Download the alternative format
(PDF format, 562 kb, 6 pages)
Organization: Public Health Agency of Canada
Date published: 2020-12-11
Related Topics
Overall Summary
- All indicators of influenza activity remain exceptionally low for this time of year, despite continued monitoring for influenza across Canada.
- To date, there is no evidence of community circulation of influenza; however, influenza testing continues at elevated levels. Seven laboratory detections of influenza were reported in week 49.
- Two influenza-like-illness (ILI) outbreaks were reported in schools and daycares. No laboratory-confirmed outbreaks of influenza have been reported to date this season.
- 12,228 participants reported to FluWatchers and 21 (0.17%) participants reported cough and fever, similar to the previous week.
Provide valuable information to track flu and COVID-19 across Canada:
Sign up to become a FluWatcher! - Influenza surveillance indicators may be influenced by the COVID-19 pandemic, including changes in healthcare-seeking behaviour, impacts of public health measures and influenza testing practices. Current data should be interpreted with consideration to this context. See the COVID-19 Epidemiology update for information on COVID-19 cases in Canada.
On this page
- Influenza/ILI Activity (geographic spread)
- Laboratory Confirmed Influenza Detections
- Syndromic/Influenza-like Illness Surveillance
- FluWatchers
- Influenza Outbreak Surveillance
- Severe Outcomes Influenza Surveillance
- Influenza Strain Characterizations
- Antiviral Resistance
- Vaccine Monitoring
- Provincial and International Influenza Reports
Influenza/Influenza-like Illness (ILI) Activity (geographic spread)
During week 49, one region reported sporadic influenza activity. Other surveillance regions this week reported no influenza/ILI activity (Figure 1).
Influenza/ILI activity is lower at this point in the season compared to the previous four seasons; historically, between 34-42 regions reported activity in week 49.
Figure 1 - Map of influenza/ILI activity by province and territory, Canada, week 2020-49
Number of Regions Reporting in Week 49: 48 out of 53
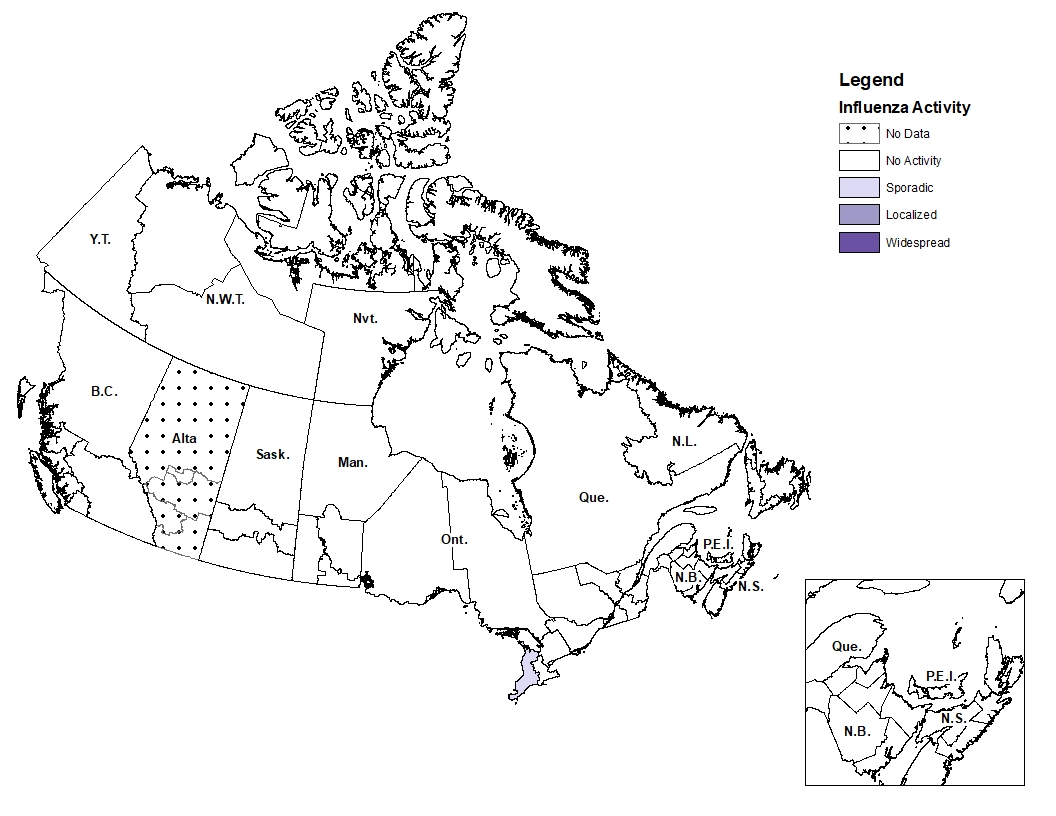
Figure 1 - Text equivalent
| Province | Influenza Surveillance Region | Activity Level |
|---|---|---|
| N.L. | Eastern | No Activity |
| N.L. | Labrador-Grenfell | No Activity |
| N.L. | Central | No Activity |
| N.L. | Western | No Activity |
| P.E.I. | Prince Edward Island | No Activity |
| N.S. | Zone 1 - Western | No Activity |
| N.S. | Zone 2 - Northern | No Activity |
| N.S. | Zone 3 - Eastern | No Activity |
| N.S. | Zone 4 - Central | No Activity |
| N.B. | Region 1 | No Activity |
| N.B. | Region 2 | No Activity |
| N.B. | Region 3 | No Activity |
| N.B. | Region 4 | No Activity |
| N.B. | Region 5 | No Activity |
| N.B. | Region 6 | No Activity |
| N.B. | Region 7 | No Activity |
| Que. | Nord-est | No Activity |
| Que. | Québec et Chaudieres-Appalaches | No Activity |
| Que. | Centre-du-Québec | No Activity |
| Que. | Montréal et Laval | No Activity |
| Que. | Ouest-du-Québec | No Activity |
| Que. | Montérégie | No Activity |
| Ont. | Central East | No Activity |
| Ont. | Central West | No Activity |
| Ont. | Eastern | No Activity |
| Ont. | North East | No Activity |
| Ont. | North West | No Activity |
| Ont. | South West | Sporadic |
| Ont. | Toronto | No Activity |
| Man. | Northern Regional | No Activity |
| Man. | Prairie Mountain | No Activity |
| Man. | Interlake-Eastern | No Activity |
| Man. | Winnipeg | No Activity |
| Man. | Southern Health | No Activity |
| Sask. | North | No Activity |
| Sask. | Central | No Activity |
| Sask. | South | No Activity |
| Alta. | North Zone | No Data |
| Alta. | Edmonton | No Data |
| Alta. | Central Zone | No Data |
| Alta. | Calgary | No Data |
| Alta. | South Zone | No Data |
| B.C. | Interior | No Activity |
| B.C. | Fraser | No Activity |
| B.C. | Vancouver Coastal | No Activity |
| B.C. | Vancouver Island | No Activity |
| B.C. | Northern | No Activity |
| Y.T. | Yukon | No Activity |
| N.W.T. | North | No Activity |
| N.W.T. | South | No Activity |
| Nvt. | Qikiqtaaluk | No Activity |
| Nvt. | Kivalliq | No Activity |
| Nvt. | Kitimeot | No Activity |
Laboratory-Confirmed Influenza Detections
In week 49, seven laboratory detections of influenza were reported.
To date this season, 41 influenza detections have been reported (Figure 2), which is significantly lower than the past six seasons where an average of 3,055 influenza detections were reported between weeks 35-49. All provinces and territories are closely monitoring indicators of influenza activity this season. Data in the FluWatch report represent surveillance data available at the time of writing, and may change as updates are received.
Twenty seven of the influenza detections reported to date this season are known to be associated with recent live attenuated influenza vaccine (LAIV) receipt and do not represent community circulation of seasonal influenza viruses. LAIV strains are attenuated but can be recovered by nasal swab in children and adults following vaccination with that product (i.e., "shedding"). For more information, please refer to the Canadian Immunization Guide Chapter on Influenza and Statement on Seasonal Influenza Vaccine for 2020–2021 (Section IV.2).
The percentage of laboratory tests positive for influenza remains at exceptionally low levels, despite elevated levels of testing. In week 49, 16,396 tests for influenza were performed at reporting laboratories, which is 2.6 times the average for this week over the past six seasons (Figure 3a). The percentage of tests positive for influenza in week 49 was 0.04%, compared to 13.0% during the past six seasons (Figure 3b).
In Canada, at the national level, the influenza season typically starts around week 47 (mid-November) and is defined when at least 5% of influenza tests are positive and a minimum of 15 positive tests are observed nationally. Over the past 6 seasons, the influenza season has begun as early as week 43 (mid-October) and as late as week 1 (early January).
Testing for influenza and other respiratory viruses has been influenced by the current COVID-19 pandemic. Changes in laboratory testing practices may affect the comparability of data to previous weeks or previous seasons.
For more detailed weekly and cumulative influenza data, see the text descriptions for Figure 2 or the Respiratory Virus Detections in Canada Report.
Figure 2 - Number of positive influenza tests and percentage of tests positive, by type, subtype and report week, Canada, 2020-35 to 2020-49
Number of laboratories reporting in week 49: 31 out of 35
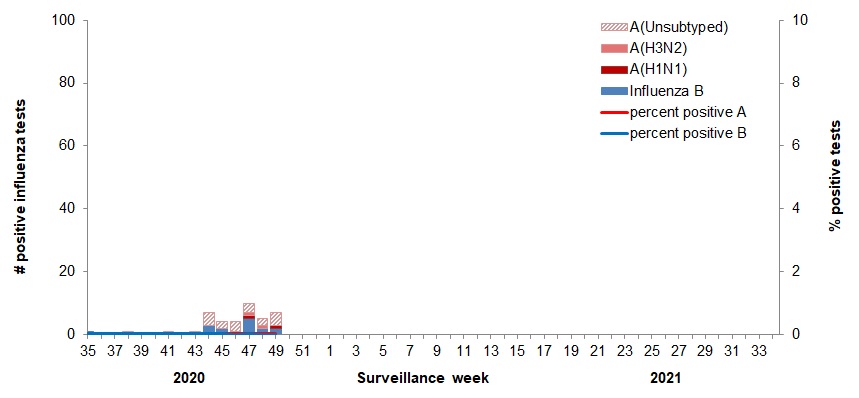
The shaded area indicates weeks where the positivity rate was at least 5% and a minimum of 15 positive tests were observed, signalling the period of seasonal influenza activity.
Figure 2 - Text equivalent
| Surveillance Week | A(Unsubtyped) | A(H3N2) | A(H1N1) | Influenza B | Percent Positive A | Percent Positive B |
|---|---|---|---|---|---|---|
| 35 | 0 | 0 | 0 | 1 | 0.0 | 0.0 |
| 36 | 0 | 0 | 0 | 0 | 0.0 | 0.0 |
| 37 | 0 | 0 | 0 | 0 | 0.0 | 0.0 |
| 38 | 1 | 0 | 0 | 0 | 0.0 | 0.0 |
| 39 | 0 | 0 | 0 | 0 | 0.0 | 0.0 |
| 40 | 0 | 0 | 0 | 0 | 0.0 | 0.0 |
| 41 | 1 | 0 | 0 | 0 | 0.0 | 0.0 |
| 42 | 0 | 0 | 0 | 0 | 0.0 | 0.0 |
| 43 | 1 | 0 | 0 | 0 | 0.0 | 0.0 |
| 44 | 4 | 0 | 0 | 3 | 0.0 | 0.0 |
| 45 | 2 | 0 | 0 | 2 | 0.0 | 0.0 |
| 46 | 3 | 0 | 0 | 1 | 0.0 | 0.0 |
| 47 | 3 | 1 | 1 | 5 | 0.0 | 0.0 |
| 48 | 2 | 1 | 0 | 2 | 0.0 | 0.0 |
| 49 | 4 | 0 | 1 | 2 | 0.0 | 0.0 |
Figure 3: Number of influenza tests (a) and percentage of tests positive (b) in Canada by week, weeks 2020-35 to 2020-49 as compared to previous seasons
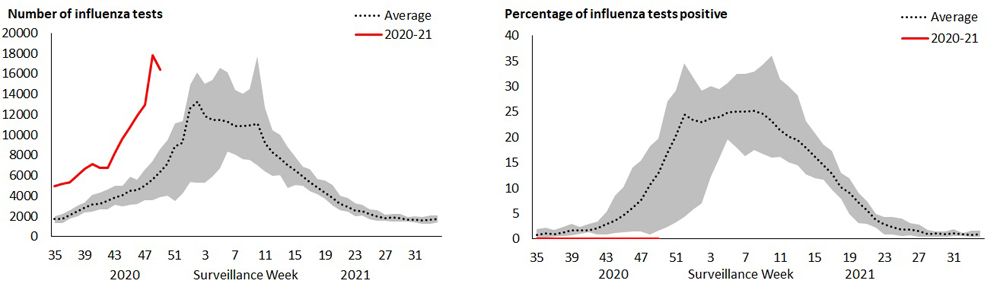
The shaded area represents the maximum and minimum number of influenza tests (a) or percentage of tests positive (b) reported by week from seasons 2014-2015 to 2019-2020.
Figure 3 - Text equivalent
| Surveillance Week | Number of Tests, 2020-21 | Maximum Number of Tests | Minimum Number of Tests | Average Number of Tests |
|---|---|---|---|---|
| 35 | 4962 | 1979 | 1311 | 1705 |
| 36 | 5176 | 2208 | 1323 | 1707 |
| 37 | 5308 | 2631 | 1778 | 2135 |
| 38 | 5996 | 3039 | 1987 | 2502 |
| 39 | 6670 | 3356 | 2365 | 2859 |
| 40 | 7093 | 4078 | 2443 | 3134 |
| 41 | 6783 | 4339 | 2673 | 3240 |
| 42 | 6730 | 4649 | 2648 | 3526 |
| 43 | 8188 | 4996 | 3084 | 3862 |
| 44 | 9585 | 4966 | 2994 | 4020 |
| 45 | 10706 | 5912 | 3117 | 4508 |
| 46 | 11918 | 5589 | 3176 | 4564 |
| 47 | 12943 | 6541 | 3587 | 5018 |
| 48 | 11956 | 7416 | 3569 | 5645 |
| 49 | 16396 | 8559 | 3836 | 6377 |
| 50 | #N/A | 9464 | 4017 | 7155 |
| 51 | #N/A | 11142 | 3487 | 8822 |
| 52 | #N/A | 11338 | 4272 | 9184 |
| 1 | #N/A | 14932 | 5371 | 12552 |
| 2 | #N/A | 16104 | 5315 | 13289 |
| 3 | #N/A | 15001 | 5270 | 11820 |
| 4 | #N/A | 15414 | 5873 | 11441 |
| 5 | #N/A | 16595 | 6739 | 11456 |
| 6 | #N/A | 16121 | 8324 | 11339 |
| 7 | #N/A | 14443 | 8074 | 10842 |
| 8 | #N/A | 14024 | 7606 | 10865 |
| 9 | #N/A | 14520 | 7507 | 10956 |
| 10 | #N/A | 17681 | 7005 | 11084 |
| 11 | #N/A | 12714 | 6435 | 9175 |
| 12 | #N/A | 10431 | 5976 | 8238 |
| 13 | #N/A | 9989 | 6063 | 7699 |
| 14 | #N/A | 8830 | 4773 | 7046 |
| 15 | #N/A | 7836 | 5090 | 6527 |
| 16 | #N/A | 6826 | 5000 | 5890 |
| 17 | #N/A | 6603 | 4440 | 5305 |
| 18 | #N/A | 5640 | 4143 | 4780 |
| 19 | #N/A | 5480 | 3680 | 4311 |
| 20 | #N/A | 5097 | 3046 | 3862 |
| 21 | #N/A | 4001 | 2577 | 3197 |
| 22 | #N/A | 3790 | 2424 | 2944 |
| 23 | #N/A | 3257 | 1969 | 2591 |
| 24 | #N/A | 3120 | 2034 | 2449 |
| 25 | #N/A | 2659 | 1731 | 2148 |
| 26 | #N/A | 2600 | 1573 | 1988 |
| 27 | #N/A | 2163 | 1554 | 1833 |
| 28 | #N/A | 2223 | 1451 | 1857 |
| 29 | #N/A | 2256 | 1436 | 1796 |
| 30 | #N/A | 1950 | 1463 | 1664 |
| 31 | #N/A | 2022 | 1386 | 1671 |
| 32 | #N/A | 1928 | 1269 | 1574 |
| 33 | #N/A | 2089 | 1251 | 1671 |
| 34 | #N/A | 2098 | 1374 | 1698 |
| Surveillance Week | Percentage of tests positive, 2020-21 | Maximum Percentage of Tests Positive | Minimum Percentage of Tests Positive | Average Percentage of Tests Positive |
|---|---|---|---|---|
| 35 | 0.02 | 1.87 | 0.11 | 0.82 |
| 36 | 0.00 | 2.28 | 0.30 | 1.13 |
| 37 | 0.00 | 1.78 | 0.40 | 0.99 |
| 38 | 0.02 | 2.35 | 0.55 | 1.30 |
| 39 | 0.00 | 2.95 | 0.67 | 1.71 |
| 40 | 0.00 | 2.33 | 1.08 | 1.70 |
| 41 | 0.01 | 3.02 | 1.32 | 1.72 |
| 42 | 0.00 | 3.40 | 0.87 | 2.18 |
| 43 | 0.01 | 5.32 | 0.84 | 2.83 |
| 44 | 0.07 | 8.55 | 1.20 | 3.70 |
| 45 | 0.04 | 10.10 | 1.39 | 4.63 |
| 46 | 0.03 | 14.11 | 1.51 | 6.05 |
| 47 | 0.08 | 15.36 | 1.44 | 7.71 |
| 48 | 0.03 | 18.20 | 0.84 | 10.61 |
| 49 | 0.04 | 19.71 | 1.64 | 13.01 |
| 50 | #N/A | 27.02 | 2.36 | 16.82 |
| 51 | #N/A | 29.09 | 3.30 | 20.11 |
| 52 | #N/A | 34.54 | 4.28 | 24.48 |
| 1 | #N/A | 31.66 | 5.85 | 23.41 |
| 2 | #N/A | 29.10 | 7.06 | 23.01 |
| 3 | #N/A | 30.07 | 12.24 | 23.63 |
| 4 | #N/A | 29.45 | 15.89 | 23.96 |
| 5 | #N/A | 30.62 | 19.60 | 24.90 |
| 6 | #N/A | 32.39 | 17.89 | 25.00 |
| 7 | #N/A | 32.51 | 16.28 | 25.05 |
| 8 | #N/A | 32.87 | 17.45 | 25.14 |
| 9 | #N/A | 34.28 | 16.80 | 24.59 |
| 10 | #N/A | 35.99 | 16.05 | 23.22 |
| 11 | #N/A | 31.41 | 16.19 | 21.41 |
| 12 | #N/A | 30.03 | 15.03 | 20.10 |
| 13 | #N/A | 28.25 | 14.50 | 19.56 |
| 14 | #N/A | 23.16 | 12.66 | 17.86 |
| 15 | #N/A | 20.73 | 11.95 | 16.27 |
| 16 | #N/A | 18.52 | 11.64 | 14.48 |
| 17 | #N/A | 17.30 | 9.76 | 12.83 |
| 18 | #N/A | 13.02 | 7.88 | 10.26 |
| 19 | #N/A | 11.95 | 4.96 | 8.98 |
| 20 | #N/A | 9.13 | 3.19 | 7.22 |
| 21 | #N/A | 7.45 | 2.97 | 5.60 |
| 22 | #N/A | 4.96 | 2.19 | 3.86 |
| 23 | #N/A | 4.39 | 0.87 | 2.86 |
| 24 | #N/A | 4.36 | 0.81 | 2.25 |
| 25 | #N/A | 3.95 | 0.63 | 1.88 |
| 26 | #N/A | 3.08 | 0.69 | 1.81 |
| 27 | #N/A | 2.83 | 0.42 | 1.48 |
| 28 | #N/A | 1.84 | 0.41 | 0.91 |
| 29 | #N/A | 1.55 | 0.47 | 1.09 |
| 30 | #N/A | 1.46 | 0.46 | 0.90 |
| 31 | #N/A | 1.93 | 0.58 | 1.11 |
| 32 | #N/A | 1.19 | 0.52 | 0.92 |
| 33 | #N/A | 1.69 | 0.40 | 0.85 |
| 34 | #N/A | 1.57 | 0.42 | 0.92 |
| 47 | 0.03 | 15.36 | 1.44 | 7.71 |
Syndromic / Influenza-like Illness Surveillance
Healthcare Professionals Sentinel Syndromic Surveillance
In week 49, 0.6% of visits to healthcare professionals were due to influenza-like illness (ILI), which is an increase compared to previous weeks, but remains lower than average compared to recent seasons (Figure 4).
This trend should be interpreted with caution as there have been changes in healthcare seeking behavior of individuals and a smaller number of sentinels reporting in recent weeks compared to previous seasons.
Figure 4 - Percentage of visits for ILI reported by sentinels by report week, Canada, weeks 2020-35 to 2020-49
Number of Sentinels Reporting in Week 49: 58
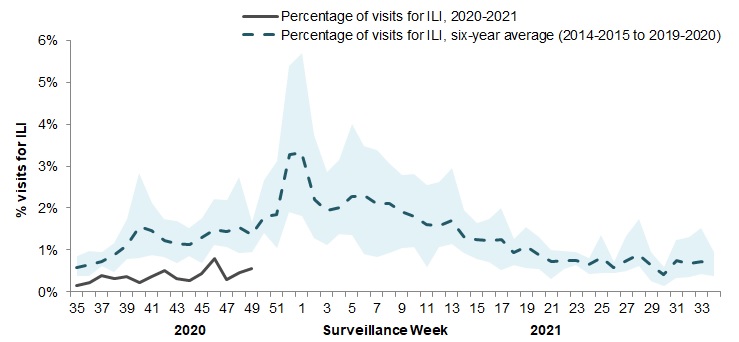
The shaded area represents the maximum and minimum percentage of visits for ILI reported by week from seasons 2014-2015 to 2019-2020
Figure 4 - Text equivalent
| Surveillance Week | 2020-2021 | Average | Min | Max |
|---|---|---|---|---|
| 35 | 0.1% | 0.6% | 0.4% | 0.9% |
| 36 | 0.2% | 0.7% | 0.4% | 1.0% |
| 37 | 0.4% | 0.7% | 0.6% | 1.0% |
| 38 | 0.3% | 0.9% | 0.5% | 1.2% |
| 39 | 0.4% | 1.1% | 0.8% | 1.7% |
| 40 | 0.2% | 1.6% | 0.8% | 2.8% |
| 41 | 0.4% | 1.5% | 0.9% | 2.1% |
| 42 | 0.5% | 1.2% | 0.8% | 1.7% |
| 43 | 0.3% | 1.1% | 0.7% | 1.7% |
| 44 | 0.3% | 1.1% | 0.9% | 1.5% |
| 45 | 0.4% | 1.3% | 0.7% | 1.8% |
| 46 | 0.8% | 1.5% | 1.1% | 2.2% |
| 47 | 0.3% | 1.4% | 1.1% | 2.2% |
| 48 | 0.5% | 1.5% | 0.9% | 2.8% |
| 49 | 0.5% | 1.4% | 1.0% | 1.7% |
| 50 | #N/A | 1.8% | 1.4% | 2.7% |
| 51 | #N/A | 1.8% | 1.0% | 3.1% |
| 52 | #N/A | 3.3% | 1.9% | 5.4% |
| 53 | #N/A | 3.3% | 1.9% | 5.5% |
| 1 | #N/A | 3.3% | 1.8% | 5.7% |
| 2 | #N/A | 2.2% | 1.3% | 3.7% |
| 3 | #N/A | 1.9% | 1.1% | 2.9% |
| 4 | #N/A | 2.0% | 1.4% | 3.1% |
| 5 | #N/A | 2.3% | 1.4% | 4.0% |
| 6 | #N/A | 2.3% | 0.9% | 3.5% |
| 7 | #N/A | 2.1% | 0.8% | 3.4% |
| 8 | #N/A | 2.1% | 0.9% | 3.1% |
| 9 | #N/A | 1.9% | 1.0% | 2.8% |
| 10 | #N/A | 1.8% | 1.1% | 2.8% |
| 11 | #N/A | 1.6% | 0.6% | 2.6% |
| 12 | #N/A | 1.6% | 1.1% | 2.6% |
| 13 | #N/A | 1.7% | 1.1% | 3.0% |
| 14 | #N/A | 1.3% | 0.9% | 1.9% |
| 15 | #N/A | 1.2% | 0.8% | 1.7% |
| 16 | #N/A | 1.2% | 0.7% | 1.7% |
| 17 | #N/A | 1.3% | 0.5% | 2.0% |
| 18 | #N/A | 0.9% | 0.6% | 1.3% |
| 19 | #N/A | 1.1% | 0.6% | 1.5% |
| 20 | #N/A | 0.9% | 0.5% | 1.3% |
| 21 | #N/A | 0.7% | 0.3% | 1.0% |
| 22 | #N/A | 0.8% | 0.6% | 1.0% |
| 23 | #N/A | 0.7% | 0.6% | 1.0% |
| 24 | #N/A | 0.6% | 0.4% | 0.8% |
| 25 | #N/A | 0.8% | 0.5% | 1.4% |
| 26 | #N/A | 0.6% | 0.5% | 0.7% |
| 27 | #N/A | 0.7% | 0.5% | 1.3% |
| 28 | #N/A | 0.9% | 0.6% | 1.7% |
| 29 | #N/A | 0.6% | 0.2% | 0.9% |
| 30 | #N/A | 0.4% | 0.2% | 0.6% |
| 31 | #N/A | 0.8% | 0.3% | 1.2% |
| 32 | #N/A | 0.7% | 0.4% | 1.3% |
| 33 | #N/A | 0.7% | 0.4% | 1.5% |
| 34 | #N/A | 0.6% | 0.4% | 0.9% |
FluWatchers
In week 49, 12,228 participants reported to FluWatchers. A total of 21 participants (0.17%) reported symptoms of cough and fever (Figure 5). The percentage of participants reporting cough and fever is at very low levels and may be a direct effect of individual and public health measures enacted to reduce the spread of COVID-19. FluWatchers reporting is not impacted by changes in health services or health seeking behaviours.
If you are interested in becoming a FluWatcher, sign up today.
Figure 5 - Percentage of participants reporting fever and cough, Canada, weeks 2020-35 to 2020-49
Number of Participants Reporting in Week 49: 12,228
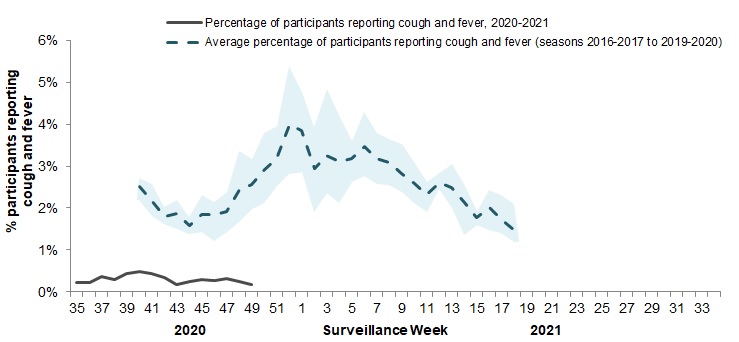
The shaded area represents the maximum and minimum percentage of percentage of participants reporting cough and fever by week, from seasons 2014-2015 to 2019-2020
Figure 5 - Text equivalent
| Surveillance Week | 2020-2021 | Average | Min | Max |
|---|---|---|---|---|
| 35 | 0.22% | N/A | N/A | N/A |
| 36 | 0.21% | N/A | N/A | N/A |
| 37 | 0.38% | N/A | N/A | N/A |
| 38 | 0.29% | N/A | N/A | N/A |
| 39 | 0.45% | N/A | N/A | N/A |
| 40 | 0.49% | 2.51% | 2.18% | 2.71% |
| 41 | 0.44% | 2.18% | 1.81% | 2.57% |
| 42 | 0.33% | 1.80% | 1.61% | 2.03% |
| 43 | 0.17% | 1.87% | 1.49% | 2.18% |
| 44 | 0.26% | 1.57% | 1.39% | 1.78% |
| 45 | 0.29% | 1.83% | 1.42% | 2.32% |
| 46 | 0.28% | 1.83% | 1.22% | 2.15% |
| 47 | 0.31% | 1.93% | 1.44% | 2.39% |
| 48 | 0.26% | 2.43% | 1.67% | 3.35% |
| 49 | 0.17% | 2.56% | 1.97% | 3.16% |
| 50 | 0.00% | 2.91% | 2.12% | 3.79% |
| 51 | 0.00% | 3.18% | 2.53% | 3.95% |
| 52 | 0.00% | 3.98% | 2.81% | 5.38% |
| 1 | 0.00% | 3.84% | 2.85% | 4.76% |
| 2 | 0.00% | 2.94% | 1.90% | 3.93% |
| 3 | 0.00% | 3.25% | 2.35% | 4.84% |
| 4 | 0.00% | 3.12% | 2.13% | 4.23% |
| 5 | 0.00% | 3.19% | 2.62% | 3.59% |
| 6 | 0.00% | 3.47% | 2.76% | 4.28% |
| 7 | 0.00% | 3.18% | 2.58% | 3.79% |
| 8 | 0.00% | 3.09% | 2.54% | 3.65% |
| 9 | 0.00% | 2.81% | 2.38% | 3.53% |
| 10 | 0.00% | 2.58% | 2.12% | 3.11% |
| 11 | 0.00% | 2.33% | 1.89% | 2.63% |
| 12 | 0.00% | 2.60% | 2.46% | 2.82% |
| 13 | 0.00% | 2.48% | 1.99% | 3.06% |
| 14 | 0.00% | 2.13% | 1.35% | 2.58% |
| 15 | 0.00% | 1.78% | 1.60% | 1.93% |
| 16 | 0.00% | 2.00% | 1.47% | 2.44% |
| 17 | 0.00% | 1.73% | 1.40% | 2.31% |
| 18 | 0.00% | 1.50% | 1.19% | 2.09% |
| 19 | 0.00% | N/A | N/A | N/A |
| 20 | 0.00% | N/A | N/A | N/A |
| 21 | 0.00% | N/A | N/A | N/A |
| 22 | 0.00% | N/A | N/A | N/A |
| 23 | 0.00% | N/A | N/A | N/A |
| 24 | 0.00% | N/A | N/A | N/A |
| 25 | 0.00% | N/A | N/A | N/A |
| 26 | 0.00% | N/A | N/A | N/A |
| 27 | 0.00% | N/A | N/A | N/A |
| 28 | 0.00% | N/A | N/A | N/A |
| 29 | 0.00% | N/A | N/A | N/A |
| 30 | 0.00% | N/A | N/A | N/A |
| 31 | 0.00% | N/A | N/A | N/A |
| 32 | 0.00% | N/A | N/A | N/A |
| 33 | 0.00% | N/A | N/A | N/A |
| 34 | 0.00% | N/A | N/A | N/A |
Click on the map to access the link
Influenza Outbreak Surveillance
In week 49, two influenza-like-illness (ILI) outbreaks were reported in schools and/or daycares. No other influenza or ILI outbreaks were reported in any other settings.
To date this season, 86 influenza-like-illness (ILI) outbreaks in schools and/or daycares, and no other influenza or ILI outbreaks have been reported in any other settings.
Outbreaks of ILI in schools and daycares are identified when greater than 10% absenteeism due to ILI are reported in these settings. The number of ILI outbreaks in schools and daycares reported is higher compared to the same time period in the previous two seasons. This is not unexpected given changes to outbreak surveillance, specifically increased vigilance in schools to monitor and report absenteeism due to ILI, and the increased restrictions on attendance for children with symptoms of viral respiratory illness.
Outbreaks of ILI are not specific to any one respiratory pathogen and can be due influenza or other respiratory viruses, including rhinovirus and SARS-CoV-2, the virus that causesCOVID-19. Rhinovirus commonly circulates during the fall and can cause clusters of cases with respiratory illness that could be captured as ILI. For more information on the respiratory viruses currently circulating in Canada, please refer to the Respiratory Virus Detections in Canada Report.
Number of provinces and territories reporting in week 49Footnote 1: 12 out of 13
- Footnote 1
-
All Provinces and Territories (PTs) participate in FluWatch's outbreak surveillance system. This outbreak system monitors influenza and ILI outbreaks in long-term care facilities, acute care facilities, schools and daycares, remote and/or isolated communities, and facilities categorized as 'other'. Not all reporting PTs report outbreaks in all these settings. All PTs report laboratory confirmed outbreaks in LTCF. Four PTs (NB, NL, NS and YK) report ILI outbreaks in schools and/or daycares.
Severe Outcomes Influenza Surveillance
Provincial/Territorial Influenza Hospitalizations and Deaths
In week 49, no influenza-associated hospitalizations were reported by participating provinces and territoriesFootnote 2. To date no influenza-associated hospitalizations were reported by participating provinces and territories.
Number of provinces and territories reporting in week 49: 8 out of 9
- Footnote 2
-
Influenza-associated hospitalizations are reported by Alberta, Manitoba, New Brunswick, Newfoundland and Labrador, Northwest Territories, Nova Scotia, Prince Edward Island and Yukon. Only hospitalizations that require intensive medical care are reported by Saskatchewan.
Pediatric Influenza Hospitalizations and Deaths
In week 49, no influenza-associated hospitalizations were reported. To date this season, less than five pediatric (≤16 years of age) hospitalizations with influenza have been reported by the Immunization Monitoring Program Active (IMPACT) network.
Adult Influenza Hospitalizations and Deaths
Surveillance of laboratory-confirmed influenza-associated adult (≥16 years of age) hospitalizations by the Canadian Immunization Research Network (CIRN) Serious Outcomes Surveillance (SOS) network has not yet begun for the 2020-21 season.
Influenza Strain Characterizations
Due to the very low influenza circulation to date this season, the National Microbiology Laboratory has not yet received influenza viruses collected during the 2020-21 season for strain characterization.
Antiviral Resistance
Due to the very low influenza circulation to date this season, the National Microbiology Laboratory has not yet received influenza viruses collected during the 2020-21 season for antiviral resistance testing.
Vaccine Monitoring
Vaccine monitoring refers to activities related to the monitoring of influenza vaccine coverage and effectiveness.
Vaccine Coverage
Influenza vaccine coverage estimates for the 2020-21 season are anticipated to be available in February or March 2021.
Vaccine Effectiveness
Influenza vaccine effectiveness estimates are typically available in February or March of each year; this may be delayed for the 2020-21 season if low influenza circulation continues.
Notes
The data in the FluWatch report represent surveillance data available at the time of writing. All data are preliminary and may change as more reports are received.
To learn more about the FluWatch program, see the Overview of influenza monitoring in Canada page. For more information on the flu, see our Flu (influenza) web page.