
FluWatch report: August 23 to September 19, 2020 (weeks 35-38)
Download the alternative format
(PDF format, 562 kb, 6 pages)
Organization: Public Health Agency of Canada
Date published: 2020-09-25
Related Topics
Overall Summary
- In weeks 35 to 38, exceptionally low levels of influenza activity continued to be reported across Canada.
- During weeks 35 to 38, the percentage of tests positive for influenza (0.05%) remained well below average compared to the past six seasons. The proportion of primary care visits for ILI continued to be lower than average; no outbreaks and no influenza-related hospitalizations were reported.
- Many influenza surveillance indicators may be influenced by the COVID-19 pandemic, including changes in healthcare-seeking behaviour, impacts of public health measures (e.g. social distancing) and influenza testing capacity. Current data should be interpreted with consideration for this context. See the COVID-19 Epidemiology update for information on COVID-19 cases in Canada.
- This is the first FluWatch report of the 2020-2021 surveillance season. The next report will be published on October 9, 2020. Weekly reporting of laboratory detections of respiratory viruses will continue via our Respiratory Virus Detections Surveillance System.
On this page
- Influenza/ILI Activity (geographic spread)
- Laboratory Confirmed Influenza Detections
- Syndromic/Influenza-like Illness Surveillance
- FluWatchers
- Influenza Outbreak Surveillance
- Severe Outcomes Influenza Surveillance
- Influenza Strain Characterizations
- Antiviral Resistance
- Vaccine Monitoring
- Provincial and International Influenza Reports
Influenza/Influenza-like Illness (ILI) Activity (geographic spread)
During week 38, influenza/ ILI activity was reported in one region in Nunavut (Figure 1).
Figure 1 - Map of influenza/ILI activity by province and territory, Canada, week 2020-38
Number of Regions Reporting in week 38: 40 out of 53
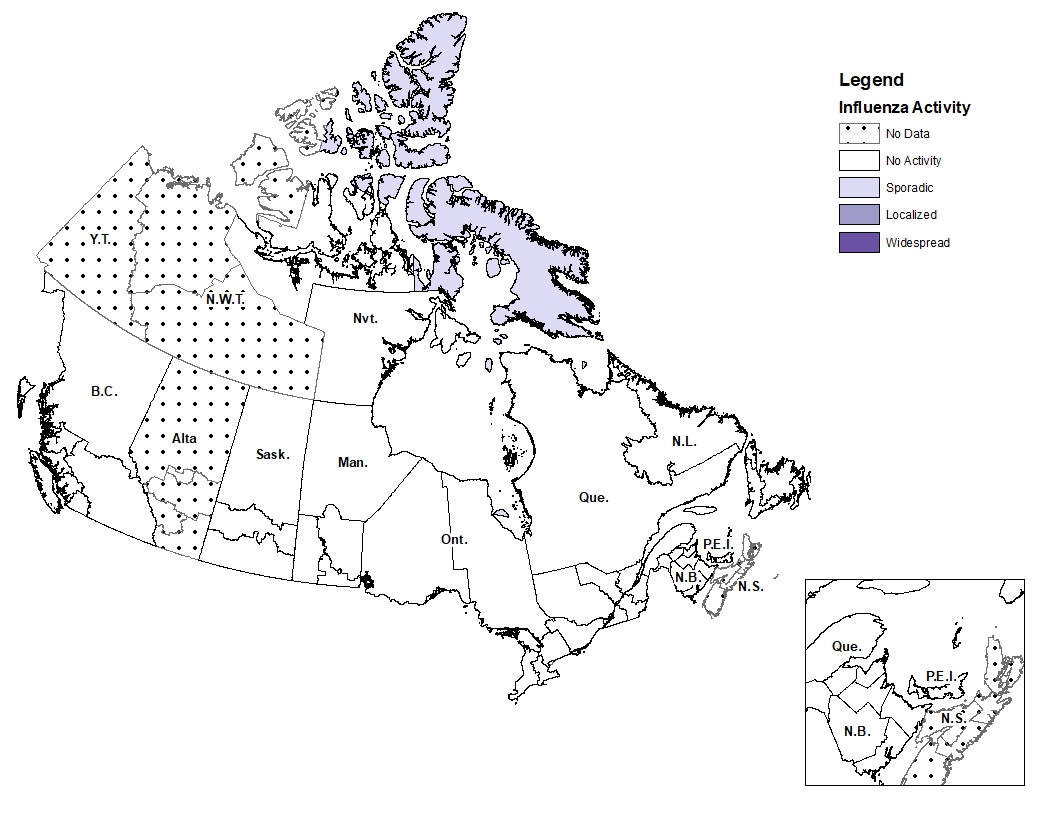
Figure 1 - Text equivalent
| Province | Influenza Surveillance Region | Activity Level |
|---|---|---|
| N.L. | Eastern | No Activity |
| N.L. | Labrador-Grenfell | No Activity |
| N.L. | Central | No Activity |
| N.L. | Western | No Activity |
| P.E.I. | Prince Edward Island | No Activity |
| N.S. | Zone 1 - Western | No Data |
| N.S. | Zone 2 - Northern | No Data |
| N.S. | Zone 3 - Eastern | No Data |
| N.S. | Zone 4 - Central | No Data |
| N.B. | Region 1 | No Activity |
| N.B. | Region 2 | No Activity |
| N.B. | Region 3 | No Activity |
| N.B. | Region 4 | No Activity |
| N.B. | Region 5 | No Activity |
| N.B. | Region 6 | No Activity |
| N.B. | Region 7 | No Activity |
| Que. | Nord-est | No Activity |
| Que. | Québec et Chaudieres-Appalaches | No Activity |
| Que. | Centre-du-Québec | No Activity |
| Que. | Montréal et Laval | No Activity |
| Que. | Ouest-du-Québec | No Activity |
| Que. | Montérégie | No Activity |
| Ont. | Central East | No Activity |
| Ont. | Central West | No Activity |
| Ont. | Eastern | No Activity |
| Ont. | North East | No Activity |
| Ont. | North West | No Activity |
| Ont. | South West | No Activity |
| Ont. | Toronto | No Data |
| Man. | Northern Regional | No Activity |
| Man. | Prairie Mountain | No Activity |
| Man. | Interlake-Eastern | No Activity |
| Man. | Winnipeg | No Activity |
| Man. | Southern Health | No Activity |
| Sask. | North | No Activity |
| Sask. | Central | No Activity |
| Sask. | South | No Activity |
| Alta. | North Zone | No Data |
| Alta. | Edmonton | No Data |
| Alta. | Central Zone | No Data |
| Alta. | Calgary | No Data |
| Alta. | South Zone | No Data |
| B.C. | Interior | No Activity |
| B.C. | Fraser | No Activity |
| B.C. | Vancouver Coastal | No Activity |
| B.C. | Vancouver Island | No Activity |
| B.C. | Northern | No Activity |
| Y.T. | Yukon | No Data |
| N.W.T. | North | No Data |
| N.W.T. | South | No Data |
| Nvt. | Qikiqtaaluk | Sporadic |
| Nvt. | Kivalliq | No Activity |
| Nvt. | Kitimeot | No Activity |
Laboratory-Confirmed Influenza Detections
In weeks 35 to 38, 11 laboratory detections of influenza were reported (10 influenza B and one influenza A) (Figure 2). Despite elevated levels of testing for influenza, the percentage of laboratory tests positive for influenza has remained at exceptionally low levels throughout the period of March to September. In weeks 35-38, an average of 5,090 tests for influenza were performed at reporting laboratories, which is 2.5 times the average for this period over the past 6 seasons. The average weekly percentage of tests positive for influenza during this 4-week period was 0.05%, compared to 1.2% during the past 6 seasons.
The 2019-20 influenza season in Canada ended abruptly in mid-March, concurrent with the implementation of public health measures to reduce the spread of COVID-19. Testing for influenza and other respiratory viruses has been influenced by the current COVID-19 pandemic. Changes in laboratory testing practices may affect the comparability of data to previous weeks or previous seasons.
For more detailed weekly and cumulative influenza data, see the text descriptions for Figure 2 or the Respiratory Virus Detections in Canada Report.
Figure 2 - Number of positive influenza tests and percentage of tests positive, by type, subtype and report week, Canada, weeks 2020-35 to 2020-38
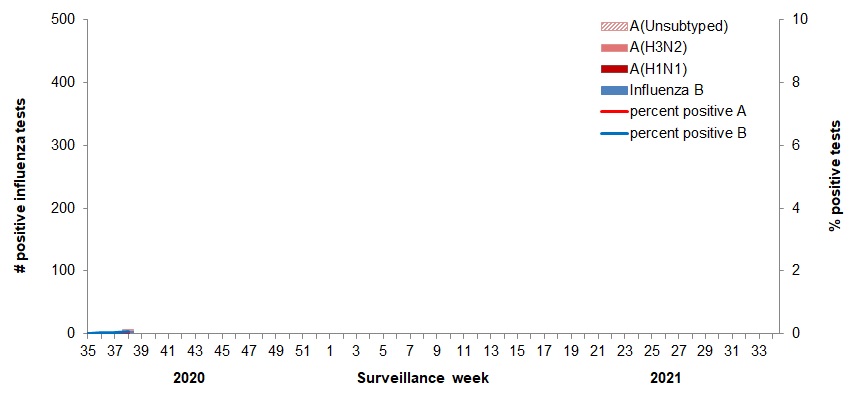
The shaded area indicates weeks where the positivity rate was at least 5% and a minimum of 15 positive tests were observed, signalling the period of seasonal influenza activity.
Figure 2 - Text equivalent
| Surveillance Week | A(Unsubtyped) | A(H3N2) | A(H1N1) | Influenza B | Percent Positive A | Percent Positive B |
|---|---|---|---|---|---|---|
| 35 | 0 | 0 | 0 | 1 | 0.0 | 0.0 |
| 36 | 0 | 0 | 0 | 2 | 0.0 | 0.0 |
| 37 | 0 | 0 | 0 | 2 | 0.0 | 0.0 |
| 38 | 1 | 0 | 0 | 5 | 0.0 | 0.1 |
Figure 3 - Distribution of positive influenza specimens by type/subtype and province/territoryFootnote *, Canada, weeks 2020-35 to 2020-38
There is insufficient data for weeks 35-38 to present influenza detections by type/subtype and province/territory
- Footnote *
-
Specimens from NWT, YT, and Nvt are sent to reference laboratories in other provinces.
Syndromic / Influenza-like Illness Surveillance
Healthcare Professionals Sentinel Syndromic Surveillance
In weeks 35 to 38, an average of 0.3% of visits to healthcare professionals were due to influenza-like illness (ILI) which is similar to previous weeks, and continues to be lower than average compared to recent seasons. In these four weeks, the proportion of visits for ILI was the lowest observed for this period compared to the past 6 seasons (Figure 4). This trend should be interpreted with caution as there have been changes in healthcare seeking behavior of individuals and a smaller number of sentinels reporting in recent weeks compared to previous seasons.
Figure 4 – Percentage of visits for ILI reported by sentinels by report week, Canada, weeks 2020-35 to 2020-38
Number of participants reporting in week 38: 73
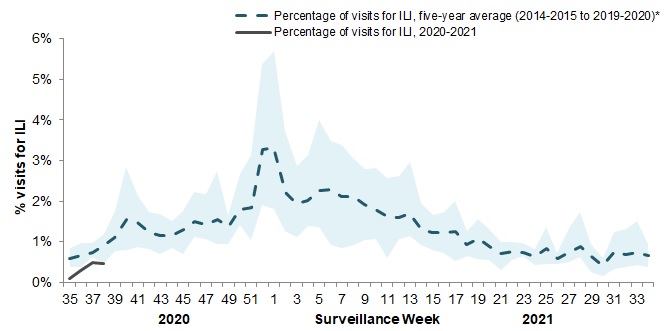
The shaded area represents the maximum and minimum percentage of visits for ILI reported by week from seasons 2014-2015 to 2019-2020
Figure 4 - Text equivalent
| Surveillance Week | 2020-2021 | Average | Min | Max |
|---|---|---|---|---|
| 35 | 0.1% | 0.6% | 0.4% | 0.9% |
| 36 | 0.2% | 0.7% | 0.4% | 1.0% |
| 37 | 0.4% | 0.7% | 0.6% | 1.0% |
| 38 | 0.3% | 0.9% | 0.5% | 1.2% |
| 39 | #N/A | 1.1% | 0.8% | 1.7% |
| 40 | #N/A | 1.6% | 0.8% | 2.8% |
| 41 | #N/A | 1.5% | 0.9% | 2.1% |
| 42 | #N/A | 1.2% | 0.8% | 1.7% |
| 43 | #N/A | 1.1% | 0.7% | 1.7% |
| 44 | #N/A | 1.1% | 0.9% | 1.5% |
| 45 | #N/A | 1.3% | 0.7% | 1.8% |
| 46 | #N/A | 1.5% | 1.1% | 2.2% |
| 47 | #N/A | 1.4% | 1.1% | 2.2% |
| 48 | #N/A | 1.5% | 0.9% | 2.8% |
| 49 | #N/A | 1.4% | 1.0% | 1.7% |
| 50 | #N/A | 1.8% | 1.4% | 2.7% |
| 51 | #N/A | 1.8% | 1.0% | 3.1% |
| 52 | #N/A | 3.3% | 1.9% | 5.4% |
| 53 | #N/A | 3.3% | 1.9% | 5.5% |
| 1 | #N/A | 3.3% | 1.8% | 5.7% |
| 2 | #N/A | 2.2% | 1.3% | 3.7% |
| 3 | #N/A | 1.9% | 1.1% | 2.9% |
| 4 | #N/A | 2.0% | 1.4% | 3.1% |
| 5 | #N/A | 2.3% | 1.4% | 4.0% |
| 6 | #N/A | 2.3% | 0.9% | 3.5% |
| 7 | #N/A | 2.1% | 0.8% | 3.4% |
| 8 | #N/A | 2.1% | 0.9% | 3.1% |
| 9 | #N/A | 1.9% | 1.0% | 2.8% |
| 10 | #N/A | 1.8% | 1.1% | 2.8% |
| 11 | #N/A | 1.6% | 0.6% | 2.6% |
| 12 | #N/A | 1.6% | 1.1% | 2.6% |
| 13 | #N/A | 1.7% | 1.1% | 3.0% |
| 14 | #N/A | 1.3% | 0.9% | 1.9% |
| 15 | #N/A | 1.2% | 0.8% | 1.7% |
| 16 | #N/A | 1.2% | 0.7% | 1.7% |
| 17 | #N/A | 1.3% | 0.5% | 2.0% |
| 18 | #N/A | 0.9% | 0.6% | 1.3% |
| 19 | #N/A | 1.1% | 0.6% | 1.5% |
| 20 | #N/A | 0.9% | 0.5% | 1.3% |
| 21 | #N/A | 0.7% | 0.3% | 1.0% |
| 22 | #N/A | 0.8% | 0.6% | 1.0% |
| 23 | #N/A | 0.7% | 0.6% | 1.0% |
| 24 | #N/A | 0.6% | 0.4% | 0.8% |
| 25 | #N/A | 0.8% | 0.5% | 1.4% |
| 26 | #N/A | 0.6% | 0.5% | 0.7% |
| 27 | #N/A | 0.7% | 0.5% | 1.3% |
| 28 | #N/A | 0.9% | 0.6% | 1.7% |
| 29 | #N/A | 0.6% | 0.2% | 0.9% |
| 30 | #N/A | 0.4% | 0.2% | 0.6% |
| 31 | #N/A | 0.8% | 0.3% | 1.2% |
| 32 | #N/A | 0.7% | 0.4% | 1.3% |
| 33 | #N/A | 0.7% | 0.4% | 1.5% |
| 34 | #N/A | 0.6% | 0.4% | 0.9% |
FluWatchers
In week 38, 9,729 participants reported to FluWatchers. A total of 25 participants (0.26%) reported symptoms of cough and fever (Figure 5). The percentage of participants reporting cough and fever are at very low levels and may be a direct effect of public health measures enacted to reduce the spread of COVID-19.
If you are interested in becoming a FluWatcher, sign up today.
Figure 5 - Percentage of FluWatchers participants reporting cough and fever, Canada, weeks 2020-35 to 2020-38
Number of participants reporting in week 38 : 9,729
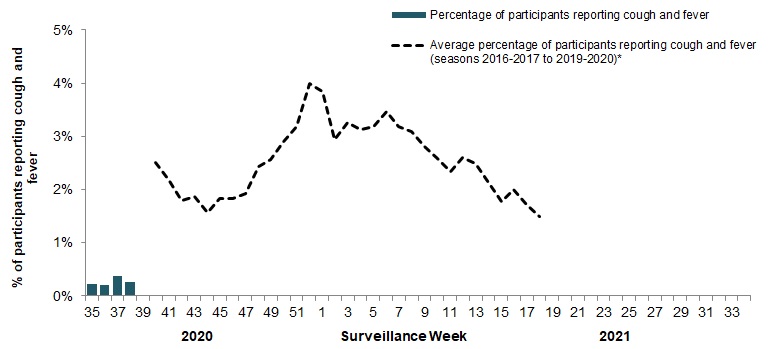
Figure 5 - Text equivalent
| Surveillance Week | % cough and fever |
|---|---|
| 35 | 0.22% |
| 36 | 0.21% |
| 37 | 0.38% |
| 38 | 0.26% |
Online Figure - Geographic distribution of FluWatchers participants reporting cough and fever, Canada, week 2020-38
Click on the map to access the link
Influenza Outbreak Surveillance
In weeks 35 to 38, no outbreaks of influenza or influenza-like illness were reported.
Number of provinces and territories reporting in week 38: 9 out of 13
Severe Outcomes Influenza Surveillance
Provincial/Territorial Influenza Hospitalizations and Deaths
In weeks 35 to 38, no influenza-associated hospitalizations were reported by participating provinces and territoriesFootnote 1.
Number of provinces and territories reporting in week 38: 4 out of 9
- Footnote 1
-
Influenza-associated hospitalizations are reported by Alberta, Manitoba, New Brunswick, Newfoundland and Labrador, Northwest Territories, Nova Scotia, Prince Edward Island and Yukon. Only hospitalizations that require intensive medical care are reported by Saskatchewan.
Pediatric Influenza Hospitalizations and Deaths
In weeks 35 to 38, less than five pediatric (≤16 years of age) hospitalizations with influenza were reported by the Immunization Monitoring Program Active (IMPACT) network.
Adult Influenza Hospitalizations and Deaths
Surveillance of laboratory-confirmed influenza-associated adult (≥16 years of age) hospitalizations by the Canadian Immunization Research Network (CIRN) Serious Outcomes Surveillance (SOS) network has not yet begun for the 2020-21 season.
Influenza Strain Characterizations
The National Microbiology Laboratory has not yet reported influenza strain characterization results for influenza viruses collected during the 2020-21 season.
Antiviral Resistance
The National Microbiology Laboratory has not yet reported antiviral resistance results for influenza viruses collected during the 2020-21 season.
Vaccine Monitoring
Vaccine monitoring refers to activities related to the monitoring of influenza vaccine coverage and effectiveness.
Vaccine Coverage
Influenza vaccine coverage estimates for the 2020-21 season are anticipated to be available in February or March 2021.
Vaccine Effectiveness
Influenza vaccine effectiveness estimates for the 2020-21 season are anticipated to be available in February or March 2021.