
Measles & Rubella Weekly Monitoring Report: July 10 to 16, 2016 (week 28)
Key Points
- In Canada, no new cases of measles or rubella were reported for week 28, 2016.
- A total of 8 cases of measles, and 1 case of rubella have been reported in Canada in 2016.
On this page
Epidemiological Summary
It has been 6 epidemiological weeks since the last reported measles case (week 22, 2016) and 22 epidemiological weeks since the last reported rubella case (week 06, 2016).
The year-to-date total is 8 cases of measles and 1 case of rubella for 2016 (Figure 1).
Organization:
FIGURE 1: Number of cases of measles (n=8) and rubella (n=1), by week of rash onset, as reported to the Canadian Measles/ Rubella Surveillance System (CMRSS) and Measles and Rubella Surveillance system (MARS), for the period ending July 16, 2016.
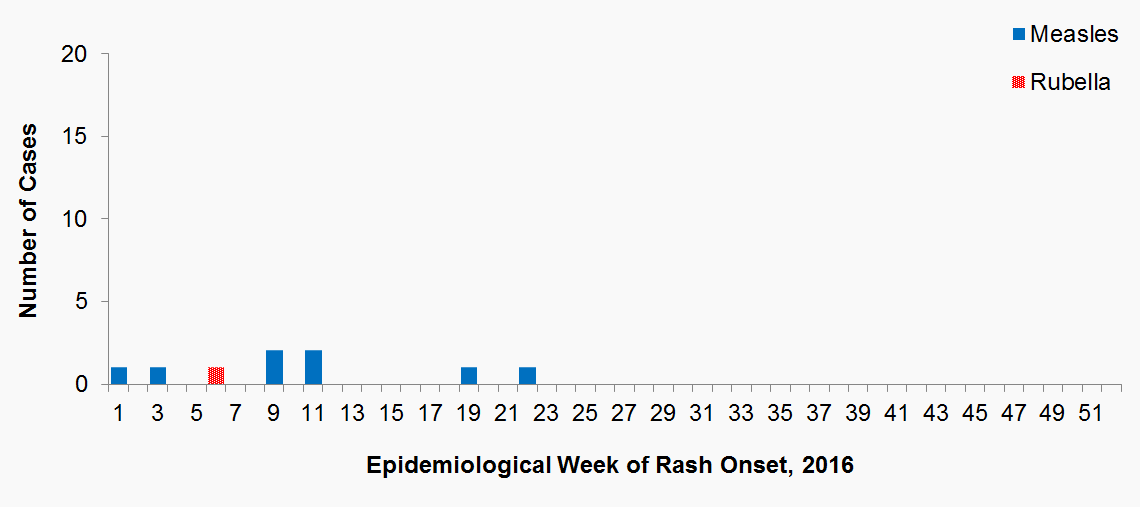
Figure 1 - Text Description
| Epidemiological Week of Rash Onset, 2016 | Number of confirmed measles cases reported | Number of confirmed rubella cases reported |
|---|---|---|
| 1 | 1 | 0 |
| 2 | 0 | 0 |
| 3 | 1 | 0 |
| 4 | 0 | 0 |
| 5 | 0 | 0 |
| 6 | 0 | 1 |
| 7 | 0 | 0 |
| 8 | 0 | 0 |
| 9 | 2 | 0 |
| 10 | 0 | 0 |
| 11 | 2 | 0 |
| 12 | 0 | 0 |
| 13 | 0 | 0 |
| 14 | 0 | 0 |
| 15 | 0 | 0 |
| 16 | 0 | 0 |
| 17 | 0 | 0 |
| 18 | 0 | 0 |
| 19 | 1 | 0 |
| 20 | 0 | 0 |
| 21 | 0 | 0 |
| 22 | 1 | 0 |
| 23 | 0 | 0 |
| 24 | 0 | 0 |
| 25 | 0 | 0 |
| 26 | 0 | 0 |
| 27 | 0 | 0 |
| 28 | 0 | 0 |
| 29 | 0 | 0 |
| 30 | 0 | 0 |
| 31 | 0 | 0 |
| 32 | 0 | 0 |
| 33 | 0 | 0 |
| 34 | 0 | 0 |
| 35 | 0 | 0 |
| 36 | 0 | 0 |
| 37 | 0 | 0 |
| 38 | 0 | 0 |
| 39 | 0 | 0 |
| 40 | 0 | 0 |
| 41 | 0 | 0 |
| 42 | 0 | 0 |
| 43 | 0 | 0 |
| 44 | 0 | 0 |
| 45 | 0 | 0 |
| 46 | 0 | 0 |
| 47 | 0 | 0 |
| 48 | 0 | 0 |
| 49 | 0 | 0 |
| 50 | 0 | 0 |
| 51 | 0 | 0 |
| 52 | 0 | 0 |
| Missing Rash Onset | 0 | 0 |
| Cases (year-to-date) | 8 | 1 |
Geographic Distribution
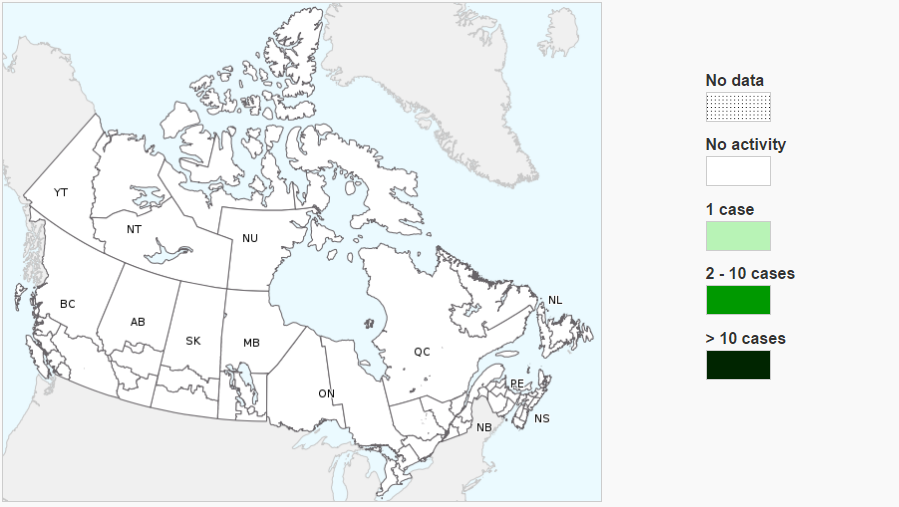
To date in 2016, measles cases have been reported in four Canadian provinces (British Columbia, Alberta, Ontario, and Quebec), and a rubella case has been reported in one province (British Columbia).
Figure 2: Distribution of activeFigure 2 - Footnote *, confirmed measles cases by health region.
- Figure 2 - Footnote *
-
Active cases or outbreaks are those in which the onset date of the most recent case/outbreak-associated case falls within 32 days of the issue date of this reportFootnote 2.
Figure 2 - Text Description
| Health Region | Measles Cases | Rubella Cases |
|---|---|---|
| Eastern Regional Integrated Health Authority | 0 | 0 |
| Central Regional Integrated Health Authority | 0 | 0 |
| Western Regional Integrated Health Authority | 0 | 0 |
| Labrador-Grenfell Regional Integrated Health Authority | 0 | 0 |
| Prince Edward Island | 0 | 0 |
| South Shore District Health Authority | 0 | 0 |
| South West Nova District Health Authority | 0 | 0 |
| Annapolis Valley District Health Authority | 0 | 0 |
| Colchester East Hants Health Authority | 0 | 0 |
| Cumberland Health Authority | 0 | 0 |
| Pictou County Health Authority | 0 | 0 |
| Guysborough Antigonish Strait Health Authority | 0 | 0 |
| Cape Breton District Health Authority | 0 | 0 |
| Capital District Health Authority | 0 | 0 |
| Zone 1 (NB) | 0 | 0 |
| Zone 2 (NB) | 0 | 0 |
| Zone 3 (NB) | 0 | 0 |
| Zone 4 (NB) | 0 | 0 |
| Zone 5 (NB) | 0 | 0 |
| Zone 6 (NB) | 0 | 0 |
| Zone 7 (NB) | 0 | 0 |
| Québec and Chaudières-Appalaches | 0 | 0 |
| Centre-du-Québec | 0 | 0 |
| Montréal and Laval | 0 | 0 |
| Ouest-du-Québec | 0 | 0 |
| Montérégie | 0 | 0 |
| Nord-Est | 0 | 0 |
| Ontario Central East | 0 | 0 |
| Ontario Central West | 0 | 0 |
| Ontario Eastern | 0 | 0 |
| Ontario North East | 0 | 0 |
| Ontario North West | 0 | 0 |
| Ontario South West | 0 | 0 |
| City of Toronto Health Unit | 0 | 0 |
| Winnipeg Regional Health Authority | 0 | 0 |
| Prairie Mountain Health | 0 | 0 |
| Interlake-Eastern Regional Health Authority | 0 | 0 |
| Northern Regional Health Authority | 0 | 0 |
| Southern Health | 0 | 0 |
| Saskatchewan South | 0 | 0 |
| Saskatchewan Central | 0 | 0 |
| Saskatchewan North | 0 | 0 |
| South Zone | 0 | 0 |
| Calgary Zone | 0 | 0 |
| Central Zone | 0 | 0 |
| Edmonton Zone | 0 | 0 |
| North Zone | 0 | 0 |
| British Columbia Interior | 0 | 0 |
| British Columbia Fraser | 0 | 0 |
| British Columbia Vancouver Coastal | 0 | 0 |
| British Columbia Vancouver Island | 0 | 0 |
| British Columbia Northern | 0 | 0 |
| Yukon | 0 | 0 |
| Northwest Territories | 0 | 0 |
| Nunavut | 0 | 0 |
|
||
Laboratory Summary
Measles
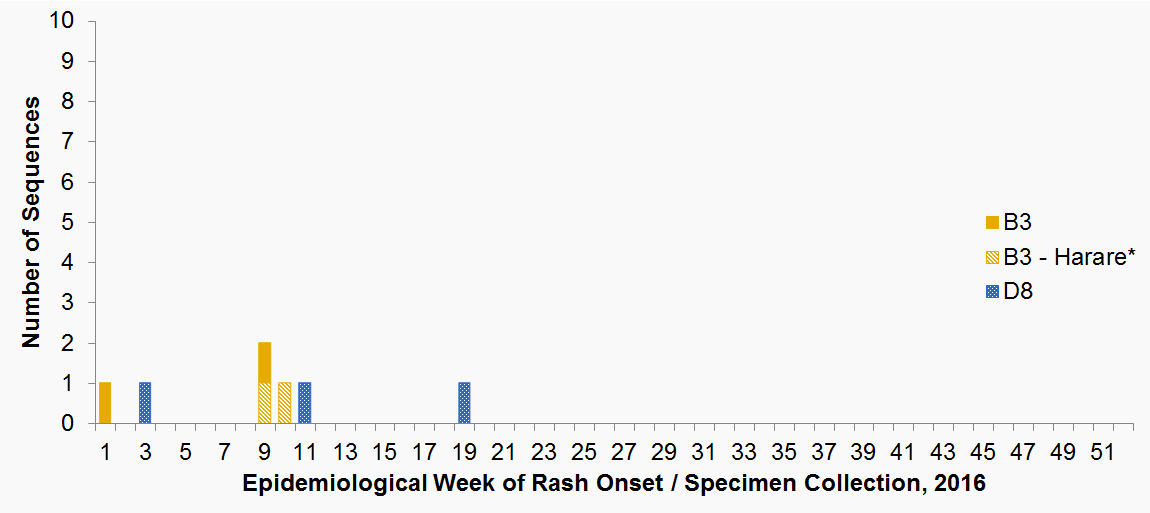
Figure 3: Distribution of measles genotypes detected in 2016 (n=7) by weekFigure 3 - Footnote † of rash onset (if available, n=7) or specimen collection (n=0).Figure 3 - Footnote *
- Figure 3 - Footnote †
-
Epidemiological weeks for laboratory specimens are assigned in accordance with WHO guidelines (WHO.WER.2012;9(87):73) with week 1 beginning on the first Monday of the year.
- Figure 3 - Footnote *
-
Genotype B3 sequences identical to sequence variant / named strain MVi/Harare.ZWE/38.09 (GenBank accession number JF973033)
Figure 3 - Text Description
| Epi week | B3 | B3 - HarareFigure 3 Table - Footnote * | D4 | D8 | D8 - Taunton | D9 | H1 | Total |
|---|---|---|---|---|---|---|---|---|
| 1 | 1 | 0 | 0 | 0 | 0 | 0 | 0 | 1 |
| 2 | 0 | 0 | 0 | 0 | 0 | 0 | 0 | 0 |
| 3 | 0 | 0 | 0 | 1 | 0 | 0 | 0 | 1 |
| 4 | 0 | 0 | 0 | 0 | 0 | 0 | 0 | 0 |
| 5 | 0 | 0 | 0 | 0 | 0 | 0 | 0 | 0 |
| 6 | 0 | 0 | 0 | 0 | 0 | 0 | 0 | 0 |
| 7 | 0 | 0 | 0 | 0 | 0 | 0 | 0 | 0 |
| 8 | 0 | 0 | 0 | 0 | 0 | 0 | 0 | 0 |
| 9 | 1 | 1 | 0 | 0 | 0 | 0 | 0 | 2 |
| 10 | 0 | 1 | 0 | 0 | 0 | 0 | 0 | 1 |
| 11 | 0 | 0 | 0 | 1 | 0 | 0 | 0 | 1 |
| 12 | 0 | 0 | 0 | 0 | 0 | 0 | 0 | 0 |
| 13 | 0 | 0 | 0 | 0 | 0 | 0 | 0 | 0 |
| 14 | 0 | 0 | 0 | 0 | 0 | 0 | 0 | 0 |
| 15 | 0 | 0 | 0 | 0 | 0 | 0 | 0 | 0 |
| 16 | 0 | 0 | 0 | 0 | 0 | 0 | 0 | 0 |
| 17 | 0 | 0 | 0 | 0 | 0 | 0 | 0 | 0 |
| 18 | 0 | 0 | 0 | 0 | 0 | 0 | 0 | 0 |
| 19 | 0 | 0 | 0 | 1 | 0 | 0 | 0 | 1 |
| 20 | 0 | 0 | 0 | 0 | 0 | 0 | 0 | 0 |
| 21 | 0 | 0 | 0 | 0 | 0 | 0 | 0 | 0 |
| 22 | 0 | 0 | 0 | 0 | 0 | 0 | 0 | 0 |
| 23 | 0 | 0 | 0 | 0 | 0 | 0 | 0 | 0 |
| 24 | 0 | 0 | 0 | 0 | 0 | 0 | 0 | 0 |
| 25 | 0 | 0 | 0 | 0 | 0 | 0 | 0 | 0 |
| 26 | 0 | 0 | 0 | 0 | 0 | 0 | 0 | 0 |
| 27 | 0 | 0 | 0 | 0 | 0 | 0 | 0 | 0 |
| 28 | 0 | 0 | 0 | 0 | 0 | 0 | 0 | 0 |
| 29 | 0 | 0 | 0 | 0 | 0 | 0 | 0 | 0 |
| 30 | 0 | 0 | 0 | 0 | 0 | 0 | 0 | 0 |
| 31 | 0 | 0 | 0 | 0 | 0 | 0 | 0 | 0 |
| 32 | 0 | 0 | 0 | 0 | 0 | 0 | 0 | 0 |
| 33 | 0 | 0 | 0 | 0 | 0 | 0 | 0 | 0 |
| 34 | 0 | 0 | 0 | 0 | 0 | 0 | 0 | 0 |
| 35 | 0 | 0 | 0 | 0 | 0 | 0 | 0 | 0 |
| 36 | 0 | 0 | 0 | 0 | 0 | 0 | 0 | 0 |
| 37 | 0 | 0 | 0 | 0 | 0 | 0 | 0 | 0 |
| 38 | 0 | 0 | 0 | 0 | 0 | 0 | 0 | 0 |
| 39 | 0 | 0 | 0 | 0 | 0 | 0 | 0 | 0 |
| 40 | 0 | 0 | 0 | 0 | 0 | 0 | 0 | 0 |
| 41 | 0 | 0 | 0 | 0 | 0 | 0 | 0 | 0 |
| 42 | 0 | 0 | 0 | 0 | 0 | 0 | 0 | 0 |
| 43 | 0 | 0 | 0 | 0 | 0 | 0 | 0 | 0 |
| 44 | 0 | 0 | 0 | 0 | 0 | 0 | 0 | 0 |
| 45 | 0 | 0 | 0 | 0 | 0 | 0 | 0 | 0 |
| 46 | 0 | 0 | 0 | 0 | 0 | 0 | 0 | 0 |
| 47 | 0 | 0 | 0 | 0 | 0 | 0 | 0 | 0 |
| 48 | 0 | 0 | 0 | 0 | 0 | 0 | 0 | 0 |
| 49 | 0 | 0 | 0 | 0 | 0 | 0 | 0 | 0 |
| 50 | 0 | 0 | 0 | 0 | 0 | 0 | 0 | 0 |
| 51 | 0 | 0 | 0 | 0 | 0 | 0 | 0 | 0 |
| 52 | 0 | 0 | 0 | 0 | 0 | 0 | 0 | 0 |
| Total | 2 | 2 | 0 | 3 | 0 | 0 | 0 | 7 |
|
||||||||
The current global distribution of measles genotypes can be found on the WHO Measles Surveillance website.
For information regarding the interpretation and use of measles genotyping (including a discussion of genotypes and sequence variants), refer to Hiebert J and Severini A. Canada Communicable Disease Report. 2014; 40-12: 257- 260.
Rubella
No genotype information is available for the rubella case reported in 2016.