
Report on Hepatitis B and C Surveillance in Canada: 2019

Download the alternative format
(PDF format, 2.86 MB, 27 pages)
Organization: Public Health Agency of Canada
Published: 2022-01-17
Cat.: HP37-22E-PDF
ISBN: 2369-3843
PUB: 210426
Table of contents
- Executive Summary
- 1.0 Introduction
- 2.0 Methods
- 3.0 Hepatitis B
- 3.1 Acute hepatitis B
- 3.1.1 Number of reported cases and rates of acute hepatitis B, overall and by sex, in Canada, 2019
- 3.1.2 Trends in the number of reported cases and rates of acute hepatitis B, overall and by sex, in Canada, 2010 to 2019
- 3.1.3 Trends in the number of reported cases and rates of acute hepatitis B by sex and age group in Canada, 2015 to 2019
- 3.1.4 Trends in the number of reported cases and rates of acute hepatitis B by province or territory, 2010 to 2019
- 3.1.5 Provincial and territorial proportion of reported cases and rates of hepatitis B, 2019
- 3.2 Chronic hepatitis B
- 3.2.1 Number of reported cases and rates of chronic hepatitis B, overall and by sex, in Canada, 2019
- 3.2.2 Trends in the number of reported cases and rates of chronic hepatitis B, overall and by sex, in Canada, 2010 to 2019
- 3.2.3 Trends in reported chronic hepatitis B rates by sex and age group in Canada, 2010 to 2019
- 3.2.4 Number of reported cases and rates of chronic hepatitis B by sex and age group in Canada, 2019
- 3.2.5 Trends in the number of reported cases and rates of chronic hepatitis B by province or territory, 2010 to 2019
- 3.2.6 Provincial and territorial rates of reported chronic hepatitis B, 2019
- 3.1 Acute hepatitis B
- 4.0 Hepatitis C
- 4.1 Hepatitis C
- 4.1.1 Number of reported cases and rates of hepatitis C, overall and by sex, in Canada, 2019
- 4.1.2 Trends in the number of reported cases and rates of hepatitis C overall and by sex, in Canada, 2010 to 2019
- 4.1.3 Reported hepatitis C infection rate trends by age group and sex in Canada, 2010 to 2019
- 4.1.4 Trends in the number of reported cases and rates of hepatitis C by province or territory, 2010 to 2019
- 4.1.5 Provincial and territorial rates of reported hepatitis C, 2019
- 4.2 Acute hepatitis C
- 4.1 Hepatitis C
- 5.0 Discussion
- 6.0 Conclusion
- 7.0 Acknowledgments
- List of supplementary figures and tables
- Appendix A. Reporting patterns for hepatitis B and C, 2010 to 2019
- References
Executive summary
Hepatitis B
Acute hepatitis B
In 2019, there were 178 reported acute hepatitis B cases in Canada for a rate of 0.48 per 100,000 population. Of these,
- 63.5% were male
- 36.0% were female
- 0.5% did not declare sex
Acute hepatitis B rates in Canada are low and have plateaued since 2010, with annual case counts remaining under 200. These low rates and reported cases are mainly attributable to implementing routine hepatitis B immunization programs in all provinces and territories (PTs), starting in the early 1990s, and improved blood screening and infection prevention and control practices in health care settings.
Since 2015, males 40 to 59 years old have had the highest acute hepatitis B rates. Since 2016, rates among females 30 to 39 years old have increased annually and were the highest reported in 2019.
In 2019, acute hepatitis B rates were highest in Manitoba (MB) (1.46 per 100,000 population), followed by New Brunswick (NB) (1.42 per 100,000 population) and Ontario (ON) (0.71 per 100,000 population).
The greatest proportion of reported acute hepatitis B cases came from ON (57.9%), followed by Alberta (AB) (11.2%) and MB (11.2%).
Chronic hepatitis B
In 2019, there were 3,790 reported chronic hepatitis B cases in Canada for a rate of 10.2 per 100,000 population. Of these,
- 55.5% were male
- 43.6% were female
- 0.9% did not declare sex
Chronic hepatitis B rates have trended downwards since 2010. Male rates have consistently been higher than female rates since 2010, but rates have lowered each year for both sexes since 2016. The 2019 national rate for males (11.4 per 100,000 population) and females (8.9 per 100,000 population) were the lowest recorded in ten years.
- Chronic hepatitis B rates among males were consistently highest among 30 to 39-year-olds since 2010.
- Chronic hepatitis B rates among females were consistently highest among 30 to 39-year-olds since 2015.
Across most provinces, chronic hepatitis B rates have plateaued or are on the decline. However, rates have risen in MB, NB and Nova Scotia (NS) over the past decade.
In 2019, the highest chronic hepatitis B rates were reported by British Columbia (BC) (14.7 cases per 100,000 population), followed by ON (11.9 cases per 100,000 population) and AB (11.6 cases per 100,000 population).
Hepatitis C
Hepatitis C (all reported acute, chronic and unspecified infections)
In 2019, there were 11,441 reported hepatitis C cases in Canada. Of these,
- 61.1% were male
- 38.3% were female
- 0.6% did not declare their sex
From 2014 to 2018, national hepatitis C rates rose by 14.4% from 29.6 to 33.9 per 100,000 population. And while rates were increasing among males and females, female rates rose faster for most years during this period. However, from 2018 to 2019, the national hepatitis C rate
- dropped by 10.2% to 30.4 per 100,000 population
- dropped to its lowest in five years
- declined for males and females 15 years and older
- had the first notable decline in rates for 15 to 39-year-olds in ten years
- had the first notable decline in rates for persons 60 years and older in ten years
From 2018 to 2019, 0 to 4-year-olds
- had the highest rate of hepatitis C in ten years
- had a hepatitis C rate of 2.1 per 100,000 population
- had a hepatitis C rate 58% higher than the 2018 rate of 1.3 per 100,000 population
From 2018 to 2019, the hepatitis C rate dropped in 9 PTs ranging from -3.6% to -40.4%.
In 2019, hepatitis C rates were highest for MB (55.6 per 100,000 population), followed by Saskatchewan (SK) (52.5 per 100,000 population) and Newfoundland (NL) (42.8 per 100,000 population).
Acute hepatitis C
In 2019, 6 PTs reported their acute hepatitis C cases (AB, BC, MB, Nunavut (NU), Quebec (QC), and Yukon (YT)). There were 356 acute hepatitis C cases reported (rate of 1.8 per 100,000 population). Among these,
- 55.1% of cases were male
- 44.7% were female
- 0.2% did not declare sex
In 2019, acute hepatitis C rates had a smaller gap between males and females than chronic and unspecified hepatitis C cases. In 2019,
- among males, acute hepatitis C rates were highest among 30 to 39-year-olds, followed closely by 25 to 29-year-olds
- among females, acute hepatitis C rates were highest among 30 to 39-year-olds
- people who had acute hepatitis C tended to be younger than those with chronic and unspecified hepatitis C cases
1.0 Introduction
Hepatitis B
Hepatitis B is a vaccine-preventable viral infection that mainly affects the liver and can cause both acute and chronic illnesses. Acute infection occurs within the first six months of exposure to the hepatitis B virus (HBV). If the infection persists for more than six months, it is said to be chronic. Untreated chronic HBV infection can lead to cirrhosis and liver cancer, and possibly death. While there is no cure for hepatitis B, it can be successfully treated with a lifelong course of antiviral medications, which can help slow disease progression and improve long-term survivalFootnote 1.
Hepatitis B spreads through contact with infected blood or other bodily fluids such as semen and vaginal fluid. In high-income countries such as Canada, HBV transmission occurs mainly through sexual contact and sharing used-injection drug equipmentFootnote 2. Hepatitis B can also be transmitted vertically (from mother to baby at birth). Though hepatitis B diagnosis rates are low in Canada, certain key populations are more likely to have hepatitis B. These include immigrants and refugees from hepatitis B-endemic countries, gay, bisexual and other men who have sex with men (gbMSM), people who inject drugs (PWID), Indigenous Peoples, people who have experienced unstable housing and homelessness, people who have experienced incarceration and people engaged in sex workFootnote 3,Footnote 4,Footnote 5,Footnote 6,Footnote 7.
Despite introducing a universal childhood vaccination program in the 1990s, hepatitis B continues to be a significant cause of morbidity and mortality in Canada.
Hepatitis C
Hepatitis C is a preventable and curable viral infection that, if left untreated, can lead to cirrhosis, chronic liver failure, liver cancer, and in some cases, death. Acute infection occurs within the first six months after exposure to the hepatitis C virus (HCV). Chronic infection occurs when the infection lasts longer than six months. Although there is no vaccine to prevent hepatitis C, in 2015, second-generation direct-acting antiretroviral agent drugs (DAAs) became available in Canada. These drugs are safe and cure >95% of treated peopleFootnote 8,Footnote 9,Footnote 10.
Hepatitis C is spread primarily through contact with infected blood. The majority of infections in Canada occur through the sharing of used injection drug equipmentFootnote 11. Before 1990, most hepatitis C cases in Canada occurred because of transfusions of contaminated blood. However, the introduction of improved blood screening protocols in 1990 has made this type of transmission extremely rare todayFootnote 12.
The Public Health Agency of Canada (PHAC) estimates that, in 2017, up to 317,000 people living in Canada ever had an HCV infection, and 61% (194,500 people) of those people were living with chronic hepatitis CFootnote 13. In addition, hepatitis C was the second most common primary diagnosis, after cancer, for liver transplant recipients in Canada (except for Quebec) from 2009 to 2018Footnote 14. Some key populations are disproportionately impacted by hepatitis C in Canada, including PWID, baby boomers, immigrants from HCV-endemic countries, Indigenous Peoples, people with experiences of incarceration and gbMSM Footnote 15,Footnote 16.
2.0 Methods
Provincial and territorial health authorities provide non-nominal data on laboratory-confirmed cases to PHAC through the Canadian Notifiable Disease Surveillance System (CNDSS). Hepatitis B has been notifiable in Canada since 1969, and the current national case definition specifies acute, chronic and unspecified infection statusFootnote 17. Hepatitis C has been nationally notifiable since 1991, and new case definitions of acute and unspecified infection (including chronic, resolved and indeterminate) were published in 2011Footnote 18. Variables submitted by all reporting jurisdictions include age at diagnosis, year of diagnosis, PT of diagnosis, sex and infection status (acute, chronic or unspecified infection). All data analyzed in this report came from CNDSS, apart from the 2019 chronic hepatitis B SK data which the Saskatchewan Ministry of Health provided. This report includes data from January 1st, 2010 to December 31st, 2019, extracted from the CNDSS in May 2021.
Some PTs distinguish between acute and chronic hepatitis infection (Appendix A). For hepatitis B, reporting on disease status was phased in, over time, by PTs. Only PTs that reported acute or chronic HBV infection(s) for a given year were included in annual acute and chronic rate computations for that year, respectively. Population estimates from jurisdictions not included in a particular analysis (for example, acute or chronic) were removed from the overall denominator used to calculate corresponding national rates.
Diagnosis of acute HCV infection is complex and includes clinical and laboratory criteria. In 2018, six PTs (representing 51.6% of the Canadian population) reported cases differentiated into acute and chronic HCV infection to PHAC (Appendix A). As such, this report presents i) reported acute hepatitis C data from these six PTs (although Manitoba data was not included in acute hepatitis C trend analyses since Manitoba 2018 data was a partial year of data collection and 2019 data is one year of data and thus, not reflective of a trend), and ii) all reported hepatitis C data, which is a total of all acute, chronic, resolved and indeterminate HCV infections reported from 2010 to 2019.
Descriptive analysis was performed using Microsoft Excel. National annual rates of reported cases of acute hepatitis B, chronic hepatitis B, acute hepatitis C, and all hepatitis C data were computed using the number of cases from CNDSS as numerators and Statistics Canada July 2020 yearly population estimates as denominators. Age group, sex and PT-specific rates were also calculated. Rates are reported as the number of cases per 100,000 population. Percentages, rates, and percent change in rates were computed using unrounded numbers. The number of cases reported in a calendar year and overall hepatitis B and C rates by age group and sex can also be retrieved from the Notifiable Diseases Online websiteFootnote 19.
Previous reports may present different rates for some years due to reporting delays, data updates from PTs, or data cleaning and validation improvements. Once PTs have submitted the data used for this report, adjustments made to PT data post-validation may not reflect that year's national data but will be updated in subsequent reports. Therefore, minor discrepancies between the PHAC and PT numbers are expected. The PT report should be considered the most accurate. More significant differences may be noted where PTs employ an analytic strategy different from what is used in this report.
It is important to note that the rates presented in this report include only those tested for and diagnosed with hepatitis B and C. It, therefore, is likely an underestimation of Canada's actual burden of infection.
3.0 Hepatitis B
In 2019, there were 4,912 cases of hepatitis B reported for a rate of 13.1 per 100,000 population. Of these, there were: 178 acute cases (rate of 0.48 per 100,000 population), 3,790 chronic cases (rate of 10.2 per 100,000 population) and 944 unspecified cases (rate of 4.7 per 100,000 population). Not all PTs reported on all three hepatitis B infection statuses (see Appendix A for hepatitis B reporting patterns). Acute hepatitis B data are presented in Section 3.1, while chronic hepatitis B data are presented in Section 3.2.
3.1 Acute Hepatitis B
3.1.1 Number of reported cases and rates of acute hepatitis B, overall and by sex, in Canada, 2019
In 2019, there were 178 reported cases of acute hepatitis B in Canada, for a rate of 0.48 per 100,000 population. Of these, 113 (63.5%) cases were among males (for a rate of 0.62 per 100,000 population), 64 (36.0%) cases were among females (for a rate of 0.34 per 100,000 population) and one (0.5%) case was of unknown sex. In 2019, the male to female ratio of reported acute hepatitis B cases was 1.8.
3.1.2 Trends in the number of reported cases and rates of acute hepatitis B, overall and by sex, in Canada, 2010 to 2019
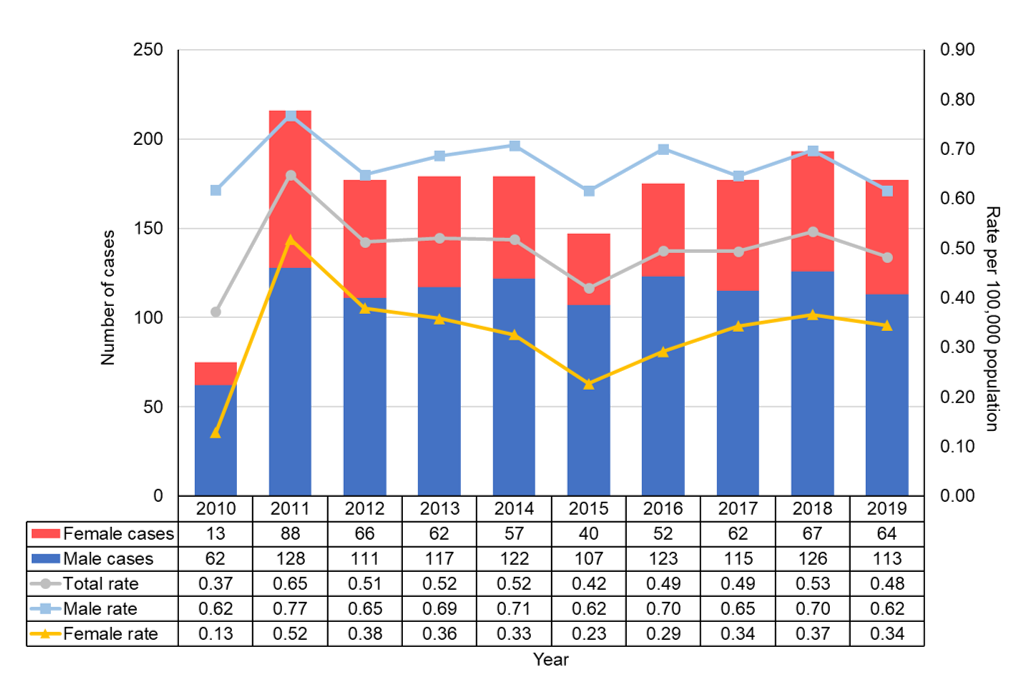
Figure 1 - Text Equivalent
This figure shows the total and sex-specific number of acute hepatitis B cases and rates in Canada between 2010 and 2019. Rates are calculated as the number of acute hepatitis B cases reported per 100,000 population. The horizontal axis shows calendar years from 2010 to 2019. The vertical axis shows the number of acute hepatitis B cases for males and females. The vertical axis also shows the acute hepatitis B rate for males, females, and total. The total rate includes all males, females and those who did not disclose their sex (unknown sex).
| Year | Number of Cases | ||
|---|---|---|---|
| Male | Female | Total | |
| 2010 | 62 | 13 | 75 |
| 2011 | 128 | 88 | 218 |
| 2012 | 111 | 66 | 177 |
| 2013 | 117 | 62 | 179 |
| 2014 | 122 | 57 | 180 |
| 2015 | 107 | 40 | 147 |
| 2016 | 123 | 52 | 175 |
| 2017 | 115 | 62 | 177 |
| 2018 | 126 | 67 | 194 |
| 2019 | 113 | 64 | 178 |
| Year | Rate per 100,000 population | ||
|---|---|---|---|
| Male | Female | Total | |
| 2010 | 0.62 | 0.13 | 0.37 |
| 2011 | 0.77 | 0.52 | 0.65 |
| 2012 | 0.65 | 0.38 | 0.51 |
| 2013 | 0.69 | 0.36 | 0.52 |
| 2014 | 0.71 | 0.33 | 0.52 |
| 2015 | 0.62 | 0.23 | 0.42 |
| 2016 | 0.70 | 0.29 | 0.49 |
| 2017 | 0.65 | 0.34 | 0.49 |
| 2018 | 0.70 | 0.37 | 0.53 |
| 2019 | 0.62 | 0.34 | 0.48 |
NB: Acute hepatitis B case counts include data from AB, BC, MB, NB, NS, NT, QC, SK and YT from 2010 to 2019. ON data is included from 2011 to 2019. NL data was available for 2012. NU data was available for the years 2014, 2015, and 2017 to 2019. PE did not report by the acute status from 2010 to 2019.
Figure 1 shows the number of reported cases and rates of acute hepatitis B by sex and overall in Canada from 2010 to 2019. During this period, male rates were consistently higher than female rates. Rates increased from 2010 to 2011 due to Ontario starting to report on acute status in 2011. From 2011 to 2019, rates remained stable overall, fluctuating slightly (except for 2015 when a more significant decrease in rates was observed). Between 2018 and 2019, the acute hepatitis B rate decreased by 9.6% overall, 11.6% for males and 5.8% for females. However, the 2019 national rate of 0.48 is only slightly lower (-4.9%) than the 2016 to 2018 national average rate of 0.51 per 100,000 population (2019 rate in males was 9.6% lower than the 2016-2018 average of 0.68 per 100,000 population while the 2019 rate in females was similar to the 2016-2018 average of 0.33 per 100,000 population).
3.1.3 Trends in the number of reported cases and rates of acute hepatitis B by sex and age group in Canada, 2015 to 2019
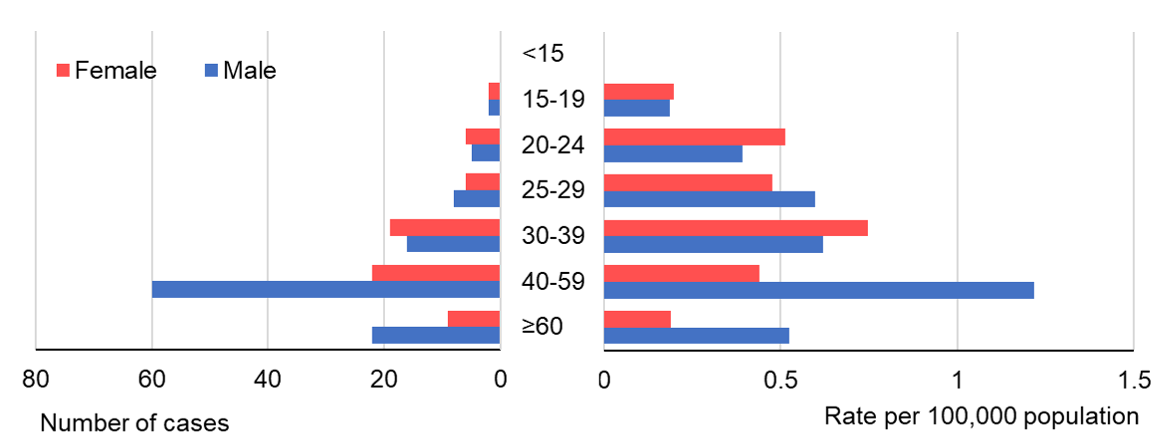
Figure 2 - Text Equivalent
This figure shows the reported number of cases and rates of acute hepatitis B by sex and age group in Canada in 2019. The left side of the horizontal axis shows the number of acute hepatitis B cases for males and females, ranging from 0 to 80. The right side of the horizontal axis shows the acute hepatitis B rate per 100,000 population for males and females, ranging from 0 to 1.5. The vertical axis shows the age groups (in years), 0 to 14, 15 to 19, 20 to 24, 25 to 29, 30 to 39, 40 to 59 and 60 and older.
| Age group | Number of reported cases | |
|---|---|---|
| Male | Female | |
| <15 | 0 | 0 |
| 15-19 | 2 | 2 |
| 20-24 | 5 | 6 |
| 25-29 | 8 | 6 |
| 30-39 | 16 | 19 |
| 40-59 | 60 | 22 |
| ≥60 | 22 | 9 |
| Age group | Rate per 100,000 population | |
|---|---|---|
| Male | Female | |
| <15 | 0 | 0 |
| 15-19 | 0.19 | 0.20 |
| 20-24 | 0.39 | 0.52 |
| 25-29 | 0.60 | 0.48 |
| 30-39 | 0.62 | 0.75 |
| 40-59 | 1.22 | 0.44 |
| ≥60 | 0.53 | 0.19 |
In 2019, acute hepatitis B rates were highest for males 40 to 59 years old (rate of 1.22 per 100,000 population) (see Figure 2). This has been the case since 2015 (data not shown). Similarly, males 40 to 59 years old made up the largest proportion of acute hepatitis B cases (53.1%). However, among females, rates were highest among 30 to 39-year-olds (rate of 0.75 per 100,000 population) in 2019; although, most reported cases occurred among females 40 to 59 years old. Rates among females 30 to 39-year-olds have increased annually since 2016; this contrasts with rates among all other age groups over 19 years old that have fluctuated (data not shown).
In 2019, five (two males, two females and one of unknown sex) acute hepatitis B cases were reported for persons under 20 years of age.
3.1.4 Trends in the number of reported cases and rates of acute hepatitis B by province or territory, 2010 to 2019
Since 2010, reported acute hepatitis B rates have fluctuated but remained relatively low and declined for AB, BC, ON, SK, and QC. In NS, rates increased from 2010 to 2016 but have been declining since 2017 (data available upon request).
In 2015, MB and NB reported less than five cases of acute hepatitis B. Although, the number of cases increased to 29 and 16 in 2018, respectively. However, for both provinces, case counts decreased by approximately 30% between 2018 and 2019.
The Northwest Territories (NT), NU (started reporting acute infection data in 2013) and YT reported less than five acute cases annually since 2010. Trends for NL are not described since they only provided one year of acute data. PE did not provide acute data from 2010 to 2019.
3.1.5 Provincial and territorial proportion of reported cases and rates of hepatitis B, 2019
MB, NB, ON, AB, and QC accounted for most of the reported acute hepatitis B cases (92.7%) in 2019, corresponding to rates of 1.46, 1.42, 0.71, 0.46, and 0.13 per 100,000 population, respectively. The greatest proportion of reported acute cases, however, came from ON (57.9%), followed by AB (11.2%) and MB (11.2%), and then NB (6.2%) and QC (6.2%). BC, NT, NS, NU, SK and YT reported ≤5 acute cases in 2019. NL and PE did not report by the acute status in 2019.
3.2 Chronic Hepatitis B
3.2.1 Number of reported cases and rates of chronic hepatitis B, overall and by sex, in Canada, 2019
In 2019, there were 3,790 cases of chronic hepatitis B reported in Canada, for a rate of 10.2 per 100,000 population. Of these, 2,102 (55.5%) cases were among males (for a rate of 11.4 per 100,000 population), 1,652 (43.6%) cases were among females (for a rate of 8.9 per 100,000 population) and 36 (0.9%) cases were of unknown sex. The male to female ratio of reported chronic hepatitis B cases was 1.3.
3.2.2 Trends in the number of reported cases and rates of chronic hepatitis B, overall and by sex, in Canada, 2010 to 2019
Figure 3 shows the number of reported cases and rates of chronic hepatitis B by sex and overall in Canada from 2010 to 2019. While there has been some variability in rates (partially attributed to PT reporting patterns), overall, rates have declined over the previous decade. Male rates have consistently been higher than female rates since 2010.
The 2019 national chronic hepatitis B rates for males (11.4 per 100,000 population), females (8.9 per 100,000 population) and overall (10.2 per 100,000 population) are the lowest recorded in the last decade.
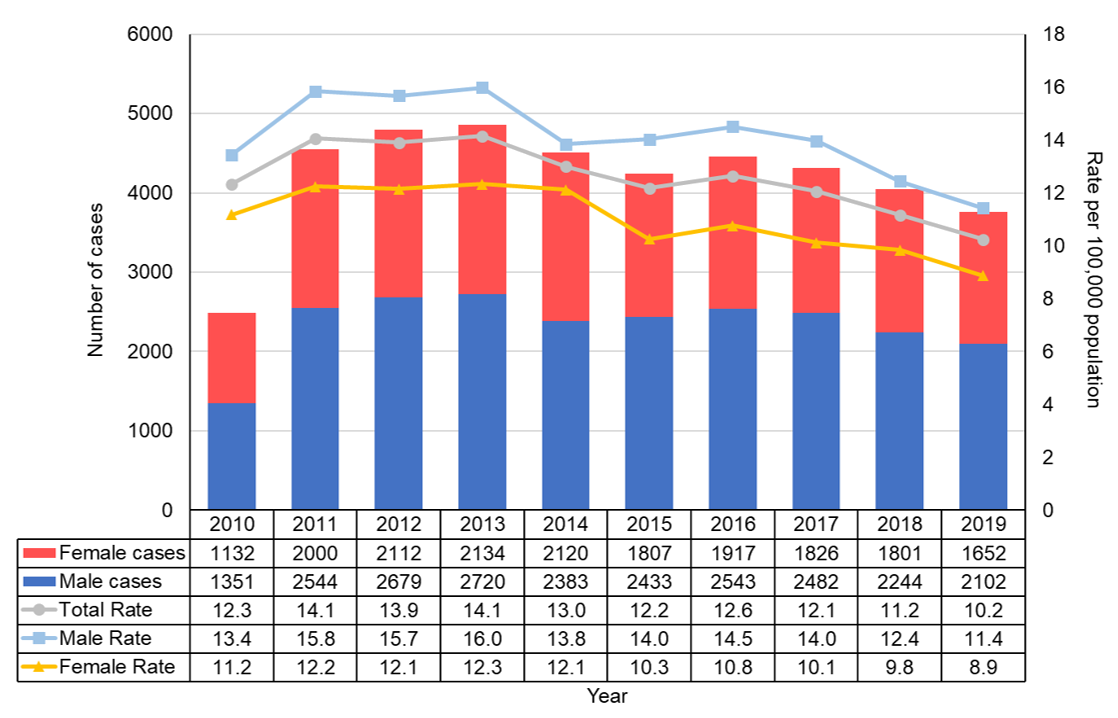
Figure 3 - Text Equivalent
This figure displays the total and sex-specific number of reported cases and rates of chronic hepatitis B in Canada between 2010 and 2019. The horizontal axis shows calendar years from 2010 to 2019. The vertical axis on the left indicates the number of reported chronic hepatitis B cases for males and females. The vertical axis on the right shows the chronic hepatitis B rate per 100,000 population for males, females and total. The total rate includes all males, females and those who did not disclose their sex (unknown sex). Rates are calculated as the number of chronic hepatitis B cases reported per 100,000 population.
| Year | Number of Cases | ||
|---|---|---|---|
| Male | Female | Total | |
| 2010 | 1351 | 1132 | 2487 |
| 2011 | 2544 | 2000 | 4553 |
| 2012 | 2679 | 2112 | 4795 |
| 2013 | 2720 | 2134 | 4856 |
| 2014 | 2383 | 2120 | 4511 |
| 2015 | 2433 | 1807 | 4255 |
| 2016 | 2543 | 1917 | 4470 |
| 2017 | 2482 | 1826 | 4318 |
| 2018 | 2244 | 1801 | 4058 |
| 2019 | 2102 | 1652 | 3790 |
| Year | Rate per 100,000 population | ||
|---|---|---|---|
| Male | Female | Total | |
| 2010 | 13.4 | 11.2 | 12.3 |
| 2011 | 15.8 | 12.2 | 14.1 |
| 2012 | 15.7 | 12.1 | 13.9 |
| 2013 | 16.0 | 12.3 | 14.1 |
| 2014 | 13.8 | 12.1 | 13.0 |
| 2015 | 14.0 | 10.3 | 12.2 |
| 2016 | 14.5 | 10.8 | 12.6 |
| 2017 | 14.0 | 10.1 | 12.1 |
| 2018 | 12.4 | 9.8 | 11.2 |
| 2019 | 11.4 | 8.9 | 10.2 |
NB: Chronic hepatitis B cases include data from AB, BC, NB, NS, SK, QC, and YT for 2010 through 2019. ON data is included from 2011 to 2019. NL data was only available in 2012. NT data was available for the years 2010 and 2011. NU reported data for the years 2014 and 2017 to 2019. MB reported data for the years 2010 and 2012 to 2019. PE started reporting on the chronic HBV infection status in 2019.
3.2.3 Trends in reported chronic hepatitis B rates by sex and age group in Canada, 2010 to 2019
For both males and females aged 20 years and older, chronic hepatitis B rates in 2019 are the lowest recorded in the past ten years (see Figure 4).
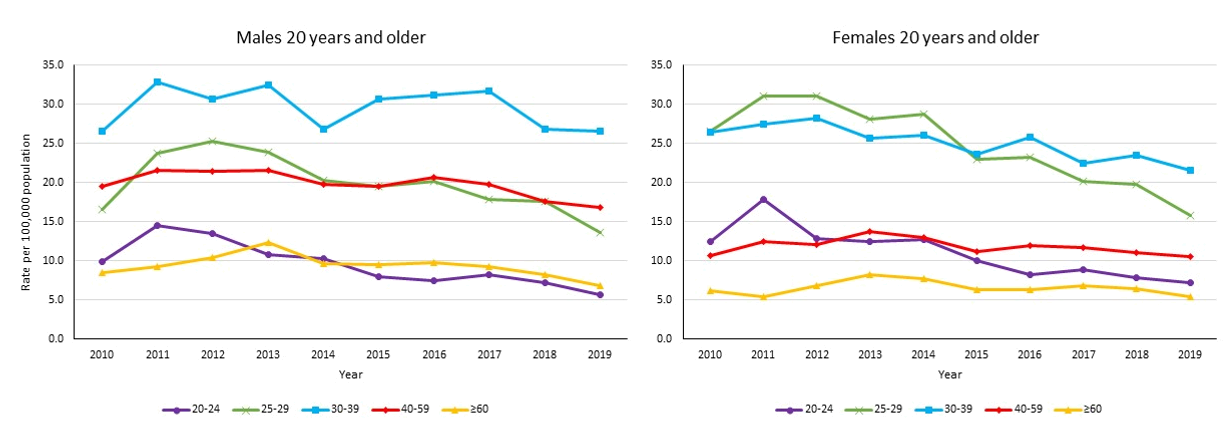
Figure 4 - Text Equivalent
This figure shows reported chronic hepatitis B rates by age group and sex in Canada between 2010 and 2019. The first graph shows trends for males 20 years of age and older. The second graph shows trends for females 20 years of age and older. On both graphs, the horizontal axis shows the calendar years from 2010 to 2019, and the vertical axis shows the rate of chronic hepatitis B for the age groups 20 to 24, 25 to 29, 30 to 39, 40 to 59 years old, and 60 years and older. Rates are calculated as the number of chronic hepatitis B cases reported per 100,000 population.
| Year | Rate per 100,000 population by age group for Males | ||||
|---|---|---|---|---|---|
| 20-24 years old | 25-29 years old | 30-39 years old | 40-59 years old | ≥60 years old | |
| 2010 | 9.9 | 16.6 | 26.6 | 19.5 | 8.5 |
| 2011 | 14.6 | 23.7 | 32.9 | 21.5 | 9.3 |
| 2012 | 13.5 | 25.2 | 30.7 | 21.5 | 10.5 |
| 2013 | 10.8 | 23.9 | 32.4 | 21.5 | 12.4 |
| 2014 | 10.3 | 20.3 | 26.9 | 19.8 | 9.7 |
| 2015 | 8.0 | 19.6 | 30.7 | 19.5 | 9.6 |
| 2016 | 7.5 | 20.2 | 31.1 | 20.7 | 9.8 |
| 2017 | 8.3 | 17.9 | 31.7 | 19.8 | 9.2 |
| 2018 | 7.2 | 17.6 | 26.8 | 17.6 | 8.3 |
| 2019 | 5.6 | 13.6 | 26.5 | 16.8 | 6.8 |
| Year | Rate per 100,000 population by age group for Females | ||||
|---|---|---|---|---|---|
| 20-24 years old | 25-29 years old | 30-39 years old | 40-59 years old | ≥60 years old | |
| 2010 | 12.5 | 26.5 | 26.5 | 10.7 | 6.2 |
| 2011 | 17.9 | 31.1 | 27.5 | 12.4 | 5.4 |
| 2012 | 12.9 | 31.1 | 28.2 | 12.1 | 6.8 |
| 2013 | 12.4 | 28.1 | 25.6 | 13.7 | 8.3 |
| 2014 | 12.7 | 28.8 | 26.1 | 13.0 | 7.7 |
| 2015 | 10.0 | 22.9 | 23.7 | 11.2 | 6.3 |
| 2016 | 8.3 | 23.2 | 25.7 | 12.0 | 6.4 |
| 2017 | 8.9 | 20.2 | 22.4 | 11.8 | 6.9 |
| 2018 | 7.9 | 19.8 | 23.5 | 11.0 | 6.5 |
| 2019 | 7.3 | 15.8 | 21.6 | 10.6 | 5.5 |
Among males, over the last decade, rates have been consistently highest (and relatively stable) among 30 to 39 years old. Age groups with the second highest rates are 25 to 29 and 40 to 59-year-olds. These age groups have had similar rates since 2014 and have been slowly declining. Of all age groups 20 years and older, rates among males 20 to 24 and 60 years and older are the lowest and have been on a slow but steady decline since 2013. Among males 19 years and under, rates show no clear trend over the previous decade (data not shown).
From 2010 to 2014, rates were highest for females 25 to 29, followed by 30 to 39-year-olds. However, since 2015, rates have been highest amongst 30 to 39-year-olds, followed by 25 to 29-year-olds. Rates among 20 to 24, 25 to 29 and 30 to 39-year-old females are on the decline; although, rates among 25 to 29 years olds are declining faster than any other age group. Rates among females 40 years and older have plateaued over the last decade. Since 2010, rates among females 19 years and younger have fluctuated but trended towards decline (data not shown).
3.2.4 Number of reported cases and rates of chronic hepatitis B by sex and age group in Canada, 2019
In 2019, similar to previous years, chronic hepatitis B rates were highest for 30 to 39-year-old males (rate of 26.5 per 100,000 population) and females (rate of 21.6 per 100,000 population) (see Figure 5). However, most cases were reported among 30 to 59-year-olds for males (71.8%) and females (65.2%). Chronic rates are slightly higher among males than females 19 years and younger. However, among persons 20 to 29 years of age, rates are slightly higher for females than males. Male rates are higher than female rates for persons 30 years and older.

Figure 5 - Text Equivalent
This figure shows the number of reported cases and rates of chronic hepatitis B by sex and age group in Canada in 2019. The left side of the horizontal axis shows the number of reported chronic hepatitis B cases for males and females, ranging from 0 to 1000. The right side of the horizontal axis shows the chronic hepatitis B rate per 100,000 population for males and females, ranging from 0 to 30. The vertical axis shows the age groups (in years), <15, 15 to 19, 20 to 24, 25 to 29, 30 to 39, 40 to 59 and ≥60.
| Age group (years) | Number of reported cases | |
|---|---|---|
| Male | Female | |
| <15 | 17 | 10 |
| 15-19 | 34 | 22 |
| 20-24 | 72 | 85 |
| 25-29 | 182 | 198 |
| 30-39 | 683 | 549 |
| 40-59 | 827 | 528 |
| ≥60 | 287 | 260 |
| Age group | Rate per 100,000 population | |
|---|---|---|
| Male | Female | |
| <15 | 0.56 | 0.34 |
| 15-19 | 3.18 | 2.16 |
| 20-24 | 5.64 | 7.28 |
| 25-29 | 13.61 | 15.76 |
| 30-39 | 26.52 | 21.58 |
| 40-59 | 16.80 | 10.59 |
| ≥60 | 6.85 | 5.46 |
3.2.5 Trends in the number of reported cases and rates of chronic hepatitis B by province or territory, 2010 to 2019
There is some heterogeneity in reported chronic hepatitis B rate trends by PT (data available upon request). Overall, rates have been declining for BC and ON over the last decade. The 2019 chronic hepatitis B rates were the lowest recorded for BC (since 2010) and ON (since 2011, when ON first started reporting by the chronic hepatitis B status).
Rates in QC and SK have fluctuated over the last ten years but remained relatively stable.
Rates were declining in AB from 2013 to 2018 (apart from 2016) but increased by 13.5% from 10.3 in 2018 to 11.6 per 100,000 population in 2019. In MB, rates have been relatively stable since 2015 but have increased by 117.6% from 4.2 in 2012 to 9.1 per 100,000 population in 2019. Rates in NB have fluctuated over time but have risen overall since 2011. Specifically, rates in NB have increased 151.3% from 3.2 in 2011 (24 cases) to 8.0 per 100,000 population in 2019 (62 cases). In NS, rates have been consistently rising since 2015, increasing 136% from 1.0 in 2015 (9 cases) to 2.3 per 100,000 population (22 cases) in 2019. The 2019 rate was the highest reported rate for NS since 2010.
YT's trends in rates are not described since they reported ≤5 cases annually for most of 2010 through 2019. NL, NT, NU and PE did not report by the chronic status for most of 2010 to 2019.
3.2.6 Provincial and territorial rates of reported chronic hepatitis B, 2019

Figure 6 - Text Equivalent
This map displays the 2019 reported chronic hepatitis B rates by Canadian province and territory, using the Canadian Notifiable Disease Surveillance System (CNDSS) data. Rates are calculated as the number of chronic hepatitis B cases reported per 100,000 population.
| Jurisdiction | Total rate per 100,000 population |
|---|---|
| CA | 10.2 |
| BC | 14.7 |
| AB | 11.6 |
| SK | 10.7 |
| MB | 9.1 |
| ON | 11.9 |
| QC | 5.6 |
| NB | 8.0 |
| NS | 2.3 |
| PE | 2.5 |
| NL | NA |
| YT | 0.00 |
| NT | NA |
| NU | 10.4 |
NA: NL and the NT did not report by the chronic HBV infection status in 2019. Thus, they were not included in the national rate calculation.
In 2019, PTs with rates above the national rate of 10.2 per 100,000 population included (rates are per 100,000 population): BC (14.7), ON (11.9), AB (11.6), SK (10.7) and NU (10.4) (see Figure 6).
PTs with rates below the national rate included: MB (9.1), NB (8.0), QC (5.6), PE (2.5), NS (2.3) and YT (0.0).
In 2019, ON reported the largest proportion of chronic hepatitis B cases (47.0%) in Canada, followed by BC (20.4%), AB (13.9%) and QC (12.9%). Combined, MB, NB, NS, NU, PE, SK and YT accounted for less than 6% of all chronic hepatitis B cases reported in Canada.
4.0 Hepatitis C
In 2019, there were 11,441 hepatitis C cases reported in Canada for a rate of 30.4 per 100,000 population. Of these, there were: 356 acute cases (rate of 1.8 per 100,000 population), 2,980 chronic cases (rate of 27.3 per 100,000 population) and 8,105 unspecified cases (rate of 24.9 per 100,000 population). Not all PTs reported on all three infection statuses. Section 4.1 presents hepatitis C data as a total of all reported acute, chronic and unspecified hepatitis C cases (referred to as 'hepatitis C' throughout this section). Section 4.2 shows acute hepatitis C data only.
4.1 Hepatitis C
4.1.1 Number of reported cases and rates of hepatitis C, overall and by sex, in Canada, 2019
In 2019, there were 11,441 hepatitis C cases reported in Canada, for a rate of 30.4 per 100,000 population. Of these, 6991 (61.1%) cases were among males (for a rate of 37.4 per 100,000 population) 4385 (38.3%) cases were among females (for a rate of 23.2 per 100,000 population) and 65 (0.6%) of cases were of unknown sex. In 2019, the male to female ratio of reported hepatitis C cases was 1.6.
4.1.2 Trends in the number of reported cases and rates of hepatitis C overall and by sex, in Canada, 2010 to 2019

Figure 7 - Text Equivalent
This figure shows the total and sex-specific number of reported cases and rates of hepatitis C (all reported acute, chronic, and unspecified hepatitis C infections) in Canada between 2010 and 2019. Rates are calculated as the number of hepatitis C cases reported per 100,000 population. The horizontal axis shows calendar years from 2010 to 2019. The vertical axis on the left indicates the combined number of reported acute, chronic, and unspecified hepatitis C cases for males and females. The vertical axis on the right shows the rate of hepatitis C per 100,000 population for males, females and total. The total rate includes all males, females, and those who did not disclose their sex (unknown sex).
| Year | Number of Cases | ||
|---|---|---|---|
| Male | Female | Total | |
| 2010 | 6745 | 3705 | 10552 |
| 2011 | 6365 | 3657 | 10113 |
| 2012 | 6345 | 3767 | 10205 |
| 2013 | 6527 | 3751 | 10366 |
| 2014 | 6603 | 3829 | 10496 |
| 2015 | 6767 | 4088 | 10920 |
| 2016 | 7081 | 4235 | 11338 |
| 2017 | 7210 | 4557 | 11823 |
| 2018 | 7661 | 4848 | 12554 |
| 2019 | 6991 | 4385 | 11441 |
| Year | Rate per 100,000 population | ||
|---|---|---|---|
| Male | Female | Total | |
| 2010 | 40.03 | 21.59 | 31.03 |
| 2011 | 37.41 | 21.11 | 29.45 |
| 2012 | 36.87 | 21.52 | 29.40 |
| 2013 | 37.51 | 21.21 | 29.55 |
| 2014 | 37.56 | 21.44 | 29.62 |
| 2015 | 38.20 | 22.72 | 30.59 |
| 2016 | 39.52 | 23.28 | 31.40 |
| 2017 | 39.75 | 24.75 | 32.35 |
| 2018 | 41.62 | 25.98 | 33.87 |
| 2019 | 37.43 | 23.18 | 30.43 |
The reported annual hepatitis C rates have been consistently higher for males than females since 2010. From 2014, rates started steadily rising until 2018, when the national, male and female rates peaked at 33.9, 41.6 and 26.0 per 100,000 population, respectively. However, between 2018 and 2019, the national hepatitis C rate decreased by 10.2%. The 2019 national hepatitis C rate of 30.4 is the lowest reported since 2014.

Figure 8 - Text Equivalent
This figure displays the annual percentage change in the reported hepatitis C rates by sex in Canada from 2010 to 2019. The horizontal axis shows the annual calendar years from 2010 to 2019. The vertical axis shows the annual percentage change in the reported hepatitis C rates ranging from -12% to 8%.
| Year | Percent change in hepatitis C rates | |
|---|---|---|
| Rate change - Males | Rate change - Females | |
| 2010-2011 | -6.56% | -2.25% |
| 2011-2012 | -1.45% | 1.95% |
| 2012-2013 | 1.74% | -1.42% |
| 2013-2014 | 0.13% | 1.08% |
| 2014-2015 | 1.73% | 5.97% |
| 2015-2016 | 3.45% | 2.44% |
| 2016-2017 | 0.59% | 6.34% |
| 2017-2018 | 4.70% | 4.96% |
| 2018-2019 | -10.08% | -10.77% |
Figure 8 shows the annual percent change in rates of reported hepatitis C cases in Canada from one year to the next, by sex, from 2010 to 2019. A negative percent change in rate is the desired outcome as it means that the reported rate declined compared to the previous year. From 2014 to 2018, hepatitis C rates were on the rise for both males and females. Also, a new trend emerged whereby female rates were rising faster than male rates (apart from 2015 to 2016). However, from 2018 to 2019, the hepatitis C rate decreased by 10.8% among females and 10.1% among males.
4.1.3 Reported hepatitis C infection rate trends by age group and sex in Canada, 2010 to 2019
Figure 9 shows the annual national reported hepatitis C rates, by age group and sex, for persons 15 years and older, from 2010 to 2019. For both sexes, rates have been highest among 25 to 29-year-olds (since 2015 for males, apart from 2018, and since 2011 for females). For males, rates in this age group have been very similar to 30 to 39-year-old rates since 2014. In 2019, the greatest proportion of hepatitis C cases were reported among 40 to 59-year-old males (35.5%) and females (28.2%).

Figure 9 - Text Equivalent
This figure shows two graphs showing Canada's reported rates of hepatitis C (all reported acute, chronic, and unspecified hepatitis C infections) by age group and sex between 2010 and 2019. The first graph shows trends for males 15 years of age and older. The second graph shows trends for females 15 years of age and older. On both graphs, the horizontal axis shows the calendar years from 2010 to 2019, and the vertical axis shows the rate of reported hepatitis C for the age groups 15 to 19, 20 to 24, 25 to 29, 30 to 39, 40 to 59 years old, and 60 years and older. Rates are calculated as the number of hepatitis C cases reported per 100,000 population.
| Year | Rate per 100,000 population by age group for Males | |||||
|---|---|---|---|---|---|---|
| 15-19 years old | 20-24 years old | 25-29 years old | 30-39 years old | 40-59 years old | ≥60 years old | |
| 2010 | 5.8 | 26.7 | 41.9 | 54.9 | 76.6 | 22.8 |
| 2011 | 6.2 | 24.1 | 43.3 | 51.6 | 68.4 | 25.0 |
| 2012 | 5.9 | 31.1 | 41.8 | 52.1 | 64.3 | 26.5 |
| 2013 | 6.6 | 39.3 | 46.3 | 51.4 | 61.4 | 30.0 |
| 2014 | 6.8 | 38.7 | 55.4 | 51.9 | 58.6 | 31.2 |
| 2015 | 6.5 | 40.5 | 58.3 | 55.3 | 56.8 | 33.2 |
| 2016 | 5.6 | 39.7 | 64.5 | 64.4 | 54.7 | 35.0 |
| 2017 | 6.9 | 34.8 | 67.5 | 67.3 | 51.7 | 38.8 |
| 2018 | 6.7 | 40.5 | 66.3 | 68.0 | 55.5 | 40.0 |
| 2019 | 5.5 | 29.5 | 64.2 | 63.2 | 49.5 | 35.6 |
| Year | Rate per 100,000 population by age group for Females | |||||
|---|---|---|---|---|---|---|
| 15-19 years old | 20-24 years old | 25-29 years old | 30-39 years old | 40-59 years old | ≥60 years old | |
| 2010 | 9.1 | 29.4 | 33.4 | 32.1 | 33.1 | 12.0 |
| 2011 | 8.3 | 27.5 | 32.7 | 31.6 | 32.0 | 12.8 |
| 2012 | 10.5 | 33.8 | 38.2 | 32.5 | 29.8 | 12.8 |
| 2013 | 12.3 | 34.0 | 41.3 | 30.6 | 27.8 | 14.1 |
| 2014 | 13.7 | 36.7 | 43.3 | 31.3 | 27.1 | 13.9 |
| 2015 | 14.1 | 42.8 | 46.0 | 35.6 | 26.7 | 15.2 |
| 2016 | 10.2 | 42.4 | 49.2 | 38.5 | 26.8 | 16.2 |
| 2017 | 12.4 | 43.2 | 57.3 | 41.7 | 26.7 | 17.8 |
| 2018 | 12.4 | 44.8 | 61.3 | 44.9 | 26.6 | 19.6 |
| 2019 | 9.8 | 33.6 | 52.7 | 42.8 | 24.4 | 17.3 |
From 2010 to 2018, hepatitis C rates increased overall in all age groups 20 years and older, except those 40 to 59 years old. Rates among 40 to 59-year-olds have been on the decline since 2010. Rates have been low and stable for those aged 15-19 years. However, from 2018 to 2019, rates declined for males and females, 15 years of age and older. This is the first notable decline in rates for adults aged 15 to 39 and ≥60 years old over the last decade. The greatest declines in rates occurred among males (-27%) and females (-25%) 20 to 24 years old, followed by males (-18%) and females (-21%) 15 to 19 years old (see Figure 10).
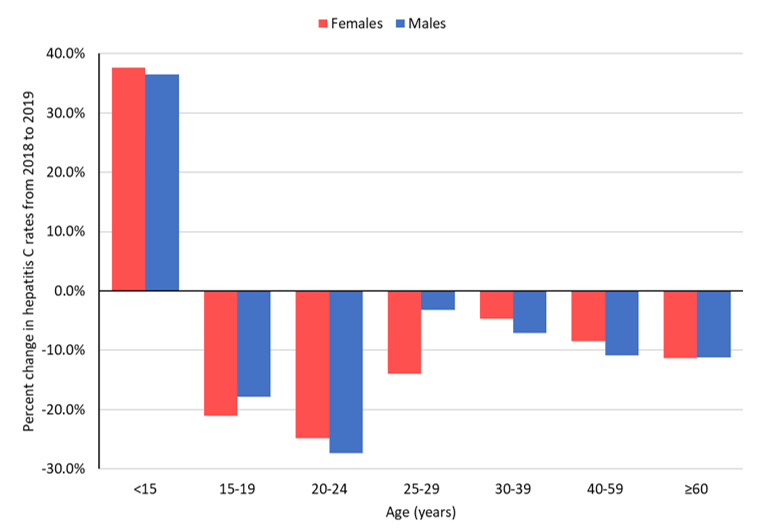
Figure 10 - Text Equivalent
This figure shows the percentage change in hepatitis C (all reported acute, chronic, and unspecified hepatitis C infections) rates from 2018 to 2019 by age group and sex in Canada. The vertical axis shows the annual percentage change in the hepatitis C rate ranging from -30% to 40%. The horizontal axis shows the age groups (in years), 0 to 14, 15 to 19, 20 to 24, 25 to 29, 30 to 39, 40 to 59 and 60 and older.
| Age group (years) | Percent change in hepatitis C rates from 2018 to 2019 | |
|---|---|---|
| Rate change - Males | Rate change - Females | |
| <15 | 36.5% | 37.6% |
| 15-19 | -17.9% | -21.0% |
| 20-24 | -27.3% | -24.8% |
| 25-29 | -3.2% | -13.9% |
| 30-39 | -7.1% | -4.7% |
| 40-59 | -10.9% | -8.5% |
| ≥60 | -11.2% | -11.4% |
However, rates increased by 38% for females and 37% for males less than 15 years old. In 2019, there were 69 reported hepatitis C cases among persons 15 years and younger. Of these, 41 cases (59%) occurred among children 0 to 4 years of age. From 2010 to 2018, hepatitis C case counts for this age group would increase or decrease by two to six cases between reporting years. However, the case count increased from 26 in 2018 to 41 in 2019. Reported hepatitis C rates among children under five years old increased by 58% overall, from 1.3 in 2018 to 2.1 per 100,000 population in 2019. This is the highest reported hepatitis C rate for the 0 to 4 age group in the last decade.
4.1.4 Trends in the number of cases and rates of hepatitis C by province or territory, 2010 to 2019
There is heterogeneity in hepatitis C rate trends across PTs in Canada (data available upon request). Despite this, rates increased across most PTs, during the latter half of the decade. However, between 2018 and 2019, hepatitis C rates declined across nine PTs (ranging from -3.6% to -40.4%), except for NS (increased by 0.3%) and PE (increased by 15.3%) (see Figure 11). NT and NU trends are not described since they reported five or less hepatitis C cases in 2019.
The reported increase in rates observed in PE occurred among males. Male rates rose by 40.1% from 2018 to 2019 (female rates declined by 18%). In 2019, in PE, 13.9% of reported hepatitis C cases occurred among males 20 to 25 years old and 33.3% among males 40 to 59 years old.
While rates have decreased across most PTs from 2018 to 2019, when comparing 2015 to 2019 rates, four PTs had notable hepatitis C rate increases of 83.6% in MB, 44.9% in NL, 39.4% in NB and 22.6% in PE. All other PTs had stable or declining five-year rate trends. The 2019 reported hepatitis C rate is the lowest reported for BC, SK and YT in the past ten years.

Figure 11 - Text Equivalent
This figure shows the percentage change in reported hepatitis C (all reported acute, chronic and unspecified hepatitis C infections) rates from 2018 to 2019 by province or territory in Canada. The vertical axis shows the percentage change in hepatitis C rates from 2018 to 2019 ranging from -50% to 20%. The horizontal axis shows the Canadian provinces and territories organized from west to east and Canada.
| Province/Territory/Canada | Percent change in hepatitis C rates from 2018 to 2019 |
|---|---|
| BC | -4.2% |
| AB | -10.6% |
| SK | -12.5% |
| MB | -3.6% |
| ON | -10.9% |
| QC | -19.1% |
| NB | -14.6% |
| NS | 0.3% |
| PE | 15.3% |
| NL | -14.2% |
| YT | -40.4% |
| NT | -0.1% |
| NU | -50.6% |
| Canada | -10.1% |
NB: Northwest Territories and Nunavut data are not shown since they reported ≤5 cases in 2019.
4.1.5 Provincial and territorial rates of reported hepatitis C, 2019
In 2019, PTs that had hepatitis C rates above the national rate of 30.4 per 100,000 population included (rates are per 100,000 population): MB (55.6), SK (52.5), NL (42.8), BC (37.7), NS (36.1), YT (33.8), ON (33.2), PE (33.1) and NB (32.7). In contrast, PTs with rates below the national rate included: QC (12.8), NT (11.1) and NU (5.2). Finally, AB's rate matched the 2019 national rate.

Figure 12 - Text Equivalent
This map displays the 2019 reported hepatitis C (all reported acute, chronic, and unspecified hepatitis C infections) rates by Canadian province and territory, using the Canadian Notifiable Disease Surveillance System (CNDSS) data. Rates are calculated as the number of hepatitis C cases reported per 100,000 population.
| Jurisdiction | Total rate per 100,000 population |
|---|---|
| CA | 30.4 |
| BC | 37.7 |
| AB | 30.4 |
| SK | 52.5 |
| MB | 55.6 |
| ON | 33.2 |
| QC | 12.8 |
| NB | 32.7 |
| NS | 36.1 |
| PE | 33.1 |
| NL | 42.8 |
| YT | 33.8 |
| NT | 11.1 |
| NU | 5.2 |
In 2019, ON reported the greatest proportion of hepatitis C cases in Canada (42.2%), followed by BC (16.8%), AB (11.6%) QC (9.5%), MB (6.7%) and SK (5.4%). NS, NL, NT, NU, PE and YT accounted for less than 8% of all reported cases in Canada.
4.2 Acute hepatitis C
4.2.1 Trends in the number of reported cases and rates of acute hepatitis C, by sex and age group in Canada, 2016 to 2019
There were 356 acute hepatitis C cases reported in 2019, for a rate of 1.8 per 100,000 population from the six reporting PTs, AB, BC, MB, NU, QC and YT. Of these cases, 196 (55.1%) were male (rate of 2.0 per 100,000 population) 159 (44.7%) were female (rate of 1.6 per 100,000 population) and one was of unknown sex. Rates were highest among 30 to 39-year-old males (5.5 per 100,000 population) and females (4.7 per 100,000 population), followed closely by 25 to 29-year-old males (5.2 per 100,000 population) and females (4.4 per 100,000 population) (see Figure 13). Similarly, the greatest proportion of all reported acute cases came from males (38.8%) and females (40.3%), 30 to 39 years old. Females and males 20 to 24 years old share the same acute hepatitis C rate, 4.3 per 100,000 population.

Figure 13 - Text Equivalent
This figure shows the number of reported cases and rates of acute hepatitis C by sex and age group in Canada in 2019. The left side of the horizontal axis shows the number of reported acute hepatitis C cases for males and females, ranging from 0 to 80. The right side of the horizontal axis shows the acute hepatitis C rate per 100,000 population for males and females, ranging from zero to six. The vertical axis shows the age groups (in years), 20 to 24, 25 to 29, 30 to 39, 40 to 59 and 60 and older.
| Age group (years) | Number of reported cases | |
|---|---|---|
| Male | Female | |
| 20-24 | 27 | 25 |
| 25-29 | 36 | 29 |
| 30-39 | 76 | 64 |
| 40-59 | 42 | 29 |
| ≥60 | 11 | 3 |
| Age group (years) | Rate per 100,000 population | |
|---|---|---|
| Male | Female | |
| 20-24 | 4.3 | 4.3 |
| 25-29 | 5.2 | 4.4 |
| 30-39 | 5.5 | 4.7 |
| 40-59 | 1.6 | 1.1 |
| ≥60 | 0.5 | 0.1 |
The 2019 national reported acute hepatitis C rate is 10.1%, 5.2% and 16.8% lower than the three-year (2016 to 2018) average rate of 1.6, 1.8 and 1.5 per 100,000 population, overall, for females and males, respectively. Since 2016, male rates have been higher than female rates. As was observed for all reported hepatitis C data, acute hepatitis C rates dropped by 18.3% overall, 22.7% for males and 15.1% for females, from 2018 to 2019. Also, rates dropped across all age groups 20 years of age and older, except for 30 to 39-years. Rates among 30 to 39-year-olds males and females increased by 14.8% and 51.1%, respectively, since 2018.
In 2019, people 39 years and younger made up a greater proportion of reported acute hepatitis C infections (76.1%), while persons 40 and over made up a larger proportion of all reported chronic/unspecified hepatitis C cases (53.5%) in Canada (see Figure 14).

Figure 14 - Text equivalent
| Age (years) | Proportion of all reported hepatitis C cases in 2019 | |
|---|---|---|
| Acute proportion | Chronic/Unspecified proportion | |
| <15 | 0.6% | 0.6% |
| 15-19 | 3.1% | 1.3% |
| 20-24 | 14.6% | 6.4% |
| 25-29 | 18.5% | 12.9% |
| 30-39 | 39.3% | 22.9% |
| 40-59 | 19.9% | 32.1% |
| ≥60 | 3.9% | 20.6% |
4.2.2 Provincial and territorial rates of reported acute hepatitis C, 2019
In 2019, the national acute hepatitis C rate was 1.8 per 100,000 population. Reporting PTs with rates above the national rate included (rates are per 100,000 population): MB (6.6), AB (3.5) and BC (1.9). In contrast, QC (0.2), NU (0.0), and YT (0.0) all reported rates lower than the national rate. The greatest proportion of reported acute hepatitis C cases in Canada came from AB (43.3%), followed by BC (27.8%), MB (25.3%) and QC (3.7%). NU and YT reported zero cases in 2019.
5.0 Discussion
Hepatitis B
Acute hepatitis B
The number of reported acute hepatitis B cases offers valuable insight into current transmission trends and patterns, as they approximate incident cases (in other words, recently acquired infections). However, because most people with acute HBV infection are asymptomatic, the reported acute hepatitis B rate likely is underestimatedFootnote 20.
National acute hepatitis B rates are low and have plateaued, overall, over the last decade. These low rates are mainly attributable to implementing routine hepatitis B immunization programs in all PTs starting in the early 1990s and improved blood screening and infection prevention and control practices in health care settings.
In 2019, rates were highest for females 30 to 39 years old and males 40 to 59 years old. In contrast, zero cases were reported among persons 15 years and younger. Since hepatitis B vaccination programs began in Canada in the early 1990s, persons 30 years and older in 2019 are less likely to be vaccinated than younger people. Other factors may also explain higher acute infection rates among 30 to 59 years old, such as injection drug use or having lived in an hepatitis B endemic area. Unfortunately, however, routine surveillance data do not include risk factor data.
The United States of America (USA) reported similar trends of stable acute infection rates from 2010 to 2019, with a reported rate of 1.0 per 100,000 population in 2019Footnote 21. The vast majority of acute infections, 80%, occurred among persons 30 to 59 years old and 35% of cases reported injection drug useFootnote 21. While Australia does not differentiate between acute or chronic hepatitis B, their surveillance data also showed a slow decline in the number of new case notifications from 2009 to 2018, which they attributed to successful infant, adolescent catch-up and targeted vaccination programs for populations at increased risk of acquiring hepatitis BFootnote 22.
Over the last decade, acute hepatitis B rates have trended towards decline for most provinces in Canada. However, rates in MB and NB have increased rapidly over recent years, peaking in 2018. In 2016, an acute hepatitis B outbreak occurred among gbMSM in Moncton, NB, leading to the province launching a targeted vaccination campaign towards the gbMSM populationFootnote 23. In 2018, Manitoba Public Health declared an acute hepatitis B outbreak, starting in 2016, associated with the methamphetamine crisis among PWID in the Winnipeg Health RegionFootnote 24.
Chronic hepatitis B
Understanding the magnitude of chronic hepatitis B in Canada is crucial. It represents the burden of disease and the potential for transmission as the period of communicability of chronic infection is longer than in acute infection.
The rate of chronic hepatitis B in Canada in 2019 was 10.2 per 100,000 population, higher than the corresponding rate in the USA (5.9 per 100,000 population)Footnote 21. However, Canada has seen a persistent decline in national chronic HBV infection rates since 2016. Furthermore, rates have declined or plateaued across all age groups for males and females and in all provinces except for NB and NS. For both males and females aged 20 to 59 years, rates are the lowest recorded in the past ten years. In 2019, rates were highest for males and females 30 to 39 years old. The USA reported the highest hepatitis B rates among 30 to 49-year-olds.
While our surveillance data do not include risk factor data, the literature shows that chronic hepatitis B mainly affects people who were not vaccinated via routine hepatitis B immunization programs or have lived in hepatitis B endemic countriesFootnote 25,Footnote 26,Footnote 27,Footnote 28. Globally, hepatitis B prevalence is highest in the Western Pacific and African regionsFootnote 29.
In 2018, Canada endorsed the World Health Organization's goal of reducing new cases of chronic hepatitis B by 30% from 2015 to 2020 and by 90% from 2015 to 2030. From 2015 to 2019, the number of newly reported chronic hepatitis B cases (from all reporting PTs) decreased by 10.9%. To achieve Canada's 90% decrease goal by 2030, continued monitoring of the hepatitis B epidemic is essential for informing public health strategies and interventions.
Hepatitis C
This is the first national surveillance report from PHAC to present reported acute hepatitis C surveillance data. Acute hepatitis C cases offer insight into current transmission trends and patterns as they approximate incident cases (in other words, recently acquired infections). Six PTs (AB, BC, MB, NU, QC and YT) provided acute hepatitis C data in 2019 for a rate of 1.8 cases per 100,000 population. From the five reporting PTs (AB, BC, NU, QC and YT) that could inform trends over time, we observed that acute hepatitis C rates in 2019 were 10.1% lower than the three-year (2016 to 2018) average rate of 1.6 per 100,000 population. However, this trend should not be interpreted as a national trend since it only includes data from five PTs.
Reported cases of acute hepatitis C were younger (under 40 years old) than reported unspecified and chronic hepatitis C cases in 2019 (40 years and older). Also, there was a narrower gap in the sex distribution (55.1% of acute vs 61.1% of chronic and unspecified infections were male). In 2019, all reported hepatitis C rates and acute hepatitis C rates were highest among males and females 25 to 39 years old.
Unfortunately, routine surveillance data do not include risk factor data which would provide an improved understanding of acute hepatitis C trends. PWID are estimated to make up between 60% to 85% of new HCV infectionsFootnote 30,Footnote 31,Footnote 32. In 2014, it was estimated that 0.3% of Canada's population were using injection drugsFootnote 33. However, studies estimate that the prevalence of injection drug use is on the rise in Canada. One modelling study estimated that the PWID population in Canada increased by 32% between 2011 and 2016Footnote 32.
National hepatitis C rates rose annually from 2014 to 2018 but decreased from 2018 to 2019 for persons 15 years of age and older. This was the first notable decline in rates for 15 to 39-year-olds and persons 60 and more senior in the past decade. The 40 to 59 year age group has been on the decline since 2010.
However, for children under five years old, the 2019 national reported hepatitis C rate was the highest in the last ten years. This rate increase may result from increased vertical transmission (which is the most common mode of HCV transmission for children)Footnote 34,Footnote 35. It may also be associated with the observed increased hepatitis C rates noted among reproductive-aged women from 2014 to 2018. In the USA, hepatitis C prevalence among pregnant women increased from 139 to 169 per 100,000 population from 2011 to 2014 Footnote 36.
There is some heterogeneity in the hepatitis C epidemic in Canada. While most jurisdictions have plateaued or showed declining hepatitis C rates over the last five years, nine PTs reported rates above the national rate in 2019. Fortunately, however, most PTs experienced a decline in reported rates from 2018 to 2019 (ranging from -3.6% to -40.4%).
The observed hepatitis C rate decline might be a result of several overlapping factors.
First, in June 2018, national hepatitis C treatment guidelines expanded the eligibility criteria for second-generation DAAs (with cure rates of >95%) to all persons living with chronic infectionFootnote 37. Before this, the guideline only recommended treatment for persons with cirrhosis or liver failure. As described in the "Progress Toward Viral Hepatitis Elimination in Canada 2021 Report", annual DAA prescribing counts increased in five provinces from 2016 to 2019. However, in four other provinces, annual prescriptions rose from 2016 to 2018 but decreased slightly in 2019. Data was unavailable for the three territoriesFootnote 38. Of note, eligibility expansion occurred during different years across Canada; however, other non-disease stage-related restrictions remain and differ by PTFootnote 39. Expanding DAA eligibility may have contributed to an increase in newly reported hepatitis C cases from 2014 to 2018.
Second, harm reduction efforts have increased in Canada. There is extensive evidence that harm reduction strategies, such as needle and syringe programs (NSP), opioid agonist therapy (OAT) and supervised consumption services (SCS), are fundamental to reducing the risk of HCV transmission and reinfection among PWIDFootnote 40,Footnote 41. Partly in response to the ongoing opioid and methamphetamine crisis, federal, provincial and territorial harm reduction services have increased across Canada over the last decadeFootnote 42,Footnote 43,Footnote 44. Unfortunately, there is limited research and continuous monitoring on harm reduction uptake over the latter half of the 2010s. However, the Phase 4 (2017-2019) bio-behavioural Tracks survey of PWID in Canada found that the majority (90.1%) of participants reported using a NSP, almost half (47.3%) used some form of OAT and 13.5% used a SCS in the 12 months before the surveyFootnote 45.
Sharing used injection equipment practices also appear to be changing in Canada, but with mixed results. The Tracks survey of PWID found that self-reported borrowing of used needles or syringes decreased from 20.2% in Phase 1 (2003-2005) to 11.6% in Phase 4 (2017-2019). However, the same survey noted an increase in the proportion of participants reporting borrowing "other used injection equipment" (for example, water, filter, washers) from 29.8% in Phase 1 to 38.0% in Phase 4Footnote 45. Sharing other used injection equipment and sharing syringes appear to have a similar risk for HCV transmissionFootnote 46,Footnote 47.
Similar to the observations reported here, Australia reported a 12% hepatitis C rate increase between 2012 and 2016, with the greatest increase occurring between 2015 and 2016. This increase was hypothesized to result from increased testing in response to the availability of DAA treatment as rates decreased in 2017 and 2018Footnote 22. Meanwhile, high DAA uptake and stable risk behaviour were listed as contributors to the observed hepatitis C rate decrease. In the USA, acute hepatitis C rates increased annually between 2012 and 2019, representing a greater than 60% rate increase between 2015 and 2019Footnote 21. The steady increase in new infections in the last decade was primarily attributed to the opioid epidemic, especially among young adultsFootnote 48.
Finally, the newly observed decline in rates might be temporary and limited. There are other limitations in interpreting the drop in reported hepatitis C rates in 2019. The denominator of the number of hepatitis C tests performed by jurisdiction is not available. Also, the CNDSS surveillance data do not include risk factor data. Risk-factor data would allow for a better understanding of what is driving change in Canada's hepatitis C epidemic. Ongoing monitoring and surveillance of hepatitis C data will be essential to see if this decline becomes a trend.
6.0 Conclusion
Acute hepatitis B rates have plateaued over the last decade and chronic hepatitis B rates have been declining since 2016. National hepatitis C rates were rising from 2014 to 2018. However, rates reduced by 10.2% from 2018 to 2019. Furthermore, a hepatitis C rate drop occurred in nine provinces and territories between 2018 and 2019 and only one province reported an increase in rates.
The hepatitis B and C epidemics in Canada are heterogeneous and influenced by competing drivers. There is an ongoing crisis related to substance use, and injection drug use prevalence is estimated to be on the rise. However, harm reduction awareness and services are also growing in Canada, as are efforts to understand better and address the social determinants of health that increase the vulnerability of some populations to hepatitis B and C. Furthermore, hepatitis C treatment eligibility has expanded over recent years across Canada; thereby, creating an opportunity for treatment and cure earlier on in the course of the chronic HCV infection.
Robust sexually transmitted blood-borne infections (STBBI) surveillance data provide essential information about the epidemiology of STBBI in Canada and are necessary to help inform, monitor, and evaluate public health responses to hepatitis B and C. Increased national capacity to differentiate between acute and chronic cases, combined with the collection of additional sociodemographic variables and risk factor data, would provide more insight into transmission dynamics and the behavioural and structural factors that increase the risk of infection.
7.0 Acknowledgments
The publication of this report would not have been possible without the collaboration of epidemiological units in all provinces and territories, whose continuous contribution to national HBV and HCV infection surveillance is gratefully appreciated.
This report was prepared by the CCDIC, Infectious Diseases Programs Branch, PHAC. Any comments and suggestions that would improve the usefulness of future publications are appreciated and should be sent to the attention of the Centre for Communicable Diseases and Infection Control, PHAC at sti-hep-its@phac-aspc.gc.ca.
List of supplementary figures and tables
Copies of the supplementary figures and tables are available upon request. Please e-mail the STI and Hepatitis Surveillance Section, PHAC staff at sti-hep-its@phac-aspc.gc.ca. Any comments and suggestions that would improve the usefulness of future publications are appreciated and can likewise be sent to the above e-mail address.
Table i. Reported chronic hepatitis B rates by sex and age category in Canada, 2010 to 2019
Figure i. Reported chronic hepatitis B rates by province or territory, 2010 to 2019
Table ii. Reported chronic hepatitis B rates by province or territory, 2010 to 2019
Figure ii. The proportion of all reported hepatitis C cases in Canada by age category, 2010 to 2019
Figure iii. Reported hepatitis C (all reported acute, chronic and unspecified hepatitis C cases) rates by sex and province or territory from 2010 to 2019
Table iii. Reported hepatitis C (all reported acute, chronic and unspecified hepatitis C cases) rates by sex and province or territory from 2010 to 2019
Appendix A. Reporting patterns for hepatitis B and C, 2010 to 2019
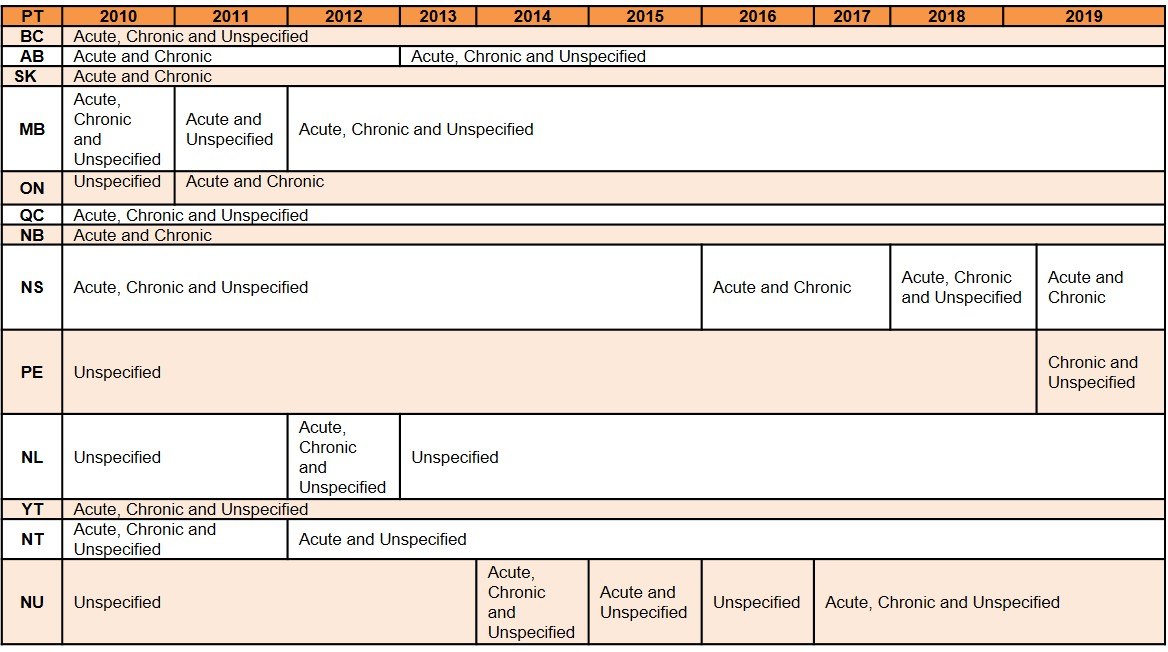
Table A - Text Equivalent
This data table shows the hepatitis B infection status reporting patterns by Canadian province or territory (PT) from 2010 to 2019. Infection status is reported as acute, chronic, or unspecified hepatitis B.
From 2010 to 2019, PTs that reported on the acute hepatitis B status were: AB, BC, MB, NB, NS, NT, QC, SK and YK. ON reported on the acute hepatitis B status from 2011 to 2019. NL reported on the acute hepatitis B status for 2012. NU reported on the acute hepatitis B status for the years 2014, 2015 and 2017 to 2019. PE did not report by the acute hepatitis B status from 2010 to 2019.
From 2010 to 2019, PTs that reported on chronic hepatitis B status were: AB, BC, NB, NS, SK, QC and YK. ON reported on the chronic hepatitis B status from 2011 to 2019. NL reported on the chronic hepatitis B status for 2012. NL reported on the chronic hepatitis B status for 2012. NT reported on the chronic hepatitis B status in 2010 and 2011. NU reported on the chronic hepatitis B status for the years 2014 and 2017 to 2019. MB reported on the chronic hepatitis B status for the years 2010 and 2012 to 2019. PE reported on the chronic hepatitis B status for the year 2019.
From 2010 to 2019, PTs that reported by the unspecified hepatitis B status: BC, MB, QC, PE, NL, NT, NU and YT. AB reported on the unspecified hepatitis B status from 2013 to 2019. ON reported by the unspecified hepatitis B status for 2010. NS reported by the unspecified hepatitis B status for the years 2010 to 2015 and 2018. NB and SK never reported by the unspecified hepatitis B status from 2010 to 2019.

Table B - Text Equivalent
This data table shows the hepatitis C infection status reporting patterns by Canadian province or territory (PT) from 2010 to 2019. Infection status is reported as acute, chronic or unspecified hepatitis C.
Acute hepatitis C reporting patterns by PT: AB, BC, QC and YT reported on the acute hepatitis C status from 2012 to 2019. NU reported on the acute hepatitis C status from 2017 to 2019. MB reported on the acute hepatitis C status from 2018 to 2019. All other PTs did not report by the acute hepatitis C status from 2010 to 2019.
Chronic hepatitis C reporting patterns by PT: AB, BC, QC and YT reported on the chronic hepatitis C status from 2012 to 2019. NU reported on the chronic hepatitis C status from 2017 to 2019. MB reported on the chronic hepatitis C status from 2018 to 2019. All other PTs did not report by the chronic hepatitis C status from 2010 to 2019.
Unspecified hepatitis C reporting patterns by PT: BC, AB, SK, MB, ON, QC, NB, NS, PE, NL, NT and NU reported by the unspecified hepatitis C status from 2010 through 2019. YT reported by the unspecified hepatitis C status for the years 2012, 2013, and 2019.
References
- Footnote 1
-
Chu CM. Natural history of chronic hepatitis B virus infection in adults with emphasis on the occurrence of cirrhosis and hepatocellular carcinoma. Journal of Gastroenterology and Hepatology (Australia). Vol 15. Blackwell Publishing; 2000. doi:10.1046/j.1440-1746.2000.02097.x
- Footnote 2
-
Trépo C, Chan HLY, Lok A. Hepatitis B virus infection. Lancet. 2014;384(9959):2053-2063. doi:10.1016/S0140-6736(14)60220-8
- Footnote 3
-
Beech BM, Myers L, Beech DJ, Kernick NS. Human immunodeficiency syndrome and hepatitis B and C infections among homeless adolescents. Semin Pediatr Infect Dis. 2003;14(1):12-19. doi:10.1053/spid.2003.127212
- Footnote 4
-
Binka M, Butt ZA, Wong S, et al. Differing profiles of people diagnosed with acute and chronic hepatitis B virus infection in British Columbia, Canada. World J Gastroenterol. 2018;24(11):1216-1227. doi:10.3748/wjg.v24.i11.1216
- Footnote 5
-
Ranjan A, Shannon K, Chettiar J, Braschel M, Ti L, Goldenberg S. Barriers and facilitators to hepatitis B vaccination among sex workers in Vancouver, Canada: Implications for integrated HIV, STI, and viral hepatitis services. Int J Infect Dis. 2019;87:170-176. doi:10.1016/j.ijid.2019.07.032
- Footnote 6
-
Jongbloed K, Pearce ME, Pooyak S, et al. The Cedar Project: Mortality among young Indigenous people who use drugs in British Columbia. Can Med Assoc J. 2017;189(44):E1352-E1359. doi:10.1503/cmaj.160778
- Footnote 7
-
Remis RS, Liu J, Loutfy MR, et al. Prevalence of sexually transmitted viral and bacterial infections in HIV-positive and HIV-negative men who have sex with men in Toronto. PLoS One. 2016;11(7). doi:10.1371/journal.pone.0158090
- Footnote 8
-
Afdhal N, Zeuzem S, Kwo P, et al; ION-1 Investigators. Ledipasvir and sofosbuvir for untreated HCV genotype 1 infection. N Engl J Med. 2014;370(20):1889-1898. doi:10.1056/NEJMoa1402454
- Footnote 9
-
Afdhal N, Reddy KR, Nelson DR, et al; ION-2 Investigators. Ledipasvir and sofosbuvir for previously treated HCV genotype 1 infection. N Engl J Med. 2014;370(16):1483-1493. doi:10.1056/NEJMoa1316366
- Footnote 10
-
Yin S, Barker L, White JZ, Jiles RB. Sofosbuvir-based regimens for chronic hepatitis C in a well-insured U.S. population: patient characteristics, treatment adherence, effectiveness, and health care costs, 2013-2015. J Manag Care Spec Pharm. 2019;25(2):195-210. doi:10.18553/jmcp.2019.25.2.195
- Footnote 11
-
Public Health Agency of Canada. Hepatitis C in Canada: 2005-2010 Surveillance Report; 2011. Accessed July 23, 2021. https://publications.gc.ca/collections/collection_2012/aspc-phac/HP40-70-2012-eng.pdf
- Footnote 12
-
O'Brien SF, Yi Q-L, Fan W, Scalia V, Fearon MA, Allain J-P. Current incidence and residual risk of HIV, HBV and HCV at Canadian Blood Services. Vox Sang. 2012;103(1):83-86. doi:10.1111/j.1423-0410.2012.01584.x
- Footnote 13
-
Public Health Agency of Canada. People Living with Hepatitis C (HCV)-Canada, 2017 Infographic; 2020. https://www.canada.ca/en/public-health/services/publications/diseases-conditions/infographic-people-living-with-hepatitis-c-2017.html. Published November 2020. Accessed July 2, 2021.
- Footnote 14
-
Canadian Institute for Health Information (CIHI). Treatment of End-Stage Organ Failure in Canada, Canadian Organ Replacement Register, 2009 to 2018: Extra-Renal Transplants - Data Tables; 2019. Accessed October 26, 2020. https://www.cihi.ca/sites/default/files/document/corr-2019-ar-donor-data-tables-en.xlsx.
- Footnote 15
-
The Canadian Network on Hepatitis C Blueprint Writing Committee and Working Groups. Blueprint to Inform Hepatitis C Elimination Efforts in Canada; 2019. Accessed July 23, 2021. www.canhepc.ca/en/blueprint/publication
- Footnote 16
-
Krajden M, Cook D, Janjua NZ. Contextualizing Canada's hepatitis C virus epidemic. Can Liver J. 2018;1(4):218-230. doi:10.3138/canlivj.2018-0011
- Footnote 17
-
Public Health Agency of Canada. Case Definitions for Communicable Diseases under National Surveillance: Results of Provincial/Territorial (P/T) Consultation Process; 2009. Accessed July 23, 2021.
- Footnote 18
-
Public Health Agency of Canada. National case definition: Hepatitis C. Published August 2018. Accessed July 23, 2021. https://www.canada.ca/en/public-health/services/diseases/hepatitis-c/health-professionals-hepatitis-c/national-case-definition.html
- Footnote 19
-
Public Health Agency of Canada. Notifiable Disease Charts. Notifiable Diseases Online. Published 2020. Accessed July 23, 2021. https://diseases.canada.ca/notifiable/charts-list
- Footnote 20
-
Clinical Practise Guidelines Committee (Co-Chairs: Coffin CS, Fung SK; Committee Authors: Alvarez F, Cooper CL, Doucette KE, et al). Canadian Liver Journal. Fall 2018; 1(4):156-217. doi: https://doi.org/10.3138/canlivj.2018-0008
- Footnote 21
-
Centers for Disease Control and Prevention. Viral Hepatitis Surveillance Report - United States, 2019. Published May 2021. Accessed July 25, 2021. https://www.cdc.gov/hepatitis/statistics/2019surveillance/index.html
- Footnote 22
-
Kirby Institute and University of New South Wales Sydney. National update on HIV, viral hepatitis and sexually transmissible infections in Australia: 2009-2018. Published 2020. Accessed July 25, 2021. https://kirby.unsw.edu.au/sites/default/files/kirby/report/National-update-on-HIV-viral-hepatitis-and-STIs-2009-2018.pdf
- Footnote 23
-
Lapointe S. Hepatitis B outbreak in Moncton leads to free vaccine offer. CBC News. September 28, 2016. https://www.cbc.ca/news/canada/new-brunswick/hepatitis-b-outbreak-moncton-1.3782305#:~:text=CBC),Moncton%20is%20seeing%20an%20outbreak%20in%20cases%20of%20acute%20hepatitis,primarily%20affected%20by%20the%20outbreak. Accessed July 27, 2021.
- Footnote 24
-
Pursaga J. Report finds meth crisis contributing to increase in blood-borne illnesses. CTV News. December 11, 2018. https://winnipegsun.com/news/news-news/meth-use-causing-hepatitis-b-outbreak-in-winnipeg. Accessed July 27, 2021.
- Footnote 25
-
Yoshida EM, Sulkowski MS, Gane EJ, et al. Concordance of sustained virological response 4, 12, and 24 weeks post-treatment with sofosbuvir-containing regimens for hepatitis C virus. Hepatology. 2015;61:41-5.
- Footnote 26
-
Swain MG, Lai MY, Shiffman ML, et al. A sustained virologic response is durable in patients with chronic hepatitis C treated with peginterferon alfa-2a and ribavirin. Gastroenterology. 2010;139:1593-601.
- Footnote 27
-
Myers RP, Cooper C, Sherman M, et al. Outcomes of chronic hepatitis C therapy in patients treated in community versus academic centres in Canada: final results of APPROACH (a prospective study of peginterferon alfa-2a and ribavirin at academic and community centres in Canada). Can J Gastroenterol. 2011;25:503-10.
- Footnote 28
-
Poynard T, McHutchison J, Davis GL, et al. Impact of interferon alfa-2b and ribavirin on progression of liver fibrosis in patients with chronic hepatitis C. Hepatology.2000;32:1131-7.
- Footnote 29
-
World Health Organization. Hepatitis B. Published July 27, 2021. https://www.who.int/news-room/fact-sheets/detail/hepatitis-b. Accessed July 27, 2021.
- Footnote 30
-
Remis R. Modelling the Incidence and Prevalence of Hepatitis C Infection and Its Sequelae in Canada, 2007.Ottawa, ON: Public Health Agency of Canada;2009. https://www.phac-aspc.gc.ca/sti-its-surv-epi/model/pdf/model07-eng.pdf.
- Footnote 31
-
Public Health Agency of Canada. Epidemiology of Acute Hepatitis C Infection in Canada. Results from the Enhanced Hepatitis Strain Surveillance System (EHSSS). Ottawa, ON: PHAC; 2009. https://publications.gc.ca/collections/collection_2011/aspc-phac/HP40-41-2010-eng.pdf.
- Footnote 32
-
Jacka B, Larney S, Degenhardt L, et al. Prevalence of injecting drug use and coverage of interventions to prevent HIV and hepatitis C virus infection among people who inject drugs in Canada. American Journal of Public Health. 2020;110(1):45-50. doi:10.2105/AJPH.2019.305379.
- Footnote 33
-
Yang Q., Ogunnaike-Cooke S., Halverson J., et al. Estimated national HIV incidence rates among key subpopulations in Canada, 2014. In: 25th Annual Canadian Conference on HIV/AIDS Research;2016.
- Footnote 34
-
Cottrell EB, Chou R, Wasson N, Rahman B, Guise JM. Reducing risk for mother-to-infant transmission of hepatitis C virus: a systematic review for the U.S. Preventive Services Task Force. Ann Intern Med. 2013;158(2):109-113.
- Footnote 35
-
Wilson CB, Nizet V, Maldonado YA, Remington JS, Klein JO.(Eds.), Remington and Klein's Infectious Diseases of the Fetus and Newborn Infant, 8th ed. Philadelphia, PA: Elsevier/Saunders; 2015.
- Footnote 36
-
Koneru A, Nelson N, Hariri S, et al. Increased Hepatitis C Virus (HCV) Detection in Women of Childbearing Age and Potential Risk for Vertical Transmission — United States and Kentucky, 2011–2014. MMWR Morb Mortal Wkly Rep 2016;65:705–710. DOI: http://dx.doi.org/10.15585/mmwr.mm6528a2external icon
- Footnote 37
-
Shah H, Bilodeau M, Burak KW, et al. The management of chronic hepatitis C: 2018 guideline update from the Canadian Association for the Study of the Liver. CMAJ. 2018;190(22):E677-E687. doi:10.1503/cmaj.170453
- Footnote 38
-
Van Gennip J, Bartlett S, Butler-McPhee J, et al. Progress Towards Viral Hepatitis Elimination By 2030 in Canada: 2021 Report. Toronto, ON: Action Hepatitis Canada; May 2021. https://www.actionhepatitiscanada.ca/progressreport
- Footnote 39
-
Bartlett S, Gennip J, Marshall AD, et al. Policies For Reimbursement Of Direct-Acting Antiviral Treatment For Hepatitis C Virus Infection In Canada: A Patchwork Of Obstruction. In: Canadian Liver Meeting 2021; 2021. Accessed June 28, 2021. Abstract: P080 https://www.actionhepatitiscanada.ca/uploads/8/3/3/9/83398604/clm_2021-poster_bartlett_v2.pdf
- Footnote 40
-
Grebely J, Tran L, Degenhardt L, et al. Association Between Opioid Agonist Therapy and Testing, Treatment Uptake, and Treatment Outcomes for Hepatitis C Infection Among People Who Inject Drugs: A Systematic Review and Meta-analysis. Clinical Infectious Diseases. Published online May 24, 2020. doi:10.1093/cid/ciaa612
- Footnote 41
-
Socías ME, Ti L, Wood E, et al. Disparities in uptake of direct‐acting antiviral therapy for hepatitis C among people who inject drugs in a Canadian setting. Liver International. 2019;39(8):1400-1407. doi:10.1111/liv.14043
- Footnote 42
-
Health Canada. Canadian Drugs and Substances Strategy. Published July 8, 2019. Accessed June 28, 2021. https://www.canada.ca/en/health-canada/services/substance-use/canadian-drugs-substances-strategy.html
- Footnote 43
-
Health Canada. Canadian Drugs and Substance Strategy. Published December 12, 2016. Accessed June 28, 2021. https://www.canada.ca/content/dam/hc-sc/healthy-canadians/migration/publications/healthy-living-vie-saine/drugs-substances-strategy-2016-strategie-drogues-autre-substances/alt/pub-eng.pdf
- Footnote 44
-
Public Health Agency of Canada. Applying for funding under the Harm Reduction Fund (HRF). Published January 29, 2021. Accessed June 28, 2021. https://www.canada.ca/en/public-health/services/funding-opportunities/sexually-transmitted-blood-borne-infections/applying-funding-harm-reduction-fund.html
- Footnote 45
-
Tarasuk J, Zhang J, Lemyre A, Cholette F, Bryson M, Paquette D. National findings from the Tracks survey of people who inject drugs in Canada, Phase 4, 2017-2019. Canada Communicable Disease Report. 2020;46(5):138-148. doi:10.14745/ccdr.v46i05a07
- Footnote 46
-
Pouget ER, Hagan H, Des Jarlais DC. Meta-analysis of hepatitis C seroconversion in relation to shared syringes and drug preparation equipment. Addiction. 2012;107(6):1057-1065. doi:10.1111/j.1360-0443.2011.03765.x
- Footnote 47
-
Ball LJ, Puka K, Speechley M, et al. Sharing of Injection Drug Preparation Equipment Is Associated with HIV Infection: A Cross-sectional Study. In: Journal of Acquired Immune Deficiency Syndromes. Vol 81. Lippincott Williams and Wilkins; 2019:E99-E103. doi:10.1097/QAI.0000000000002062
- Footnote 48
-
Spach D, and Corcorran M. Hepatitis C Online: HCV Epidemiology in the United States. Published May 26th 2021. Accessed July 25, 2021. https://www.hepatitisc.uw.edu/go/screening-diagnosis/epidemiology-us/core-concept/all#citations