
Report on sexually transmitted infection surveillance in Canada, 2019
Download the alternative format
(PDF format, 1.15 MB, 29 pages)
Organization: Public Health Agency of Canada
Date published: 2022-02-25
Cat.: HP37-42E-PDF
ISBN: 2816-8879
Pub.: 220447
Table of Contents
- Acknowledgements
- Key messages
- 1.0 Introduction
- 2.0 Methods
- 3.0 Comparative trends in the number of cases and rates of reported bacterial STI in Canada overall and by sex, 2010 to 2019
- 4.0 Chlamydia
- 5.0 Gonorrhea
- 6.0 Infectious syphilis
- 7.0 Congenital syphilis
- 8.0 Discussion
- Appendix A
- References
Acknowledgements
The publication of this report would not have been possible without the collaboration of the provincial and territorial public health authorities, whose continuous contribution to national surveillance of sexually transmitted infections (STI) is gratefully appreciated.
This report was prepared by the Centre for Communicable Diseases and Infection Control, Infectious Diseases Programs Branch, Public Health Agency of Canada. Any comments or suggestions that would improve the usefulness of future publications are appreciated and should be sent to the attention of the STI and Hepatitis Surveillance Team, Centre for Communicable Diseases and Infection Control, Public Health Agency of Canada at sti-hep-its@phac-aspc.gc.ca.
Key Messages
While sexually transmitted infections (STI) are curable or manageable and prevention can reduce transmission, rates of STI have been increasing over the last decade and continue to be a significant and increasing public health concern in Canada.
Chlamydia
- Chlamydia rates have increased by 33.1% over the past decade.
- In 2019, a total of 139,386 cases of chlamydia were reported, for a rate of 370.8 cases per 100,000 population.
- This is an increase from 2018 (359.2 cases per 100,000 population).
- Between 2010 and 2019, chlamydia rates were consistently higher among females compared to males, and in 2019 more than half (58.2%) of cases were female.
- Rates are increasing faster in males than females, narrowing the gap in rates between the sexes.
- Almost three quarters (74.6%) of reported chlamydia cases were among people less than 30 years of age in 2019.
Gonorrhea
- Gonorrhea rates have almost tripled (181.7% increase) over the past decade.
- In 2019, a total of 35,443 cases of gonorrhea were reported, for a rate of 94.3 cases per 100,000 population, similar to the 2018 rate of 93.5 per 100,000.
- Between 2010 and 2019 gonorrhea rates were consistently higher among males compared to females and in 2019, two thirds (65.5%) of cases were male.
- Rates are increasing faster in males than females, widening the gap in rates between the sexes.
- More than half (51.9%) of reported gonorrhea cases were among people less than 30 years of age in 2019.
Infectious Syphilis
- Infectious syphilis rates increased almost five-fold (393.1% increase) between 2010 and 2019, the highest increase in rates of all three bacterial STI under surveillance.
- In 2019, a total of 9,245 cases of infectious syphilis were reported, for a rate of 24.6 cases per 100,000 population, an increase from 2018 rate of 17.0 cases per 100,000 population.
- From 2010 to 2019 infectious syphilis rates were consistently higher among males compared to females.
- In 2019, almost three quarters (71.7%) of cases were male.
- However, rates are increasing faster in females than in males, narrowing the gap in rates between the sexes.
- More than half (60.6%) of reported infectious syphilis cases were among people 30 years of age and older in 2019.
Congenital Syphilis
- Between 2010 and 2019, the number of congenital syphilis cases reported in Canada increased dramatically.
- There were 53 cases of congenital syphilis reported in 2019, while only five cases were reported in 2010.
1.0 Introduction
Sexually transmitted infections (STI) continue to be a significant and ever-increasing public health concern in Canada. STI are among the most common communicable infections affecting the health and lives of people worldwide. Sexually transmitted pathogens have the ability to compromise quality of life, sexual and reproductive health, and newborn and child healthFootnote 1. STI can also indirectly expedite the sexual transmission of human immunodeficiency virus (HIV) and can cause cellular changes that may precede some cancersFootnote 1Footnote 2.
Rates of notifiable STI have increased despite numerous public health interventions designed to strengthen awareness and to prevent, diagnose and treat infection. There are various potential factors that may explain these observations such as true rise in incidence, the use of improved diagnostic methods, and more effective contact tracing and case findingFootnote 2.
To address the STI epidemic, the World Health Organization, in 2016, published the Global Health Sector Strategy on Sexually Transmitted Infections, 2016-2021: Towards Ending STIsFootnote 1. Supporting the goals and targets of this global strategy, the Government of Canada, in June 2018, released the Pan-Canadian Sexually Transmitted and Blood-Borne Infection Framework for ActionFootnote 3.
In July 2019, in response to the Framework, the Government of Canada launched its action plan – Accelerating our Response: Government of Canada Five-Year Action Plan on Sexually Transmitted and Blood-Borne InfectionsFootnote 4, which emphasizes the tangible actions to be undertaken over the next five years to move Canada closer to achieving the strategic goals outlined in the Framework. Included is the development of Canadian-made targets and indicators, which will drive our domestic actions and unify us in our commitment to specific resultsFootnote 4. Given the importance that monitoring and surveillance data reporting has on measuring the success of our actions, one of the key commitments outlined is the strengthening of Canada's national surveillance systemsFootnote 4.
In July 2019, the Public Health Agency of Canada (PHAC) established a Syphilis Outbreak Investigation Coordination Committee (SOICC) to support information sharing in response to a rise in reported syphilis cases and jurisdictionally declared outbreaks. Provinces and territories (PTs) submit enhanced surveillance data on infectious and congenital syphilis to the PHAC as part of the SOICC activitiesFootnote 5.
This report provides an update on the epidemiology of three nationally notifiable bacterial STI in Canada: chlamydia, gonorrhea and syphilis (specifically, infectious and congenital syphilis) using data from 2010 to 2019, by PT, age group and sex. In addition, updated information related to congenital syphilis collected through the SOICC using data from 2018 and 2019 by PT, age group and sex have been included.
2.0 Methods
2.1 Data Sources
In Canada, the surveillance of nationally notifiable diseases is conducted by PHAC in coordination with provincial and territorial governments via the Canadian Notifiable Disease Surveillance System (CNDSS)Footnote 6. Provincial and territorial health authorities provide non-nominal data on laboratory-confirmed cases. Variables submitted by all reporting jurisdictions are: age at diagnosis, year of diagnosis, PT of diagnosis, and sex. As such, national reporting is limited to analyses of these variables. CNDSS staff validate the reported data with the submitting PT during data processing to resolve data errors or inconsistencies and maximize accuracy. Chlamydia has been nationally notifiable since 1991 while gonorrhea and syphilis have been notifiable since 1924Footnote 7. Extracts from the CNDSS are used as the basis for national surveillance reports; this report is based on data extracted in April 2021.
As part of the SOICC activities, all PTs have collected and shared enhanced syphilis surveillance data from 2018 to 2020 with PHAC. Information about congenital syphilis in this report is based on enhanced surveillance data from 2018 and 2019 that was submitted to PHAC in January 2021.
2.2 Case Definitions
Case definitions for all three nationally notifiable STI are available online at diseases.canada.ca/notifiable/diseases-list.
2.3 Data Analysis
A descriptive analysis of reported chlamydia, gonorrhea and infectious syphilis cases by year, age group, and sex was conducted using data reported to the CNDSS and to the SOICC using Microsoft Excel. All reported cases of chlamydia and gonorrhea are included in national-level analysis. Only data on infectious syphilis cases (including primary, secondary, early latent and infectious neurosyphilis stages) in addition to congenital syphilis counts and rates are presented in this report.
National annual rates of reported cases of chlamydia, gonorrhea, and infectious syphilis were computed using the number of cases reported through the CNDSS as numerators, while rates of reported congenital syphilis cases were computed using the number of cases reported through the CNDSS for 2010 to 2017, and through SOICC enhanced surveillance for 2018 to 2019 as numerators. Statistics Canada 2019 yearly population estimates were used as denominators. Rates, percentages and change in rates were calculated using unrounded numbers; no statistical procedures were used for comparative analyses. Observed trends over time must be interpreted with caution, as rates based on small numbers are prone to fluctuation over time. Previous reports may present different rates for some years due to improved diagnostic capabilities, improved duplicate removal, shortened reporting delay and changes in reporting practices at the jurisdictional level. PT reports should be considered as more up to date.
Supplementary tables are listed in Appendix A and are available upon request.
3.0 Comparative trends in the number of cases and rates of reported bacterial STI in Canada overall and by sex, 2010 to 2019
Between 2010 and 2019, chlamydia remained the most commonly reported bacterial STI in Canada, followed by gonorrhea and then infectious syphilis (Table 1). Rates of all three STI increased over this time, however the greatest rate increase was observed in infectious syphilis rates, which increased 393%. Gonorrhea rates increased 182% and chlamydia rates increased 33% in 2019 compared to 2010 (Figure 1).
| Sex | Chlamydia | Gonorrhea | Infectious Syphilis | |||
|---|---|---|---|---|---|---|
| no data | Cases | Rate per 100,000 | Cases | Rate per 100,000 | Cases | Rate per 100,000 |
| Females | 81,082 | 428.7 | 12,158 | 64.3 | 2,592 | 13.7 |
| Males | 58,096 | 311.0 | 23,202 | 124.2 | 6,631 | 35.5 |
| Total | 139,386 | 370.8 | 35,443 | 94.3 | 9,245 | 24.6 |
Figure 1. Percent change relative to the reference year of 2010 of STI rates in Canada, 2010 to 2019
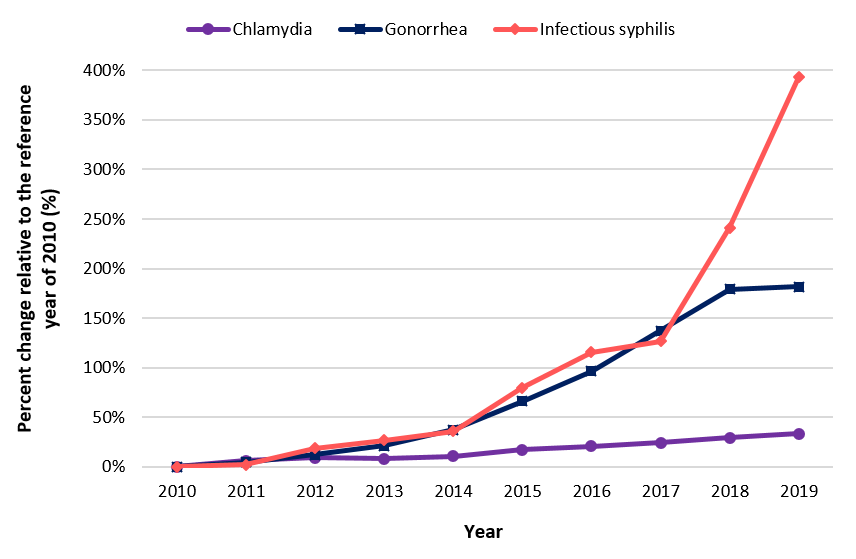
Figure 1 - Text Description
This graph displays the percent change relative to the reference year of 2010 of reported rates of chlamydia, gonorrhea and infectious syphilis in Canada from 2010 to 2019. The horizontal axis shows the calendar years from 2010 to 2019. The left vertical axis shows the percent change relative to the reference year of 2010.
| Year | Percent change relative to the reference year of 2010 (%) | ||
|---|---|---|---|
| Chlamydia | Gonorrhea | Infectious Syphilis | |
| 2010 | 0.0 | 0.0 | 0.0 |
| 2011 | 6.0 | 4.2 | 2.1 |
| 2012 | 8.9 | 12.1 | 18.6 |
| 2013 | 7.8 | 21.2 | 26.6 |
| 2014 | 10.7 | 37.1 | 35.7 |
| 2015 | 17.1 | 65.8 | 79.7 |
| 2016 | 20.5 | 96.2 | 115.3 |
| 2017 | 24.1 | 137.3 | 126.7 |
| 2018 | 29.0 | 179.3 | 241.2 |
| 2019 | 33.1 | 181.7 | 393.0 |
From 2010 to 2019, chlamydia rates were consistently higher among females compared to males. In contrast - for gonorrhea and infectious syphilis - rates were consistently higher among males compared to females. The gap between male and female rates is narrowing for chlamydia and infectious syphilis, but widening for gonorrhea.
4.0 Chlamydia
Chlamydia is an infection caused by Chlamydia trachomatis and has been nationally notifiable since 1991. It remains the most commonly reported bacterial STI in Canada and worldwide with an estimated 127 million cases globally in 2018Footnote 8Footnote 9. Rates in Canada have been increasing steadily since 1997Footnote 2.
4.1 Chlamydia in Canada, trends overall and by sex, 2010 to 2019
Between 2010 and 2019, the number of reported chlamydia cases continued to increase, from 94,716 to 139,386. The corresponding overall rate in 2019 was 370.8 cases per 100,000 population, an increase of 33.1% from the rate in 2010 (278.5 cases per 100,000 population) (Figure 2). On average, over the past decade, nationally reported chlamydia rates have increased by 3.7% per year.
Between 2010 and 2019, rates of chlamydia were consistently higher in females than in males. However, reported rates of chlamydia are increasing faster in males than females, narrowing the gap in between the sexes (Figure 2). Over the last decade, the male rate increased 63.3%, while the rate in females increased 17.6%. The male to female ratio was 0.5:1.0 in 2010, compared to 0.7:1.0 in 2019, reflecting a greater proportion of male cases in 2019 than in 2010. In 2019, 58.2% of cases were among females.
Figure 2. OverallFigure 2 footnote a and sex-specific rates of reported chlamydia cases in Canada, 2010 to 2019
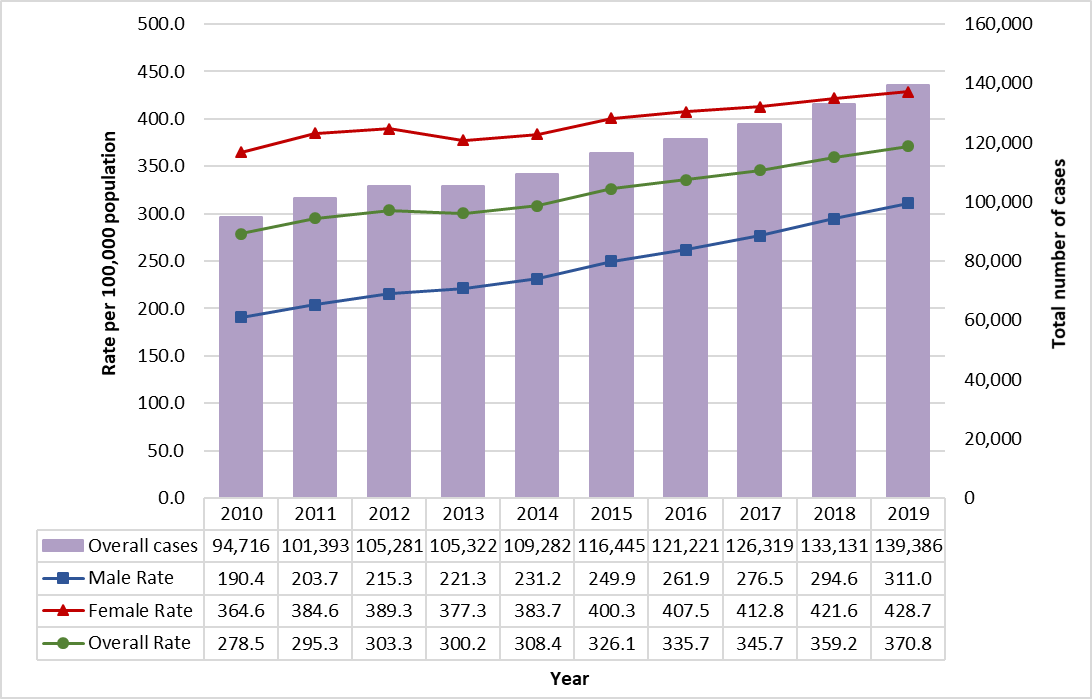
Figure 2 - Text Description
This graph displays the overall number of reported cases, as well as the overall and sex-specific rates of reported chlamydia cases, between 2010 and 2019 in Canada. The horizontal axis shows the calendar years from 2010 to 2019. The vertical axis shows the rate of reported chlamydia cases per 100,000 population for male, female, and overall, as well as the total number of reported cases of chlamydia.
| Year | Total number of cases |
Rate per 100,000 population | ||
|---|---|---|---|---|
| Male rate | Female rate | Overall rate | ||
| 2010 | 94,716 | 190.4 | 364.6 | 278.5 |
| 2011 | 101,393 | 203.7 | 384.6 | 295.3 |
| 2012 | 105,281 | 215.3 | 389.3 | 303.3 |
| 2013 | 105,322 | 221.3 | 377.3 | 300.2 |
| 2014 | 109,282 | 231.2 | 383.7 | 308.4 |
| 2015 | 116,445 | 249.9 | 400.3 | 326.1 |
| 2016 | 121,221 | 261.9 | 407.5 | 335.7 |
| 2017 | 126,319 | 276.5 | 412.8 | 345.7 |
| 2018 | 133,131 | 294.6 | 421.6 | 359.2 |
| 2019 | 139,386 | 311.0 | 428.7 | 370.8 |
- Figure 2 footnote a
-
Overall includes unspecified sex.
4.2 Chlamydia in Canada by age and sex, 2010 to 2019
Between 2010 and 2019, the largest absolute difference in rates was in people aged 20 to 24, increasing by 423.6 cases per 100,000 population (28.3% increase). As in previous years, the highest rate of reported chlamydia cases in 2019 was among the 20 to 24 year age group (1,922.5 cases per 100,000 population), followed by the 15 to 19 and 25 to 29 year age groups (1,303.9 and 1,073.6 cases per 100,000, respectively).
Older cohorts (30 years of age and over) had the lowest rates but experienced the largest relative change in rate in the past ten years. Between 2010 and 2019, people in the 40 to 59 age group had the largest relative increase in rate (114.6%), from 49.0 to 105.1 cases per 100,000 population, followed by those 60 years of age and older (90.2% increase), from 4.2 to 7.9 cases per 100,000 population.
This was also observed in males. Between 2010 and 2019, reported rates in males 40 to 59 years old increased by 163% (from 50.6 to 132.8 per 100,000 males), by 106% in males 60 years of age and older (from 6.3 to 13.1 per 100,000 males) and by 104% in 30 to 39 year old males (from 238.8 to 487.5 per 100,000 males) (Figure 3).
Figure 3. Male rates of reported chlamydia cases in Canada, by age group and year, 2010–2019
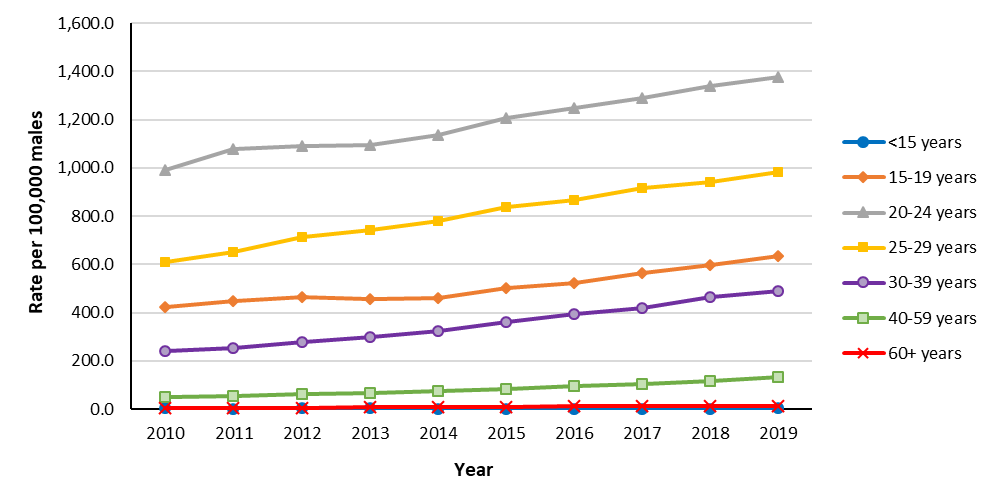
Figure 3 - Text Description
This graph displays the male rates of reported chlamydia cases by age group, between 2010 and 2019, in Canada. The horizontal axis shows the calendar years from 2010 to 2019. The vertical axis shows the rate of reported chlamydia cases per 100,000 population for age groups from under 15 years old to 60 years old and over.
| Year | Rate per 100,000 males | ||||||
|---|---|---|---|---|---|---|---|
| <15 years | 15 to 19 years | 20 to 24 years | 25 to 29 years | 30 to 39 years | 40 to 59 years | 60+ years | |
| 2010 | 2.4 | 422.2 | 992.3 | 609.1 | 238.8 | 50.6 | 6.3 |
| 2011 | 2.2 | 446.7 | 1 078.4 | 651.9 | 252.9 | 56.1 | 6.0 |
| 2012 | 2.4 | 466.4 | 1 090.6 | 714.3 | 277.2 | 62.1 | 6.3 |
| 2013 | 2.3 | 455.4 | 1 095.6 | 744.0 | 300.4 | 66.8 | 7.7 |
| 2014 | 1.4 | 460.6 | 1 135.8 | 777.9 | 324.7 | 72.9 | 9.2 |
| 2015 | 1.9 | 503.7 | 1 207.5 | 838.7 | 362.6 | 83.2 | 10.2 |
| 2016 | 1.9 | 522.2 | 1 249.2 | 866.3 | 393.2 | 94.0 | 10.8 |
| 2017 | 2.2 | 562.3 | 1 287.9 | 917.9 | 419.8 | 102.0 | 12.5 |
| 2018 | 2.0 | 596.7 | 1 338.7 | 939.3 | 464.6 | 115.4 | 11.5 |
| 2019 | 2.8 | 632.9 | 1 376.6 | 981.2 | 487.5 | 132.8 | 13.1 |
While reported rates in females 30 years and older remained low compared to other age groups, they experienced the largest relative increases since 2010. Between 2010 and 2019, reported rates in 40 to 59 year old females increased by 64.0% (from 47.4 to 77.7 per 100,000 females), by 49.1% in 30 to 39 year old females (from 288.1 to 492.4 per 100,000 females) and by 45.8% in females 60 years of age and older (from 2.3 to 3.4 per 100,000 females) (Figure 4).
Figure 4. Female rates of reported chlamydia cases in Canada, by age group and year, 2010 to 2019
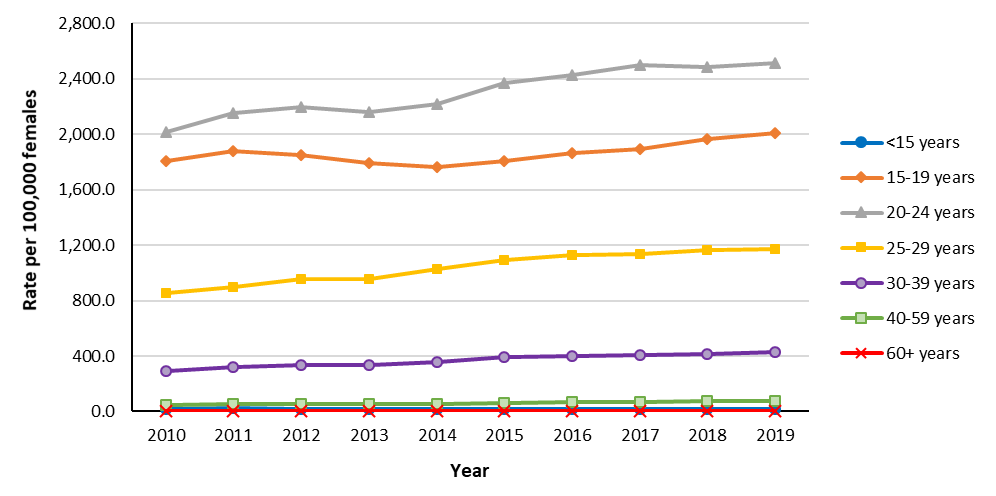
Figure 4 - Text Description
This graph displays the female rates of reported chlamydia cases by age group, between 2010 and 2019, in Canada. The horizontal axis shows the calendar years from 2010 to 2019. The vertical axis shows the rate of reported chlamydia cases per 100,000 population for age groups from under 15 years old to 60 years old and over.
| Year | Rate per 100,000 females | ||||||
|---|---|---|---|---|---|---|---|
| <15 years | 15 to 19 years | 20 to 24 years | 25 to 29 years | 30 to 39 years | 40 to 59 years | 60+ years | |
| 2010 | 20.7 | 1 803.8 | 2 018.2 | 853.5 | 288.1 | 47.4 | 2.3 |
| 2011 | 21.8 | 1 879.8 | 2 150.1 | 896.7 | 317.9 | 50.6 | 3.0 |
| 2012 | 19.6 | 1 850.7 | 2 198.4 | 953.9 | 338.0 | 55.4 | 3.1 |
| 2013 | 20.7 | 1 789.2 | 2 158.6 | 956.6 | 333.9 | 53.5 | 2.4 |
| 2014 | 20.1 | 1 765.8 | 2 221.6 | 1 026.6 | 356.9 | 56.8 | 3.1 |
| 2015 | 20.5 | 1 804.6 | 2 367.7 | 1 093.7 | 389.7 | 63.9 | 3.0 |
| 2016 | 18.9 | 1 862.8 | 2 427.1 | 1 129.2 | 396.2 | 68.6 | 3.9 |
| 2017 | 17.5 | 1 892.2 | 2 499.0 | 1 135.0 | 403.4 | 66.9 | 3.8 |
| 2018 | 18.9 | 1 968.4 | 2 481.5 | 1 165.2 | 413.8 | 72.0 | 3.3 |
| 2019 | 19.1 | 2 005.8 | 2 513.1 | 1 168.6 | 429.4 | 77.7 | 3.4 |
People between the ages of 15 and 24 accounted for more than half (53.9%) of the reported chlamydia cases in 2019. Females accounted for the majority of cases in the younger age groups. Females less than 30 years of age accounted for 47.2% of all cases in 2019, whereas males of the same age group accounted for 27.3% of all cases.
Figure 5. Rates of reported chlamydia cases in Canada, by sex and age group, 2019
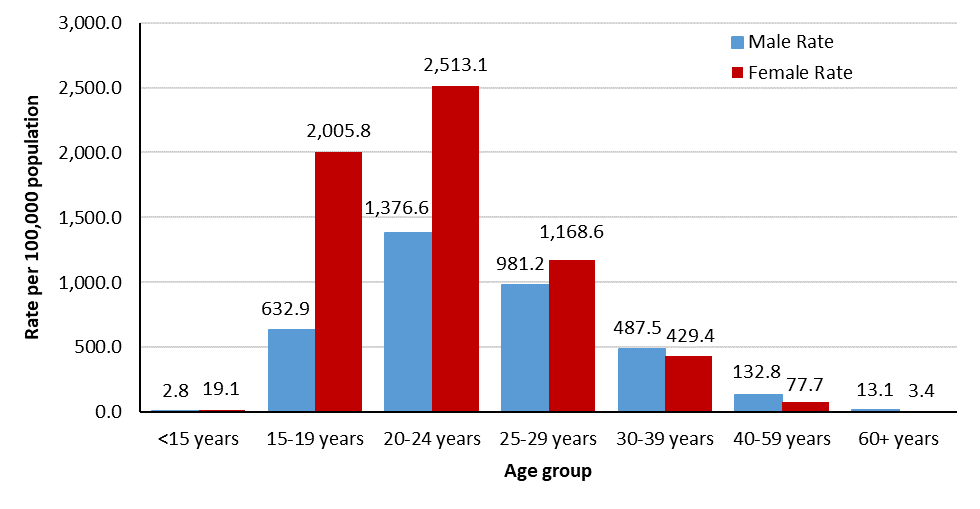
Figure 5 - Text Description
This graph displays the overall rates of reported chlamydia cases by sex and age group for 2019 in Canada. The horizontal axis shows the age groups from under 15 years old to 60 years old and over, with the blue bars representing males and the red bars representing females. The vertical axis shows the rate of reported chlamydia cases per 100,000 population for age groups and sex from under 15 years old to 60 years old and over.
| Age group | Rate per 100,000 population | |
|---|---|---|
| Male rate | Female rate | |
| <15 years | 2.8 | 19.1 |
| 15-19 years | 632.9 | 2005.8 |
| 20-24 years | 1376.6 | 2513.1 |
| 25-29 years | 981.2 | 1168.6 |
| 30-39 years | 487.5 | 429.4 |
| 40-59 years | 132.8 | 77.7 |
| 60+ years | 13.1 | 3.4 |
4.3 Chlamydia in Canada by province and territory, 2010 to 2019
The three territories have held the highest rates across Canada since 2010, however the largest relative increases occurred elsewhere. Prince Edward Island had the largest relative rate increase in the past decade (70.8%), from 150.4 to 256.9 cases per 100,000 population, and Newfoundland and Labrador had the second largest increase (61.2%) from 123.4 to 198.9 cases per 100,000 population. In 2019, rates of reported chlamydia cases varied by PT, ranging from 198.9 in Newfoundland and Labrador to 3,876.8 cases per 100,000 population in Nunavut (Figure 6).
In 2019, the proportion of male cases in all PTs remained fairly close to the national proportions of 60% female cases and 40% male. Rates of reported cases of chlamydia were highest among those aged 15 to 29 years in all PTs.
Figure 6. Rates of reported chlamydia cases in Canada, by province/territory, 2019
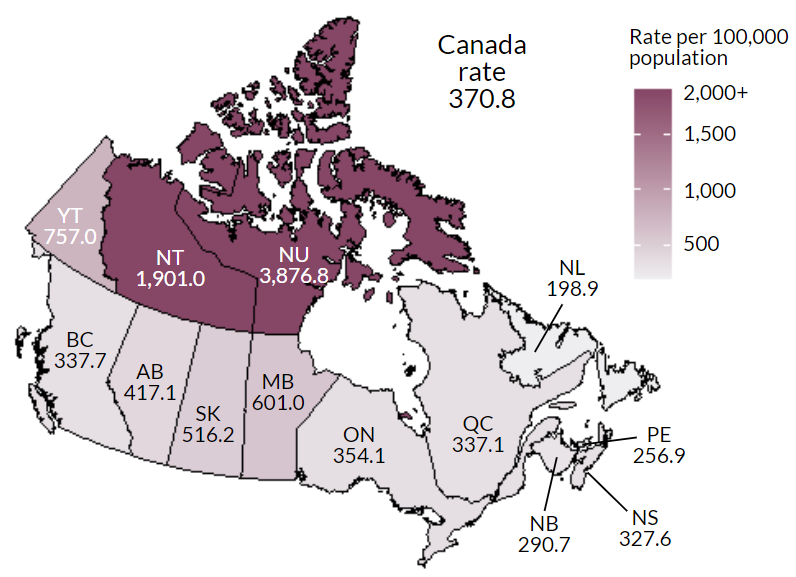
Figure 6 - Text Description
This map displays the rate of reported chlamydia cases per 100,000 population by province and territory, in 2019 in Canada.
| PT | Rate per 100,000 population |
|---|---|
| BC | 337.7 |
| AB | 417.1 |
| SK | 516.2 |
| MB | 601.0 |
| ON | 354.1 |
| QC | 337.1 |
| NB | 290.7 |
| NS | 327.6 |
| PE | 256.9 |
| NL | 198.9 |
| YT | 757.0 |
| NT | 1 901.0 |
| NU | 3 876.8 |
| Canada | 370.8 |
5.0 Gonorrhea
Gonorrhea, an infection caused by Neisseria gonorrhoeae, has been nationally notifiable since 1924 and remains the second most commonly reported bacterial STI in CanadaFootnote 10Footnote 11. Untreated gonococcal infections can lead to complications for both sexes, with more severe consequences for womenFootnote 10Footnote 11.
5.1 Gonorrhea in Canada, trends overall and by sex, 2010 to 2019
In 2019, 35,443 cases of gonorrhea were reported nationally, corresponding to a rate of 94.3 cases per 100,000 population,181.7% higher than the 2010 rate of 33.5 cases per 100,000 population. Starting in 2012, the number and rate of reported gonorrhea cases began increasing annually before stabilizing between 2018 and 2019 from 93.5 to 94.3 cases per 100,000 (Figure 7).
From 2010 to 2019, male rates have been consistently higher than female rates. Male rates have also increased more quickly than female rates, creating a wider gap between male and female rates (Figure 7). The 2019 gonorrhea rate for males was 228.3% higher than the 2010 rate, almost twice the 120.7% rate increase observed among females. The national male-to-female gonorrhea ratio was 1.3:1.0 in 2010 compared to 1.9:1.0 in 2019, reflecting a greater proportion of male cases in 2019 than 2010 (Figure 7 ). In 2019, 65.5% of cases were among males.
Figure 7. OverallFigure 7 footnote a and sex-specific rates of reported gonorrhea cases in Canada, 2010 to 2019
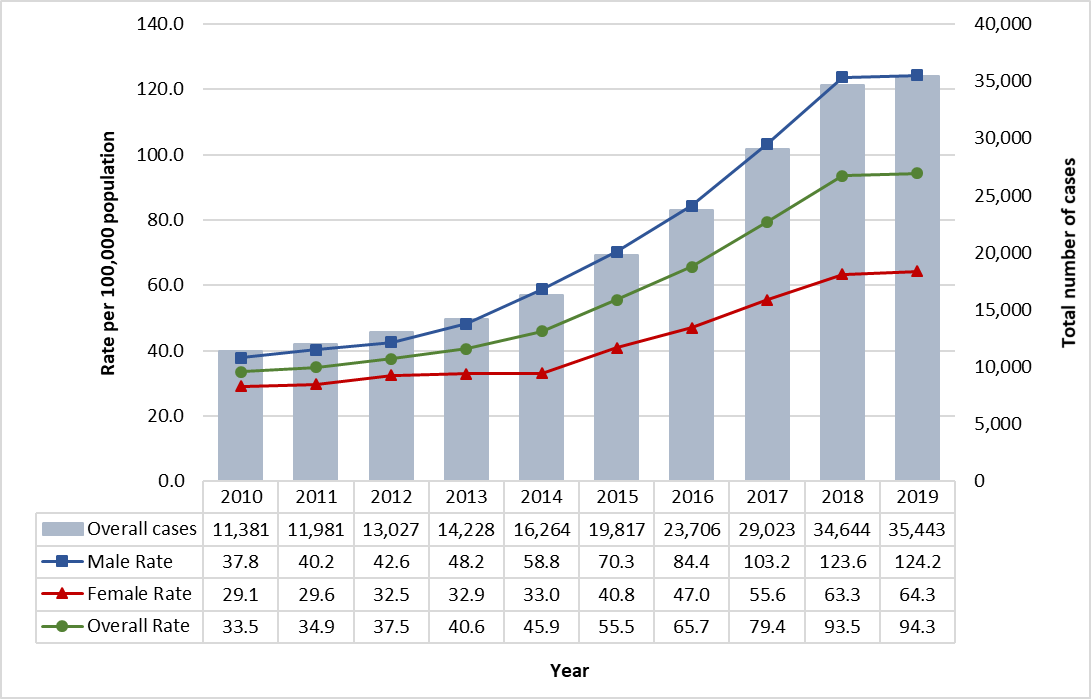
Figure 7 - Text Description
This graph displays the overall number of reported cases, as well as the overall and sex-specific rates of reported gonorrhea cases, between 2010 and 2019 in Canada. The horizontal axis shows the calendar years from 2010 to 2019. The vertical axis shows the rate of reported gonorrhea cases per 100,000 population for male, female, and overall, as well as the total number of reported cases of gonorrhea.
| Year | Total number of cases | Rate per 100,000 population | ||
|---|---|---|---|---|
| Male rate | Female rate | Overall rate | ||
| 2010 | 11,381 | 37.8 | 29.1 | 33.5 |
| 2011 | 11,981 | 40.2 | 29.6 | 34.9 |
| 2012 | 13,027 | 42.6 | 32.5 | 37.5 |
| 2013 | 14,228 | 48.2 | 32.9 | 40.6 |
| 2014 | 16,264 | 58.8 | 33.0 | 45.9 |
| 2015 | 19,817 | 70.3 | 40.8 | 55.5 |
| 2016 | 23,706 | 84.4 | 47.0 | 65.7 |
| 2017 | 29,023 | 103.2 | 55.6 | 79.4 |
| 2018 | 34,644 | 123.6 | 63.3 | 93.5 |
| 2019 | 35,443 | 124.2 | 64.3 | 94.3 |
- Figure 7 footnote a
-
Overall includes unspecified sex.
5.2 Gonorrhea in Canada by age and sex, 2010 to 2019
Between 2010 and 2019, the highest rate of gonorrhea cases occurred among 20 to 29 year olds (Figures 8 and 9). Since 2010, all age groups experienced an increase in rate, however the magnitude of the change in rate over time varied by age group. The greatest relative increase was in the 30 to 39 and 40 to 59 year age groups, (up 368.2% and 330.6% respectively, since 2010). Notably, compared to 2010, all age groups above 19 years of age more than doubled in rate, with those over the age of 25 more than tripling the rate.
Although reported rates in men 30 years and older remained low compared to younger age groups, the largest relative increases since 2010 were observed among males in this age group. Between 2010 and 2019, reported rates in males 30 to 39 years increased by 368.2% (from 42.8 to 200.6 cases per 100,000 males), 40 to 59 increased by 330.6% (from 14.1 to 60.6 cases per 100,000 males) and 60 years and older increased by 173.8% (from 4.3 to 11.6 per 100,000 males). Between 2018 and 2019, male rates in the 25 to 29, 20 to 24 and 15 to 19 year old age groups declined for the first time since 2010 (Figure 8).
Figure 8. Male rates of reported gonorrhea cases in Canada, by age group and year, 2010 to 2019
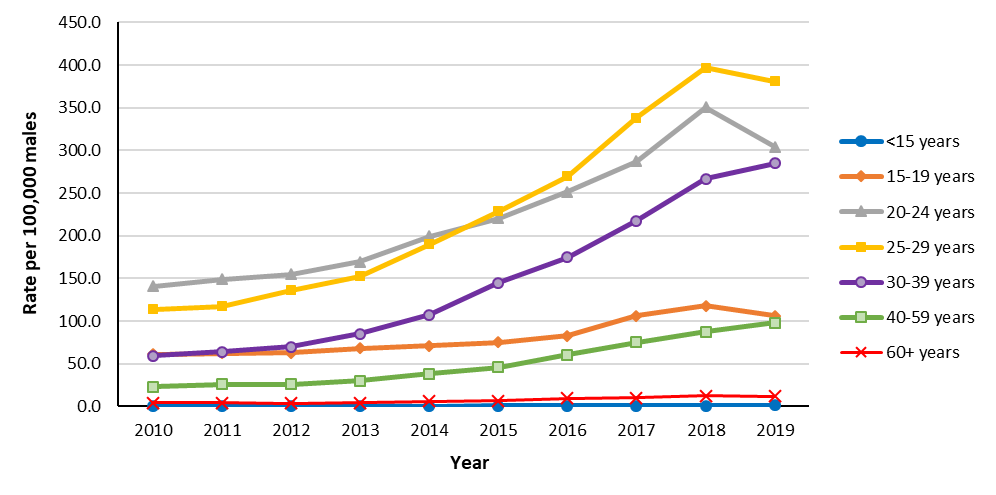
Figure 8 - Text Description
This graph displays the male rates of reported gonorrhea cases by age group, between 2010 and 2019, in Canada. The horizontal axis shows the calendar years from 2010 to 2019. The vertical axis shows the rate of reported gonorrhea cases per 100,000 population for age groups from under 15 years old to 60 years old and over.
| Year | Rate per 100,000 males | ||||||
|---|---|---|---|---|---|---|---|
| <15 years | 15 to 19 years | 20 to 24 years | 25 to 29 years | 30 to 39 years | 40 to 59 years | 60+ years | |
| 2010 | 0.8 | 60.9 | 140.6 | 113.6 | 59.3 | 23.0 | 4.3 |
| 2011 | 0.7 | 62.1 | 149.0 | 117.1 | 64.1 | 26.0 | 4.3 |
| 2012 | 0.6 | 62.8 | 154.7 | 136.4 | 70.1 | 25.8 | 3.7 |
| 2013 | 0.5 | 67.9 | 169.3 | 152.6 | 85.1 | 29.8 | 4.2 |
| 2014 | 0.3 | 70.8 | 199.6 | 190.1 | 107.3 | 38.4 | 5.8 |
| 2015 | 0.5 | 75.1 | 220.7 | 228.6 | 144.8 | 45.7 | 6.3 |
| 2016 | 0.4 | 83.0 | 251.6 | 269.7 | 174.7 | 60.2 | 9.3 |
| 2017 | 0.7 | 106.1 | 287.3 | 338.2 | 217.4 | 75.2 | 10.3 |
| 2018 | 0.8 | 117.9 | 350.6 | 396.8 | 266.9 | 87.3 | 12.2 |
| 2019 | 1.2 | 106.3 | 304.1 | 381.0 | 284.9 | 98.1 | 11.6 |
Similarly, while reported rates in women 30 years and older remained low compared to other age groups, they experienced the largest relative increases since 2010. The greatest relative increase was seen in 40 to 59 year olds, which increased by 360.6%, from 5.1 to 23.6 cases per 100,000 females. The 30 to 39 year of age group increased by 333.9% (from 26.4 to 114.3 cases per 100,000 females), and by 132.0% in those 60 years and older (from 0.5 to 1.3 cases per 100,000 females) (Figure 9).
Figure 9. Female rates of reported gonorrhea cases in Canada, by age group and year, 2010 to 2019
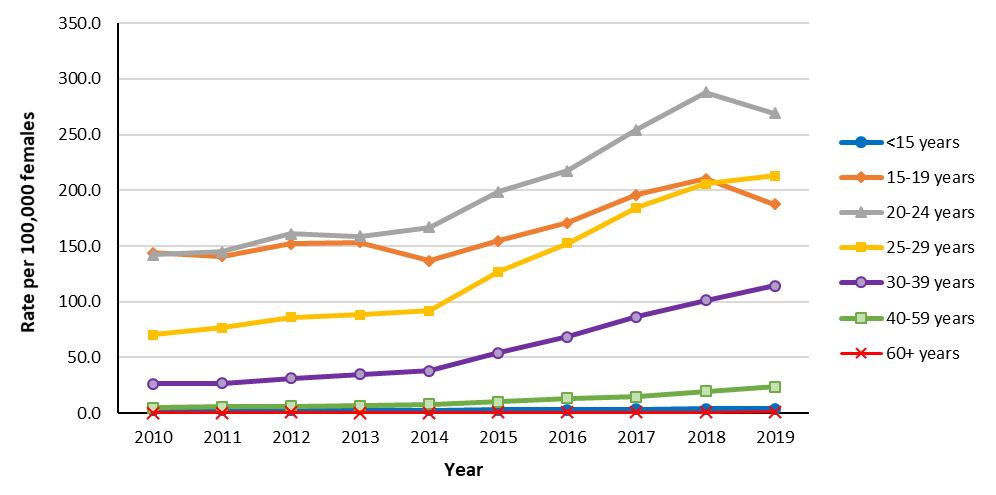
Figure 9 - Text Description
This graph displays the female rates of reported gonorrhea cases by age group, between 2010 and 2019, in Canada. The horizontal axis shows the calendar years from 2010 to 2019. The vertical axis shows the rate of reported gonorrhea cases per 100,000 population for age groups from under 15 years old to 60 years old and over.
| Year | Rate per 100,000 females | ||||||
|---|---|---|---|---|---|---|---|
| <15 years | 15 to 19 years | 20 to 24 years | 25 to 29 years | 30 to 39 years | 40 to 59 years | 60+ years | |
| 2010 | 3.0 | 143.8 | 142.0 | 70.5 | 26.4 | 5.1 | 0.5 |
| 2011 | 2.5 | 141.0 | 144.9 | 76.6 | 27.1 | 5.7 | 0.5 |
| 2012 | 2.8 | 152.0 | 160.9 | 85.9 | 31.6 | 6.2 | 0.7 |
| 2013 | 3.7 | 153.4 | 158.8 | 88.5 | 34.8 | 6.9 | 0.3 |
| 2014 | 2.7 | 136.8 | 166.8 | 91.8 | 38.3 | 8.2 | 0.5 |
| 2015 | 2.9 | 154.6 | 198.9 | 127.0 | 54.3 | 10.5 | 0.7 |
| 2016 | 3.0 | 170.7 | 217.5 | 152.4 | 68.6 | 13.4 | 0.9 |
| 2017 | 3.7 | 196.0 | 254.5 | 184.1 | 86.6 | 14.9 | 1.1 |
| 2018 | 4.2 | 210.4 | 287.9 | 205.8 | 101.2 | 19.5 | 1.0 |
| 2019 | 3.9 | 187.6 | 268.9 | 213.0 | 114.3 | 23.6 | 1.3 |
As in previous years, in 2019, the highest rates of reported gonorrhea cases among males were among those aged 20 to 29, while the highest reported rates among females were among those aged 15 to 29 (Figure 10). In 2019, male rates for those above 29 years of age were more than double those among their female counterparts; conversely female rates for those 15 to 19 years of age were almost double those among their male counterparts (Figure 10). Males accounted for the majority of cases (61.9%) in people aged 20 years and older.
Figure 10. Rates of reported gonorrhea cases in Canada, by sex and age group, 2019
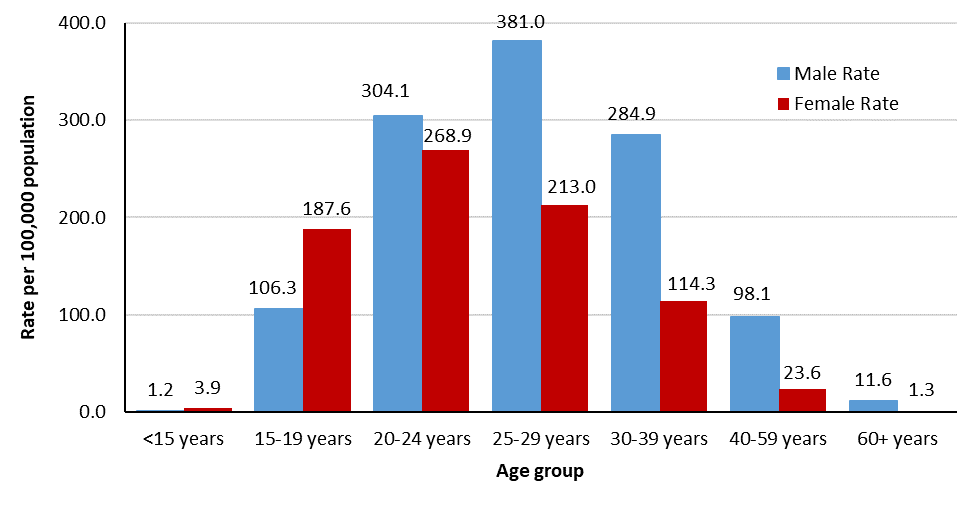
Figure 10 - Text Description
This graph presents the overall rates of reported gonorrhea cases by sex and age group for 2019 in Canada. The horizontal axis shows the age groups from under 15 years old to 60 years old and over, with the blue bars representing males and the red bars representing females. The vertical axis shows the rate of reported gonorrhea cases per 100,000 population for age groups and sex from under 15 years old to 60 years old and over.
| Age group | Rate per 100,000 population | |
|---|---|---|
| Male rate | Female rate | |
| <15 years | 1.2 | 3.9 |
| 15-19 years | 106.3 | 187.6 |
| 20-24 years | 304.1 | 268.9 |
| 25-29 years | 381.0 | 213.0 |
| 30-39 years | 284.9 | 114.3 |
| 40-59 years | 98.1 | 23.6 |
| 60+ years | 11.6 | 1.3 |
5.3 Gonorrhea in Canada by province and territory, 2010 to 2019
Since 2010, the highest rates have been observed in Nunavut and the Northwest Territories, both with rates above 1,000 cases per 100,000 population in 2019. Manitoba had the third highest rate in 2019 with 272.5 cases per 100,000 population (Figure 11). The greatest increase in reported gonorrhea rates occurred in Newfoundland and Labrador, with an increase of 340.4% followed by Alberta, with an increase of 286.1%. In 2019, rates of reported gonorrhea cases varied by PT ranging from 7.9 cases per 100,000 population in New Brunswick to 2,108.0 cases per 100,000 population in Nunavut.
The proportion of male cases ranged from 40.9% to 75.5% across PTs in 2019. Ten PTs reported having a greater proportion of male cases, and three PTs (Manitoba, Prince Edward Island and Nunavut) reported having a greater proportion of female cases. Rates of reported cases of gonorrhea were highest among those aged 20 to 29 in all PTs.
Figure 11. Rates of reported gonorrhea cases in Canada, by province/territory, 2019
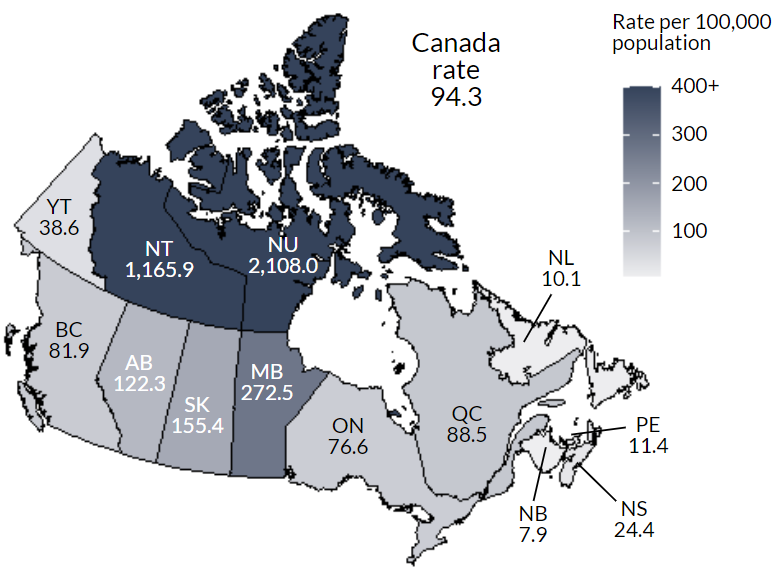
Figure 11 - Text Description
This map displays the rate of reported gonorrhea cases per 100,000 population by province and territory, in 2019 in Canada.
| PT | Rate per 100,000 population |
|---|---|
| BC | 81.9 |
| AB | 122.3 |
| SK | 155.4 |
| MB | 272.5 |
| ON | 76.6 |
| QC | 88.5 |
| NB | 7.9 |
| NS | 24.4 |
| PE | 11.4 |
| NL | 10.1 |
| YT | 38.6 |
| NT | 1 165.9 |
| NU | 2 108.0 |
| Canada | 94.3 |
6.0 Infectious Syphilis
Syphilis, an infection caused by the bacterium Treponema pallidum, has been nationally notifiable since 1924Footnote 5. Left untreated, it progresses through different stages, with primary, secondary and early latent (less than one year after the point of infection) stages being infectiousFootnote 5. Only these infectious stages are included in this report.
6.1 Infectious syphilis in Canada, trends overall and by sex, 2010 to 2019
Between 2010 and 2019, the number of reported infectious syphilis cases increased more than five-fold, from 1,696 to 9,245. The corresponding overall rate in 2019 was 24.6 cases per 100,000 population, a 393.1% increase from the 2010 rate of 5.0 cases per 100,000 population (Figure 12).
Over the last decade, rates of infectious syphilis were consistently higher in males than in females. However, reported rates of infectious syphilis have been increasing faster among females than males since 2017, narrowing the gap in between the sexes (Figure 12). Between 2010 and 2019, the male rate increased 287.9%, while the rate in females increased 1,446.8%. In 2019, the male rate was more than double the female rate, with 35.5 cases per 100,000 males compared to the female rate of 13.7 cases per 100,000 females (Figure 12).The male to female ratio was 10.3:1.0 in 2010, compared to 2.6:1.0 in 2019, reflecting that more cases of infectious syphilis were reported among males than females, but that this trend decreased over time. In 2019, 71.7% of cases were among males.
Figure 12. OverallFigure 12 footnote a and sex-specific rates of reported infectious syphilis cases in Canada, 2010 to 2019
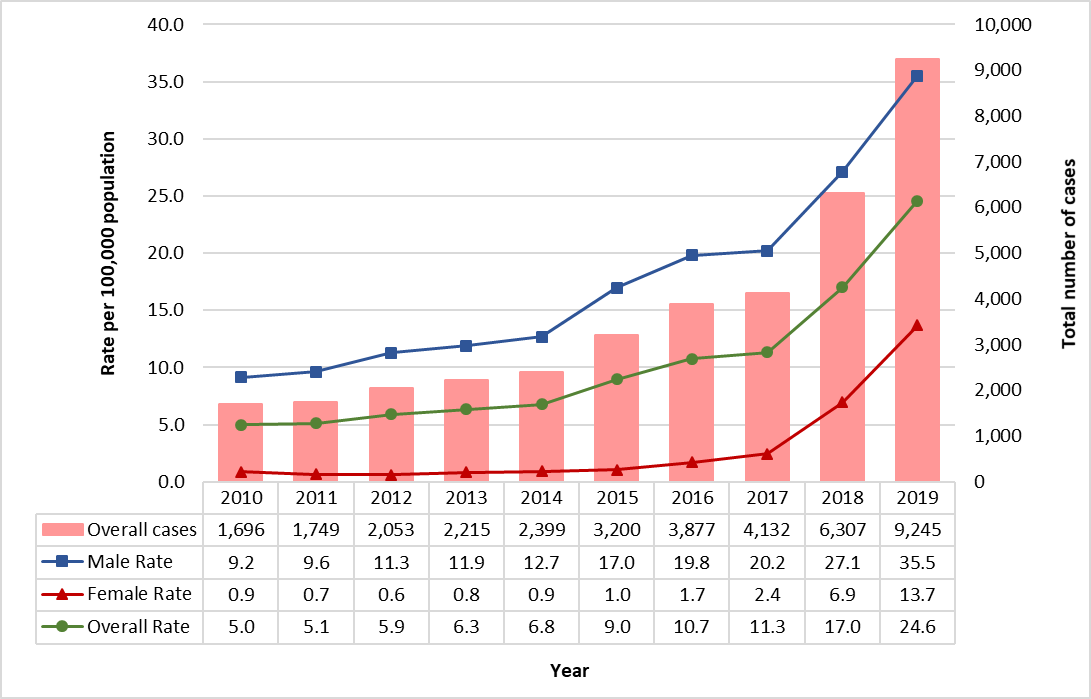
Figure 12 - Text Description
This graph displays the overall number of reported cases, as well as the overall and sex-specific rates of reported infectious syphilis cases, between 2010 and 2019 in Canada. The horizontal axis shows the calendar years from 2010 to 2019. The vertical axis shows the rate of reported infectious syphilis cases per 100,000 population for male, female, and overall, as well as the total number of reported cases of infectious syphilis.
| Year | Total numberof cases | Rate per 100,000 population | ||
|---|---|---|---|---|
| Male rate | Female rate | Overall rate | ||
| 2010 | 1,696 | 9.2 | 0.9 | 5.0 |
| 2011 | 1,749 | 9.6 | 0.7 | 5.1 |
| 2012 | 2,053 | 11.3 | 0.6 | 5.9 |
| 2013 | 2,215 | 11.9 | 0.8 | 6.3 |
| 2014 | 2,399 | 12.7 | 0.9 | 6.8 |
| 2015 | 3,200 | 17.0 | 1.0 | 9.0 |
| 2016 | 3,877 | 19.8 | 1.7 | 10.7 |
| 2017 | 4,132 | 20.2 | 2.4 | 11.3 |
| 2018 | 6,307 | 27.1 | 6.9 | 17.0 |
| 2019 | 9,244 | 35.5 | 13.7 | 24.6 |
- Figure 12 footnote a
-
Overall includes unspecified sex.
6.2 Infectious syphilis in Canada by age and sex, 2010 to 2019
Between 2010 and 2019, the largest increase was among the 25 to 29 age group, which increased by 62.1 cases per 100,000 population (687.3%). Notably, compared to 2010, rates of reported cases more than tripled among all age groups above 15 years of age, with those aged 15 to 39 increasing more than six-fold. As in previous years, the highest rate of reported infectious syphilis cases in 2019 was among the 25 to 29 year age group (71.1 cases per 100,000 population). This was followed by the 30 to 39 and 20 to 24 year age groups (56.3 and 55.6 cases per 100,000 population, respectively).
Over the past decade, males aged 25 to 29 years old have consistently reported the highest incidence rate among males. The largest relative increase among males between 2010 and 2019 was also seen in this age group, increasing by 492.0% (from 15.4 to 90.9 per 100,000 males) followed by the 30 to 39 age group (413.0% increase from 15.9 to per 81.6 cases per 100,000 males) and the 20 to 24 age group (354.0% increase from 12.9 to 58.6 cases per 100,000 males (Figure 13).
Figure 13. Males rates of reported infectious syphilis cases in Canada, by age group and year, 2010 to 2019
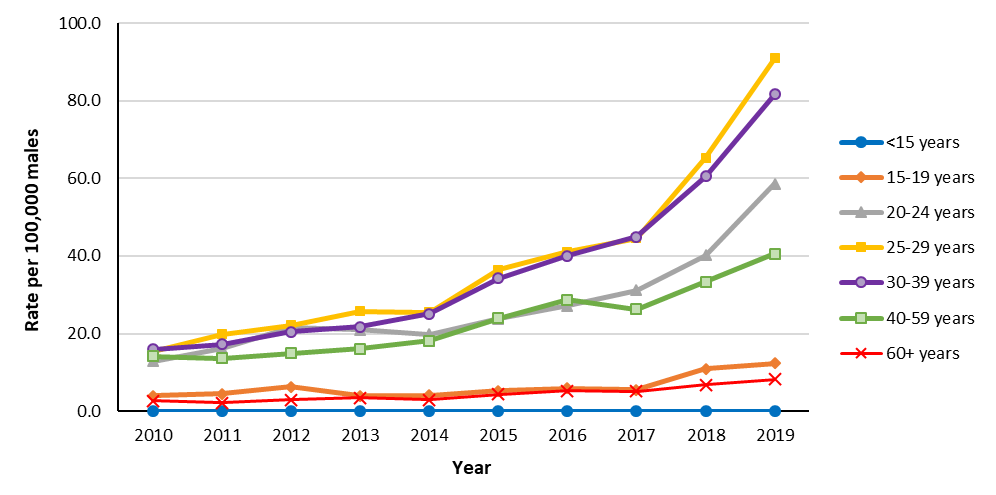
Figure 13 - Text Description
This graph displays the male rates of reported infectious syphilis cases by age group, between 2010 and 2019, in Canada. The horizontal axis shows the calendar years from 2010 to 2019. The vertical axis shows the rate of reported chlamydia cases per 100,000 population for age groups from under 15 years old to 60 years old and over.
| Year | Rate per 100,000 males | ||||||
|---|---|---|---|---|---|---|---|
| <15 years | 15 to 19 years | 20 to 24 years | 25 to 29 years | 30 to 39 years | 40 to 59 years | 60+ years | |
| 2010 | 0.0 | 3.9 | 12.9 | 15.4 | 15.9 | 14.2 | 2.6 |
| 2011 | 0.0 | 4.5 | 16.1 | 19.8 | 17.3 | 13.6 | 2.1 |
| 2012 | 0.0 | 6.3 | 21.6 | 22.2 | 20.5 | 15.0 | 2.9 |
| 2013 | 0.0 | 4.0 | 20.9 | 25.7 | 21.8 | 16.0 | 3.4 |
| 2014 | 0.0 | 4.1 | 19.9 | 25.5 | 25.0 | 18.1 | 2.9 |
| 2015 | 0.0 | 5.3 | 23.9 | 36.4 | 34.2 | 24.0 | 4.4 |
| 2016 | 0.0 | 5.9 | 27.1 | 41.1 | 40.0 | 28.7 | 5.2 |
| 2017 | 0.0 | 5.5 | 31.1 | 44.6 | 44.9 | 26.3 | 5.1 |
| 2018 | 0.0 | 10.9 | 40.2 | 65.3 | 60.6 | 33.4 | 6.8 |
| 2019 | 0.0 | 12.3 | 58.6 | 90.9 | 81.6 | 40.5 | 8.2 |
Although reported rates in females remained low from 2010 to 2019, substantial increases in all age groups 15 years and older were seen. Between 2010 and 2019, the greatest relative increase in reported rates of infectious syphilis among females was seen in 30 to 39 year olds, increasing by 1,879.8% (1.5 to 30.3 cases per 100,000 females), followed by the 25 to 29 year olds (1,784.8% increase from 3.3 to 52.0 cases per 100,000 females) and 20 to 24 year olds (1,464.6% increase from 3.3 to 52.0 cases per 100,000 females) (Figure 14).
Figure 14. Female rates of reported infectious syphilis cases in Canada, by age group and year, 2010 to 2019
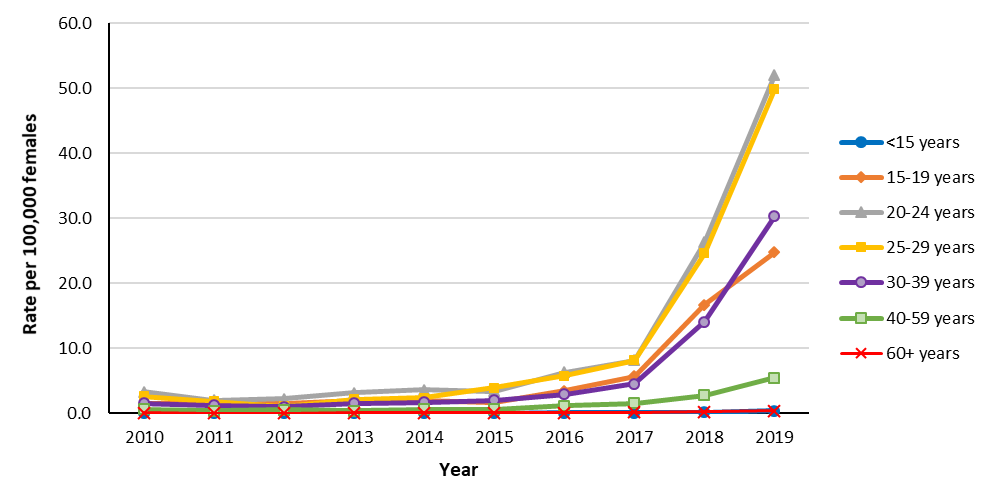
Figure 14 - Text Description
This graph displays the female rates of reported infectious syphilis cases by age group, between 2010 and 2019, in Canada. The horizontal axis shows the calendar years from 2010 to 2019. The vertical axis shows the rate of reported chlamydia cases per 100,000 population for age groups from under 15 years old to 60 years old and over.
| Year | Rate per 100,000 females | ||||||
|---|---|---|---|---|---|---|---|
| <15 years | 15 to 19 years | 20 to 24 years | 25 to 29 years | 30 to 39 years | 40 to 59 years | 60+ years | |
| 2010 | 0.0 | 1.5 | 3.3 | 2.6 | 1.5 | 0.6 | 0.1 |
| 2011 | 0.0 | 1.7 | 2.0 | 1.9 | 1.2 | 0.4 | 0.0 |
| 2012 | 0.0 | 1.5 | 2.2 | 1.1 | 1.0 | 0.5 | 0.0 |
| 2013 | 0.0 | 2.0 | 3.1 | 2.1 | 1.5 | 0.4 | 0.1 |
| 2014 | 0.0 | 2.0 | 3.6 | 2.4 | 1.7 | 0.6 | 0.0 |
| 2015 | 0.0 | 1.7 | 3.4 | 3.9 | 2.0 | 0.6 | 0.0 |
| 2016 | 0.1 | 3.5 | 6.3 | 5.7 | 2.9 | 1.1 | 0.1 |
| 2017 | 0.1 | 5.7 | 8.2 | 8.2 | 4.5 | 1.5 | 0.1 |
| 2018 | 0.1 | 16.7 | 26.3 | 24.6 | 14.1 | 2.7 | 0.2 |
| 2019 | 0.4 | 24.7 | 52.0 | 49.8 | 30.3 | 5.5 | 0.4 |
Three quarters (76.8%) of reported infectious syphilis cases in Canada in 2019 were among people aged between 25 and 59 years. Additionally, three quarters (75.9%) of cases in this age group occurred in males, while their female counterparts accounted for 23.9% of cases.
Figure 15. Rates of reported infectious syphilis cases in Canada, by sex and age group, 2019
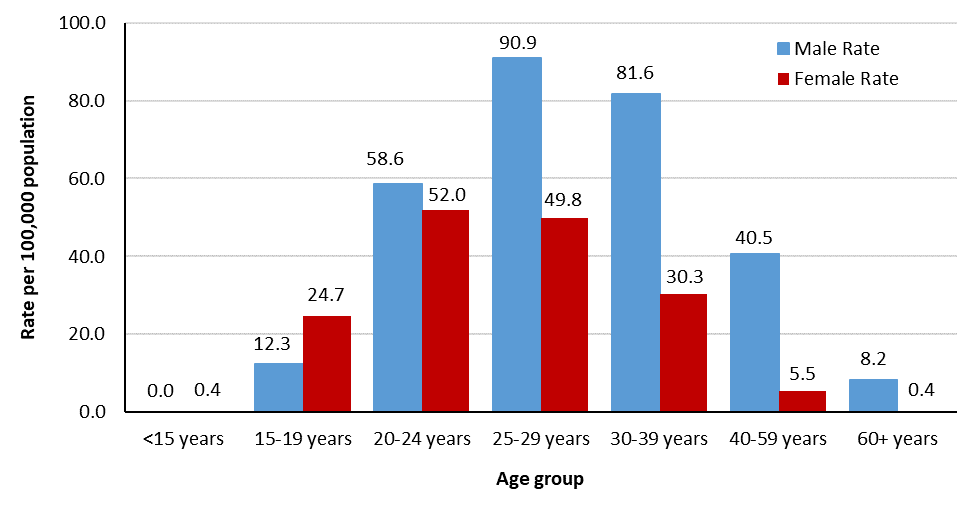
Figure 15 - Text Description
This graph presents the overall rates of reported infectious syphilis cases by sex and age group for 2019 in Canada. The horizontal axis shows the age groups from under 15 years old to 60 years old and over, with the blue bars representing males and the red bars representing females. The vertical axis shows the rate of reported infectious syphilis cases per 100,000 population for age groups and sex from under 15 years old to 60 years old and over.
| Age group | Rate per 100,000 population | |
|---|---|---|
| Male rate | Female rate | |
| <15 years | 0.0 | 0.4 |
| 15-19 years | 12.3 | 24.7 |
| 20-24 years | 58.6 | 52.0 |
| 25-29 years | 90.9 | 49.8 |
| 30-39 years | 81.6 | 30.3 |
| 40-59 years | 40.5 | 5.5 |
| 60+ years | 8.2 | 0.4 |
6.3 Infectious syphilis in Canada by province and territory, 2010 to 2019
Nunavut has reported the highest rate of infectious syphilis in Canada every year since 2012. Manitoba held the next highest rates since 2015, and reported the greatest increase in reported infectious syphilis rates between 2010 and 2019, (9,715.7%, from 1.4 per 100,000 population in 2010 to 136.7 per 100,000 population in 2019).
Rates of reported infectious syphilis cases varied by PT in 2019, ranging from 1.3 in Prince Edward Island to 266.7 per 100,000 population in Nunavut. (Figure 16).
In 2019, the majority of PTs reported a greater proportion of cases being male. Of PTs that reported more than 5 cases, British Columbia reported the greatest proportion of male cases (94%) while Nunavut reported the lowest proportion of male cases (49%). In all PTs, the highest rates of reported cases of infectious syphilis were among those aged 20 to 39.
Figure 16. Rates of reported infectious syphilis cases in Canada, by province/territory, 2019
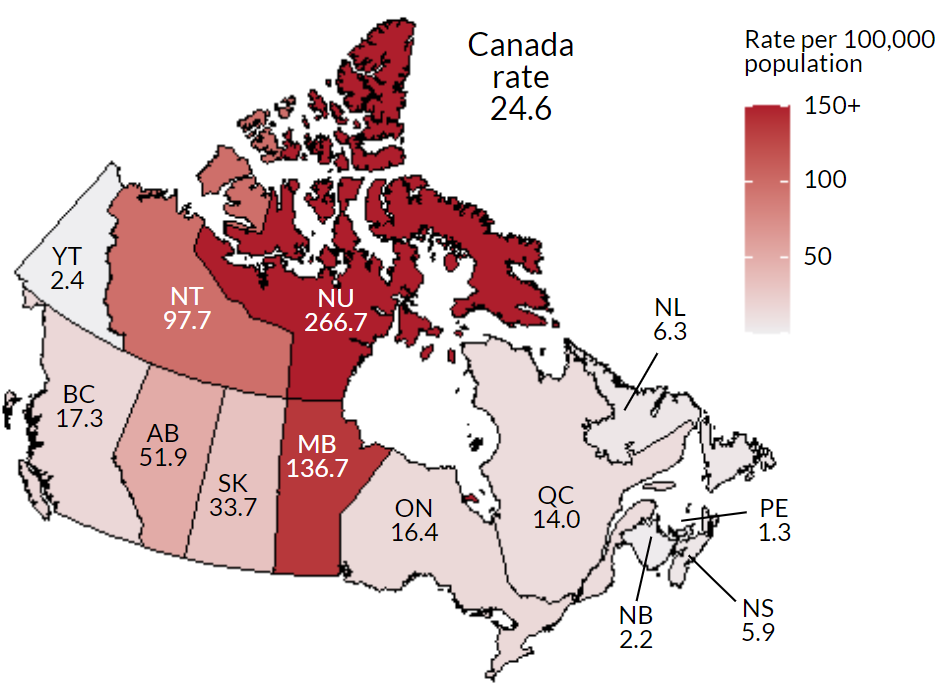
Figure 16 - Text Description
This map displays the rate of reported infectious syphilis cases per 100,000 population by province and territory, in 2019 in Canada.
| PT | Rate per 100,000 population |
|---|---|
| BC | 17.3 |
| AB | 51.9 |
| SK | 33.7 |
| MB | 136.7 |
| ON | 16.4 |
| QC | 14.0 |
| NB | 2.2 |
| NS | 5.9 |
| PE | 1.3 |
| NL | 6.3 |
| YT | 0.0 |
| NT | 97.7 |
| NU | 266.7 |
| Canada | 24.6 |
7.0 Congenital Syphilis
Congenital syphilis is caused by the vertical transmission of Treponema pallidum from a pregnant individual infected with syphilis to their fetus. Congenital syphilis may not be diagnosed until later in life, as the disease can often be asymptomatic for life or may present with symptoms that are not identified in the first few weeksFootnote 5Footnote 12. Only early congenital syphilis cases (diagnosed in those under two years of age) are reported to the SOICCFootnote 5.
From 2010 to 2017, the number of confirmed congenital syphilis cases reported in Canada ranged from one to seven. In 2018, 17 cases were reported, whereas 53 cases were reported in 2019 (Figure 17). This corresponds to a 213.4% increase in the rate of congenital syphilis cases from 2018 to 2019 (4.5 to 14.2 cases per 100,000 live births). Among females aged 15 to 39 years, a 95.8% increase in rate of infectious syphilis was observed in the same time period (from 19.4 to 38.0 cases per 100,000 females) (Figure 17).
Figure 17. Number of reported cases and rates of congenital syphilis and female rate (age 15 to 39) of infectious syphilis in Canada, 2010 to 2019
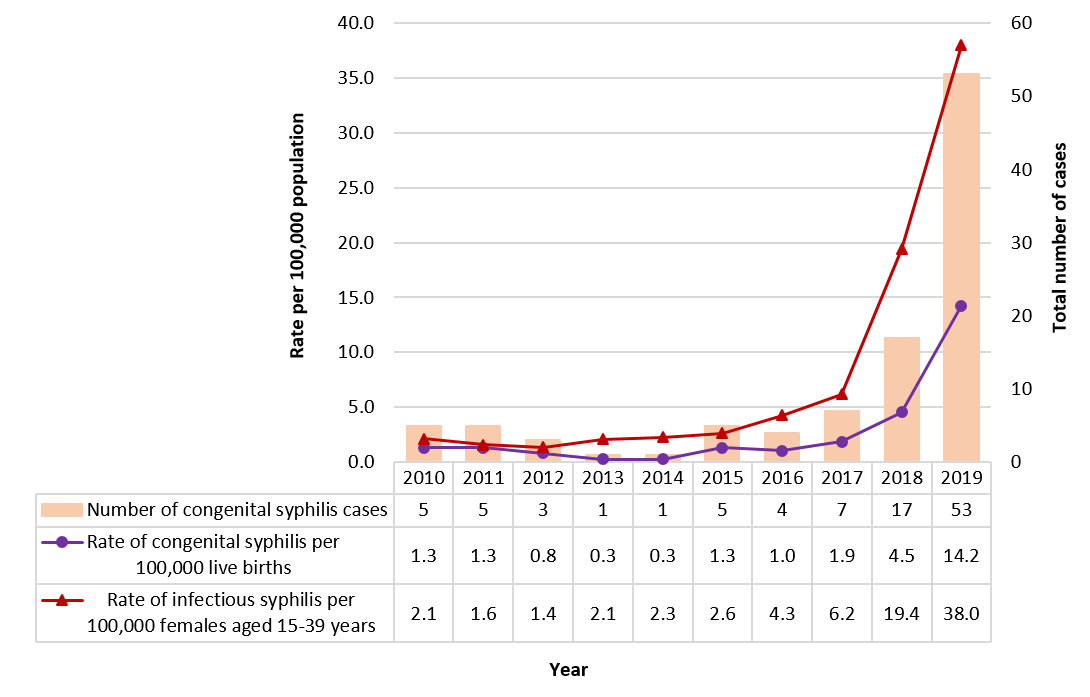
Figure 17 - Text Description
This graph displays total cases as well and overall rate of confirmed congenital syphilis, as well as the rate of infectious syphilis among females aged 15 to 39 years old in Canada between 2010 and 2019. The horizontal axis shows the calendar years from 2010 to 2019. The vertical axis shows the number of congenital syphilis cases, the rates of congenital syphilis per 100,000 live births, and the female rate of infectious syphilis among women of reproductive age (15 to 39 years old) per 100,000 females per each calendar year.
| Year | Confirmed congenital syphilis | Rate of confirmed congenital syphilis per 100,000 live births | Rate among females age 15-39 per 100,000 females |
|---|---|---|---|
| 2010 | 5 | 1.3 | 2.1 |
| 2011 | 5 | 1.3 | 1.6 |
| 2012 | 3 | 0.8 | 1.4 |
| 2013 | 1 | 0.3 | 2.1 |
| 2014 | 1 | 0.3 | 2.3 |
| 2015 | 5 | 1.3 | 2.6 |
| 2016 | 4 | 1.0 | 4.3 |
| 2017 | 7 | 1.9 | 6.2 |
| 2018 | 17 | 4.5 | 19.4 |
| 2019 | 53 | 14.2 | 38.0 |
8.0 Discussion
STI continue to remain a significant public health challenge in Canada, disproportionately affecting certain populations. Over the past decade, reported rates for chlamydia, gonorrhea and infectious syphilis continued to increase substantially. Many cases are asymptomatic or have minor symptoms until the later stages of infection. Untreated, these STI can cause infertility and other serious complications.
Chlamydia continues to be the most commonly reported STI in Canada with 139,386 cases reported across Canada in 2019. Because asymptomatic infections are common in males and females, in the absence of screening, affected individuals unaware of their status can contribute to the spread of infectionFootnote 13. Rates are higher in females than males, however male rates are increasing more quickly than female rates. This pattern of higher rates of chlamydia amongst females is similarly seen across other high income countriesFootnote 14Footnote 15Footnote 16.
The observed increases in chlamydia rates may be explained by a variety of factors including a true rise in incidence, or an increasing number of males being tested and diagnosed due to the increased availability of extra genital and urine testing for chlamydiaFootnote 2. Increased screening and more effective contact tracing practices may also have contributed to the observed rise in the rate of reported cases over the past decade.
Gonorrhea is the second most commonly reported STI in Canada. Rates have increased over the past decade, however between 2018 and 2019, the overall rate stabilized (increase of 1.5%). Rates in the 15 to 29 year old age groups declined slightly over this one year period. Whether these smaller increases and slight decreases in the past year compared to the past ten years indicate a slowing to the increasing trend will take further years of case-based surveillance to determine. The increase in gonorrhea rates since the late 1990s until 2018 may be at least partially explained by the factors thought to also affect chlamydia rates, such as the move to more sensitive testing methods and improved case findingFootnote 2. Additionally, both Canadian and other national treatment guidelines emphasize the importance of screening at other anatomical sites in some populations, which may have impacted the increase in the number of cases detected and reportedFootnote 10Footnote 14Footnote 17. The more dramatic changes observed in gonorrhea rates than chlamydia rates since the late 1990's to 2018 imply that there are likely additional drivers, such as the higher infectiousness of gonorrhea and a higher prevalence among key populations (for example, gay, bisexual and other men who have sex with men [gbMSM])Footnote 18Footnote 19.
Antimicrobial resistance (AMR) to the first-line antibiotics may also have contributed to high rates of gonorrhea. AMR can lead to ineffective treatment and ongoing transmission of uncured infectionsFootnote 20Footnote 21. Furthermore, ineffective treatment may increase the transmission of resistant strainsFootnote 20Footnote 21. The Enhanced Surveillance of Antimicrobial Resistant Gonorrhea (ESAG) program was initiated by PHAC in 2014 to better understand current trends of AMR N. gonorrhoeae, and to support the development of treatment guidelines and public health interventions to minimize the spread of AMR gonorrhea in CanadaFootnote 22. In contrast to chlamydia, observed overall rates of gonorrhea were higher in males. A similar trend has been observed in other high-income countries, including the United States of America, Australia and EnglandFootnote 14Footnote 15Footnote 16. This may be partially explained by the higher prevalence of gonorrhea among gbMSM populationsFootnote 18. Additionally, males are more likely than females to experience symptomatic infections; the presence of symptoms likely influences care-seeking behaviors and could contribute to the greater number of cases detected among malesFootnote 23. Canada's gonorrhea rates among males are consistently lower than in other high income countries, and among females, Canada has rates similar to Australia and EnglandFootnote 15Footnote 16.
The total number of reported infectious syphilis cases in 2019 was almost 5 times the number reported in 2010. Although rates of infectious syphilis among females are lower than the male rate, rates are increasing faster among females in recent years leading to a higher proportion of female cases in 2019 than in years past. Between 2018 and 2019, ten Canadian jurisdictions reported regional or PT-wide syphilis outbreaks. Surveillance data indicate a changing epidemiology of syphilis in recent years, from an infection that primarily affects gbMSM to one increasingly affecting women and younger populations among both sexes. SOICC enhanced surveillance data for 2020 has already been published, and shows a slight decline in the overall rate of infectious syphilis cases reported between 2019 and 2020Footnote 24. A similar trend has been observed in other jurisdictions, and is likely to be due to reduced availability of and access to STI services during the COVID-19 pandemic.
Similarly to Canada, rates of infectious syphilis are increasing in the United States, England, AustraliaFootnote 14Footnote 15Footnote 16. From 2010 to 2019, Canada reported the largest increase in rates of infectious syphilis compared to these other countries, although there is some variability in reporting. All of these countries show infectious syphilis rates being significantly higher among males compared to females.
Infection in females of childbearing age is of particular concern because of the potential for congenital syphilis in infants exposed to Treponema pallidum prenatally or during childbirth. Increases in the number of infants born with congenital syphilis have been observed over the period of increasing rates among women 15 to 39. The Canadian guidelines on STI screening recommend screening for syphilis in the first trimester for all women, with repeated screening at 28 to 32 weeks and again at delivery in women at high risk of acquiring syphilis or in areas experiencing heterosexual outbreaks of syphilisFootnote 25.
The surveillance data described in this report have limitations. Screening, laboratory testing and reporting practices vary across PTs, which means that direct comparison between jurisdictions should be made with caution. Finally, information about risk factors is unavailable in the CNDSS, limiting our ability to identify factors associated with higher STI rates. However, as comprehensive incidence and prevalence studies are rare, reported case rates provide valuable information about STI trends and minimum incidence rates.
STI continue to remain a serious public health concern in Canada. STI risk is influenced by many factors including: age, sex and gender identity, socioeconomic factors, culture, norms, and health policies and programsFootnote 5Footnote 26Footnote 27Footnote 28Footnote 29Footnote 30. These factors influence individual-level risk factors, such as sexual activity, substance use, experiences of violence and discrimination and access to health care and servicesFootnote 5Footnote 26Footnote 27Footnote 28Footnote 29Footnote 30. Because of this, a holistic approach to screening and treatment for STI should be taken to reach the most vulnerable. Interventions should consider the social determinants of health, and strive to foster an enabling environment for individuals to access services. Ongoing monitoring of STI will help to inform STI prevention and control activities.
Appendix A
Rates of chlamydia, gonorrhea and syphilis by age group and sex over time can be retrieved on the Notifiable Diseases in Canada website.
CNDSS data includes both infectious and non-infectious syphilis without differentiation. As such, infectious syphilis counts included in this report are not comparable to the syphilis counts reported online
Supplementary figures and tables provide data for infectious syphilis, and by PT. These tables and figures are available upon request at: phac.sti-hep-its.aspc@canada.ca.
Tables
Rates of reported chlamydia cases, by age group and province/territory, 2019
Rates of reported gonorrhea cases, by age group and province/territory, 2019
Rates of reported infectious syphilis cases, by age group and province/territory, 2019
Rates of reported infectious syphilis cases, by sex and province/territory, 2019
Rates of reported infectious syphilis cases in Canada per 100,000 overall, by age group, 2010 to 2019
Rates of reported infectious syphilis cases in Canada, per 100,000 males, by age group, 2010 to 2019
Rates of reported infectious syphilis cases in Canada, per 100,000 females, by age group, 2010 to 2019
Number of cases and rates of congenital syphilis, rates of infectious syphilis among women aged 15-39 years, and rates of infectious syphilis among females, 2010-2019
Surveillance data by province and territory, year, infection and sex, 2010-2019
Overall population estimates of provinces and territories in Canada, by year, 2010-2019
Male population estimates of provinces and territories in Canada, by year, 2010-2019
Female population estimates of provinces and territories in Canada, by year, 2010-2019
Figures
Percent change in male rates of reported cases of STI, relative to reference year 2010, 2010-2019
Percent change in female rates of reported cases of STI, relative to reference year 2010, 2010-2019
Proportion of total reported chlamydia cases, by sex and age group, 2019
Proportion of total reported chlamydia cases, by sex and province/territory, 2019
Proportion of total reported gonorrhea cases, by sex and age group, 2019
Proportion of total reported gonorrhea cases, by sex and province/territory, 2019
Proportion of total reported infectious syphilis cases, by sex and age group, 2019
Number of cases of infectious syphilis, by province/territory, 2019
Proportion of total reported infectious syphilis cases, by sex and province/territory, 2019
References
- Footnote 1
-
World Health Organization, "Global health sector strategy on sexually transmitted infections, 2016-2021," WHO, 2016.
- Footnote 2
-
Choudhri Y, Miller J, Sandhu J, Leon A, Aho J, "Chlamydia in Canada, 2010-2015," Can Commun Dis Rep, vol. 44, no. 2, pp. 49-54, 2018.
- Footnote 3
-
Public Health Agency of Canada, "Reducing the health impact of sexually transmitted and blood-borne infections in Canada by 2030: A pan-Canadian STBBI framework for action," Ottawa, 2018.
- Footnote 4
-
Public Health Agency of Canada, "Accelerating our response: Government of Canada five-year action plan on sexually transmitted and blood-borne infections," Ottawa, 2019.
- Footnote 5
-
Public Health Agency of Canada, "Syphilis in Canada, Technical Report on Epidemiological Trends, Determinants and Interventions," Ottawa, ON, 2020.
- Footnote 6
-
Public Health Agency of Canada, "Notifiable Diseases Online," 2021. [Online]. Available: https://diseases.canada.ca/notifiable/.
- Footnote 7
-
Totten S, Medaglia A, McDermott S, "Updates to the Canadian Notifiable Disease Surveillance System and its interactive website," Can Commun Dis Rep, vol. 45, no. 10, pp. 257-261, 2019.
- Footnote 8
-
Public Health Agency of Canada, "Chlamydia and LGV: Key information and resources," 2020. [Online]. Available: https://www.canada.ca/en/public-health/services/infectious-diseases/sexual-health-sexually-transmitted-infections/canadian-guidelines/chlamydia-lgv.html#a1.
- Footnote 9
-
Tien V, Punjabi C, Holubar MK, "Antimicrobial resistance in sexually transmitted infections," J Travel Med, vol. 27, no. 1, pp. 1-11, 2019.
- Footnote 10
-
Choudhri Y, Miller J, Sandhu J, Leon A, Aho J, "Gonorrhea in Canada, 2010-2015," Can Commun Dis Rep, vol. 44, no. 2, pp. 37-42, 2018.
- Footnote 11
-
Public Health Agency of Canada, "Report on Sexually Transmitted Infections in Canada, 2018", Ottawa, ON, 2021
- Footnote 12
-
Choudhri Y, Miller J, Sandhu J, Leon A, Aho J, "Infectious and congenital syphilis in Canada, 2010-2015," Can Commun Dis Rep, vol. 44, no. 2, pp. 43-48, 2018.
- Footnote 13
-
Navarro C, Jolly A, Nair R, Chen Y, "Risk factors for general chlamydial infection," Can J Infect Dis, vol. 13, no. 3, pp. 195-207, 2002.
- Footnote 14
-
Centers for Disease Control and Prevention, "Sexually Transmitted Disease Surveillance 2018," U.S. Department of Health and Human Services, Atlanta, GA, 2019.
- Footnote 15
-
Public Health England, National STI surveillance data tables 2018 - Table 1, Public Health England, 2020.
- Footnote 16
-
Kirby Institute, "HIV, viral hepatitis and sexually transmissible infections in Australia: Annual surveillance report 2018," Kirby Institute, Sydney, AU, 2018.
- Footnote 17
-
Public Health Agency of Canada, "Canadian Guidelines on Sexually Transmitted Infections: Gonococcal Infections Chapter," Government of Canada, Ottawa, 1993.
- Footnote 18
-
Kirkcaldy RD, Weston E, Segurado AC, Hughes G. Epidemiology of gonorrhoea: a global perspective. Sex Health. 2019 Sep;16(5):401-411
- Footnote 19
-
Tu W, Ghosh P, Katz BP. A Stochastic Model for Assessing Chlamydia trachomatis Transmission Risk Using Longitudinal Observational Data. J R Stat Soc Ser A Stat Soc. 2011 Oct;174(4):975-989.
- Footnote 20
-
World Health Organization (WHO). Global action plan to control the spread and impact of antimicrobial resistance in Neisseria gonorrhoeae. Geneva: WHO; 2012. Available online at: http://www.who.int/reproductivehealth/publications/rtis/9789241503501/en/ [verified 28 June 2019].
- Footnote 21
-
Unemo M, Shafer WM. Antimicrobial resistance in Neisseria gonorrhoeae in the 21st century: past, evolution, and future. Clin Microbiol Rev 2014; 27: 587–613. doi:10.1128/CMR.00010-14.
- Footnote 22
-
Public Health Agency of Canada, "Report on the Enhanced Surveillance of Antimicrobial-Resistant Gonorrhea (ESAG): Results from 2015-2017," Ottawa, 2021.
- Footnote 23
-
Costa-Lourenço APRD, Barros dos Santos KT, Moreira BM, Fracalanzza SEL, Bonelli RR, "Antimicrobial resistance in Neisseria gonorrhoeae: history, molecular mechanisms and epidemiological aspects of an emerging global threat," Brazilian Journal of Microbiology, vol. 48, no. 4, pp. 617-628, Oct 2017.
- Footnote 24
-
Public Health Agency of Canada. Infectious Syphilis and Congenital Syphilis in Canada, 2020. https://www.canada.ca/en/public-health/services/publications/diseases-conditions/infectious-syphilis-congenital-syphilis-canada-2020.html. Updated 2020. Accessed September, 2021
- Footnote 25
-
Public Health Agency of Canada. Section 6-4: Canadian Guidelines on Sexually Transmitted Infections-Specific populations – Pregnancy. 2017.
- Footnote 26
-
Badal HJ, Stryker JE, DeLuca N, Purcell DW. Swipe Right: Dating Website and App Use Among Men Who Have Sex With Men. AIDS Behav. 2018;22(4):1265-1272.
- Footnote 27
-
Gesink D., Connell J., Kimura L. What do guys know about syphilis anyways? Sex Transm Infect. 2019;95:A317. http://ovidsp.ovid.com/ovidweb.cgi?T=JS&PAGE=reference&D=emexb&NEWS=N&AN=629060501.
- Footnote 28
-
Goedel WC, Duncan DT. Geosocial-Networking App Usage Patterns of Gay, Bisexual, and Other Men Who Have Sex With Men: Survey Among Users of Grindr, A Mobile Dating App. JMIR Public Health Surveill. 2015;1(1):e4.
- Footnote 29
-
Hirshfield S, Remien RH, Humberstone M, Walavalkar I, Chiasson MA. Substance use and high-risk sex among men who have sex with men: a national online study in the USA. AIDS Care. 2004;16(8):1036-1047.
- Footnote 30
-
Hogben M, Leichliter JS. Social determinants and sexually transmitted disease disparities. Sex Transm Dis. 2008;35(12 Suppl):S13-8.