
Report on Sexually Transmitted Infections in Canada: 2013-2014
Download the alternative format
(PDF format, 1.219 MB, 44 pages)
Organization: Public Health Agency of Canada
Date published: 2017-04-
Table of contents
- Foreword
- Acknowledgements
- Executive summary
- 1.0 Methods
- 2.0 Chlamydia
- 3.0 Gonorrhea
- 4.0 Syphilis
- References
- Appendix A: Case definitions
Foreword
The Centre for Communicable Diseases and Infection Control, Public Health Agency of Canada (the Agency), is pleased to present the 2013-14 edition of the Report on Sexually Transmitted Infections in Canada. This report is intended to provide information on trends in reported cases of sexually transmitted infections (STIs) to those who are concerned with their public health implications (programs, policy makers, researchers, etc.). This report contains detailed data on reportable STIs in Canada for the years 2013 and 2014 and includes comparisons on selected rates reported in the previous ten years. A separate report on reportable STIs in Canada for the year 2013 is not being published due to the availability of updated data. The data in this report supersede those presented in earlier editions between years 2005 and 2012.
The Report on Sexually Transmitted Infections in Canada is based on surveillance reports submitted to the Agency by provincial and territorial epidemiological units; data are summarized by age, sex, and province/territory. The report consists of three chapters, each of which highlights the three main nationally notifiable STIs: chlamydia, gonorrhea, and syphilis. Technical notes and explanatory details specific to provincial or territorial surveillance data are presented at the end of the report.
The Agency endeavours to report the most accurate and up-to-date information possible; the data presented in this report were the most current available at the time of writing. However, due to the evolving nature of communicable disease surveillance, it can be expected that the number of cases reported by the provinces and territories may change due to data cleaning or reclassification of cases as more is learned from the case reports. These changes may also be reflected in the Canadian Notifiable Disease Surveillance System (CNDSS) as provinces and territories notify the Agency of changes. In cases where there are discrepancies between data reported by the Agency and those reported by individual provinces and territories, precedence should be given to provincial/territorial data as they would include the most up-to-date information. In addition, rates may change slightly from one annual report to another as a result of updated population projections and census results analysis. However, any updates are expected to be small and generally do not change the overall national trends.
Any comments and suggestions that would improve the usefulness of future publications are appreciated and should be sent to the attention of the staff of the Centre for Communicable Diseases and Infection Control, Public Health Agency of Canada at ccdic-clmti@phac-aspc.gc.ca.
Acknowledgements
The publication of this report would not have been possible without the collaboration of all provinces and territories, whose continuous contribution to national STI surveillance is greatly appreciated. The authors also gratefully acknowledge the contributions and expertise of the Sexually Transmitted and Blood-Borne Infections Surveillance Network for their review and input on this report.
This report was prepared by the Centre for Communicable Diseases and Infection Control, Infectious Disease Prevention and Control Branch, Public Health Agency of Canada.
Executive summary
Sexually transmitted infections (STIs) continue to be a significant public health concern in Canada. Rates of reported cases of chlamydia, gonorrhea, and infectious syphilis have been rising since 2000. This report describes the patterns of these three nationally reportable STIs in Canada, focusing on the past decade (2005 to 2014) and includes detailed information on the years 2013 and 2014 (no separate publication for 2013 data is being prepared).
Chlamydia
Chlamydia continues to be the most commonly reported STI in Canada. Between 2005 and 2014, rates of reported cases of chlamydia increased by 49.3%, from 206.0 to 307.4 per 100,000, with the highest relative rate increase, nearly 65%, occurring among males. In 2014, the rate of reported cases of chlamydia among females (382.5 per 100,000) was 1.7 times higher than among males (230.5 per 100,000). In both males and females, rates of chlamydia were highest in those aged 20 to 24 years, which has been the trend over the past decade.
Gonorrhea
Between 2005 and 2014, the rate of reported cases of gonorrhea increased by 61.2%, from 28.4 to 45.8 per 100,000. During the same period, the rates increased more in males (64.2%) as compared to females (55.9%). In 2014, as in previous years, the rate of reported cases of gonorrhea was higher in males than females (58.8 vs. 32.9 per 100,000). Females between the ages of 15 and 24 and males between the ages of 20 and 29 accounted for the highest rates of gonorrhea in 2014.
Syphilis
The rates of reported cases of infectious syphilis increased by 95.1% between 2005 and 2014, from 3.4 to 6.6 per 100,000. Over this timeframe, infectious syphilis rates increased among males by 115.5% and decreased among females by 18.2%. In 2014, as in previous years, the rate of reported cases of infectious syphilis in males was markedly higher than that in females (12.5 vs. 0.9 per 100,000). Among males, rates of infectious syphilis were highest among those aged 25 to 29; in females, rates were highest among those aged 20 to 24.
| Sex | Chlamydia | Gonorrhea | Infectious Syphilis | |||
|---|---|---|---|---|---|---|
| # Cases | Rates per 100,000 | # Cases | Rates per 100,000 | # Cases | Rates per 100,000 | |
| Females | 68,525 | 382.5 | 5,892 | 32.9 | 155 | 0.9 |
| Males | 40,624 | 230.5 | 10,362 | 58.8 | 2,198 | 12.5 |
| Total | 109,263 | 307.4 | 16,285 | 45.8 | 2,357 | 6.6 |
| Sex | Chlamydia | Gonorrhea | Infectious Syphilis | |||
|---|---|---|---|---|---|---|
| # Cases | Rates per 100,000 | # Cases | Rates per 100,000 | #Cases | Rates per 100,000 | |
| Females | 66,696 | 376.3 | 5,806 | 32.8 | 142 | 0.8 |
| Males | 38,482 | 220.8 | 8,394 | 48.2 | 2,038 | 11.7 |
| Total | 105,274 | 299.5 | 14,227 | 40.5 | 2,182 | 6.2 |
Rates of notifiable STIs have increased despite numerous public health interventions designed to increase awareness and to prevent, diagnose, and treat infection. There are various potential factors that may explain these observations, such as a true rise in incidence, the use of improved diagnostic methods, and more effective contact tracing and case detection. Ongoing monitoring of STI rates and research into the reasons for the observed changes will help guide and evaluate the public health response to address STIs in Canada.
1.0 Methods
In Canada, the surveillance of nationally notifiable infectious diseases is conducted by the Public Health Agency of Canada (the Agency) in coordination with provincial and territorial governments, which voluntarily provide non-nominal data to the Agency. Responsibility for primary collection of notifiable disease data typically falls to local public health authorities according to provincial/territorial legislationFootnote 1.
The Agency collects and manages data received from the provinces and territories via the Canadian Notifiable Disease Surveillance System (CNDSS). CNDSS staff validate reported data with the submitting province or territory during data processing to resolve data errors or inconsistencies and maximize accuracy. Variables submitted by all reporting jurisdictions are: age at diagnosis, year of diagnosis, province/territory of diagnosis, and sex. As such, national reporting is limited to analyses of these variables. Extracts from the CNDSS are used as the basis for national surveillance reports; this report is based on data extracted in July 2016. Data for all three notifiable STIs (chlamydia, gonorrhea, and infectious syphilis) were available from all provinces and territories from 2005 to 2014. It should be noted that chlamydia cases reported by Newfoundland and Labrador in 2007 were not broken down by age and sex.
Case definitions
Case definitions for all three nationally notifiable sexually transmitted infections are available in Appendix A. All reported cases of chlamydia and gonorrhea are included in national-level analyses; only data on infectious syphilis cases (including primary, secondary, early latent and infectious neurosyphilis stages) are presented in this report.
Data analysis
A descriptive analysis of reported chlamydia, gonorrhea and infectious syphilis cases by year, age group, and sex was conducted using data reported to the CNDSS. Demographic patterns in age and sex were examined in cases reported in 2013 and 2014 to provide a more detailed snapshot of the most recently available data. Rates are given per 100,000 population. Observed trends over time must be interpreted with caution as rates based on small numbers are more prone to fluctuation over time. Improved diagnostic capabilities, improved duplicate removal, shortened reporting delay and changes in reporting practices at the jurisdictional level can also contribute to changes.
Rates of reported cases per 100,000 population were calculated using CNDSS data as numerators and population estimates from Statistics Canada as denominators. Congenital syphilis rates were calculated per 100,000 live births using live birth data from Statistics CanadaFootnote 2. As population denominator data have been updated, rates may differ from those presented in previous reports; however, the differences are likely to be small.
National chlamydia rates were adjusted for 2007 to account for the lack of age and sex breakdown in these data reported by Newfoundland and Labrador in that year.
2.0 Chlamydia
2.1 Introduction
Chlamydia is an infection caused by the bacterium Chlamydia trachomatis and has been nationally notifiable since 1991. Infections are often asymptomatic in both males and females, and thus may remain undiagnosed in the absence of screening and thereby contribute to the spread of chlamydia in sexually active individualsFootnote 3.
A common complication associated with untreated and recurring chlamydia in females is pelvic inflammatory disease, which can lead to chronic pelvic pain, ectopic pregnancy, and infertility. Untreated chlamydia in pregnant women can be transmitted to their newborns, causing neonatal conjunctivitis or pneumonia. In males, complications are rarer but include infections of genital organs and infertility. As with other STIs, chlamydia has a synergistic effect with human immunodeficiency virus (HIV) and increases the risk of transmission of HIV as well as the severity of the infectionFootnote 4Footnote 5.
It is estimated that more than 50% of infected males and 70% of infected females are asymptomatic and uninformed of their infection statusFootnote 6.
2.2 National trends
The ten-year trend, from 2005 to 2014, in the overall rate of reported cases of chlamydia has been one of steady increase, except for a slight decrease in 2013 (Figure 1). In 2014, 109,263 cases of chlamydia were reported, corresponding to a rate of 307.4 per 100,000, which was a 49.2% increase from the rate of 206.0 per 100,000 in 2005. Among males, rates increased by 64.6%, from 140.0 to 230.5 per 100,000; among females, they increased by 41.4%, from 270.4 to 382.5 per 100,000.
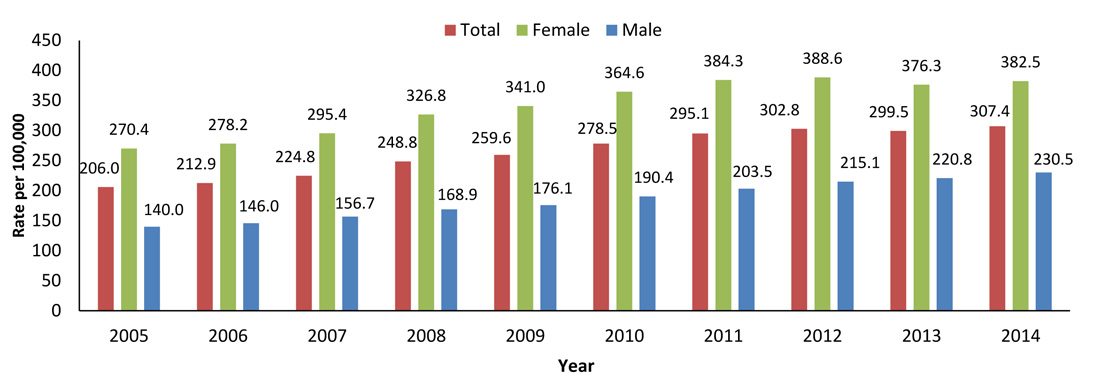
Figure 1 - Text Equivalent
| Sex | 2005 | 2006 | 2007 | 2008 | 2009 | 2010 | 2011 | 2012 | 2013 | 2014 |
|---|---|---|---|---|---|---|---|---|---|---|
| Total | 206.0 | 212.9 | 224.8 | 248.8 | 259.6 | 278.5 | 295.1 | 302.8 | 299.5 | 307.4 |
| Female | 270.4 | 278.2 | 295.4 | 326.8 | 341.0 | 364.6 | 384.3 | 388.6 | 376.3 | 382.5 |
| Male | 140.0 | 146.0 | 156.7 | 168.9 | 176.1 | 190.4 | 203.5 | 215.1 | 220.8 | 230.5 |
Generally, overall rates of reported cases of chlamydia in females are substantially higher than corresponding rates in males; in 2014, the rate of reported chlamydia cases was 1.7 times higher in females as compared to males (Figure 1). However, the chlamydia rate ratio between the sexes varies with age group. In 2014, the rate among females was 3.8 times higher than that of males; similarly, the rate was nearly twice as high in females as in males among those aged 20 to 24. Among older age groups, the gap between sexes was less pronounced and even reversed; the rate of reported cases was higher among men than women in those aged 40 to 59 and 60+ (Figure 2). Persons aged 15 to 29 comprised nearly 80% of chlamydia cases reported in 2014. The highest rates in both males and females were reported among those aged 20 to 24 (Figure 2). Similar trends were observed in year 2013 (Figure 3).
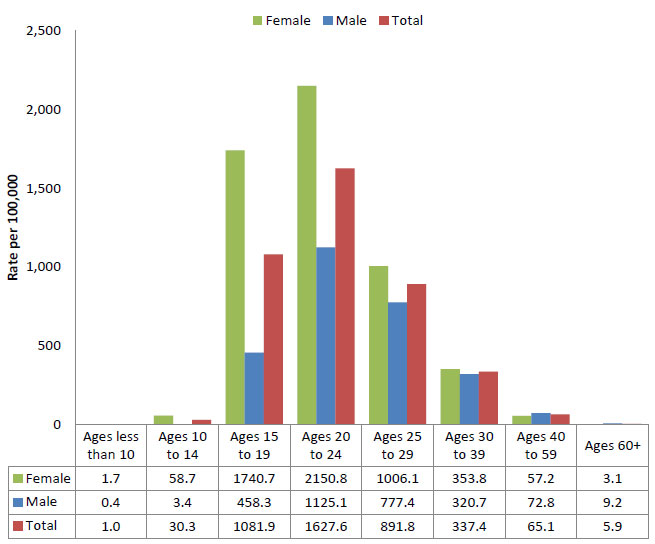
Figure 2 - Text Equivalent
| Ages less than 10 | Ages 10 to 14 | Ages 15 to 19 | Ages 20 to 24 | Ages 25 to 29 | Ages 30 to 39 | Ages 40 to 59 | Ages 60+ | |
|---|---|---|---|---|---|---|---|---|
| Female | 1.7 | 58.7 | 1740.7 | 2150.8 | 1006.1 | 353.8 | 57.2 | 3.1 |
| Male | 0.4 | 3.4 | 458.3 | 1125.1 | 777.4 | 320.7 | 72.8 | 9.2 |
| Total | 1.0 | 30.3 | 1081.9 | 1627.6 | 891.8 | 337.4 | 65.1 | 5.9 |
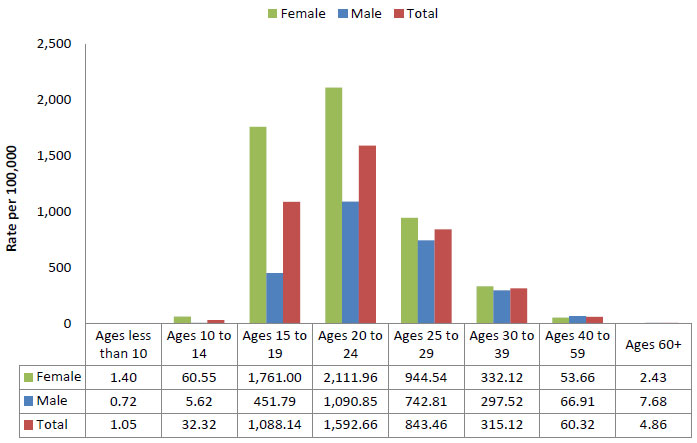
Figure 3 - Text Equivalent
| Sex | Ages less than 10 | Ages 10 to 14 | Ages 15 to 19 | Ages 20 to 24 | Ages 25 to 29 | Ages 30 to 39 | Ages 40 to 59 | Ages 60+ |
|---|---|---|---|---|---|---|---|---|
| Female | 1.4 | 60.55 | 1,761.00 | 2,111.96 | 944.54 | 332.12 | 53.66 | 2.43 |
| Male | 0.72 | 5.62 | 451.79 | 1,090.85 | 742.81 | 297.52 | 66.91 | 7.68 |
| Total | 1.05 | 32.32 | 1,088.14 | 1592.66 | 843.46 | 315.12 | 60.32 | 4.86 |
Overall, between 2005 and 2014, the rate of reported chlamydia infection increased by 68% in the 25 to 29 age group, as compared to a 43% and 27% increase seen in the 20 to 24 and the 15 to 19 age groups, respectively (Figure 4). The ten-year trend among females is one of increasing rates of chlamydia in all age groups; however, there has been a slight decreasing trend since 2011 in the 15 to 19 age group (Figure 5). This decreased trend in females drives the decrease in the overall rate of both sexes in this age group (Figure 4). Among males, rates of reported cases of chlamydia increased in all age groups between 2005 and 2014 (Figure 6). In both males and females, those in the 20 to 24 age group consistently had the highest rates of chlamydia over the total ten-year timeframe.
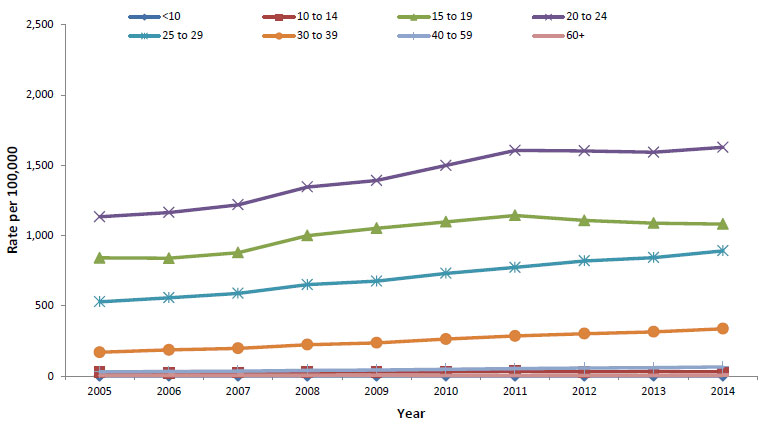
Footnotes
- Footnote 1
-
Total includes unspecified sex.
Figure 4 - Text Equivalent
| Age | 2005 | 2006 | 2007 | 2008 | 2009 | 2010 | 2011 | 2012 | 2013 | 2014 |
|---|---|---|---|---|---|---|---|---|---|---|
| <10 | 0.81 | 1.24 | 1.04 | 0.92 | 1.21 | 1.01 | 0.78 | 0.43 | 1.05 | 1.04 |
| 10 to 14 | 26.50 | 23.45 | 25.22 | 27.55 | 30.09 | 30.57 | 32.95 | 30.13 | 32.32 | 30.29 |
| 15 to 19 | 841.51 | 838.48 | 878.14 | 999.61 | 1,052.01 | 1,097.39 | 1,143.17 | 1,107.51 | 1,088.14 | 1,081.87 |
| 20 to 24 | 1,133.24 | 1,164.08 | 1,218.60 | 1,345.61 | 1,391.78 | 1,498.53 | 1,605.62 | 1,602.69 | 1,592.66 | 1,627.60 |
| 25 to 29 | 529.16 | 557.23 | 588.54 | 650.57 | 675.57 | 731.06 | 773.39 | 819.43 | 843.46 | 891.76 |
| 30 to 39 | 169.50 | 186.18 | 197.41 | 223.85 | 236.64 | 263.60 | 285.33 | 301.85 | 315.12 | 337.36 |
| 40 to 59 | 29.77 | 32.82 | 34.90 | 40.03 | 43.68 | 48.98 | 53.45 | 58.23 | 60.32 | 65.08 |
| 60+ | 4.68 | 5.56 | 6.02 | 4.91 | 6.34 | 4.16 | 4.41 | 4.60 | 4.86 | 5.92 |
|
||||||||||
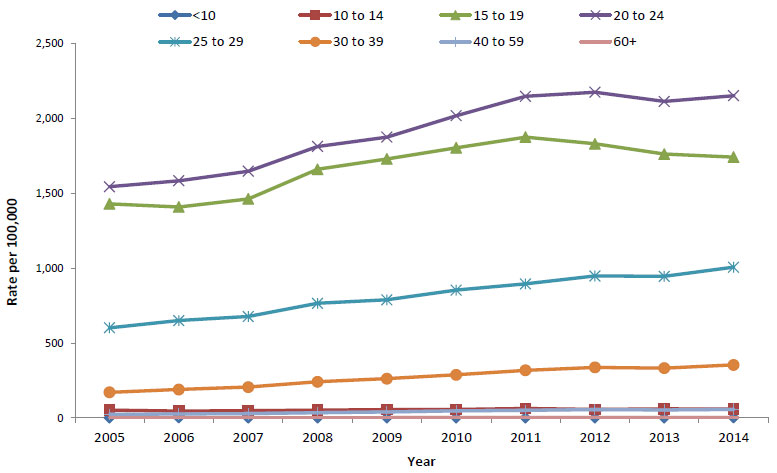
Figure 5 - Text Equivalent
| Age | 2005 | 2006 | 2007 | 2008 | 2009 | 2010 | 2011 | 2012 | 2013 | 2014 |
|---|---|---|---|---|---|---|---|---|---|---|
| <10 | 1.09 | 1.97 | 1.05 | 0.97 | 1.53 | 1.34 | 0.88 | 0.71 | 1.40 | 1.71 |
| 10 to 14 | 51.95 | 45.30 | 47.92 | 51.30 | 56.07 | 56.86 | 62.60 | 57.21 | 60.55 | 58.68 |
| 15 to 19 | 1,428.59 | 1,408.11 | 1,461.94 | 1,659.35 | 1,728.89 | 1,803.05 | 1,874.28 | 1,829.27 | 1,761.00 | 1,740.67 |
| 20 to 24 | 1,543.21 | 1,583.05 | 1,646.34 | 1,811.90 | 1,874.42 | 2,017.58 | 2,146.22 | 2,173.82 | 2,111.96 | 2,150.84 |
| 25 to 29 | 601.59 | 650.13 | 676.62 | 764.72 | 788.16 | 853.33 | 894.69 | 947.36 | 944.54 | 1,006.07 |
| 30 to 39 | 171.12 | 189.59 | 205.77 | 241.40 | 261.94 | 287.95 | 317.69 | 337.14 | 332.12 | 353.79 |
| 40 to 59 | 23.48 | 26.43 | 28.23 | 34.46 | 40.06 | 47.35 | 50.56 | 55.53 | 53.66 | 57.24 |
| 60+ | 1.42 | 1.69 | 1.79 | 1.44 | 2.19 | 2.31 | 3.01 | 3.13 | 2.43 | 3.12 |

Figure 6 - Text Equivalent
| Age | 2005 | 2006 | 2007 | 2008 | 2009 | 2010 | 2011 | 2012 | 2013 | 2014 |
|---|---|---|---|---|---|---|---|---|---|---|
| <10 | 0.55 | 0.55 | 1.05 | 0.87 | 0.91 | 0.69 | 0.68 | 0.36 | 0.72 | 0.41 |
| 10 to 14 | 2.21 | 2.52 | 3.50 | 4.99 | 5.46 | 5.66 | 4.97 | 6.49 | 5.62 | 3.44 |
| 15 to 19 | 286.62 | 299.02 | 320.53 | 365.98 | 401.83 | 422.11 | 445.58 | 463.72 | 451.79 | 458.27 |
| 20 to 24 | 741.01 | 764.04 | 808.45 | 895.37 | 924.04 | 992.17 | 1,077.36 | 1,088.76 | 1,090.85 | 1,125.10 |
| 25 to 29 | 457.30 | 464.62 | 500.86 | 536.66 | 562.27 | 609.05 | 651.18 | 713.36 | 742.81 | 777.44 |
| 30 to 39 | 167.83 | 182.69 | 188.82 | 206.21 | 210.92 | 238.85 | 252.51 | 276.10 | 297.52 | 320.68 |
| 40 to 59 | 36.07 | 39.19 | 41.54 | 45.46 | 47.13 | 50.58 | 56.01 | 62.24 | 66.91 | 72.83 |
| 60+ | 3.98 | 4.71 | 5.12 | 4.16 | 4.95 | 6.35 | 6.06 | 6.33 | 7.68 | 9.16 |
2.3 Provincial trends
In 2014, as in the previous year, the highest rate of reported cases of chlamydia was observed in Nunavut (3,509.6 per 100,000), followed by the Northwest Territories (1,893.5 per 100,000). Over the past decade, these two territories have consistently had the highest rates relative to the other provinces and territories. Chlamydia rates above the 2014 national average of 307.4 per 100,000 were also observed in Alberta, Manitoba, Saskatchewan, and Yukon (Table 1 and Figure 7).
The provinces/territories that showed the highest increase in chlamydia rates from 2005 to 2014 were: Quebec (69.5%), Ontario (50.1%), Nova Scotia (49.9%), Manitoba (48.4%) and British Columbia (34.6%) (Figure 7). Quebec rates have shown a consistent, increased trend from 2005 to 2014. Yukon and Nunavut have shown fluctuating trends in rates over the past decade, where a 4.4% and 3.7% decrease was noted from 2005 to 2014 (601.8 to 575.2 per 100,000 and 3,643.5 to 3,509.6 per 100,000) respectively.
| Province | Female | Male | TotalFootnote 1 | |||
|---|---|---|---|---|---|---|
| Number of Cases | Rate per 100,000 |
Number of Cases | Rate per 100,000 |
Number of Cases | Rate per 100,000 |
|
| Canada | 68,525 | 382.5 | 40,624 | 230.5 | 109,263 | 307.4 |
| BC | 8,263 | 354.4 | 5,175 | 225.0 | 13,452 | 290.5 |
| AB | 10,350 | 510.9 | 6,266 | 299.0 | 16,618 | 403.2 |
| SK | 3,775 | 676.8 | 2,031 | 357.8 | 5,807 | 516.0 |
| MB | 4,023 | 624.1 | 2,271 | 356.3 | 6,294 | 490.9 |
| ON | 21,908 | 314.7 | 14,005 | 208.5 | 35,933 | 262.7 |
| QC | 15,003 | 363.0 | 8,262 | 202.4 | 23,340 | 284.1 |
| NB | 1,176 | 308.5 | 570 | 152.9 | 1,746 | 231.6 |
| NS | 1,783 | 371.0 | 843 | 182.4 | 2,628 | 278.8 |
| PE | 182 | 215.2 | 72 | 101.0 | 254 | 173.6 |
| NL | 575 | 215.2 | 296 | 113.9 | 871 | 165.3 |
| YT | 124 | 695.6 | 86 | 460.3 | 210 | 575.2 |
| NT | 512 | 2,390.9 | 314 | 1,413.9 | 826 | 1,893.5 |
| NU | 851 | 4,829.2 | 433 | 2,283.4 | 1,284 | 3,509.6 |
|
||||||
| Province | Female | Male | TotalFootnote 1 | |||
|---|---|---|---|---|---|---|
| Number of Cases | Rate per 100,000 | Number of Cases | Rate per 100,000 | Number of Cases | Rate per 100,000 | |
| Canada | 66,696 | 376.3 | 38,482 | 220.8 | 105,274 | 299.5 |
| BC | 7,736 | 335.5 | 4,497 | 197.5 | 12,244 | 267.2 |
| AB | 9,959 | 505.2 | 6,117 | 300.5 | 16,077 | 401.2 |
| SK | 3,804 | 692.7 | 1,967 | 353.1 | 5,771 | 521.7 |
| MB | 4,165 | 654.1 | 2,255 | 358.7 | 6,420 | 507.4 |
| ON | 21,280 | 308.6 | 13,318 | 200.1 | 34,614 | 255.4 |
| QC | 14,498 | 353.2 | 7,721 | 190.7 | 22,287 | 273.3 |
| NB | 1,182 | 309.4 | 588 | 157.4 | 1,770 | 234.2 |
| NS | 1,727 | 359.4 | 737 | 159.4 | 2,464 | 261.3 |
| PE | 156 | 208.9 | 86 | 121.4 | 242 | 166.3 |
| NL | 533 | 199.1 | 268 | 102.9 | 801 | 151.7 |
| YT | 143 | 802.9 | 96 | 517.4 | 239 | 657.2 |
| NT | 559 | 2,609.7 | 311 | 1,387.1 | 870 | 1,984.4 |
| NU | 954 | 5,581.6 | 521 | 2,840.5 | 1,475 | 4,162.7 |
|
||||||

Figure 7 - Text Equivalent
| Province | 2005 | 2006 | 2007 | 2008 | 2009 | 2010 | 2011 | 2012 | 2013 | 2014 |
|---|---|---|---|---|---|---|---|---|---|---|
| BC | 215.8 | 218.9 | 234.7 | 248.1 | 253.8 | 265.9 | 261.5 | 273.3 | 267.2 | 290.5 |
| AB | 265.8 | 305.5 | 318.6 | 335.2 | 368.3 | 351.3 | 373.1 | 403.6 | 401.2 | 403.2 |
| SK | 391.9 | 428.9 | 439.0 | 511.3 | 468.1 | 481.2 | 520.8 | 526.1 | 521.7 | 516.0 |
| MB | 330.7 | 358.9 | 469.7 | 577.8 | 520.3 | 521.7 | 544.9 | 526.9 | 507.3 | 490.9 |
| ON | 175.0 | 177.3 | 182.7 | 203.8 | 221.3 | 254.9 | 274.0 | 272.3 | 255.4 | 262.7 |
| QC | 167.6 | 168.4 | 175.3 | 193.7 | 202.8 | 218.5 | 239.1 | 249.3 | 273.3 | 284.1 |
| NB | 200.3 | 177.8 | 159.2 | 166.3 | 210.1 | 249.0 | 255.6 | 255.3 | 234.2 | 231.6 |
| NS | 186.0 | 187.8 | 191.2 | 217.1 | 212.3 | 237.3 | 260.9 | 276.6 | 261.3 | 278.8 |
| PE | 132.6 | 122.5 | 124.9 | 113.9 | 144.4 | 150.3 | 152.7 | 176.9 | 166.3 | 173.6 |
| NL | 126.4 | 107.2 | 100.2 | 116.5 | 103.5 | 123.4 | 131.2 | 164.0 | 151.6 | 165.3 |
| YK | 601.8 | 523.6 | 728.0 | 716.3 | 631.4 | 661.9 | 590.4 | 486.6 | 657.2 | 575.2 |
| NT | 1,677.5 | 1,611.2 | 1,754.5 | 2,006.9 | 2,356.9 | 2,100.4 | 1,896.5 | 2,190.7 | 1,984.4 | 1,893.5 |
| NU | 3,643.5 | 3,665.7 | 3,914.6 | 4,123.3 | 3,730.1 | 4,185.5 | 3,860.1 | 3,904.5 | 4,162.7 | 3,509.6 |
2.4 International comparison
Compared to countries such as the United States, England, and Australia, Canada had lower rates of reported chlamydia during 2012 to 2014 (Figure 8). The pattern of higher rates in females is similar across these countries. The difference in rates that are observed among the countries can likely be attributed to a combination of differences in reporting requirements, screening practices, and public health interventions.
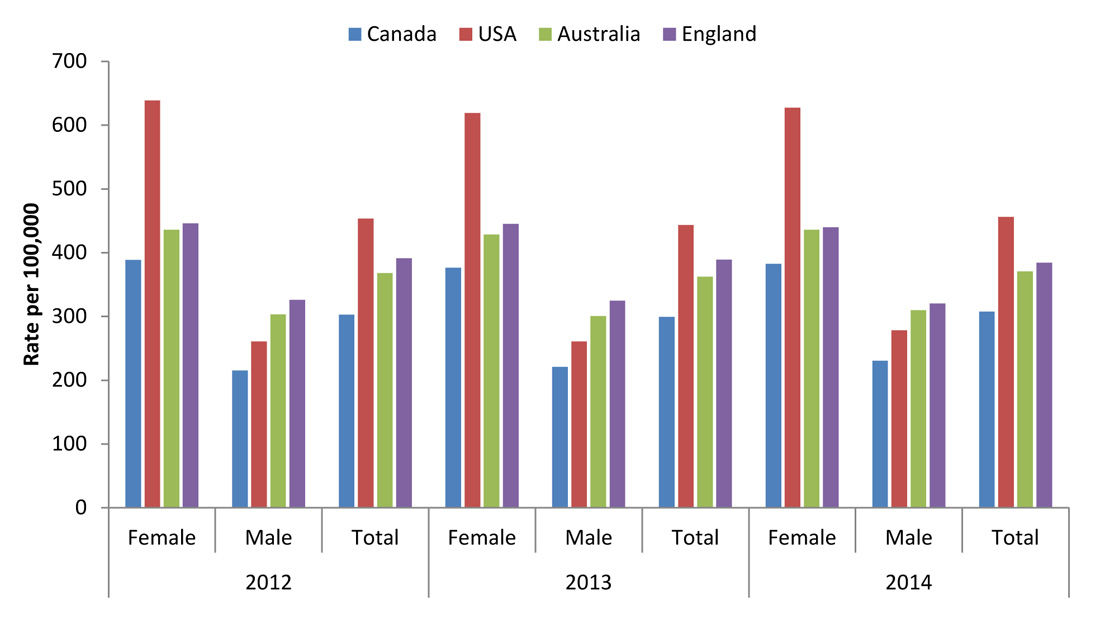
Figure 8 - Text Equivalent
| Country | 2012 | 2013 | 2014 | ||||||
|---|---|---|---|---|---|---|---|---|---|
| Female | Male | Total | Female | Male | Total | Female | Male | Total | |
| Canada | 388.6 | 215.1 | 302.8 | 376.3 | 220.8 | 299.5 | 382.5 | 230.5 | 307.4 |
| USA | 638.7 | 260.6 | 453.3 | 619.0 | 260.6 | 443.5 | 627.2 | 287.4 | 456.1 |
| Australia | 435.9 | 303.4 | 367.8 | 428.3 | 300.6 | 362.3 | 436.0 | 310.0 | 370.8 |
| England | 445.8 | 326.1 | 391.3 | 445 | 324.8 | 389 | 440.0 | 320.5 | 384.1 |
2.5 Conclusions
From 2005 and 2014, increases in the rates of reported cases of chlamydia have been observed in Canada despite numerous public health interventions designed to prevent, diagnose, and treat infection. The observed increases in rates may be explained by a variety of factors including a true rise in incidence and the implementation of improved detection methods such as the more sensitive nucleic acid amplification testing (NAAT) introduced in the mid-1990s. In fact, the introduction of NAAT coincided with the beginning of the historical rise in rates of reported cases of chlamydia. NAAT allows the use of either urine specimens or swabs, and urine collection is easier and more acceptable to patients. As a result, the number of people, particularly males, getting tested has likely increased as well. More effective screening and contact tracing practices may also have contributed to the observed rise in the rate of reported casesFootnote 7Footnote 8Footnote 9.
In the US, women report nearly twice the rate of chlamydia infections compared to men, but over the time period of 2010-2014, chlamydia rates in men increased at a much higher rate (22%) compared to women (6%)Footnote 10. Australia reported that since 2011 chlamydia rates have remained stable, yet it remains the most frequently reported STIFootnote 11. In 2013, The European Centre of Disease Control (ECDC) also reported seeing rates stabilizing over the past five years, with the majority of cases being seen in womenFootnote 12.
The overall rate of reported cases of chlamydia has been consistently higher in females than in males and this difference is most pronounced in younger age groups. Higher rates in young women may be due to a greater biological susceptibility to chlamydial infection compared to their male peers due to a higher prevalence of cervical cell configurationFootnote 13Footnote 14. Additionally, women are more likely than men to be screened for STIsFootnote 15Footnote 16Footnote 17.
Differences in STI screening behaviours across Canadian provinces and territories may also contribute to the variation in chlamydia rates across geographical locations. For example, there is some evidence that chlamydia screening rates may be higher in Yukon than in some other Canadian jurisdictions, which may contribute to the comparatively high rate of reported cases of chlamydia infection observed in the territoryFootnote 16.
It has also been hypothesized that early diagnosis and treatment of chlamydial infections may actually impede the development of an effective immune response and that treated individuals who have not developed an immune response are susceptible to re-infection upon returning to their sexual networksFootnote 18. If true, this hypothesis may also partly explain rising rates of chlamydiaFootnote 19Footnote 20.
In Canada, cycle 2 of the Canadian Health Measures Survey (CHMS)Footnote 21 estimated the prevalence of chlamydia in the general population using urine specimens collected from a representative sample of respondents aged 14 to 59 at mobile examination centres. The resulting prevalence was 0.7% (95% confidence interval 0.4% to 1.3%), with a weighted national estimate of 158,000 infected individualsFootnote 22. Repeated measures of chlamydia prevalence in future cycles of the CHMS will facilitate interpretation of data received through routine surveillance and may help explain the drivers behind the continuing increase in reported cases.
In summary, it is difficult to identify which factors are most responsible for the recent trends in chlamydia rates observed in Canada. A combination of factors is likely involved and the possibility of a true increase in incidence cannot be ruled out. Ongoing monitoring of chlamydia rates and research into the reasons for observed changes will help guide and evaluate the public health response to STIs. National guidelines for the prevention and management of chlamydial infections are updated as new information becomes available to provide users with the most up-to-date information for the management of STIs in CanadaFootnote 4Footnote 23.
3.0 Gonorrhea
3.1 Introduction
Gonorrhea is a bacterial infection caused by Neisseria gonorrhoeae and has been nationally notifiable since 1924. It is the second most commonly reported STI in Canada. Untreated infections can lead to pelvic inflammatory disease in females which may lead to chronic abdominal pain, infertility, and ectopic pregnancy. In males, untreated infections can result in infections of sexual organs and infertility in rare cases. An uncommon complication of gonorrhea in both sexes is the spread of infection to the blood and jointsFootnote 24. Like other STIs, gonorrhea increases the risk of HIV acquisition and transmissionFootnote 5.
3.2 National trends
Between 2005 and 2014, despite a slight decrease around 2009-10, the overall rate of reported cases of gonorrhea in Canada increased by 61.3%, from 28.4 per 100,000 in 2005 to 45.8 per 100,000 (Figure 9). The ten-year trend shows rate increases of 64.2% among males and 55.9% among females Between 2013 and 2014, the overall rate of reported gonorrhea increased by 13.2%, mainly due to increased rates observed among males (22.1%).
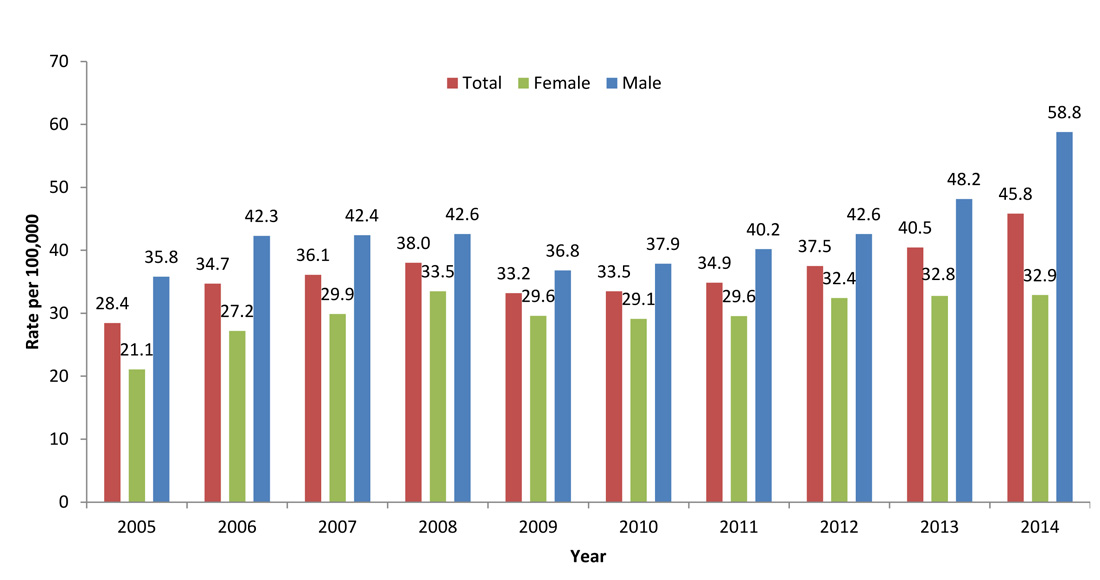
Figure 9 - Text Equivalent
| Sex | 2005 | 2006 | 2007 | 2008 | 2009 | 2010 | 2011 | 2012 | 2013 | 2014 |
|---|---|---|---|---|---|---|---|---|---|---|
| Total | 28.4 | 34.7 | 36.1 | 38.0 | 33.2 | 33.5 | 34.9 | 37.5 | 40.5 | 45.8 |
| Female | 21.1 | 27.2 | 29.9 | 33.5 | 29.6 | 29.1 | 29.6 | 32.4 | 32.8 | 32.9 |
| Male | 35.8 | 42.3 | 42.4 | 42.6 | 36.8 | 37.9 | 40.2 | 42.6 | 48.2 | 58.8 |
In 2014, overall rates of reported cases of gonorrhea were highest in the 20 to 24 age group, followed by the 25 to 29 age group (Figure 10). Rates were higher among females than males in those less than 20 years of age; in contrast, among adults aged 20 and older, males had higher rates. Similar findings were seen in 2013 (Figure 11).
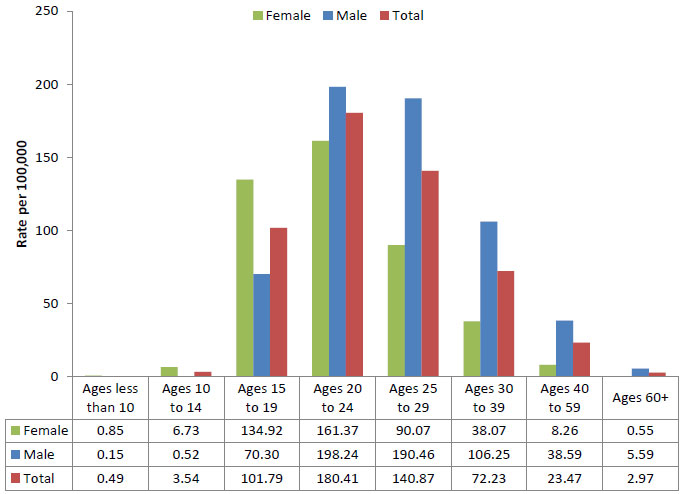
Figure 10 - Text Equivalent
| Sex | Ages less than 10 | Ages 10 to 14 | Ages 15 to 19 | Ages 20 to 24 | Ages 25 to 29 | Ages 30 to 39 | Ages 40 to 59 | Ages 60+ |
|---|---|---|---|---|---|---|---|---|
| Total | 0.5 | 3.5 | 101.8 | 180.4 | 140.9 | 72.2 | 23.5 | 3.0 |
| Female | 0.9 | 6.7 | 134.9 | 161.4 | 90.1 | 38.1 | 8.3 | 0.6 |
| Male | 0.2 | 0.5 | 70.3 | 198.2 | 190.5 | 106.2 | 38.6 | 5.6 |

Figure 11 - Text Equivalent
| Sex | Ages less than 10 | Ages 10 to 14 | Ages 15 to 19 | Ages 20 to 24 | Ages 25 to 29 | Ages 30 to 39 | Ages 40 to 59 | Ages 60+ |
|---|---|---|---|---|---|---|---|---|
| Female | 0.4 | 10.5 | 150.9 | 155.3 | 87.4 | 34.7 | 6.9 | 0.4 |
| Male | 0.1 | 1.5 | 67.3 | 168.5 | 152.4 | 84.5 | 29.9 | 4.2 |
| Total | 0.2 | 5.8 | 107.9 | 162.2 | 120.3 | 59.6 | 18.4 | 2.1 |
Between 2005 and 2014, rates of reported cases of gonorrhea increased in most age groups from 2005 to 2008, followed by a decrease until 2012 when rates were once again on the rise (Figure 12). The highest relative increase observed among females was in those aged 40 to 59 (219%, from 2.6 to 8.3 per 100,000), followed by the 30 to 39 age group (151.2%, from 15.2 to 38.1 per 100,000) (Figure 13).Among males, the 20 to 24 age group consistently had the highest rates across this timeframe, followed by males aged 25 to 29 who showed the greatest relative rate increase (91%), from 99.7 to 190.5 per 100,000 (Figure 14).

Footnotes
- Footnote 1
-
Total includes unspecified sex.
Figure 12 - Text Equivalent
| Age | 2005 | 2006 | 2007 | 2008 | 2009 | 2010 | 2011 | 2012 | 2013 | 2014 |
|---|---|---|---|---|---|---|---|---|---|---|
| <10 | 0.1 | 0.4 | 0.4 | 0.4 | 0.4 | 0.4 | 0.1 | 0.3 | 0.2 | 0.5 |
| 10 to 14 | 4.7 | 4.3 | 4.5 | 4.7 | 4.0 | 4.6 | 4.5 | 4.5 | 5.8 | 3.5 |
| 15 to 19 | 84.7 | 103.0 | 110.6 | 118.2 | 103.3 | 101.4 | 100.4 | 105.2 | 107.9 | 101.8 |
| 20 to 24 | 114.9 | 135.7 | 153.6 | 165.8 | 147.0 | 141.4 | 146.9 | 157.2 | 162.2 | 180.4 |
| 25 to 29 | 71.8 | 88.2 | 93.4 | 101.3 | 87.5 | 92.2 | 96.9 | 110.9 | 120.3 | 140.9 |
| 30 to 39 | 39.1 | 47.0 | 46.1 | 48.8 | 41.3 | 42.9 | 45.6 | 50.7 | 59.6 | 72.2 |
| 40 to 59 | 12.7 | 16.6 | 15.5 | 14.8 | 13.4 | 14.1 | 16.0 | 16.1 | 18.4 | 23.5 |
| 60+ | 3.2 | 4.6 | 3.9 | 3.7 | 3.1 | 2.3 | 2.2 | 2.1 | 2.1 | 3.0 |
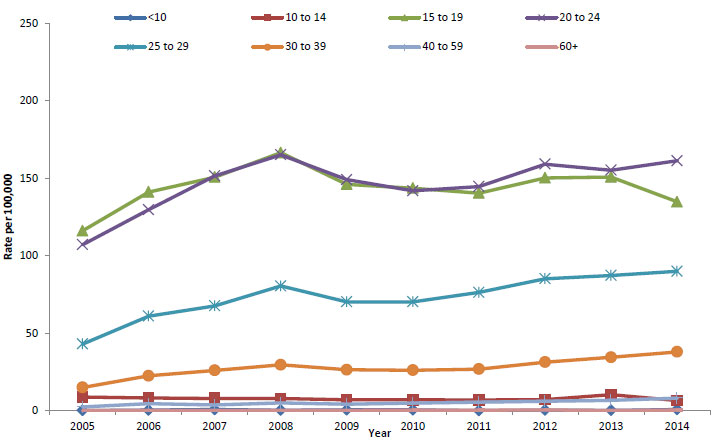
Figure 13 - Text Equivalent
| Age | 2005 | 2006 | 2007 | 2008 | 2009 | 2010 | 2011 | 2012 | 2013 | 2014 |
|---|---|---|---|---|---|---|---|---|---|---|
| <10 | 0.3 | 0.6 | 0.9 | 0.5 | 0.7 | 0.7 | 0.2 | 0.5 | 0.4 | 0.9 |
| 10 to 14 | 9.0 | 8.4 | 8.1 | 8.0 | 7.2 | 7.2 | 7.1 | 7.3 | 10.5 | 6.7 |
| 15 to 19 | 116.2 | 141.2 | 150.8 | 166.6 | 146.2 | 143.7 | 140.5 | 150.3 | 150.9 | 134.9 |
| 20 to 24 | 107.3 | 129.8 | 151.6 | 165.2 | 149.2 | 142.0 | 144.8 | 159.2 | 155.3 | 161.4 |
| 25 to 29 | 43.2 | 61.2 | 67.8 | 80.6 | 70.4 | 70.4 | 76.5 | 85.3 | 87.4 | 90.1 |
| 30 to 39 | 15.2 | 22.7 | 26.2 | 29.8 | 26.6 | 26.3 | 27.0 | 31.5 | 34.6 | 38.1 |
| 40 to 59 | 2.6 | 4.7 | 3.9 | 5.2 | 4.4 | 5.1 | 5.7 | 6.3 | 6.9 | 8.3 |
| 60+ | 0.3 | 0.4 | 0.4 | 0.4 | 0.4 | 0.5 | 0.5 | 0.7 | 0.3 | 0.6 |

Figure 14 - Text Equivalent
| Age | 2005 | 2006 | 2007 | 2008 | 2009 | 2010 | 2011 | 2012 | 2013 | 2014 |
|---|---|---|---|---|---|---|---|---|---|---|
| <10 | 0.0 | 0.2 | 0.0 | 0.2 | 0.1 | 0.1 | 0.0 | 0.1 | 0.1 | 0.2 |
| 10 to 14 | 0.6 | 0.5 | 1.1 | 1.5 | 0.9 | 2.1 | 2.1 | 1.8 | 1.5 | 0.5 |
| 15 to 19 | 54.9 | 66.9 | 72.2 | 71.7 | 61.9 | 60.9 | 62.0 | 62.5 | 67.3 | 70.3 |
| 20 to 24 | 121.9 | 141.1 | 155.5 | 166.3 | 144.5 | 140.6 | 148.7 | 154.8 | 168.5 | 198.2 |
| 25 to 29 | 99.7 | 114.7 | 118.6 | 121.6 | 104.3 | 113.7 | 117.0 | 136.1 | 152.4 | 190.5 |
| 30 to 39 | 62.6 | 70.8 | 65.6 | 67.6 | 55.9 | 59.4 | 64.1 | 69.8 | 84.5 | 106.2 |
| 40 to 59 | 22.9 | 28.5 | 27.1 | 24.3 | 22.4 | 23.0 | 26.1 | 25.9 | 29.9 | 38.6 |
| 60+ | 3.6 | 5.1 | 4.2 | 4.0 | 3.2 | 4.3 | 4.2 | 3.7 | 4.2 | 5.6 |
3.3 Provincial trends
In 2014, the rate of reported cases of gonorrhea was significantly higher in Nunavut (891.1 per 100,000) than in other jurisdictions. Rates exceeding the national average of 45.8 per 100,000 were also observed in Alberta (46.2 per 100,000), Saskatchewan (110.2 per 100,000), Manitoba (86.4 per 100,000), Yukon (134.2 per 100,000) and the Northwest Territories (561.6 per 100,000 (Table 3).
| Province | Female | Male | TotalFootnote 1 | |||
|---|---|---|---|---|---|---|
| Number of Cases | Rate per 100,000 |
Number of Cases | Rate per 100,000 |
Number of Cases | Rate per 100,000 |
|
| Canada | 5,892 | 32.9 | 10,362 | 58.8 | 16,285 | 45.8 |
| BC | 522 | 22.4 | 1,505 | 65.4 | 2,031 | 43.9 |
| AB | 782 | 38.6 | 1,123 | 53.6 | 1,906 | 46.2 |
| SK | 635 | 113.8 | 604 | 106.4 | 1,240 | 110.2 |
| MB | 598 | 92.8 | 509 | 79.9 | 1,107 | 86.4 |
| ON | 2,022 | 29.1 | 3,807 | 56.7 | 5,838 | 42.7 |
| QC | 911 | 22.0 | 2,385 | 58.4 | 3,312 | 40.3 |
| NB | 12 | 3.2 | 32 | 8.6 | 44 | 5.8 |
| NS | 34 | 7.1 | 80 | 17.3 | 114 | 12.1 |
| PE | N/A | N/A | N/A | N/A | 7 | 4.8 |
| NL | 25 | 9.4 | 41 | 15.8 | 66 | 12.5 |
| YT | 21 | 117.8 | 28 | 149.9 | 49 | 134.2 |
| NT | 131 | 611.7 | 114 | 513.3 | 245 | 561.6 |
| NU | 195 | 1,106.6 | 131 | 513.3 | 326 | 891.1 |
|
||||||
| Province | Female | Male | TotalFootnote 1 | |||
|---|---|---|---|---|---|---|
| Number of Cases | Rate per 100,000 | Number of Cases | Rate per 100,000 | Number of Cases | Rate per 100,000 | |
| Canada | 5,806 | 32.8 | 8,394 | 48.2 | 14,227 | 40.5 |
| BC | 532 | 23.1 | 1,303 | 57.2 | 1,841 | 40.2 |
| AB | 895 | 45.4 | 1,119 | 55.0 | 2,014 | 50.3 |
| SK | 681 | 124.0 | 532 | 95.5 | 1,213 | 109.7 |
| MB | 681 | 107.0 | 536 | 85.3 | 1,217 | 96.2 |
| ON | 1,682 | 24.4 | 2,847 | 42.8 | 4,536 | 33.5 |
| QC | 888 | 21.6 | 1,741 | 43.0 | 2,642 | 32.4 |
| NB | 14 | 3.7 | 33 | 8.8 | 47 | 6.2 |
| NS | 38 | 7.9 | 59 | 12.8 | 97 | 10.3 |
| PE | N/A | N/A | N/A | N/A | 6 | 4.1 |
| NL | 19 | 7.1 | 22 | 8.5 | 41 | 7.8 |
| YT | 9 | 50.5 | 1 | 5.4 | 10 | 27.5 |
| NT | 61 | 284.8 | 36 | 160.6 | 97 | 221.3 |
| NU | 302 | 1,766.9 | 163 | 888.7 | 466 | 1,315.1 |
|
||||||
The ten-year surveillance timeframe shows that the rates of gonorrhea have significantly increased in most of the provinces and territories (Figure 15). The highest relative increase in rate was observed in Newfoundland, where rates in 2005 were 0.2 per 100,000 and in 2014, were 12.5 per 100,000. Yukon's rates have shown fluctuation over the last ten years and rates in Northwest Territories and Nunavut have been consistently high.

Figure 15 - Text Equivalent
| Province | 2005 | 2006 | 2007 | 2008 | 2009 | 2010 | 2011 | 2012 | 2013 | 2014 |
|---|---|---|---|---|---|---|---|---|---|---|
| BC | 28.1 | 25.3 | 29.8 | 33.2 | 30.6 | 30.6 | 36.7 | 31.3 | 40.2 | 43.9 |
| AB | 46.1 | 62.8 | 62.4 | 59.2 | 42.0 | 31.7 | 39.8 | 54.1 | 50.3 | 46.2 |
| SK | 72.5 | 96.2 | 103.1 | 131.1 | 84.6 | 72.6 | 71.1 | 93.6 | 109.7 | 110.2 |
| MB | 99.7 | 133.3 | 124.8 | 114.0 | 84.7 | 80.4 | 85.5 | 107.9 | 96.2 | 86.3 |
| ON | 26.5 | 30.4 | 31.1 | 30.1 | 27.2 | 30.2 | 31.6 | 30.6 | 33.5 | 42.7 |
| QC | 11.8 | 16.6 | 18.3 | 21.3 | 23.9 | 25.9 | 23.3 | 27.4 | 32.4 | 40.3 |
| NB | 3.1 | 4.3 | 4.8 | 3.7 | 6.9 | 8.5 | 8.5 | 5.0 | 6.2 | 5.8 |
| NS | 11.1 | 10.6 | 7.7 | 15.3 | 13.5 | 10.6 | 10.8 | 12.6 | 10.3 | 12.1 |
| PE | 1.4 | 0.0 | 2.2 | 2.9 | 0.7 | 0.0 | 7.6 | 5.5 | 4.1 | 4.8 |
| NL | 0.2 | 1.6 | 3.5 | 0.0 | 1.9 | 2.3 | 5.0 | 3.0 | 7.8 | 12.5 |
| YK | 65.8 | 34.1 | 52.2 | 51.4 | 44.5 | 89.6 | 17.0 | 24.9 | 27.5 | 134.2 |
| NT | 327.2 | 419.0 | 511.8 | 689.7 | 558.5 | 506.0 | 328.7 | 440.0 | 221.3 | 561.6 |
| NU | 187.9 | 331.2 | 484.2 | 1,116.3 | 1,570.6 | 1,942.9 | 1,740.0 | 1,290.0 | 1,315.1 | 891.1 |
3.4 International comparison
In 2014, Canada had the lowest rates of reported gonorrhea when compared to the US, England, and Australia and this trend was also seen in 2013 and 2012 (Figure 16). The pattern of rates among males exceeding those among females is similar across these countries and years, with the exception of 2012 where rates were slightly higher in females in the US. Again, the observed difference in rates observed among these countries can likely be attributed, in part, to, differences in reporting requirements, screening practices, educational programs, and public health interventions.

Figure 16 - Text Equivalent
| Country | 2012 | 2013 | 2014 | ||||||
|---|---|---|---|---|---|---|---|---|---|
| Female | Male | Total | Female | Male | Total | Female | Male | Total | |
| Canada | 32.4 | 42.6 | 37.5 | 32.76 | 48.16 | 40.5 | 32.9 | 58.8 | 45.8 |
| USA | 107.9 | 105 | 106.7 | 101.7 | 108.7 | 105.3 | 101.3 | 120.1 | 110.7 |
| Australia | 40.7 | 86.2 | 63.5 | 39.9 | 91.2 | 65.7 | 37.8 | 98.6 | 68.5 |
| England | 28.3 | 72.8 | 50.2 | 30.9 | 85.5 | 57.8 | 33.7 | 103.9 | 68.3 |
3.5 Conclusions
Although the rates of reported cases of gonorrhea in Canada are considerably lower than those of chlamydia, rates for both infections appear to be increasing over time. The increase in gonorrhea rates since the late 1990s may be at least partly explained by the factors thought to affect chlamydia rates, such as the move to more sensitive testing methods and improved case findingFootnote 8.
In contrast with chlamydia, observed overall rates of gonorrhea were higher in males. Rates were much higher in females than males in younger age groups, but the opposite was observed among individuals aged 25 and older. Higher gonorrhea rates among males may be partially explained by the fact that they are more likely than females to have symptomatic infections; the presence of symptoms likely influences care seeking behaviours and could contribute to the greater number of cases detected among malesFootnote 25. In addition, increases in certain sex practices among men who have sex with men (MSM) have been associated with increases in gonorrhea in this populationFootnote 26Footnote 27. Researchers have observed MSM increasingly adopting new practices intended to decrease risk of HIV infection (such as having sex with persons thought be of the same HIV status), but these practices still carry the risk of infection with other STIsFootnote 28. In countries such as USA, England and Australia, higher rates of gonorrhea are also seen among malesFootnote 29Footnote 30Footnote 31 and this is due in part to the disproportionately high rates seen in the MSM populationFootnote 11Footnote 12.
4.0 Infectious syphilis
4.1 Introduction
Syphilis is an infection caused by the bacterium Treponema pallidum and has been nationally notifiable since 1924. Left untreated, it progresses through primary, secondary, latent, and tertiary stages. After several years (or even decades) without treatment, tertiary syphilis may develop, causing potential damage to the central nervous system, cardiovascular system, eyes, skin, and other internal organs, which may ultimately be fatalFootnote 32. Individuals infected with syphilis are also at an increased risk of contracting HIV, and those co-infected with both pathogens are more likely to transmit HIV to their sexual partnersFootnote 5. In co-infected individuals, there is a greater chance of rapid progression to serious conditions, such as neurosyphilis, a bacterial infection of the brain or spinal cord, often while those individuals are still infectiousFootnote 33 Footnote 34 Footnote 35.
While all stages of syphilis are nationally notifiable, only primary, secondary, and early latent syphilis (less than 1 year after the point of infection), and infectious neurosyphilis are considered infectious and therefore are of major public health significance. This report contains data on infectious syphilis in Canada.
4.2 National trends
Overall rates of reported cases of infectious syphilis were very low (less than 1 per 100,000) in both sexes until 2001, when rates began to climb, particularly among males. By 2005, the overall rate of reported cases was 3.4 per 100,000. This trend continued through to 2014 with 2,357 cases of infectious syphilis reported in that year, corresponding to a rate of 6.63 per 100,000. There has been a 95% increase in rates from 2005 to 2014 (Figure 17) and during this time period, rates among males increased by 115.5% (from 5.8 to 12.5 per 100,000) while conversely, rates among females decreased by 18.2% (from 1.1 to 0.9 per 100,000) (Figure 18).
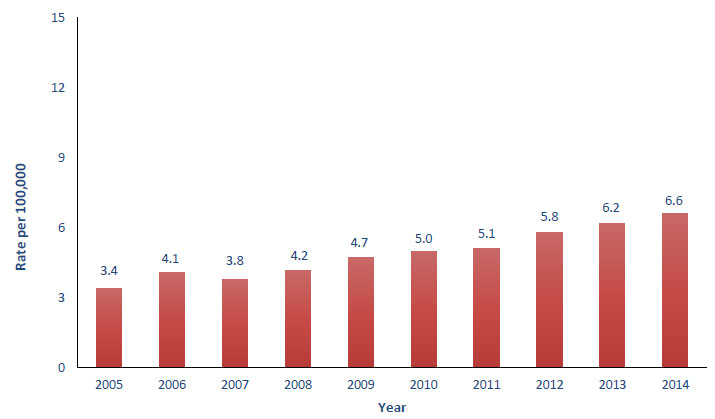
Figure 17 - Text Equivalent
| Infection | 2005 | 2006 | 2007 | 2008 | 2009 | 2010 | 2011 | 2012 | 2013 | 2014 |
|---|---|---|---|---|---|---|---|---|---|---|
| Syphilis Infectious | 3.4 | 4.1 | 3.8 | 4.2 | 4.7 | 5.0 | 5.1 | 5.8 | 6.2 | 6.6 |

Figure 18 - Text Equivalent
| Infection | 2005 | 2006 | 2007 | 2008 | 2009 | 2010 | 2011 | 2012 | 2013 | 2014 | ||||||||||
|---|---|---|---|---|---|---|---|---|---|---|---|---|---|---|---|---|---|---|---|---|
| Female | Male | Female | Male | Female | Male | Female | Male | Female | Male | Female | Male | Female | Male | Female | Male | Female | Male | Female | Male | |
| Syphilis Infectious | 1.1 | 5.8 | 1.1 | 7.2 | 1 | 6.7 | 1.1 | 7.3 | 0.9 | 8.6 | 0.9 | 9.2 | 0.7 | 9.6 | 0.6 | 11.1 | 0.8 | 11.7 | 0.9 | 12.5 |
Infectious syphilis is much more common in males than females in Canada; in 2013 and 2014, 93% of all reported infectious cases were among males, at a rate nearly 18 times that of females. In 2014, the highest rates of infectious syphilis were among men 25 to 29 years of age, followed by men 30 to 39 years old (25.1 and 24.2 per 100,000, respectively) (Figure 19). Among women, rates of reported cases of infectious syphilis were substantially lower; the highest rates among women were observed among those aged 20 to 24 years, followed by those aged 25 to 29 years (3.4 and 2.2 per 100,000, respectively). A similar pattern was seen in 2013 infectious syphilis rates (Figure 20). Cases in individuals under 15 years of age are extremely rare and are not presented here.
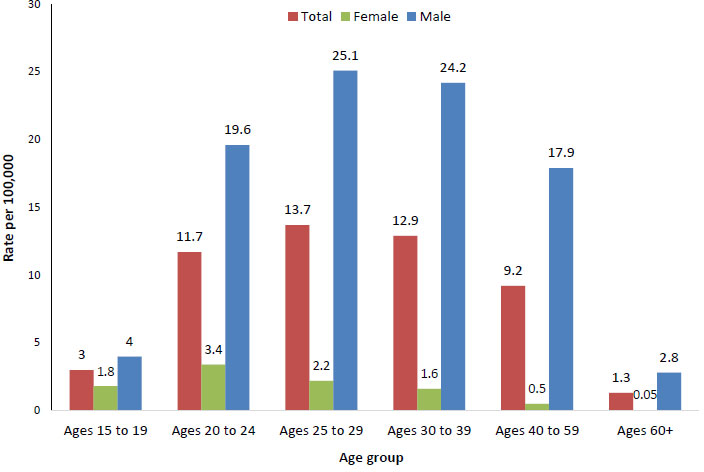
Figure 19 - Text Equivalent
| Sex | Ages 15 to 19 | Ages 20 to 24 | Ages 25 to 29 | Ages 30 to 39 | Ages 40 to 59 | Ages 60+ |
|---|---|---|---|---|---|---|
| Total | 3 | 11.7 | 13.7 | 12.9 | 9.2 | 1.3 |
| Female | 1.8 | 3.4 | 2.2 | 1.6 | 0.5 | 0.05 |
| Male | 4 | 19.6 | 25.1 | 24.2 | 17.9 | 2.8 |
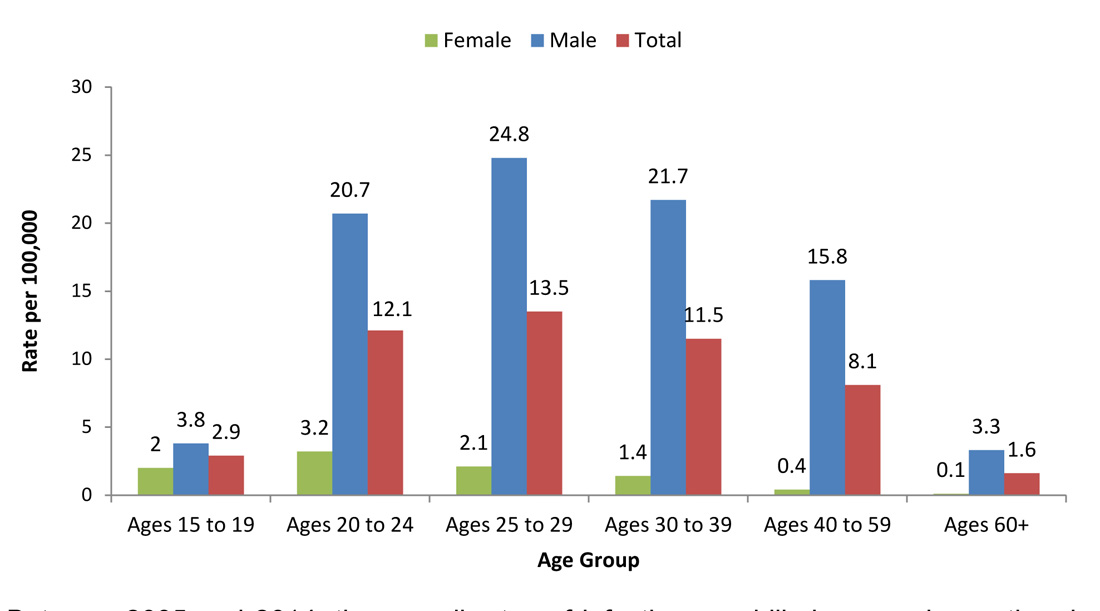
Figure 20 - Text Equivalent
| Age | Female | Male | Total |
|---|---|---|---|
| 15 to 19 | 2 | 3.8 | 2.9 |
| 20 to 24 | 3.2 | 20.7 | 12.1 |
| 25 to 29 | 2.1 | 24.8 | 13.5 |
| 30 to 39 | 1.4 | 21.7 | 11.5 |
| 40 to 59 | 0.4 | 15.8 | 8.1 |
| 60+ | 0.1 | 3.3 | 1.6 |
Between 2005 and 2014, the overall rates of infectious syphilis increased over time in all age groups, with the exception of the 60+ age group where the rate remained relatively stable (Figure 21). Among females, the rates mostly show a fluctuating trend because of the small numbers, however rates appear to have decreased in 25 to 29 age group (Figure 22). The greatest relative rate increase occurred in males aged 15 to 19 years (300%, from 1.0 to 4.0 per 100,000), followed by males in the 25 to 24 age group (215.7%, from 6.2 to 19.6 per 100,000) (Figure 23).

Figure 21 - Text Equivalent
| Age | 2005 | 2006 | 2007 | 2008 | 2009 | 2010 | 2011 | 2012 | 2013 | 2014 |
|---|---|---|---|---|---|---|---|---|---|---|
| 15 to 19 | 1.4 | 1.1 | 1.3 | 1.6 | 2.2 | 2.7 | 3.1 | 3.9 | 2.9 | 2.9 |
| 20 to 24 | 4.7 | 5.5 | 4.3 | 6.4 | 8.1 | 8.2 | 9.2 | 11.8 | 12.1 | 11.7 |
| 25 to 29 | 6.3 | 5.5 | 6.6 | 8.1 | 10.0 | 9.1 | 10.8 | 11.6 | 13.5 | 13.7 |
| 30 to 39 | 7.1 | 9.1 | 8.1 | 7.9 | 9.0 | 8.7 | 9.2 | 10.5 | 11.5 | 12.9 |
| 40 to 59 | 4.8 | 6.0 | 5.6 | 6.1 | 6.5 | 7.4 | 7.1 | 7.7 | 8.1 | 9.2 |
| 60 + | 1.2 | 1.8 | 1.5 | 1.6 | 1.5 | 1.2 | 1.0 | 1.3 | 1.6 | 1.3 |

Figure 22 - Text Equivalent
| Age | 2005 | 2006 | 2007 | 2008 | 2009 | 2010 | 2011 | 2012 | 2013 | 2014 |
|---|---|---|---|---|---|---|---|---|---|---|
| 15 to 19 | 1.8 | 1.3 | 1.4 | 2.1 | 0.9 | 1.5 | 1.6 | 1.5 | 2.0 | 1.8 |
| 20 to 24 | 3.1 | 3.3 | 2.4 | 3.6 | 3.3 | 3.3 | 2.1 | 2.2 | 3.2 | 3.4 |
| 25 to 29 | 3.7 | 2.5 | 3.2 | 3.0 | 2.9 | 2.6 | 1.9 | 1.1 | 2.1 | 2.2 |
| 30 to 39 | 1.7 | 2.5 | 1.9 | 2.1 | 1.6 | 1.5 | 1.2 | 1.0 | 1.4 | 1.6 |
| 40 to 59 | 0.7 | 0.9 | 0.8 | 0.8 | 0.7 | 0.6 | 0.4 | 0.5 | 0.4 | 0.5 |
| 60 + | 0.1 | 0.1 | 0.0 | 0.1 | 0.1 | 0.1 | 0.0 | 0.0 | 0.1 | 0.0 |

Figure 23 - Text Equivalent
| Age | 2005 | 2006 | 2007 | 2008 | 2009 | 2010 | 2011 | 2012 | 2013 | 2014 |
|---|---|---|---|---|---|---|---|---|---|---|
| 15 to 19 | 1.0 | 0.9 | 1.2 | 1.2 | 3.4 | 3.9 | 4.4 | 6.1 | 3.8 | 4.0 |
| 20 to 24 | 6.2 | 7.6 | 6.2 | 9.0 | 12.7 | 12.9 | 16.1 | 21.0 | 20.7 | 19.6 |
| 25 to 29 | 8.9 | 8.5 | 9.9 | 13.1 | 17.0 | 15.4 | 19.8 | 21.9 | 24.8 | 25.1 |
| 30 to 39 | 12.4 | 15.6 | 14.2 | 13.6 | 16.4 | 15.9 | 17.3 | 20.1 | 21.6 | 24.2 |
| 40 to 59 | 8.9 | 11.3 | 10.5 | 11.4 | 12.3 | 14.2 | 13.6 | 14.8 | 15.8 | 17.9 |
| 60 + | 1.4 | 2.1 | 1.8 | 1.9 | 1.7 | 2.6 | 2.1 | 2.8 | 3.3 | 2.8 |
4.3 Provincial trends
In 2014, the rate of reported cases of infectious syphilis was highest in Nunavut (224.1 per 100,000), followed by British Columbia (9.3 per 100,000) and Manitoba (7.8 per 100, 000). In all provinces and territories, the rate was substantially higher in males than in females except in Nunavut, where the female rate was slightly higher than the male rate (255.4 vs 195.1 per 100,000) (Table 5). A similar pattern was seen in 2013 (Table 6).
| Province | Female | Male | TotalFootnote 1 | |||
|---|---|---|---|---|---|---|
| # of Cases | Rate per 100,000 |
# of Cases | Rate per 100,000 |
# of Cases | Rate per 100,000 |
|
| Canada | 155 | 0.9 | 2,198 | 12.5 | 2,357 | 6.6 |
| BC | 18 | 0.8 | 413 | 18.0 | 432 | 9.3 |
| AB | 12 | 0.6 | 137 | 6.5 | 149 | 3.6 |
| SK | 0 | 0.0 | 28 | 4.9 | 28 | 4.9 |
| MB | 11 | 1.7 | 89 | 14.0 | 100 | 7.8 |
| ON | 31 | 0.5 | 825 | 12.3 | 858 | 6.3 |
| QC | 33 | 0.8 | 550 | 13.5 | 584 | 7.1 |
| NB | 1 | 0.3 | 26 | 7.0 | 27 | 3.6 |
| NS | 3 | 0.6 | 61 | 13.2 | 64 | 6.8 |
| PE | 1 | 1.33 | 8 | 11.2 | 9 | 6.2 |
| NL | 0 | 0.0 | 24 | 9.2 | 24 | 4.6 |
| YT | 0 | 0.0 | 0 | 0.0 | 0 | 0.0 |
| NT | 0 | 0.0 | 0 | 0.0 | 0 | 0.0 |
| NU | 45 | 255.4 | 37 | 195.1 | 82 | 224.1 |
|
||||||
| Province | Female | Male | TotalFootnote 1 | |||
|---|---|---|---|---|---|---|
| # of Cases | Rate per 100,000 | # of Cases | Rate per 100,000 | # of Cases | Rate per 100,000 | |
| Canada | 142 | 0.80 | 2,038 | 11.69 | 2,182 | 6.21 |
| BC | 6 | 0.26 | 447 | 19.64 | 454 | 9.91 |
| AB | 24 | 1.22 | 99 | 4.86 | 123 | 3.07 |
| SK | 5 | 0.91 | 12 | 2.15 | 17 | 1.54 |
| MB | 5 | 0.79 | 47 | 7.48 | 52 | 4.11 |
| ON | 42 | 0.61 | 678 | 10.19 | 720 | 5.31 |
| QC | 28 | 0.68 | 602 | 14.87 | 631 | 7.74 |
| NB | 1 | 0.26 | 33 | 8.83 | 34 | 4.50 |
| NS | 3 | 0.62 | 80 | 17.30 | 83 | 8.80 |
| PE | 0 | 0.0 | 0 | 0.0 | 0 | 0.0 |
| NL | 1 | 0.37 | 7 | 2.69 | 8 | 1.51 |
| YT | 2 | 11.23 | 2 | 10.78 | 3 | 8.25 |
| NT | 0 | 0.0 | 0 | 0.0 | 0 | 0.0 |
| NU | 26 | 152.12 | 31 | 169.01 | 57 | 160.86 |
|
||||||
The overall infectious syphilis rates have increased in most provinces and territories since 2005 and there have been several large fluctuations in rates in certain provinces related to outbreak situations (Figure 24).
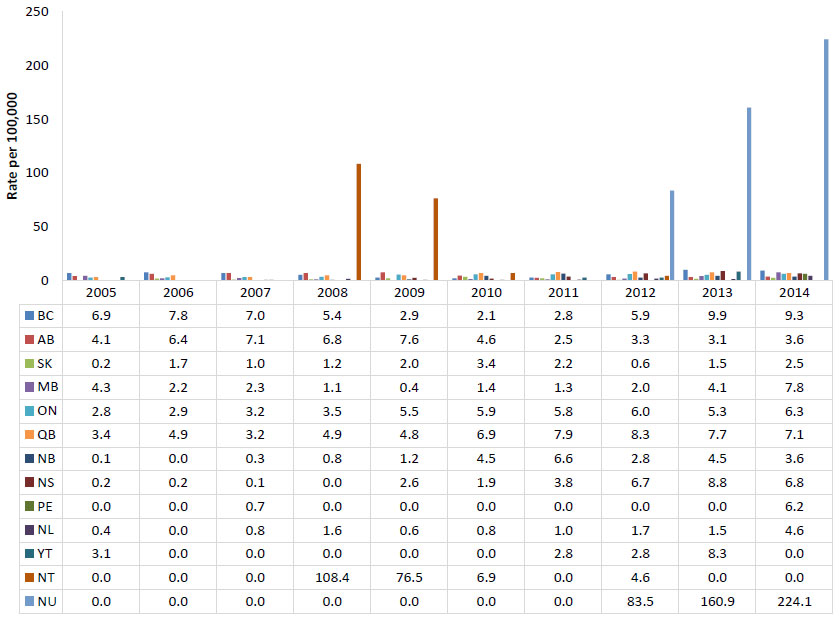
Figure 24 - Text Equivalent
| Province | 2005 | 2006 | 2007 | 2008 | 2009 | 2010 | 2011 | 2012 | 2013 | 2014 |
|---|---|---|---|---|---|---|---|---|---|---|
| BC | 6.9 | 7.8 | 7.0 | 5.4 | 2.9 | 2.1 | 2.8 | 5.9 | 9.9 | 9.3 |
| AB | 4.1 | 6.4 | 7.1 | 6.8 | 7.6 | 4.6 | 2.5 | 3.3 | 3.1 | 3.6 |
| SK | 0.2 | 1.7 | 1.0 | 1.2 | 2.0 | 3.4 | 2.2 | 0.6 | 1.5 | 2.5 |
| MB | 4.3 | 2.2 | 2.3 | 1.1 | 0.4 | 1.4 | 1.3 | 2.0 | 4.1 | 7.8 |
| ON | 2.8 | 2.9 | 3.2 | 3.5 | 5.5 | 5.9 | 5.8 | 6.0 | 5.3 | 6.3 |
| QB | 3.4 | 4.9 | 3.2 | 4.9 | 4.8 | 6.9 | 7.9 | 8.3 | 7.7 | 7.1 |
| NB | 0.1 | 0.0 | 0.3 | 0.8 | 1.2 | 4.5 | 6.6 | 2.8 | 4.5 | 3.6 |
| NS | 0.2 | 0.2 | 0.1 | 0.0 | 2.6 | 1.9 | 3.8 | 6.7 | 8.8 | 6.8 |
| PE | 0.0 | 0.0 | 0.7 | 0.0 | 0.0 | 0.0 | 0.0 | 0.0 | 3.4 | 6.2 |
| NL | 0.4 | 0.0 | 0.8 | 1.6 | 0.6 | 0.8 | 1.0 | 1.7 | 1.5 | 4.6 |
| YT | 3.1 | 0.0 | 0.0 | 0.0 | 0.0 | 0.0 | 2.8 | 2.8 | 8.3 | 0.0 |
| NT | 0.0 | 0.0 | 0.0 | 108.4 | 76.5 | 6.9 | 0.0 | 4.6 | 0.0 | 0.0 |
| NU | 0.0 | 0.0 | 0.0 | 0.0 | 0.0 | 0.0 | 0.0 | 83.5 | 160.9 | 224.1 |
4.4 International comparison
Infectious syphilis rates appear to be increasing in Canada, the US, Australia and England. The rates in the US were the lowest among these countries during the period 2012 to 2014, likely in part because the US only reports cases of primary and secondary syphilis. In 2014, Canada had lower rates of infectious syphilis compared to Australia and England (Figure 25). All countries show rates being significantly higher among males.
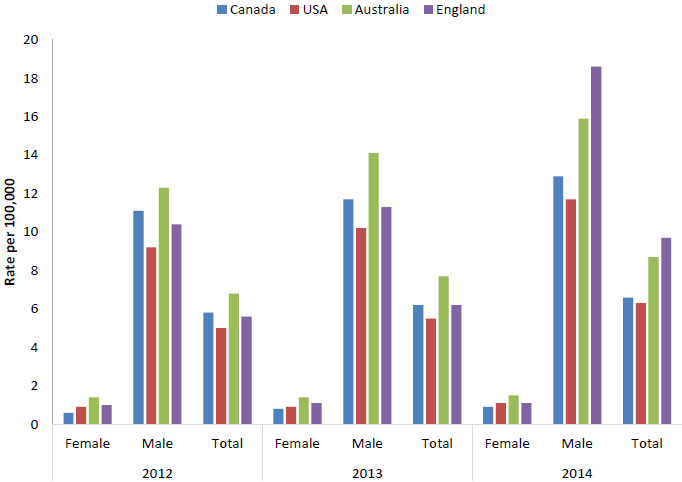
Footnotes
- Footnote 2
-
USA reported cases and rates reflect only primary and secondary syphilis.
Figure 25 - Text Equivalent
| Country | 2012 | 2013 | 2014 | ||||||
|---|---|---|---|---|---|---|---|---|---|
| Female | Male | Total | Female | Male | Total | Female | Male | Total | |
| Canada | 0.6 | 11.1 | 5.8 | 0.8 | 11.7 | 6.2 | 0.9 | 12.9 | 6.6 |
| USA | 0.9 | 9.2 | 5 | 0.9 | 10.2 | 5.5 | 1.1 | 11.7 | 6.3 |
| Australia | 1.4 | 12.3 | 6.8 | 1.4 | 14.1 | 7.7 | 1.5 | 15.9 | 8.7 |
| England | 1 | 10.4 | 5.6 | 1.1 | 11.3 | 6.2 | 1.1 | 18.6 | 9.7 |
4.5 Congenital syphilis
Congenital syphilis is caused by the transmission of T. pallidum from an infected pregnant woman to her fetus. The majority of infants with congenital syphilis are infected in utero, but they can also be infected by contact with an active genital lesion at the time of delivery. The risk of transmission in untreated women varies with the stage of disease: the risk is 70-100% with primary or secondary syphilis, 40% with early latent syphilis, and 10% in late latent stages in pregnancyFootnote 32. Live-born infected children can suffer serious consequences, including cerebral palsy, hydrocephalus, sensorineural hearing loss, and musculoskeletal deformity, all of which may be prevented with timely treatment during pregnancy (36). Routine prenatal screening for syphilis and prompt treatment of infection is an important way to prevent congenital syphilis, and lack of appropriate prenatal care is the primary factor related to congenital syphilis infectionFootnote 37Footnote 38.
Rates of reported cases of congenital syphilis began to rise in 2005, reaching a peak of 2.6 per 100,000 live births in 2009. Data suggest that the increase in reported congenital syphilis cases observed over this timeframe was linked to outbreaks of infectious syphilis among heterosexuals Footnote 39. Since 2009, occurrences of congenital syphilis have declined; in 2014, no cases of congenital syphilis were reported in Canada (Table 7).
While congenital syphilis rates in Canada have decreased in the past few years, the US reported a rise of 27.5% in cases from 2013 to 2014 (359 and 458 cases respectively)Footnote 10 and Australia also reported a rise in cases, from 3 in 2009 to 5 in 2014, although the number of cases is still lower than the 16 cases seen in 2005Footnote 11.
| Year | Total reported casesFootnote 1 | Rate per 100,000 live birthsFootnote 2 |
|---|---|---|
| 2004 | 1 | 0.3 |
| 2005 | 9 | 2.6 |
| 2006 | 6 | 1.7 |
| 2007 | 7 | 1.9 |
| 2008 | 5 | 1.3 |
| 2009 | 10 | 2.6 |
| 2010 | 4 | 1.1 |
| 2011 | 4 | 1.1 |
| 2012 | 3 | 0.8 |
| 2013 | 1 | 0.3 |
| 2014 | 0 | 0.0 |
|
||
4.6 Conclusions
After years of near-zero incidence of infectious syphilis, rates of reported cases of infectious syphilis began to increase in 2001 and continue to do so. This increase is driven primarily by increasing rates among males and increasing STI rates among MSM have been observed in many western countries. The causes for these increases are complex and include changing sexual attitudes and social contexts related to risky sexual behaviour, as well as the use of recreational drugs that decrease inhibitions and impair decision making during sexual activity and the practice of seeking sex partners on the internet and through other venues posing higher risks of STIs Footnote 40 Footnote 41 Footnote 42 Footnote 43 Footnote 44 Footnote 45 Footnote 46. Increased rates of syphilis and other STIs among MSM have been associated with the practice of serosorting, i.e., choosing sexual partners whose HIV status is the same as one's ownFootnote 47 Footnote 48 Footnote 49.
Although rates of infectious syphilis among females are low, infection in women of childbearing age is of concern because of the potential of congenital syphilis in infants exposed to T. pallidum prenatally or during childbirth. Screening for syphilis as part of comprehensive prenatal care for all pregnant women is key to preventing congenital syphilis.
References
Footnotes
- Footnote 1
-
Public Health Agency of Canada. Canadian Notifiable Disease Surveillance System National Report: 2005-2008. 2012.
- Footnote 2
-
Statistics Canada. CANSIM table 053-0001: Estimates of births, deaths and marriages, Canada, provinces and territories. 2015; Available at: http://www5.statcan.gc.ca/cansim/a26?lang=eng&retrLang=eng&id=0530001&&pattern=&stByVal=1&p1=1&p2=-1&tabMode=dataTable&csid=. Accessed October 28, 2015.
- Footnote 3
-
Stamm WE. Chlamydia trachomatis infections of the adult. In: Holmes KK, Sparling PF, Mardh P, Lemon SM, Stamm WE, Piot P, et al, editors. Sexually transmitted diseases. 3rd ed. New York: McGraw-Hill; 1999. p. 407-422.
- Footnote 4
-
Expert working group for the Canadian Guidelines on Sexually Transmitted Infections. Chlamydial Infections. In: Wong T, Latham-Carmanico C, editors. Canadian Guidelines on Sexually Transmitted Infections. 2010th ed. Ottawa: Public Health Agency of Canada; 2010.
- Footnote 5
-
Fleming DT, Wasserheit JN. From epidemiological synergy to public health policy and practice: the contribution of other sexually transmitted diseases to sexual transmission of HIV infection. Sex Transm Infect 1999 Feb;75(1):3-17.
- Footnote 6
-
Navarro C, Jolly A, Nair R, Chen Y. Risk factors for general chlamydial infection. The Canadian journal of infectious diseases 2002;13(3):195-207.
- Footnote 7
-
McKay A, Barrett M. Rising reported rates of chlamydia among young women in Canada: what do they tell us about trends in the actual prevalence of the infection? The Canadian Journal of Human Sexuality 2008;17(1-2):61-69.
- Footnote 8
-
Rekart ML, Brunham RC. Epidemiology of chlamydial infection: are we losing ground? Sex Transm Infect 2008 Apr;84(2):87-91.
- Footnote 9
-
Tuite AR, Jayaraman GC, Allen VG, Fisman DN. Estimation of the burden of disease and costs of genital Chlamydia trachomatis infection in Canada. Sex Transm Dis 2012 Apr;39(4):260-267.
- Footnote 10
-
Centers for Disease Control and Prevention. Sexually Transmitted Disease Surveillance 2014. 2015.
- Footnote 11
-
The Kirby Institute. HIV, viral hepatitis and sexually transmissible infections in Australia Annual Surveillance Report 2015. 2015.
- Footnote 12
-
European Centre for Disease Prevention and Control. Sexually Transmitted Infections in Europe 2013. 2015.
- Footnote 13
-
Lee V, Tobin JM, Foley E. Relationship of cervical ectopy to chlamydia infection in young women. J Fam Plann Reprod Health Care 2006 Apr;32(2):104-106.
- Footnote 14
-
Junior JE, Giraldo PC, Goncalves AK, do Amaral RL, Linhares IM. Uterine cervical ectopy during reproductive age: cytological and microbiological findings. Diagn Cytopathol 2014 May;42(5):401-404.
- Footnote 15
-
Riera-Montes M, Velicko I. The chlamydia surveillance system in Sweden delivers relevant and accurate data: results from the system evaluation, 1997-2008. Euro Surveill 2011 Jul 7;16(27):19907.
- Footnote 16
-
Machalek K, Hanley B, Kajiwara J, Pasquali P, Stannard C. Chlamydia screening practices among physicians and community nurses in Yukon, Canada. International journal of circumpolar health 2013;72(22447).
- Footnote 17
-
Galdas PM, Cheater F, Marshall P. Men and health help-seeking behaviour: literature review. J Adv Nurs 2005 Mar;49(6):616-623.
- Footnote 18
-
Brunham RC, Rekart ML. The arrested immunity hypothesis and the epidemiology of chlamydia control. Sex Transm Dis 2008 Jan;35(1):53-54.
- Footnote 19
-
Brunham RC, Pourbohloul B, Mak S, White R, Rekart ML. The unexpected impact of a Chlamydia trachomatis infection control program on susceptibility to reinfection. J Infect Dis 2005 Nov 15;192(10):1836-1844.
- Footnote 20
-
Lyytikainen E, Kaasila M, Koskela P, Lehtinen M, Patama T, Pukkala E, et al. Chlamydia trachomatis seroprevalence atlas of Finland 1983-2003. Sex Transm Infect 2008 Feb;84(1):19-22.
- Footnote 21
-
Statistics Canada. Canadian Health Measures Survey (CHMS) data user guide: cycle 2. 2013 April 2013.
- Footnote 22
-
Rotermann M, Langlois KA, Severini A, Totten S. Prevalence of Chlamydia trachomatis and herpes simplex virus type 2: Results from the 2009 to 2011 Canadian Health Measures Survey
. Health Reports 2013 April 2013;24(4):10-15. - Footnote 23
-
Public Health Agency of Canada. Canadian guidelines for sexual health education. Ottawa: Public Health Agency of Canada; 2008.
- Footnote 24
-
Hook EW, Handsfield HH. Gonococcal infections in the adult. In: Holmes KK, Sparling PF, Mardh P, Lemon SM, Stamm WE, Piot P, et al, editors. Sexually transmitted diseases. 3rd ed. New York: Mc-Graw Hill; 1999. p. 451-466.
- Footnote 25
-
Gilbert M, Rekart ML. Recent trends in chlamydia and gonorrhea in British Columbia. BCMJ 2009 Dec;51(10):435.
- Footnote 26
-
Rietmeijer CA, Patnaik JL, Judson FN, Douglas JM,Jr. Increases in gonorrhea and sexual risk behaviors among men who have sex with men: a 12-year trend analysis at the Denver Metro Health Clinic. Sex Transm Dis 2003 Jul;30(7):562-567.
- Footnote 27
-
Mayer KH. Sexually transmitted diseases in men who have sex with men. Clin Infect Dis 2011 Dec;53 Suppl 3:S79-83.
- Footnote 28
-
Cassels S, Katz DA. Seroadaption among men who have sex with men: emerging research themes. Current HIV/AIDS reports 2013;10(4):305-313.
- Footnote 29
-
Centers for Disease Control and Prevention. Sexually Transmitted Disease Surveillance 2013. 2014.
- Footnote 30
-
The Kirby Institute. HIV, viral hepatitis and sexually transmitted infections in Australia Annual Surveillance Report 2014. Sydney NSW 2052: The Kirby Institute, UNSW; 2014.
- Footnote 31
-
Public Health England. Table 1: STI diagnoses & rates in England by gender, 2004 - 2013. 2014; Available at: https://www.gov.uk/government/uploads/system/uploads/attachment_data/file/340430/Table_1_STI_diagnoses_and_rates_in_England_by_gender.pdf. Accessed 12/16, 2014.
- Footnote 32
-
Expert working group for the Canadian Guidelines on Sexually Transmitted Infections. Syphilis. In: Wong T, Latham-Carmanico C, editors. Canadian guidelines on sexually transmitted infections. 2010th ed. Ottawa: Public Health Agency of Canada; 2010.
- Footnote 33
-
Buchacz K, Patel P, Taylor M, Kerndt PR, Byers RH, Holmberg SD, et al. Syphilis increases HIV viral load and decreases CD4 cell counts in HIV-infected patients with new syphilis infections. AIDS 2004 Oct 21;18(15):2075-2079.
- Footnote 34
-
Pialoux G, Vimont S, Moulignier A, Buteux M, Abraham B, Bonnard P. Effect of HIV infection on the course of syphilis. AIDS Rev 2008 Apr-Jun;10(2):85-92.
- Footnote 35
-
Narula T, Kamboj S, Martinez J, Engel LS. Co-infection: HIV and the great mimic syphilis. HIV Clin 2010 Spring;22(2):7-10.
- Footnote 36
-
Wendel GD,Jr, Sheffield JS, Hollier LM, Hill JB, Ramsey PS, Sanchez PJ. Treatment of syphilis in pregnancy and prevention of congenital syphilis. Clin Infect Dis 2002 Oct 15;35(Suppl 2):S200-9.
- Footnote 37
-
Genc M, Ledger WJ. Syphilis in pregnancy. Sex Transm Infect 2000 Apr;76(2):73-79.
- Footnote 38
-
Walker DG, Walker GJ. Prevention of congenital syphilis--time for action. Bull World Health Organ 2004 Jun;82(6):401.
- Footnote 39
-
Singh AE, Sutherland K, Lee B, Robinson JL, Wong T. Resurgence of early congenital syphilis in Alberta. CMAJ 2007 Jul 3;177(1):33-36.
- Footnote 40
-
Fenton KA, Imrie J. Increasing rates of sexually transmitted diseases in homosexual men in Western europe and the United States: why? Infect Dis Clin North Am 2005 Jun;19(2):311-331.
- Footnote 41
-
Avery AK, Zenilman JM. Sexually Transmitted Diseases and Travel: From Boudoir to Bordello. Microbiol Spectr 2015 Oct;3(5):10.1128/microbiolspec.IOL5-0011-2015.
- Footnote 42
-
de Vries HJ. Sexually transmitted infections in men who have sex with men. Clin Dermatol 2014 Mar-Apr;32(2):181-188.
- Footnote 43
-
D'Angelo-Scott H, Cutler J, Friedman D, Hendriks A, Jolly AM. Social network investigation of a syphilis outbreak in Ottawa, Ontario. Can J Infect Dis Med Microbiol 2015 Sep-Oct;26(5):268-272.
- Footnote 44
-
Deiss RG, Leon SR, Konda KA, Brown B, Segura ER, Galea JT, et al. Characterizing the syphilis epidemic among men who have sex with men in Lima, Peru to identify new treatment and control strategies. BMC Infect Dis 2013 Sep 10;13:426-2334-13-426.
- Footnote 45
-
Grov C, Breslow AS, Newcomb ME, Rosenberger JG, Bauermeister JA. Gay and bisexual men's use of the Internet: research from the 1990s through 2013. J Sex Res 2014;51(4):390-409.
- Footnote 46
-
Marti-Pastor M, Garcia de Olalla P, Barbera MJ, Manzardo C, Ocana I, Knobel H, et al. Epidemiology of infections by HIV, Syphilis, Gonorrhea and Lymphogranuloma Venereum in Barcelona City: a population-based incidence study. BMC Public Health 2015 Oct 5;15(1):1015-015-2344-7.
- Footnote 47
-
Bruce D, Harper GW, Suleta K, The Adolescent Medicine Trials Network for HIV/AIDS Interventions. Sexual risk behavior and risk reduction beliefs among HIV-positive young men who have sex with men. AIDS Behav 2013;17(4):1515-1523.
- Footnote 48
-
Jin F, Prestage GP, Templeton DJ, Poynten IM, Donovan B, Zablotska I, et al. The impact of HIV seroadaptive behaviors on sexually transmissible infections in HIV-negative homosexual men in Sydney, Australia. Sex Transm Dis 2012 Mar;39(3):191-194.
- Footnote 49
-
Marcus U, Schmidt AJ, Hamouda O. HIV serosorting among HIV-positive men who have sex with men is associated with increased self-reported incidence of bacterial sexually transmissible infections. Sex Health 2011 Jun;8(2):184-193.
Appendix A: Case definitions
| Infection status | Case definition |
|---|---|
| Confirmed Case | Laboratory evidence of infection in genitourinary specimens:
|
| Confirmed Case - Extra-genital Infections | Laboratory evidence of infection in rectum, conjunctiva, pharynx and other extra-genital sites:
|
| Confirmed Case - Perinatally Acquired Infections | Laboratory evidence of infection:
|
| Infection status | Case definition |
|---|---|
| Confirmed Case - Genital infections | Laboratory evidence of infection in genitourinary specimens:
|
| Confirmed Case - Extra-genital Infections | Laboratory confirmation of infection from pharynx, rectum, joint, conjunctiva, blood and other extra-genital sites:
|
| Confirmed Case - Perinatally Acquired Infections | Laboratory confirmation of infection from neonate in the first four weeks of life leading to the diagnosis of gonococcal conjunctivitis, scalp abscess, vaginitis, bacteremia, arthritis, meningitis or endocarditis:
|
| Infection status | Case definition |
|---|---|
| Confirmed Case - Early Congenital Syphilis (within 2 years of birth) | Laboratory confirmation of infection:
|
| Confirmed Case - Primary Syphilis | Laboratory confirmation of infection:
|
| Confirmed Case - Secondary Syphilis | Laboratory evidence of infection:
|
|
|