
Estimates of HIV incidence, prevalence and Canada’s progress on meeting the 90-90-90 HIV targets
Download the alternative format
(PDF format, 4.87 MB, 24 pages)
Organization: Public Health Agency of Canada
Published: December 2020
Related Topics
On this page
- Highlights
- Acknowledgements
- Introduction
- Canada's progress on meeting the 90-90-90 HIV targets
- 90-90-90 estimates in federal correction facilities
- 90-90-90 estimates for on-reserve First Nations communities in Saskatchewan
- Estimates number of new HIV infections
- Estimated number of people living with HIV
- Conclusion
- Apendix 1. Additional detail related to Canada's modelling method
- Appendix 2. Key populations used for the national estimates of HIV incidence and prevalence
- References
Highlights
- In 2018, there were an estimated 62,050 people living with HIV (PLHIV) in Canada. The number of people living with HIV in Canada continues to increase, due to ongoing transmission and increased longevity for people living with HIV.
- Among the 62,050 PLHIV in Canada, an estimated 87% were diagnosed. Engagement in the HIV care continuum has improved over time, with 85% of those diagnosed on antiretroviral treatment (ART) and 94% of people on treatment with a suppressed viral load at the end of 2018.
- This means that an estimated 13% (or 8,300 people) were not aware of their infection. Community-based testing strategies, such as self-testing, provide new opportunities to reach the undiagnosed, which can lead to better health outcomes and fewer new HIV transmissions.
- Structural and social barriers continue to present challenges for successful linkage to care and initiation of HIV treatment. In recent surveys of people who use drugs, nearly half of all participants who were aware of their HIV-positive status reported avoiding HIV services because of stigma and discrimination.
- Identifying predictors and groups at increased risk of not achieving viral suppression can help target intervention efforts. Surveys of key populations have demonstrated variation in the reporting of an undetectable viral load, from 63% among people who inject drugs and up to 96.7% among gay, bisexual and other men who have sex with men.
- An estimated 2,242 new HIV infections occurred in Canada in 2018, which is a slight increase from the estimate for 2016.
- The recent trend in HIV incidence does not appear to be decreasing, which has also been shown for other STBBIs (for example Hepatitis C).
- Canada still has work to do to meet all of the 90-90-90 targets. These estimates will be used to support the Measuring Impact commitment within the Government of Canada five-year action plan on sexually transmitted and blood-borne infections, with the goal of accelerating prevention, diagnosis and treatment to reduce the health impacts of STBBI in Canada by 2030.
Acknowledgements
The Public Health Agency of Canada acknowledges the Provincial / Territorial Public Health Authorities and other government departments for their contribution to the national estimates of HIV incidence, prevalence and 90-90-90 targets.
The Public Health Agency of Canada acknowledges the efforts by First Nations partners in the prevention of HIV infections, the care of people living with HIV, and their contribution in estimating HIV indicators for First Nations on-reserve communities in Saskatchewan.
Introduction
This report provides an update for 2018 on Canada's estimates of national HIV incidence and prevalence and on progress towards meeting the UNAIDS 90-90-90 targets. Reporting on these targets supports a pan-Canadian multi-sectoral response to HIV/AIDS in which this information can be used to help provide an understanding of the effectiveness of current responses to HIV in Canada, and to identify areas for improvement to guide HIV prevention and care work.
Why is monitoring progress important?
Canada has endorsed the Joint United Nations Programme on HIV/AIDS (UNAIDS) and the World Health Organization global health sector strategy on HIV that includes global targets to generate momentum towards the elimination of AIDS as a public health threat by 2030.Footnote 1 The 90-90-90 targets state that by 2020, 90% of all people living with HIV know their status, 90% of those diagnosed receive antiretroviral treatment, and 90% of those on treatment achieve viral suppression. When these three targets have been achieved, at least 73% (90% x 90% x 90%) of all people living with HIV (PLHIV) will be virally suppressed. UNAIDS’ modelling suggests that achieving these targets by 2020 will enable the world to eliminate the AIDS epidemic by 2030.Footnote 1
The continuum of HIV care is a useful framework for assessing progress against the 90-90-90 targets. The sequential nature of the stages in the continuum can point to where efforts need to be focussed and which areas require improvement. Estimating HIV prevalence (the number of people living with HIV - both diagnosed and undiagnosed) is the first step in the continuum of care, and is critical for guiding the planning and investment for treatment, care and ongoing support for people living with and affected by HIV and AIDS. In addition, understanding HIV incidence (the number of new infections occurring during a specific period of time) is fundamental for understanding temporal changes in transmission patterns, and is useful for public health decision makers to monitor, strengthen and evaluate the impact of multi-sectoral public health actions.
Globally, estimating HIV incidence, prevalence and progress on the 90-90-90 targets is undertaken to monitor HIV epidemics and to guide prevention and control programs. These estimates support all partners and stakeholders to have a better understanding of key populations where action is needed to reduce the public health impact of HIV and AIDS.
How are we monitoring progress in Canada?
In February 2018, PHAC convened an expert working group meeting to discuss the measures within the HIV continuum of care for Canada. Based on a review of measures used internationally, the PHAC expert group recommended monitoring a four-stage continuum: Stage 1 – the estimated number of all people living with HIV (PLHIV); Stage 2 – the number of all PLHIV who have been diagnosed; Stage 3 – the number on PLHIV who have been diagnosed and who are on ART; and Stage 4 – the number of PLHIV on ART who are virally suppressed (Figure 1).
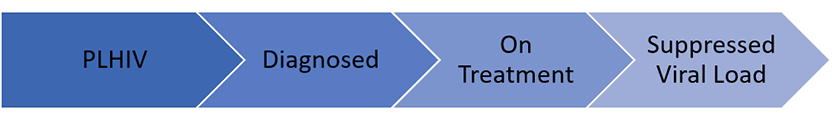
Figure 1 - Text description
This diagram shows the four-stage continuum Canada uses to measure the HIV continuum of care:
Stage 1 – the estimated number of all people living with HIV (PLHIV);
Stage 2 – the number of all PLHIV who have been diagnosed;
Stage 3 – the number on PLHIV who have been diagnosed and who are on ART; and
Stage 4 – the number of PLHIV on ART who are virally suppressed.
The Public Health Agency of Canada works closely with provinces, territories and other government departments to develop the national estimates of HIV incidence, prevalence and 90-90-90 measures using statistical modelling methods and available surveillance information from each jurisdiction. Measures were refined through an iterative process with provinces and territories, particularly where adjustments were necessary to account for uncertainty due to incomplete or lack of representative data. The national estimates were developed by weighting and rolling-up consensus-based estimates from each jurisdiction.
Standard definitions for each of the measures were developed and used where possible (Table 1). These definitions, which were agreed to by the expert working group supporting the pan-Canadian monitoring of national progress, are aligned with the definitions used by the European Centres for Disease Control, the United States Centers for Disease Control and Prevention, The Kirby Institute (Australia), and Public Health England (United Kingdom). In some instances, definitions were adapted by jurisdictions to account and adjust for differences in the definitions of “on treatment” and “suppressed viral load”.
| Measure | Definition |
|---|---|
Total estimated number of people living with HIV |
The total estimated number of people living with HIV at the end of 2018 based on a bespoke modelling approach, using the Canadian HIV Modelling Tool.Footnote 2 The estimate includes diagnosed and undiagnosed people. |
Number/percentage diagnosed 1st 90 |
Among those estimated to be living with HIV in Canada at the end of 2018, the number and proportion (%) of people who were diagnosed. Numerator: Number of people living with diagnosed HIV Denominator: Number of people living with HIV (both diagnosed and undiagnosed) |
Number/percentage who are currently on antiretroviral treatment 2nd 90 |
Among those living with diagnosed HIV, the number and proportion (%) of people with ≥1 antiretroviral therapy (ART) in 2018 (prescribed, dispensed or recorded on patient forms) Numerator: Number of people on treatment (≥1 antiretroviral therapy in 2018) Denominator: Number of people living with diagnosed HIV |
Number/percentage who had suppressed virus 3rd 90 |
Among those on treatment, the number and proportion (%) of people whose last HIV RNA measurement in 2018 was <200 copies/ml Numerator: Number of people with <200 copies/ml on their latest viral load (VL) test in 2018 Denominator: Number of people on treatment |
Data Sources
HIV estimates related to incidence, prevalence and the first 90-90-90 target were developed using HIV surveillance data reported by provinces and territories, estimated deaths among persons living with HIV, and back-calculation statistical modelling methods. Additional detail on these methods is provided in Appendix 1.
The development of estimates for the second and third 90-90-90 targets required additional information from the provinces and territories, including the following where available:
- Centralized HIV care program data, including linked treatment and laboratory viral load data;
- Provincial antiretroviral drug prescription data linked to HIV laboratory data;
- Unlinked data from drug prescription databases, laboratories, and HIV clinics;
- Cohorts of diagnosed persons engaged in HIV care.
Data limitations and caveats
Data systems, type of data available, and the capacity to link information from different sources vary across jurisdictions. Therefore, the measures developed through this process should be interpreted within the context of plausible ranges around each estimate, which reflect inherent uncertainty as a result of these measurement considerations and limitations.
Estimates are being published for 2018 since that is the most recent year for which complete HIV surveillance data are available. Complete 2019 surveillance data will be available in 2021.
Estimates published in this report replace all previous estimates published by the Agency concerning HIV incidence, prevalence and 90-90-90 targets in Canada. Assumptions, methods and primary data may have changed for some provinces because our knowledge of the epidemic has improved and the primary data provided by the provinces and territories for use in the model have been refined. Revisions to the methods and data mean that estimates for past years in this report may differ from previously published estimates, and the 2018 estimates should not be compared directly with previously published estimates.
Canada's progress on meeting the 90-90-90 HIV targets
In Canada at the end of 2018, an estimated 62, 050 people were living with HIV (plausible range 54,600 – 70,500). Among those living with HIV, an estimated 87% (plausible range 81-93%) were diagnosed. Of those diagnosed, 85% were estimated to be on treatment (plausible range 81% to 89%) and Canada has achieved the third 90 target with an estimated 94% of persons on treatment having a suppressed viral load (plausible range 92% to 96%) (Figure 2).
Canada's 2018 90-90-90 estimates lie within the range reported by other developed countries such as the United States of America, Germany, Australia, and Finland.
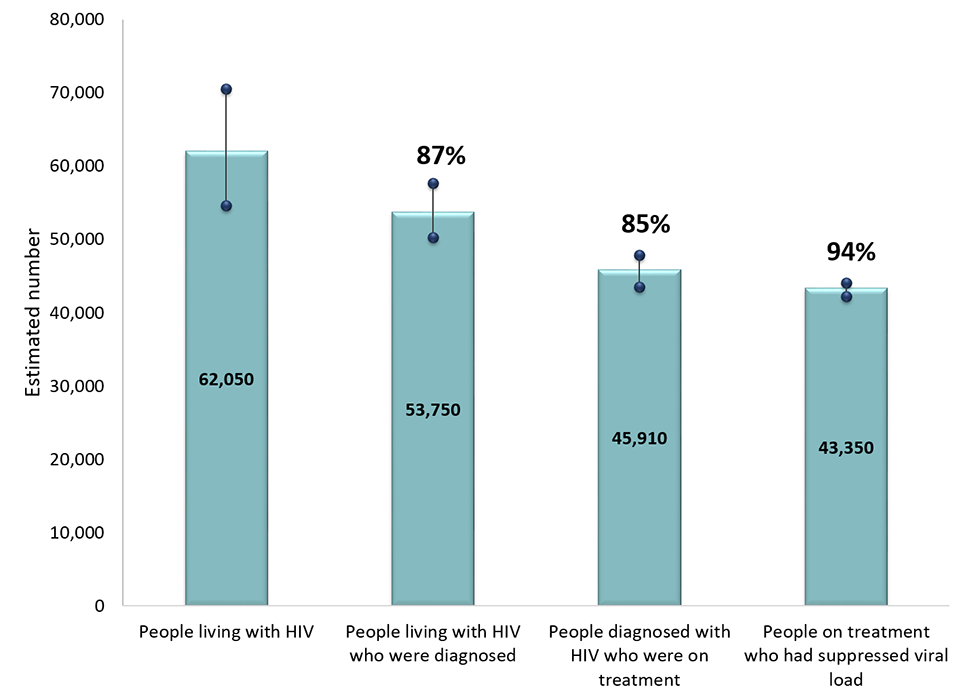
Figure 2 - Text description
This graph shows the estimated number of persons in Canada at the end of 2018 who were living with HIV, diagnosed, on treatment, and virally supressed. The horizontal axis shows the four components that were estimated (people living with HIV, diagnosed with HIV, on treatment, suppressed virus). The vertical axis shows the estimated number of persons, with the low and high ranges associated with each component.
This graph also shows the point estimate and plausible range associated with each of the three 90-90-90 targets. The first target is the percent of persons living with HIV who are diagnosed. The second target is the percent of persons diagnosed who are on treatment. The third target is the percent of persons on treatment who are virally suppressed.
| Estimate | Low range | Point estimate | High range |
|---|---|---|---|
| Estimated number of persons | |||
| Living with HIV | 54,600 | 62,050 | 70,500 |
| Diagnosed with HIV | 50,260 | 53,750 | 57,710 |
| On treatment | 43,540 | 45,910 | 47,840 |
| Suppressed virus | 42,240 | 43,350 | 44,070 |
| 90-90-90 estimates | |||
| Percent of persons living with HIV who were diagnosed | 81% | 87% | 93% |
| Percent of persons diagnosed who were on treatment | 81% | 85% | 89% |
| Percent of persons on treatment who were virally suppressed | 92% | 94% | 96% |
| Measure | People living with HIV | People living with HIV who were diagnosed | People diagnosed with HIV who were on treatment | People on treatment who had suppressed viral load |
|---|---|---|---|---|
| Estimated % | n/a | 87% | 85% | 94% |
| Plausible Range (%) | n/a | 81%-93% | 81%-89% | 92%-96% |
| Estimated # | 62,050 | 53,750 | 45,910 | 43,350 |
| Plausible Range (n) | 54,600 – 70,500 | 50,260 – 57,710 | 43,540 – 47,840 | 42,240 – 44,070 |
Canada has demonstrated improvement in all three 90-90-90 targets since 2016. Using current methods and data to revise previous estimates, it was estimated that in 2016, 86% (80-92%) of all people living with HIV knew their status, 84% (80-88%) of those diagnosed were on antiretroviral treatment, and 92% (90-94%) of those on treatment had a suppressed viral load.
The 90–90–90 targets and the HIV testing and treatment cascade (or care continuum) are two ways of looking at the same data. When we report on the progress towards the 90-90-90 targets, the denominator for each of the 90s targets is different (described in Table 1). The first 90 numerical value (e.g. 53,750 for Canada in 2018) is the denominator for the second 90, and the second 90 numerical value (e.g. 45,910 for Canada in 2018) is the denominator for the third 90.
If we look at the data differently, across the care continuum, the denominator for each step remains the same - all people living with HIV (e.g. 62,050 for Canada in 2018). In this approach, when all three 90-90-90 targets are achieved, 81% of all people living with HIV will be on ART (90% x 90%), and 73% of all people living with HIV will be virally suppressed (81% x 90%).Footnote 3
As a country, Canada has not met all three of the 90-90-90 targets individually. However using the care continuum measurement approach, 70% (87% x 85% x 94%) of people living with HIV in Canada in 2018 were estimated to have a suppressed viral load and were consequently unable to pass on the infection. From this perspective, the gap to achieving the overall target of 73% of those living with HIV who are virally suppressed is relatively small for Canada (Figure 3).
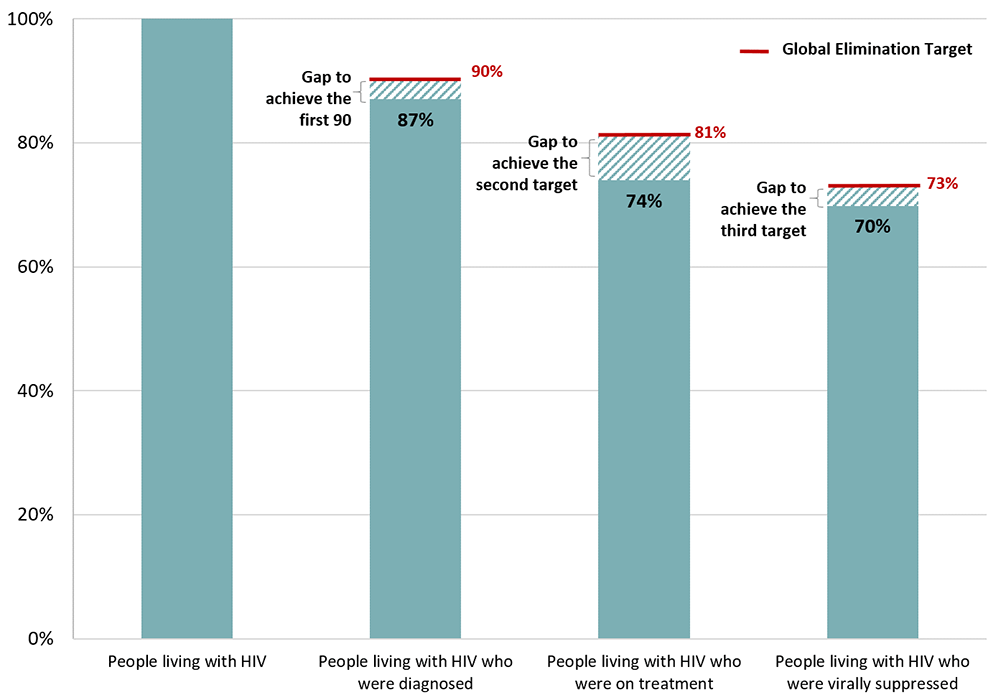
Figure 3 - Text description
This graph shows Canada's continuum of care, and gap to meet global elimination targets, 2018.
| 90-90-90 estimates | Global elimination target | Canada |
|---|---|---|
| Percent of persons living with HIV who were diagnosed | 90% | 87% |
| Percent of persons living with HIV who were on treatment | 81% | 74% |
| Percent of persons living with HIV who were virally suppressed | 73% | 70% |
Canada is closing the gap; however, progress is slow and there is still work to be done in order to meet the 90-90-90 targets. Typically, we focus our reporting on the proportion of people who are diagnosed and know their status, the proportion of people on treatment, and the proportion of people on treatment who have a suppressed viral load. By using data to better understand who has not been reached (for example those who are undiagnosed or are not on treatment), community and public health programs can be adjusted to improve their reach and help Canada meet its targets.
It is estimated that 18,700 people in Canada were missed throughout the care continuum, including those who were either undiagnosed, diagnosed but not on treatment, or on treatment but not virally suppressed. These present an important opportunity for intervention to reduce the number of individuals who may potentially transmit infection and who would benefit from being engaged in HIV care and support (Figure 4). Data from 2018 shows that the most significant gaps were among those who were undiagnosed (8,300), and among those who were diagnosed, but not on treatment (7,840), thus implying a need for targeted testing and linkage to care interventions.
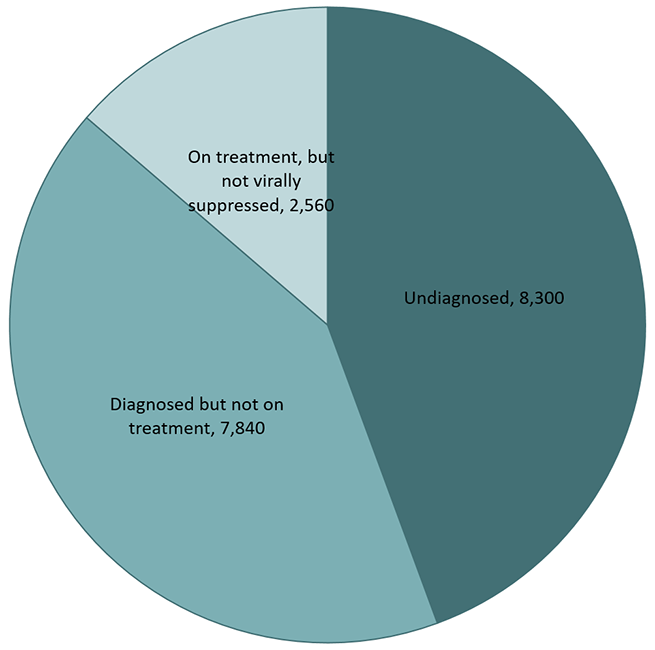
Figure 4 - Text description
This pie chart shows the number of people undiagnosed, diagnosed but not on treatment, or on treatment but not virally suppressed by the end of 2018.
| Group | Number |
|---|---|
| undiagnosed | 8,300 |
| diagnosed but not on treatment | 7,840 |
| on treatment but not virally suppressed | 2,560 |
Several factors play a role, either facilitating or creating barriers, in achieving each of the 90-90-90 targets. Given that testing and diagnosis is the entry point to HIV treatment, care and support for people living with HIV, it is likely that those who are undiagnosed, and thus unaware of their status, are not seeking or engaging in HIV services. As such, innovative approaches to HIV testing are needed to overcome barriers that prevent individuals from accessing STBBI testing and care, such as stigma.Footnote 4
Although the Canadian HIV screening and testing guide encourages the integration of HIV testing into other services, particularly those that test for infections with similar transmission routes,Footnote 5 this does not always occur. A recent internet survey showed that among Canadian gay, bisexual and other men who have sex with men (gbMSM), less than two-thirds (62.5%) had tested for HIV in the previous year and only one-quarter reported full STI screening in the last 12 months.Footnote 6
While testing, linkage to care and treatment for HIV within traditional clinical settings remain foundational to HIV care programs, other emerging strategies that use community-based services and HIV self-testing could help Canada reach the undiagnosed. The World Health Organization considers HIV self‐testing an important aspect of the global HIV response strategy. On November 2, 2020, Health Canada approved bioLytical's INSTI HIV self-test, which expands the suite of testing approaches available in Canada. As the newest testing approach available in Canada, HIV self-testing has the potential to reach people who currently do not or are unable to engage with HIV services, including individuals who may avoid testing in a healthcare setting out of concern about stigma and discrimination.Footnote 7 Of note however, self-testing does not replace conventional HIV testing, as those who test positive through an HIV self-test must seek follow-up confirmatory lab-based testing. As such, leveraging community-based strategies will be an important complementary step for reaching the undiagnosed in Canada, but ensuring that those who self-test are able to fully access treatment, care, and support will be essential.
Despite making progress, the national estimate for the second 90 target (proportion of those diagnosed who are on treatment) remained the lowest of the three targets. As countries globally have moved to treating all PLHIV as close to diagnosis as possible, it is critical to understand reasons for non-initiation, since persons not yet on treatment are at higher risk for HIV-related morbidity, mortality, and onward transmission of the virus. A systematic review of reasons for non-initiation of treatment showed that socio-economic characteristics, health status, emotional factors such as HIV-related stigma and anxiety, as well as beliefs about HIV and treatment were all connected to decisions not to start HIV treatment.Footnote 8 People with HIV who feel well or do not have symptoms may not feel ready to start taking lifetime treatment, or may feel that taking medication will make them feel worse. Financial burdens such as medication costs, transportation costs and unstable housing were reported in many studies. In all reviewed studies, HIV-related stigma was mentioned as a main barrier affecting decisions not to initiate treatment.Footnote 8 These results demonstrate the need for early counselling and support, and increasing awareness of the health benefits of timely treatment. Results from the Tracks survey of people who inject drugs in Canada,Footnote 9 demonstrated that existing structural and social barriers across the care continuum in Canada present challenges for successful linkage to care and initiation of HIV treatment. Nearly half of all participants who were aware of their HIV-positive status reported avoiding HIV services because of stigma and discrimination in the 12 months prior to the interview.
Since the mid-1990s, the availability of antiretroviral therapy (ART) has led to decreased HIV-related mortality and morbidity. For people living with HIV who are aware of their infection and can access and adhere to treatment, ART has transformed HIV from a fatal disease into a manageable chronic illness. After starting HIV treatment, many patients remain engaged in ongoing care for HIV and have follow-up services to monitor the effectiveness of therapy. The effectiveness of such follow-up may explain why the third 90-90-90 target is the highest of all three targets, which is also observed in other western countries. Achieving and maintaining HIV viral suppression can improve health outcomes and limit transmission to others.Footnote 10Footnote 11 This makes monitoring viral suppression an important aspect of HIV care as well as disease prevention efforts. Identifying predictors and groups at increased risk of non-suppression can enhance intervention efforts.Footnote 12 Among respondents who were aware of their HIV-positive status in the Tracks survey of people who inject drugs in Canada,Footnote 9 almost all of them (97.2%) had taken ART at some point, however less than 90% (87.7%) were currently taking ART at the time of the interview. Treatment adherence among this population (measured as no missed doses in the month prior to the interview) was less than 50% (42.5%). Among participants taking ART at the time of the interview, two-thirds (62.8%) reported an undetectable HIV viral load.Footnote 9 In comparison, among Canadian gbMSM respondants from the European Men-who have-sex-with-men Internet survey (EMIS), 99.1% of the HIV-positive participants reported current use of antiretroviral therapies and of these, 96.7% reported an undetectable viral load.Footnote 6 These differences, as well as the higher proportion of people who have been diagnosed but who are not on treatment, suggest that there are social, economic and environmental factors such as the experience of stigma and discrimination, poverty, housing instability, or social isolation that can influence whether or not a person achieves a suppressed viral load.
Rather than focus on a single number, such as the number of people receiving HIV treatment, the 90-90-90 targets recognize the need to focus more broadly on testing, on the quality and outcomes of antiretroviral therapy, and on the degree to which programmes are meeting their ultimate goal of viral suppression. Continuum of HIV care data reported for 2018 highlight the need for greater efforts if Canada is to achieve the 90-90-90 targets and viral suppression rates above 73%. As well, these data highlight losses at each stage of the continuum, and the need to use continuum data to identify where these losses are occurring and take steps to minimise them. Improvements to the 90-90-90 measures can be achieved by enhancing our understanding of the knowledge, behaviours, attitudes and experiences related to stigma, discrimination and barriers to services, and by reviewing policies that affect the determinants of health.
90-90-90 estimates in federal correction facilities
All Inmates
All inmates in federal correctional facilities are offered a health assessment on admission, and are also referred for, or can request, HIV testing anytime during incarceration. At the end of 2018, 88% of all inmates knew their status.Footnote a This includes those who were tested for HIV prior to incarceration, those who accepted voluntary testing on admission, and those who were referred for, or requested HIV testing during incarceration. Among the 141 inmates living with diagnosed with HIV at the end of 2018, 94% were on treatment, and 93% of those on treatment had a suppressed viral load (Figure 5).
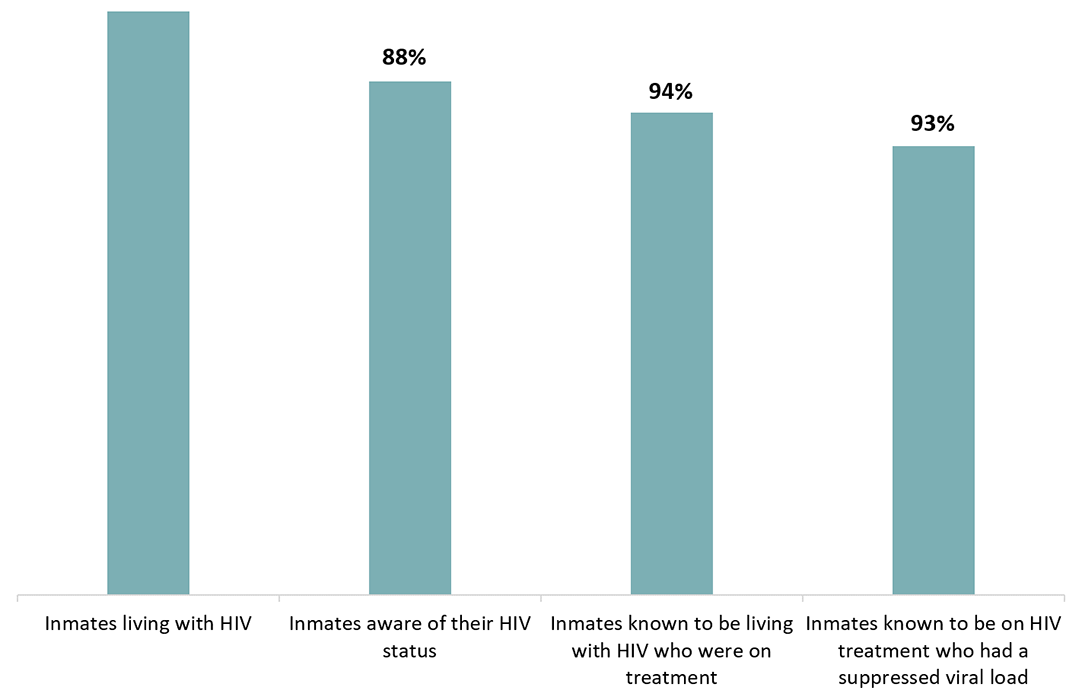
Figure 5 - Text description
This graph shows the estimate percentage of inmates who tested for HIV on admission, the percentage of inmates who were diagnosed on treatment and the percentage of inmates on treatment who were virally suppressed in Federal correctional facilities on December 2018.
| Indicators | Point estimate |
|---|---|
| Percent of inmates tested for HIV on admission | 88% |
| Percent of inmates living with diagnosed HIV who were on treatment | 94% |
| Percent of inmates on treatment who were virally suppressed | 93% |
Indigenous Ancestry among inmates
In 2018, 43% of inmates with HIV were of Indigenous ancestry. HIV prevalence was higher among those with Indigenous ancestry compared to non-Indigenous Ancestry (1.48% vs 0.82%). As of December 2018, among all inmates of Indigenous ancestry, 90% knew their status.Footnote a Of the Indigenous inmates known to be living with HIV, 94% were on treatment, and 92% of those on treatment had a suppressed viral load (Figure 6).

Figure 6 - Text description
This graph shows the estimate percentage of Indigenous inmates who were aware their HIV status, the percentage of inmates diagnosed with HIV who were on treatment and the percentage of inmates on treatment who were virally suppressed in Federal correctional facilities as of December 2018.
| Indicators | Point estimate |
|---|---|
| Percent of indigenous inmates aware their HIV status | 90% |
| Percent of indigenous inmates living with diagnosed HIV who were on treatment | 94% |
| Percent of indigenous inmates on treatment who were virally suppressed | 92% |
90-90-90 estimates for on-reserve First Nations communities in Saskatchewan
PHAC is working with provinces, territories and community groups to try to provide more community-specific measures of the progress on the 90-90-90 targets, and an example from Saskatchewan is included below.
Data from all First Nations on-reserve communities in Saskatchewan, which represent 82 communities, showed that at the end of 2018, of the individuals known to be living with diagnosed HIV, 79% were on treatment and 81% of those on treatment had achieved viral suppression (Figure 7).
These percentages represent slight improvements since 2016 when it was estimated that 77% of people living with diagnosed HIV were on treatment, and 75% of those on treatment had a suppressed viral load.
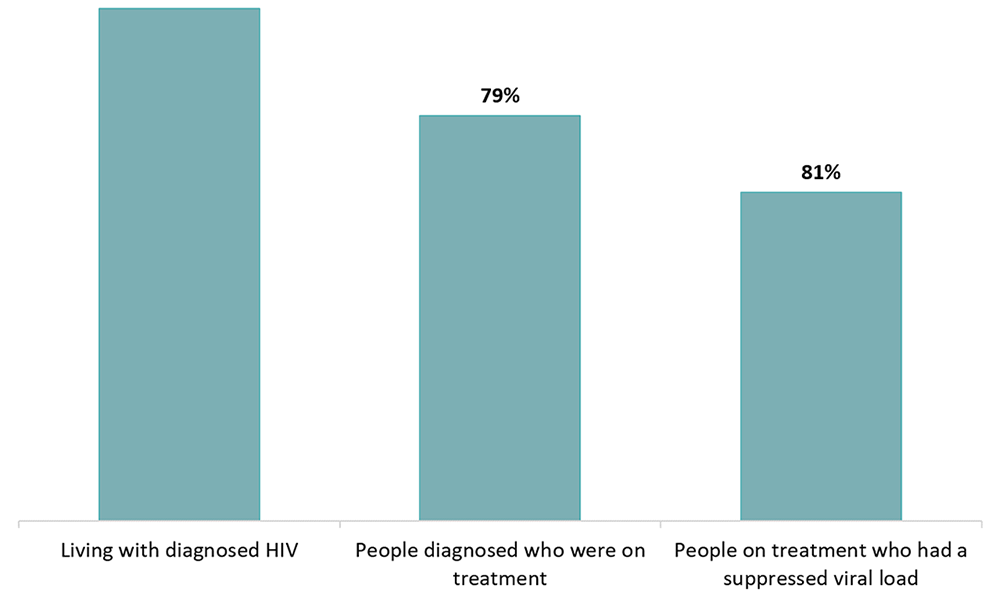
Figure 7 - Text description
This graph shows estimated proportion of persons living with diagnosed HIV who were on treatment, and had a suppressed viral load among First Nations on-reserve communities, Saskatchewan, 2018.
| Indicators | Point estimate |
|---|---|
| Percent of First Nation on-reserve living with diagnosed HIV who were on treatment | 79% |
| Percent of First Nation on-reserve on treatment who were virally suppressed | 81% |
Estimates number of new HIV infections
The Agency estimates that 2,242 new infections (range between 1,080 – 3,850) occurred in Canada in 2018. This estimate is a slight increase from the estimate for 2016 (1,960; range between 1,160 and 2,770) (Table 3, Figure 8).
The resulting estimated incidence rate in Canada for 2018 was 6.0 per 100,000 population (range between 2.9 and 10.4 per 100,000 population) which is a slight increase from the estimate for 2016 (5.4/100,000 population; range between 3.2 and 7.7 per 100,000 population).
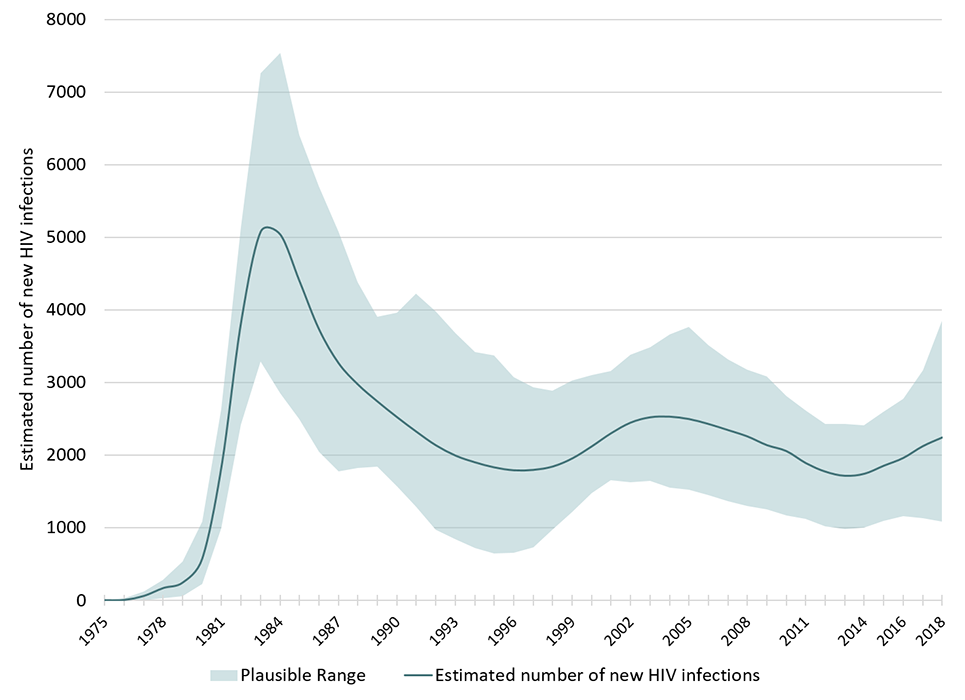
Figure 8 - Text description
This graph shows the point estimates of new HIV infections by year with each associated plausible ranges for point estimates. The vertical axis shows the estimated number of new HIV infections per year, with the low and high ranges. The horizontal axis shows the calendar years.
| Year | Low estimate | Point estimate | High estimate |
|---|---|---|---|
| 1975 | 0 | 0 | 0 |
| 1976 | 0 | 3 | 30 |
| 1977 | 1 | 58 | 119 |
| 1978 | 30 | 167 | 283 |
| 1979 | 53 | 243 | 536 |
| 1980 | 224 | 572 | 1083 |
| 1981 | 992 | 1858 | 2636 |
| 1982 | 2416 | 3836 | 5140 |
| 1983 | 3284 | 5077 | 7260 |
| 1984 | 2846 | 5042 | 7540 |
| 1985 | 2496 | 4394 | 6412 |
| 1986 | 2047 | 3732 | 5701 |
| 1987 | 1776 | 3267 | 5072 |
| 1988 | 1820 | 2971 | 4381 |
| 1989 | 1837 | 2738 | 3903 |
| 1990 | 1570 | 2523 | 3963 |
| 1991 | 1288 | 2321 | 4219 |
| 1992 | 973 | 2134 | 3982 |
| 1993 | 840 | 1993 | 3677 |
| 1994 | 722 | 1900 | 3416 |
| 1995 | 644 | 1830 | 3373 |
| 1996 | 650 | 1790 | 3073 |
| 1997 | 726 | 1795 | 2935 |
| 1998 | 971 | 1842 | 2882 |
| 1999 | 1214 | 1953 | 3028 |
| 2000 | 1479 | 2119 | 3104 |
| 2001 | 1656 | 2301 | 3158 |
| 2002 | 1621 | 2447 | 3383 |
| 2003 | 1646 | 2520 | 3488 |
| 2004 | 1548 | 2529 | 3658 |
| 2005 | 1525 | 2496 | 3764 |
| 2006 | 1447 | 2428 | 3508 |
| 2007 | 1360 | 2344 | 3312 |
| 2008 | 1301 | 2256 | 3172 |
| 2009 | 1249 | 2136 | 3087 |
| 2010 | 1170 | 2054 | 2816 |
| 2011 | 1125 | 1888 | 2616 |
| 2012 | 1020 | 1771 | 2430 |
| 2013 | 985 | 1714 | 2429 |
| 2014 | 1000 | 1742 | 2412 |
| 2015 | 1093 | 1853 | 2596 |
| 2016 | 1160 | 1960 | 2770 |
| 2017 | 1134 | 2122 | 3170 |
| 2018 | 1080 | 2242 | 3850 |
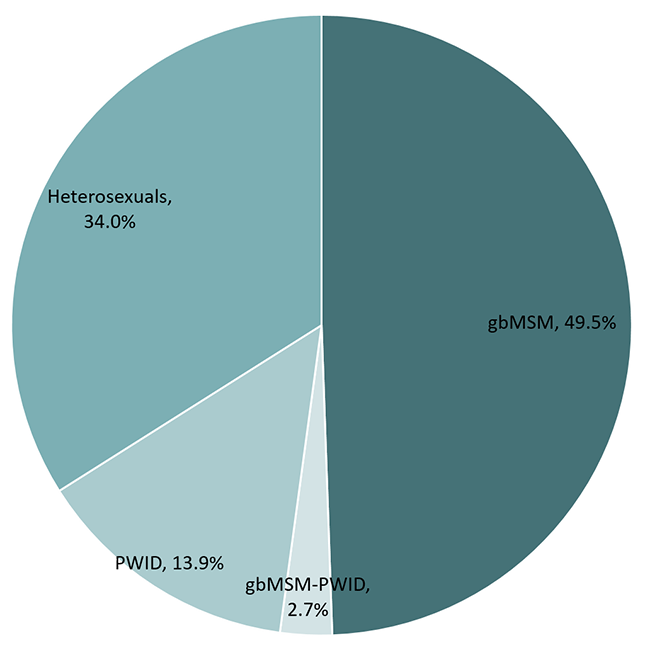
Figure 9 - Text description
This pie chart shows the estimated percentage of new HIV infections by key population in 2018.
| Risk group | Percentage |
|---|---|
| Gay, bisexual and other men who have sex with men (gbMSM) | 49.5% |
| People who inject drugs (PWID) | 13.9% |
| Heterosexual contacts | 34.0% |
| gbMSM-PWID | 2.7% |
Among the estimated new infections in 2018, an estimated 1,109 were among gay, bisexual and other men who have sex with men (gbMSM), representing just under half (49.5%) of all new HIV infections in 2018, despite representing approximately 3-4% of the Canadian adult male population. Although the gbMSM population continues to be over-represented in new HIV infections in Canada, the proportion of new infections among this population has decreased compared to 2016. (Table 3 and Figure 9).
Three hundred and twelve (312) of the estimated new infections in 2018 were among people who inject drugs (PWID), accounting for 13.9% of new infections. The proportion of new infections attributed to heterosexuals increased slightly to 34.0% from 31.7% in 2016.
An estimated 314 new HIV infections in 2018 occurred among Indigenous people (Table 3) which represented 14.0% of all new infections in 2018, whereas Indigenous Peoples represented 4.9% of the total Canadian population (according to the 2016 Census). This is an increase since 2016, when 12.3% of new infections were estimated to be among Indigenous Peoples. One quarter of new infections were estimated to be among females, which is a slight increase compared to the 2016 estimate of 22.2%.
| Category | 2018 | 2016 | ||||
|---|---|---|---|---|---|---|
| Point estimate | RangeFootnote * | Percentage | Point estimate | RangeFootnote * | Percentage | |
| Key Population | ||||||
| gbMSM | 1,109 | 540-1,900 | 49.5% | 1,036 | 610-1,470 | 52.9% |
| gbMSM-PWID | 60 | 30-100 | 2.7% | 59 | 30-90 | 3.0% |
| PWID | 312 | 150-540 | 13.9% | 243 | 140-350 | 12.4% |
| Heterosexuals | 761 | 370-1,300 | 34.0% | 622 | 360-880 | 31.7% |
| Other | <5 | 0-10 | <0.2% | <5 | 0-10 | <0.2% |
| Sex | ||||||
| Female | 566 | 270-970 | 25.2% | 435 | 250-620 | 22.2% |
| Male | 1,676 | 810-2,870 | 74.8% | 1,525 | 900-2,160 | 77.8% |
| Indigenous Origin | ||||||
| Indigenous | 314 | 150-540 | 14.0% | 241 | 140-340 | 12.3% |
| Non-Indigenous | 1,928 | 930-3,310 | 86.0% | 1,719 | 1,010-2,440 | 87.7% |
| Total | 2,242 | 1,080-3,850 | 100% | 1,960 | 1,160-2,770 | 100% |
|
||||||
Estimated number of people living with HIV
The Agency estimates that approximately 62,050 people were living with HIV (including AIDS) at the end of 2018 (range between 54,600 and 70,500). This estimate represents a 3% increase from the estimated 58,291 (range between 51,700 – 65,900) at the end of 2016 (Table 4, Figure 10).
The estimated prevalence rate in Canada at the end of 2018 was 167 per 100,000 population (range between 147 and 189 per 100,000 population).
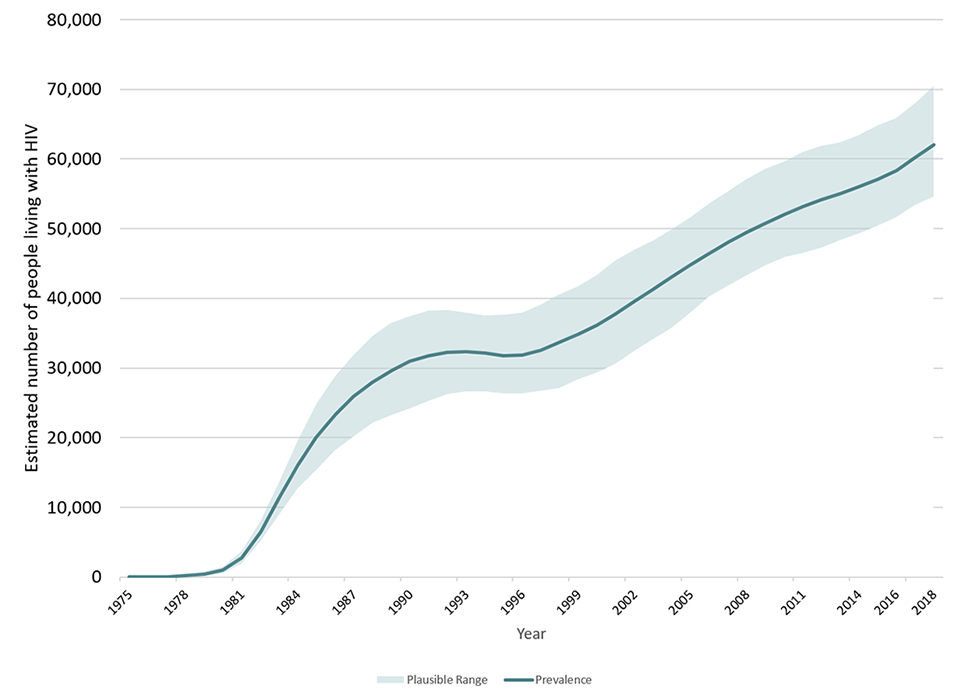
Figure 10 - Text description
This graph shows estimated number of people living with HIV by year. The vertical axis shows point estimates for number of people living with HIV, along with the associated low estimate and high estimate. The horizontal axis shows the calendar years.
| Year | Low estimate | Point estimate | High estimate |
|---|---|---|---|
| 1975 | 0 | 0 | 0 |
| 1976 | 0 | 0 | 30 |
| 1977 | 0 | 60 | 120 |
| 1978 | 70 | 220 | 350 |
| 1979 | 210 | 450 | 770 |
| 1980 | 580 | 1,000 | 1,520 |
| 1981 | 1,960 | 2,780 | 3,700 |
| 1982 | 5,120 | 6,450 | 7,920 |
| 1983 | 8,980 | 11,290 | 13,720 |
| 1984 | 12,770 | 16,050 | 19,540 |
| 1985 | 15,440 | 20,090 | 24,920 |
| 1986 | 18,150 | 23,330 | 28,800 |
| 1987 | 20,250 | 25,900 | 31,880 |
| 1988 | 22,120 | 28,000 | 34,590 |
| 1989 | 23,220 | 29,660 | 36,480 |
| 1990 | 24,250 | 30,940 | 37,480 |
| 1991 | 25,260 | 31,770 | 38,260 |
| 1992 | 26,210 | 32,230 | 38,310 |
| 1993 | 26,670 | 32,300 | 37,890 |
| 1994 | 26,650 | 32,140 | 37,580 |
| 1995 | 26,310 | 31,780 | 37,600 |
| 1996 | 26,360 | 31,870 | 37,950 |
| 1997 | 26,760 | 32,560 | 39,150 |
| 1998 | 27,090 | 33,670 | 40,570 |
| 1999 | 28,400 | 34,860 | 41,750 |
| 2000 | 29,330 | 36,170 | 43,370 |
| 2001 | 30,650 | 37,770 | 45,390 |
| 2002 | 32,470 | 39,500 | 47,040 |
| 2003 | 34,180 | 41,270 | 48,230 |
| 2004 | 35,820 | 43,030 | 49,930 |
| 2005 | 38,070 | 44,760 | 51,640 |
| 2006 | 40,260 | 46,440 | 53,610 |
| 2007 | 41,860 | 48,010 | 55,330 |
| 2008 | 43,310 | 49,430 | 57,160 |
| 2009 | 44,780 | 50,750 | 58,530 |
| 2010 | 45,890 | 52,020 | 59,610 |
| 2011 | 46,500 | 53,140 | 61,010 |
| 2012 | 47,270 | 54,100 | 61,910 |
| 2013 | 48,310 | 55,040 | 62,380 |
| 2014 | 49,310 | 56,030 | 63,440 |
| 2015 | 50,360 | 57,080 | 64,830 |
| 2016 | 51,700 | 58,290 | 65,900 |
| 2017 | 53,410 | 60,160 | 68,060 |
| 2018 | 54,600 | 62,050 | 70,500 |
Of the estimated 62,050 people living with HIV (PLHIV) in Canada at the end of 2018:
- Nearly half (48.9%) were among gay, bisexual and other men who have sex with men. (Figure 11).
- 14.0% were people who inject drugs, and 33.4% were heterosexuals.
- About one in four PLHIV was female (23.4%) and this proportion has been consistent over the past 6 years.
- One in ten (10.0%) was Indigenous. This proportion remained stable compared to the 2016 estimates.
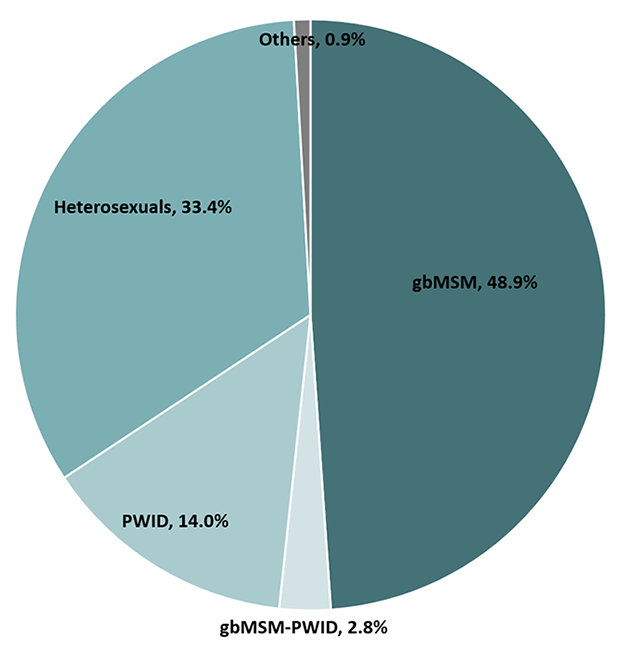
Figure 11 - Text description
This pie chart shows the estimated percentage of people living with HIV by key population in 2018.
| Key population | Percentage |
|---|---|
| Gay, bisexual and other men who have sex with men (gbMSM) | 48.9% |
| People who inject drugs (PWID) | 14.0% |
| Heterosexuals | 33.4% |
| gbMSM-PWID | 2.8% |
| Others | 0.9% |
| Category | 2018 | 2016 | ||||
|---|---|---|---|---|---|---|
| Point estimate | RangeFootnote * | Percentage | Point estimate | RangeFootnote * | Percentage | |
| Key Population | ||||||
| gbMSM | 30,316 | 26,500-34,600 | 48.9% | 28,409 | 25,000-32,300 | 48.7% |
| gbMSM-PWID | 1,728 | 1,500-2,000 | 2.8% | 1,628 | 1,430-1,850 | 2.8% |
| PWID | 8,690 | 7,600-9,920 | 14.0% | 8,328 | 7,340-9,460 | 14.3% |
| Heterosexuals | 20,750 | 18,200-23,600 | 33.4% | 19,355 | 17,050-22,000 | 33.2% |
| Other | 566 | 490-650 | 0.9% | 571 | 500-650 | 1.0% |
| Sex | ||||||
| Female | 14,545 | 12,700-16,600 | 23.4% | 13,647 | 12,000-15,500 | 23.4% |
| Male | 47,505 | 41,500-54,200 | 76.6% | 44,644 | 39,400-50,700 | 76.6% |
| Indigenous Origin | ||||||
| Indigenous | 6,180 | 5,400-7,050 | 10.0% | 5,742 | 5,050-6,550 | 9.9% |
| Non-Indigenous | 55,870 | 48,900-63,700 | 90.0% | 52,549 | 46,300-59,700 | 90.1% |
| Total | 62,050 | 54,600-70,500 | 100% | 58,291 | 51,700-65,900 | 100% |
|
||||||
Conclusion
This national HIV estimates report for 2018 provides updated insight into the trends of HIV in Canada. At the end of 2018, an estimated 62,050 individuals were living with HIV in Canada. Since HIV treatment has reduced HIV-related mortality, and new infections are occurring at a rate greater than the number of deaths, the overall number of people living with HIV in Canada will likely continue to increase. This will mean increased demand for HIV-related care and treatment.
Challenges remain in reaching the most marginalized people impacted by STBBIs. Of the 62,050 individuals living with HIV in Canada, an estimated 18,700 people were lost from the continuum of care, being either undiagnosed (13% or 8,300 people), diagnosed but not on treatment (7,840), or on treatment but not virally suppressed (2,560). These groups represent opportunities to expand the provision of effective HIV care and support and reduce the onward transmission of infection. Community-based testing strategies, such as self-testing, provide new opportunities to reach the undiagnosed, which can lead to better health outcomes and fewer new HIV transmissions. However, linkage to prevention and health care services will be an important consideration for ensuring those who self-test access prevention services (for those with a negative result), and access treatment, care, and support (for those with a positive result). The slow progress on the 2nd and 3rd 90-90-90 targets may be related to the experience of intersecting health challenges such as socio-economic characteristics, health status, emotional aspects such as HIV-related stigma and anxiety, as well as beliefs about HIV and treatment remaining as barriers to accessing and adhering to HIV treatment. Opportunities to address these gaps will require complex responses, potentially including further reductions to barriers for accessing treatment, such as improving treatment coverage, referral or connection mechanisms to health and support services, and addressing stigma and discrimination, including among health professionals, and should ultimately result in improved 90-90-90 measures.
Estimated HIV incidence in Canada has been slightly increasing since 2014. Additional years of data are needed to determine whether the increase in 2018 represents a true increase in HIV incidence (considering the wide plausible ranges around the estimate for the most recent period). One component of this possible increase in estimated HIV incidence could be an artefact due to increases in HIV testing initiatives such as 'Know Your Status'. This is because increased testing for HIV leads to an increase in new HIV diagnoses, which in turn can influence the modelled estimate of HIV incidence.
The most important consideration is that the recent trend in HIV incidence does not appear to be decreasing. This has also been shown for other STBBIs such as hepatitis C, where the number of reported cases increased from 10,553 in 2010 to 12,447 in 2018, with a corresponding rate increase from 31.0 to 33.6 per 100,000 population.Footnote 13 Additionally, a shift in the distribution of new HIV infections is beginning to be observed in Canada, with the proportion of cases among gay, bisexual and other men who have sex with men decreasing slightly since 2016, and the proportion of new infections increasing slightly among Indigenous Peoples, heterosexuals, and females. Similar findings have been noted among reported syphilis cases as well, where in 2018, the proportion of cases among women and people reporting heterosexual sex increased. Among reported cases of syphilis, the proportion of female cases doubled in Canada since 2014.Footnote 14 These data suggest an overlap between other STBBIs and HIV that may be contributing to increased health burden for individuals or communities,Footnote 15 since the same behaviours and circumstances that put a person at risk for getting other STBBIs also increase the risk for getting HIV. This also highlights the need to focus on the key populations that are affected by overlapping epidemics to address the unique aspects of these populations and communities.Footnote 16
Pre-exposure prophylaxis (PrEP) is a relatively recent biomedical intervention that can reduce the risk of sexual transmission of HIV for people at high risk of HIV infection, and its more widespread use may help reduce HIV incidence at the population level.Footnote 17Footnote 18Footnote 19 Health Canada approved PrEP in February 2016, and a recent analysis of Canadian pharmaceutical data found an increasing trend in the estimated number of persons prescribed PrEP from 2014 to 2018.Footnote 20 However, PrEP awareness and uptake or use varies across and within key populations. Among the Tracks – PWID survey participants, less than 15% were aware of PrEP, but less than 1% of HIV negative participants were taking PrEP.Footnote 9 Eighty-six percent of Canadian EMIS participants had heard of PrEP, but less than 10% had ever used or were currently taking PrEP.Footnote 6 More than half of Canadian EMIS participants reported being likely to use PrEP if it was available and affordable, which is consistent with other previous studies, suggesting affordability and accessibility as barriers to uptake.Footnote 6
Despite current efforts, Canada has not seen a decrease in new HIV infections in recent years and further work is needed to meet all of the 90-90-90 targets. The Public Health Agency of Canada will continue to work closely with provinces and territories (PTs) to enhance data sources to improve the ability to measure and assess progress on achieving the 90-90-90 targets. In particular, the Agency will work with PTs and community groups on the feasibility of producing estimates for key populations such as gbMSM, PWID and racialized communities such as the African, Caribbean and Black communities, which would help improve programs for these populations.
These estimates will be used to support the Measuring Impact commitment within the Government of Canada five-year action plan on sexually transmitted and blood-borne infections, with the goal of accelerating prevention, diagnosis and treatment to reduce the health impacts of STBBI in Canada by 2030.
Appendix 1. Additional detail related to Canada's modelling method
Reference: Yan, Ping; Zhang, Fan; and Wand, Handan (2011). Using HIV Diagnostic Data to Estimate HIV Incidence: Method and Simulation. Statistical Communications in Infectious Diseases: Vol. 3: Iss. 1, Article 6.
The statistical modelling method that was used to estimate the number of new HIV infections in Canada is based on a back-calculation method that combines HIV and AIDS diagnostic data (from national routine HIV/AIDS surveillance) with data on the proportions of recent infections among newly diagnosed individuals (from specialized recent-infection laboratory testing algorithms). The model estimates the time trend in the number of past HIV infections, up until the present time (2018 in this case) since surveillance data can only record the date of diagnosis and not the date of infection (which is some time before diagnosis). From this trend in past HIV infections, the model then projects forward to calculate the expected number of HIV diagnoses (using a mathematical formulation of the time between HIV infection and diagnosis based on the recent-infection algorithm data and model assumptions). The back-calculation method used for incidence estimation in Canada is similar to methods used in the European Union, the USA, and Australia.
Once the time trend in past HIV infections has been estimated, cumulative HIV incidence is calculated by adding up the incidence estimates for all years up to and including the most recent year (2018 in this case). Prevalence for the most recent year is then calculated as the cumulative incidence minus estimated total mortality among HIV-infected persons. For this, total mortality needs to be estimated (using data from Statistics Canada, provincial/territorial vital statistics, national reports of AIDS deaths, and Canadian research studies) since vital statistics data only record mortality among persons who died of HIV-related causes. Note that there are additional details not discussed here, such as accounting for HIV cases who had been previously diagnosed, who were likely infected in another province/territory or country, or who migrated out of the province / territory.
Appendix 2. Key populations used for the national estimates of HIV incidence and prevalence
| Key Population | Type of exposure |
|---|---|
| Gay, bisexual and other men who have sex with men (gbMSM) | Exposure during male-to-male sexual contact |
| People who inject drugs(PWID) | Exposure during the use of injection drugs |
| gbMSM-PWID | Exposure during either male-to-male sex and/or the use of injection drugs (used in instances where both exposures were reported for one person) |
| Heterosexuals | Exposure during heterosexual sex |
| Other | Persons who were exposed during: receipt of transfusion of blood or clotting factor, perinatal exposure, or occupational exposure |
In previous reports, the heterosexual category was separated into an "endemic" group (persons born in a so-called HIV-endemic country, mainly sub-Saharan Africa and the Caribbean) and a "non-endemic" group (born elsewhere). This separation is no longer considered appropriate, for reasons of increasing data incompleteness. The Public Health Agency of Canada is working with communities and with provinces and territories to find ways to better reflect the HIV situation in these communities.
References
- Footnote a
-
This measure is used as a proxy for the first 90 indicator for federal correctional facilities, based on currently available data. A person is considered to be aware of their status if they were tested for HIV prior to incarceration, accepted voluntary testing on admission, or were referred for, or requested HIV testing during incarceration.
- Footnote 1
-
UNAIDS. 90-90-90 An Ambitious Treatment Target to Help End the AIDS Epidemic. Geneva, Switzerland: Joint United Nations Programme on HIV/AIDS; 2014
- Footnote 2
-
Yan, Ping; Zhang, Fan; and Wand, Handan (2011). Using HIV Diagnostic Data to Estimate HIV Incidence: Method and Simulation. Statistical Communications in Infectious Diseases: Vol. 3: Iss. 1, Article 6.
- Footnote 3
-
UNAIDS. Understanding measures of progress towards 90-90-90. https://www.unaids.org/sites/default/files/measures-progress-90-90-90.pdf
- Footnote 4
-
Wong V, Jenkins E, Ford N, Ingold H. To thine own test be true: HIV self-testing and the global reach for the undiagnosed. J Int AIDS Soc. 2019;22 Suppl 1(Suppl Suppl 1):e25256. doi:10.1002/jia2.25256
- Footnote 5
-
Public Health Agency of Canada (2012). Human Immunodeficiency Virus - HIV Screening and Testing Guide. https://www.canada.ca/en/public-health/services/hiv-aids/hiv-screening-testing-guide.html
- Footnote 6
-
Brogan N, Paquette DM, Lachowsky NJ, Blais M, Brennan DJ, Hart TA, Adam B. Canadian results from the European Men-who-have-sex-with-men Internet survey (EMIS-2017). Can Commun Dis Rep 2019;45(11):271–82. https://doi.org/10.14745/ccdr.v45i11a01
- Footnote 7
-
Sharma M, Ying R, Tarr G, Barnabas R. Systematic review and meta-analysis of community and facility-based HIV testing to address linkage to care gaps in sub-Saharan Africa. Nature 2015; 528:S77–S85.
- Footnote 8
-
Ahmed S, Autrey J, Katz IT, Fox MP, Rosen S, Onoya D, Bärnighausen T, Mayer KH, Bor J. Why do people living with HIV not initiate treatment? A systematic review of qualitative evidence from low- and middle-income countries. Soc Sci Med. 2018 Sep;213:72-84. doi: 10.1016/j.socscimed.2018.05.048. Epub 2018 May 30. PMID: 30059900; PMCID: PMC6813776.
- Footnote 9
-
Tarasuk J, Zhang J, Lemyre A, Cholette F, Bryson M, Paquette D. National findings from the Tracks survey of people who inject drugs in Canada, Phase 4, 2017–2019. Can Commun Dis Rep 2020;46(5):138– 48. https://doi.org/10.14745/ccdr.v46i05a07
- Footnote 10
-
Cohen MS , Chen YQ , McCauley M , Gamble T , Hosseinipour MC , Kumarasamy N , et al. HPTN 052 Study Team. Antiretroviral therapy for the prevention of HIV-1 transmission. N Engl J Med. 2016;375:830-9. [PMID: 27424812] doi:10.1056/NEJMoa1600693
- Footnote 11
-
Rodger AJ , Cambiano V , Bruun T , Vernazza P , Collins S , van Lunzen J , et al. PARTNER Study Group. Sexual activity without condoms and risk of HIV transmission in serodifferent couples when the HIV-positive partner is using suppressive antiretroviral therapy. JAMA. 2016;316:171-81. [PMID: 27404185] doi:10.1001/jama.2016.5148
- Footnote 12
-
J.A. Chris Delaney, Jane M. Simoni, Ira B. Wilson, et al. HIV Viral Suppression Trends Over Time Among HIV-Infected Patients Receiving Care in the United States, 1997 to 2015: A Cohort Study. Annals of Internal Medicine 2018;169:376-384. [Epub ahead of print 21 August 2018]. doi:https://doi.org/10.7326/M17-2242
- Footnote 13
-
Public Health Agency of Canada. Notifiable Diseases Online
- Footnote 14
-
Public Health Agency of Canada. Infographic. Infectious Syphilis in Canada, 2018. Canada Communicable Disease Report. Volume 45–11, November 7, 2019: Sexually transmitted infections among MSM
- Footnote 15
-
Singer M. Introducing Syndemics: A Critical Systems Approach to Public and Community Health. Wiley: Jossey-Bass. 2009. 304 p. www.wiley.com/en-us/Introduction+to+Syndemics%3A+A+Critical+Systems+Approach+to+Public+and+Community+Health-p-9780470472033
- Footnote 16
-
Murti M, Wong J, Whelan M, Renda C, Hohenadel K, Macdonald L, Parry D. The need for integrated public health surveillance to address sexually transmitted and blood-borne syndemics. Can Commun Dis Rep 2019;45(2/3):63–6. https://doi.org/10.14745/ccdr.v45i23a03
- Footnote 17
-
Dawn K Smith, Patrick S Sullivan, Betsy Cadwell, Lance A Waller, Azfar Siddiqi, Robertino Mera-Giler, Xiaohong Hu, Karen W Hoover, Norma S Harris, Scott McCallister, Evidence of an Association of Increases in Pre-exposure Prophylaxis Coverage With Decreases in Human Immunodeficiency Virus Diagnosis Rates in the United States, 2012–2016, Clinical Infectious Diseases, , ciz1229, https://doi.org/10.1093/cid/ciz1229
- Footnote 18
-
Grulich AE et al., Population-level effectiveness of rapid, targeted, high-coverage roll-out of HIV pre-exposure prophylaxis in men who have sex with men: the EPIC-NSW prospective cohort study. Lancet HIV 2018 Nov;5(11):e629-e637.
- Footnote 19
-
Public Health England. HIV in the United Kingdom: Towards Zero HIV transmissions by 2030; 2019 report; Data to end of December 2018
- Footnote 20
-
Popovic, N; Yang, Q; Archibald, C (2019). Trends in HIV Pre-exposure Prophylaxis (PrEP) use in Canada, 2014–Poster Presentation, Canadian Conference on HIV/AIDS Research (CAHR) 2020.