
Survey on the impact of COVID-19 on access to STBBI-related services, including harm reduction services, for African, Caribbean and Black people in Canada

Download in PDF format
(1.86 MB, 41 pages)
Organization: Public Health Agency of Canada
Date published: 2022-09-29
Cat.: HP40-309/2022E-PDF
ISBN: 978-0-660-44085-9
Pub.: 20219
Table of contents
- Acknowledgement
- Introduction
- Methods
- Analysis
- Results
- Discussion
- Strengths and limitations
- Conclusion
- References
Acknowledgement
The success of this survey and of the national report was possible because of the Public Health Agency of Canada's collaboration and partnership with several community stakeholders including community researchers, organizations and members to ensure community engagement at every step of the survey including planning and implementation. Key stakeholders include the University of Ottawa and Women's Health in Women's Hands (WHIWH) who assembled a National Expert Working Group (NEWG) to guide the implementation of the survey. The NEWG consisted of African Caribbean and Black (ACB) researchers, service providers, and community members and leaders. NEWG referred to this project as the ACB Community PHAC-funded COVID-19 Impact (APCI) study. The authors gratefully acknowledge and thank all the members of the NEWG, Peer Research Assistants and the participants.
Introduction
The COVID-19 pandemic has disrupted health and social welfare in a proportion unparalleled in the recent past. The surge of the SARS-CoV-2 virus introduced the implementation of physical distancing measures to prevent onward transmission, nation wide shutdowns leading to social and economic consequences, and limited access to medical and social support services Footnote 1. In addition to the impact of the pandemic on public health, unprecedented challenges in delivering primary healthcare, including sexually transmitted and blood borne infections (STBBI) prevention, testing and treatment services as well as harm reduction services, have been reported across the country. These disruptions have had a disproportionate impact on populations most at risk for human immunodeficiency virus (HIV), or hepatitis C virus infection, and other STBBI. In Canada, these populations include African, Caribbean and Black (ACB) people, First Nations, Inuit and Métis peoples, and people who use drugs or alcohol (PWUD)Footnote 2 Footnote 3 Footnote 4.
Studies show that STBBI such as HIV, hepatitis C and syphilis contribute to increased health burden for ACB people, First Nations, Inuit and Métis peoples, and PWUD, as these infections occur more frequently in these populations that already face unique challenges Footnote5 Footnote6 Footnote7. Specifically, the social determinants of health, including structural barriers to healthcare, systemic racism, stigma and discrimination, housing instability, food insecurity, mental health issues, and family violence are known to account for disproportionate health risks and differential health outcomes for these key populations Footnote8 Footnote9 Footnote10 Footnote11 Footnote12. As such, the COVID-19 pandemic added another layer of vulnerability to populations already experiencing structural and social barriers to healthcare access.
Early in the pandemic, the Public Health Agency of Canada (PHAC) identified priority information gaps, representing the impetus to collect data to measure the impact of COVID-19 on the health and well-being of Canadians as well as its impact on provision of healthcare. In addition, the need for disaggregated data, specifically on ethnoracial status, unavailable from national case-based surveillance early on in the pandemic, was identified as a targeted priority. To address these information gaps, PHAC undertook to generate timely information on the impact of COVID-19 on provision of STBBI-related services among service providers and key populations known to be more affected by STBBI.
Four national online surveys were developed to better understand the impact of the COVID-19 pandemic on access to and delivery of STBBI prevention, testing and treatment, as well as harm reduction services. The first survey, the Survey on the Impact of COVID-19 on the delivery of STBBI prevention, testing and treatment including harm reduction services in Canada, was conducted in November and December of 2020. It focused on community-based organizations and local public health units providing STBBI-related services in Canada and examined the impact of COVID-19 on their ability to provide such services Footnote13. Three separate surveys of key populations were also undertaken for ACB people, First Nations, Inuit and Métis peoples, and PWUD. These population-specific surveys explored the impact of COVID-19 on access to STBBI-related services, as well as social and structural determinants of health that impact access to services, including mental health, housing stability, food insecurity, domestic violence, racism, stigma and discrimination, and substance use. The surveys were conducted in collaboration and partnership with several community stakeholders, who assembled expert working groups, such as the National Expert Working Group for the ACB survey.
This report presents the descriptive findings of the national Survey on the Impact of COVID-19 on access to STBBI-related services including harm reduction services for African, Caribbean and Black people in Canada, conducted from May 25, 2021 to July 12, 2021. In this survey, ACB people includes anyone who self-identifies as African, Caribbean or Black including people from historical Black communities in Canada, such as African Nova Scotian communities. The acronym ACB is increasingly being used across Canada to refer to culturally diverse Black people living in this country.
Methods
Data source and survey design
The Survey of the Impact of COVID-19 on access to STBBI-related services including harm reduction services for African, Caribbean and Black people in Canada was a national online, self-administered, cross-sectional survey. The survey design was inspired by the rapid assessment trendspotter methodology used in the European Monitoring Centre for Drug Addiction's online survey on the impact of COVID-19Footnote14. Conducting the survey online avoided the COVID-19 risk associated with close physical contact that could occur with face-to-face interviews. Additionally, the online survey method supported data collection from a potentially large number of participants over a short period of time.
Community engagement
PHAC collaborated and partnered with several community stakeholders including community researchers, organizations and members to ensure community engagement at every step of the survey, including planning and implementation. Key stakeholders included the University of Ottawa and Women's Health in Women's Hands (WHIWH) who assembled the National Expert Working Group (NEWG). The NEWG consisted of ACB researchers, service providers, and community members and leaders. The NEWG was considered an innovative community-based participatory approach for promoting the survey through various methods to ensure appropriate representation across diverse ACB sub-populations.
Sub-committees of the NEWG included knowledge mobilization, data analysis, community engagement, capacity building and data governance. These committees coordinated various activities to facilitate the review and interpretation of the survey findings. They were also involved in the development of different knowledge translation products including this report, data visualization dashboards, conference presentations, master slide deck, World Café virtual events, a PHAC published Data Blog and an infographic (to be released at a later date).
Questionnaire
Survey questions were developed from questionnaires used in prior surveys by the National Tracks Surveillance System and existing online surveys measuring the impact of COVID-19 Footnote7 Footnote14 Footnote15 Footnote16 Footnote17 Footnote18 Footnote19. Input from community members was also received to ensure survey questions and objectives were relevant to the specific target population and aligned with the realities and needs of the community. The survey collected information about sociodemographic characteristics, social determinants of health (i.e., mental health and wellness, employment and financial security, food security, domestic violence, and discrimination), substance use, use of and access to STBBI-related services including harm reduction services, and changes to accessing these services because of the pandemic. With the exception of a few open-ended questions (i.e., participant's age, first three characters of participant's postal code, number of years lived in Canada, and general comments regarding participant's experiences during the pandemic); all other questions were closed-ended (i.e., checkboxes).
The questionnaire was available in English and French and took approximately 10 to 20 minutes to complete. No directly identifying information was captured on the questionnaire.
Eligibility criteria
Participant eligibility criteria included living in Canada at the time of the survey, aged 18 years or older, ability to read English or French, and self-identifying as African, Caribbean or Black. Before starting the survey, details regarding privacy and personal information were provided to participants. At the end of this section, participants were presented with the following statement: "By clicking the Start Survey button, you have read and understood the information on this page and consent to participation." A weblink to mental health support and resources was also provided if the participant found any questions upsetting.
Recruitment
PHAC worked collaboratively with the NEWG to promote the survey. PHAC contacted just over 800 stakeholders including provincial and territorial contacts, local public health and community-based organizations to distribute the survey link and participate as appropriate. National and regional STBBI organizations and other government departments were encouraged to promote the survey link to their networks of service providers. Service providers were also encouraged to share the survey link with their clients and other known community-based organizations that provide STBBI services as deemed appropriate. Combined, over 5,000 different organizations and individuals from the general population were emailed through existing stakeholder contact lists. The survey link was also distributed via PHAC social media channels (i.e., over 175,000 Facebook followers, 500,000 Twitter followers and 275,000 LinkedIn followers) throughout the data collection period and social media messages were re-posted by key national stakeholders.
The University of Ottawa, WHIWH and the NEWG also developed and implemented targeted recruitment strategies to promote the survey. These included using their existing networks of community-based organizations, Peer Research Associates (PRAs), social media and online social events. The PRAs were recruited and trained to raise awareness of the survey within their communities by attending virtual community events and webinar sessions. The PRAs also targeted and promoted the survey among hard-to-reach populations including the youth, seniors and elderly.
The survey protocol and questionnaire were approved by the Health Canada/PHAC Research Ethics Board. Due to the anonymous nature of this survey and an anticipated low participant burden, reimbursement was not offered for participation in this survey.
Measures
All indicators are measured from the questions asked in the survey. While a large part of the indicators can be interpreted directly from the survey questions, some required additional coding for proper interpretation. In some cases, categories were collapsed to account for small cell counts or when similar concepts needed to be grouped. Described below are the measures used.
Food security
From a list of statements related to food access and food security, participants were asked how true each statement was since the start of the COVID-19 pandemic using a scale of "often true", "sometimes true" and "never true." Participants were classified as experiencing food insecurity if they indicated "often true" or "sometimes true" to any of the following statements:
- The food that you or other household members bought just didn't last, and there wasn't any money to get more
- You or other household members couldn't afford to eat balanced meals
- You ate less than you felt you should because there wasn't enough money to buy food
- Others in your household ate less than you felt they should because there wasn't enough money to buy food
- You or other household members accessed food or meals, at no cost to you, from a community organization
Domestic violence
From a list describing specific acts of domestic violence, participants were asked how their experiences with each of these acts, in the place where they lived, changed since the start of the COVID-19 pandemic. Answer options were "less often", "more often", "no change", "never experienced or does not apply to me", and "prefer not to answer." For each act of domestic violence, a variable was derived separating participants who reported experiencing the specific act from those who did not. Participants were classified as experiencing the specific act if they indicated "less often", "more often" or "no change" to any of the following acts:
- Someone yelled at you or said things to you that made you feel bad about yourself, embarrassed you in front of others, or frightened you
- Someone did things like push, grab, hit, slap, kick, or throw things at you during an argument or because they were angry with you
- Someone was more sexually aggressive towards you
- Someone yelled at someone you live with
- Someone did things like push, grab, hit, slap, kick, or throw things at someone you live with
- Someone controlled how money was spent in your household including limiting your access or withholding funds from you
Discrimination
From a list of attributes possibly related to discrimination, participants were asked for their self-perception of change in their experiences of discrimination when accessing healthcare services since the start of the COVID-19 pandemic. Answer options were "increase", "decrease", "no change", and "did not experience." Participants were classified as experiencing discrimination when accessing healthcare services if they indicated "increase", "decrease" or "no change" to any of the following attributes:
- Race or ethnicity or skin color, including anti-Black racism
- Gender
- Sexual orientation
- Use of substances
- Economic status
- Disability
- Age
Access to STBBI-related services
Participants were asked about their accessibility to the following three STBBI-related services:
- STBBI prevention, testing and treatment services (e.g., STBBI testing and treatment, oral HIV pre-exposure prophylaxis (PrEP), condom and/or dental dam provision, etc.)
- Harm reduction services (e.g., needle or syringe distribution, on-site consumption, drug checking, naloxone training and provision, etc.)
- Substance use and treatment services (e.g., counselling, opioid substitution treatment, inpatient services, etc.)
From a list of specific services, participants were asked to describe their access to these services since the start of the COVID-19 pandemic. Answer options were "always able to access", "sometimes able to access", "wanted or tried to, but was not able to access", and "did not try to access." Participants were classified as having difficulty accessing a specific service if they reported "sometimes able to access" or "wanted or tried to, but were not able to access."
Analysis
The purpose of this report and the analyses undertaken were exploratory and descriptive in nature. Descriptive statistics were computed with SAS Enterprise Guide 7.1. Small cell counts were assessed to determine the risk of identifying individual participants, and were left in when it was determined that there was no risk of re-identification, as per PHAC's Directive for the Collection, Use and Dissemination of Information Relating to Public Health (PHAC, 2013, unpublished document). Where data in the table contain small cell counts, the results should be interpreted with caution. For each survey question, participants who responded with answer options "prefer not to answer", "don't know", "refused" (i.e., skipped and proceeded to next question without providing an answer), or "not stated" (i.e., questions not answered because session timed out after 2 hours of inactivity) were excluded from analyses of the question except where otherwise indicated.
Results
Sociodemographic characteristics
A total of 1,556 eligible individuals participated in the survey from May 25, 2021 to July 12, 2021. The majority of participants were living in Ontario (42.7%) with smaller proportions living in Quebec (12.7%), British Columbia (10.9%), Alberta (10.9%), Newfoundland and Labrador (5.2%), Prince Edward Island (4.3%), New Brunswick (4.0%), Nova Scotia (3.5%), Saskatchewan (1.9%), Manitoba (1.2%), and the Territories (2.5%) (Table 1).
Among all participants, the average age was 40.2 years, ranging from 18 to 86 years. The largest proportion of participants were between the ages of 25 to 39 years (39.6%), followed by those aged 40 to 54 years (33.4%), 55 years of age and older (15.6%), with the smallest proportion of participants younger than 25 years of age (11.4%).
Most (63.2%) respondents self-identified as Black African, followed by 28.3% self-identifying as Black Caribbean, 7.3% as Black Indigenous or Black Canadian, 1.7% as Black American, 1.1% as Black Latin American, 6.6% as Multiracial (i.e., where one parent is Black), and 1.6% as another Black identity.
Nearly two-thirds (66.2%) of respondents identified their gender as cisgender female and one-third (30.9%) as cisgender male. A smaller proportion of respondents identified as transmasculine (2.2% - i.e., those assigned female at birth who identified with either male or a non-binary gender) and transfeminine (0.7% - i.e., those assigned male at birth who identified with either female or a non-binary gender). Most (81.8%) respondents reported their sexual orientation as heterosexual or straight and smaller proportions identified as gay or lesbian (4.7%), bisexual (6.6%), Two-spirit (0.6%), other (3.5%), or don't know (2.7%).
Under half (40.8%) of respondents were Canadian citizens born outside of Canada while about one-quarter (23.2%) were Canadian citizens born in Canada. Nearly one-in-five (18.8%) respondents reported being a landed immigrant or permanent resident with smaller proportions reporting being a temporary resident (10.0%), convention refugee or protected person (3.8%), refugee claimant or person in need of protection (2.3%), undocumented or with no immigration status (0.5%), asylum seeker (0.3%), or another non-Canadian citizen status (0.4%) (see footnote of Table 1 for further details on citizenship and immigration status). Among participants not born in Canada, most (29.0%) reported living in Canada for less than five years, followed by between five to nine years (23.5%), 10 to 14 years (17.2%), 25 years or more (15.6%), 15 to 19 years (8.3%), and finally 20 to 24 years (6.5%).
Among all participants, 88.2% had more than a high school education, 7.2% completed up to and including high school, and 4.6% had less than a high school education.
Since the start of the COVID-19 pandemic, the majority (93.6%) of participants were living in stable housing (i.e., living in their own or rented apartment or house, or in a family member's or friend's place). A smaller proportion (6.4%) reported living in precarious or inadequate housing (i.e., living in multiple residences or couch surfing, a hotel or motel room, rooming or boarding house, shelter or hostel, transition or halfway house, psychiatric institution or drug treatment facility, public place, or correctional facility).
When asked about healthcare insurance that covers all or part of healthcare costs and/or prescription drugs during the COVID-19 pandemic, most (66.3%) respondents reported having healthcare insurance coverage, while nearly one-quarter (24.0%) of participants reported not having healthcare coverage. One-in-ten respondents (9.7%) did not know whether they had healthcare insurance.
| Characteristic | n | TotalFootnote a | % |
|---|---|---|---|
| Province or Territory where participant lives | |||
| British Columbia | 169 | 1,554 | 10.9 |
| Alberta | 170 | 1,554 | 10.9 |
| Saskatchewan | 30 | 1,554 | 1.9 |
| Manitoba | 19 | 1,554 | 1.2 |
| Ontario | 664 | 1,554 | 42.7 |
| Quebec | 197 | 1,554 | 12.7 |
| New Brunswick | 62 | 1,554 | 4.0 |
| Nova Scotia | 54 | 1,554 | 3.5 |
| Prince Edward Island | 67 | 1,554 | 4.3 |
| Newfoundland and Labrador | 81 | 1,554 | 5.2 |
| TerritoriesFootnote b | 39 | 1,554 | 2.5 |
| None of the aboveFootnote c | 2 | 1,554 | 0.1 |
| Age group | |||
| Younger than 25 years | 178 | 1,556 | 11.4 |
| 25 to 39 years | 616 | 1,556 | 39.6 |
| 40 to 54 years | 519 | 1,556 | 33.4 |
| 55 to 64 years | 173 | 1,556 | 11.1 |
| 65 years or older | 70 | 1,556 | 4.5 |
| Race or racial backgroundFootnote d | |||
| Black African | 983 | 1,556 | 63.2 |
| Black Caribbean | 441 | 1,556 | 28.3 |
| Black Indigenous or Black Canadian | 113 | 1,556 | 7.3 |
| Black American | 27 | 1,556 | 1.7 |
| Black Latin American | 17 | 1,556 | 1.1 |
| Multiracial (where one parent is Black) | 103 | 1,556 | 6.6 |
| Another Black race | 25 | 1,556 | 1.6 |
| Gender identityFootnote e | |||
| Cisgender female | 990 | 1,496 | 66.2 |
| Cisgender male | 462 | 1,496 | 30.9 |
| TransfeminineFootnote f | 11 | 1,496 | 0.7 |
| TransmasculineFootnote g | 33 | 1,496 | 2.2 |
| Sexual orientationFootnote h | |||
| Heterosexual or straight | 1,271 | 1,553 | 81.8 |
| Gay or lesbian | 73 | 1,553 | 4.7 |
| Bisexual | 102 | 1,553 | 6.6 |
| Two-spirit | 10 | 1,553 | 0.6 |
| Other | 55 | 1,553 | 3.5 |
| Don't know | 42 | 1,553 | 2.7 |
| Citizenship status | |||
| Canadian citizen (born in Canada) | 358 | 1,546 | 23.2 |
| Canadian citizen (not born in Canada) | 630 | 1,546 | 40.8 |
| Landed immigrant or permanent resident | 291 | 1,546 | 18.8 |
| Convention refugee or protected personFootnotei | 59 | 1,546 | 3.8 |
| Refugee claimant or person in need of protectionFootnotej | 35 | 1,546 | 2.3 |
| Asylum seekerFootnotek | 5 | 1,546 | 0.3 |
| Temporary residentFootnotel | 155 | 1,546 | 10.0 |
| Undocumented or no immigration status | 7 | 1,546 | 0.5 |
| Not a Canadian citizen (other) | 6 | 1,546 | 0.4 |
| Number of years living in CanadaFootnotem | |||
| Less than 5 years | 282 | 974 | 29.0 |
| 5 to 9 years | 229 | 974 | 23.5 |
| 10 to 14 years | 167 | 974 | 17.2 |
| 15 to 19 years | 81 | 974 | 8.3 |
| 20 to 24 years | 63 | 974 | 6.5 |
| 25+ years | 152 | 974 | 15.6 |
| Education, highest level | |||
| Less than high school | 67 | 1,462 | 4.6 |
| Completed high school | 105 | 1,462 | 7.2 |
| Some college, CEGEP, vocational school, trade school, or apprenticeship training | 94 | 1,462 | 6.4 |
| Completed college, CEGEP, vocational school, trade school, or apprenticeship training | 159 | 1,462 | 10.9 |
| Some university | 111 | 1,462 | 7.6 |
| Completed university certificate or diploma | 131 | 1,462 | 9.0 |
| Completed undergraduate university degree | 356 | 1,462 | 24.4 |
| Completed graduate or professional university degree | 429 | 1,462 | 29.3 |
| Other | 10 | 1,462 | 0.7 |
| Housing statusFootnoten | |||
| Stable housingFootnoteo | 1,456 | 1,555 | 93.6 |
| Precarious or inadequate housingFootnotep | 99 | 1,555 | 6.4 |
| Healthcare insurance coverageFootnoteq Footnoter | |||
| Yes | 1,031 | 1,554 | 66.3 |
| No | 373 | 1,554 | 24.0 |
| Don't know | 150 | 1,554 | 9.7 |
Abbreviations: STBBI (sexually transmitted and blood-borne infection).
|
|||
Social determinants of health
Mental health and wellness
At the time of the survey, almost half (47.2%) of participants reported their mental health as excellent or very good, one quarter (26.1%) reported their mental health as good, 20.7% as fair and 6.1% as poor (Table 2). When asked how their mental health changed since the start of the pandemic, overall 41.5% reported no change in their mental health, about one-third (33.1%) of respondents reported somewhat worse or much worse mental health; while one-quarter (25.4%) of respondents reported somewhat better or much better mental health. This was different when looking at participants by their reported mental health at the time of data collection (Figure 1). Specifically, the majority (78.7%) of participants with poor mental health felt their mental health was worse since the start of the pandemic. This proportion dropped to 58.9% among participants with fair mental health, 36.5% among those with good mental health, and 14.1% among those with excellent or very good mental health.
| Indicator | n | TotalFootnote a | % |
|---|---|---|---|
| Mental health at the time of the survey | |||
| Excellent or very good | 733 | 1,553 | 47.2 |
| Good | 405 | 1,553 | 26.1 |
| Fair | 321 | 1,553 | 20.7 |
| Poor | 94 | 1,553 | 6.1 |
| Change in mental health since the start of the COVID-19 pandemic | |||
| Much better now | 146 | 1,554 | 9.4 |
| Somewhat better now | 248 | 1,554 | 16 |
| About the same | 645 | 1,554 | 41.5 |
| Somewhat worse now | 406 | 1,554 | 26.1 |
| Much worse now | 109 | 1,554 | 7.0 |
Abbreviations: STBBI (sexually transmitted and blood-borne infection).
|
|||
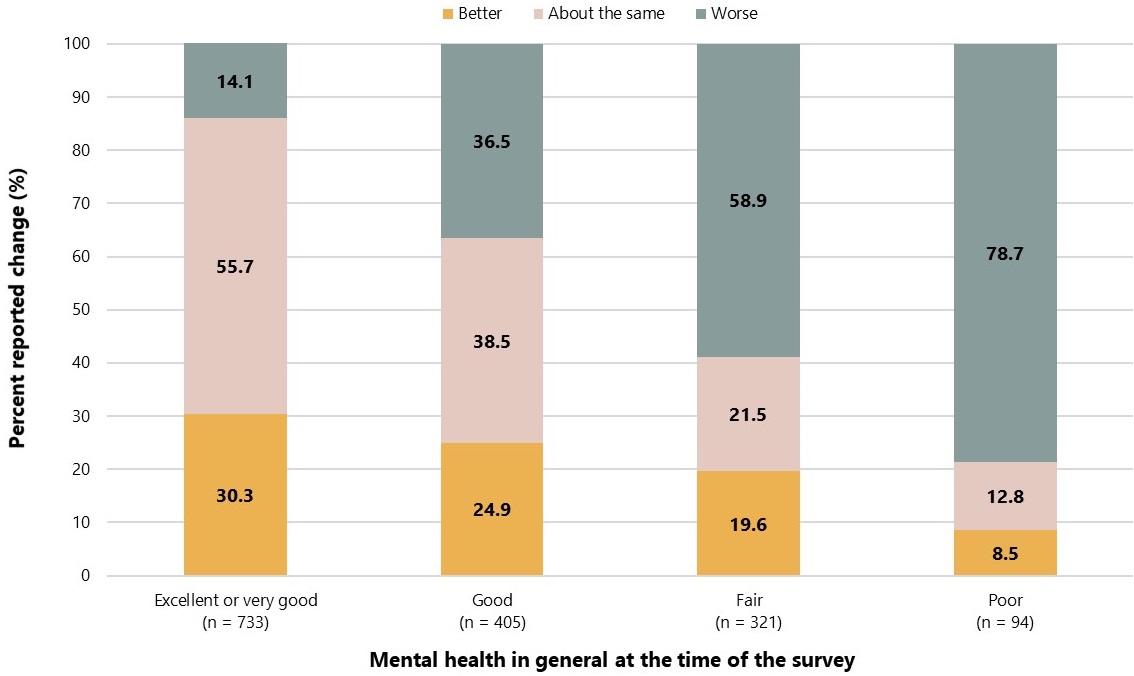
Figure 1: Text description
The graph presents 4 stacked bars displaying the changes in mental health since the start of the COVID-19 pandemic by mental health in general at the time of the survey.
| Change category for mental health | Excellent or very good | Good | Fair | Poor |
|---|---|---|---|---|
| Better | 30.3% | 24.9% | 19.6% | 8.5% |
| About the same | 55.7% | 38.5% | 21.5% | 12.8% |
| Worse | 14.1% | 36.5% | 58.9% | 78.7% |
Two-in-five (41.9%) participants accessed, considered accessing, or wanted to access mental health and wellness services (Table 3). Among them, 41.4% reported being sometimes able and sometimes not able to access services, while 20.4% reported not being able to access these services at all. The remaining 38.3% reported always being able to access services.
Among respondents who were not able to access mental health and wellness services, the most frequent barriers reported included the following:
- Difficulty getting a referral, appointment, or contacting a doctor or nurse to get information or advice (55.2%)
- Cost (32.7%)
- Difficulty accessing service(s) because of COVID-19 related public health measures (27.3%)
- Culturally safe and responsive services were not available (26.6%)
| Indicator | n | TotalFootnote a | % |
|---|---|---|---|
| Accessed or considered accessing mental health and wellness servicesFootnote b since the start of the COVID-19 pandemic | |||
| Yes | 645 | 1,538 | 41.9 |
| No | 893 | 1,538 | 58.1 |
| Ability to access mental health and wellness servicesFootnote c | |||
| Not able to access services | 131 | 643 | 20.4 |
| Sometimes able and sometimes not able to access services | 266 | 643 | 41.4 |
| Always able to access services | 246 | 643 | 38.3 |
| Barriers to accessing mental health and wellness servicesFootnote d | |||
| Difficulty getting a referral, appointment, or contacting a doctor or nurse to get information or advice | 214 | 388 | 55.2 |
| Cost | 127 | 388 | 32.7 |
| Difficulty accessing service because of COVID-19 related public health measures | 106 | 388 | 27.3 |
| Culturally safe and responsive services were not available | 103 | 388 | 26.6 |
| Waited too long between booking an appointment and visit or waited too long to get healthcare service | 97 | 388 | 25.0 |
| The service was not available at time required | 93 | 388 | 24.0 |
| Fear of, or concern about exposure to someone with COVID-19 | 87 | 388 | 22.4 |
| Fear of, concern about or experienced racism, including anti-Black racism | 82 | 388 | 21.1 |
| Fear of, concern about or experienced stigma, discrimination, or violence | 71 | 388 | 18.3 |
| Difficulty accessing remote services | 38 | 388 | 9.8 |
| Transportation problems | 35 | 388 | 9.0 |
| Language problem | 11 | 388 | 2.8 |
| Other | 35 | 388 | 9.0 |
Abbreviations: STBBI (sexually transmitted and blood-borne infection).
|
|||
Employment and financial security
Prior to the COVID-19 pandemic, about half (49.9%) of participants reported having full-time employment, with smaller proportions reporting part-time work (18.8%), being a full- or part-time student (16.0%), or being unemployed (13.5%) (Table 4). Less than one-in-ten (6.2%) participants reported volunteering, not working due to disabilities (4.3%), being retired (4.1%), looking after children or other family members (2.7%), or having another work situation (1.9%). When asked to describe changes in their work situation since the start of the COVID-19 pandemic, half (50.2%) of respondents reported little to no change, and 18.7% reported either reduced hours and/or pay, 16.9% had to stop working, while 14.3% reported increased hours and/or pay. Among those who reported having reduced hours or stopping work, the majority (44.2%) identified business closure or layoff related to the COVID-19 pandemic as the cause.
Almost one-third (30.2%) of respondents reported that the COVID-19 pandemic resulted in no change in their ability to pay bills for essential needs, such as rent or mortgage payments, utilities, and groceries, and less than one-in-ten (8.8%) respondents reported that it was too soon to tell at the time of survey. Nearly half (43.1%) of respondents reported that the COVID-19 pandemic had a major or moderate impact on their ability to pay bills while 18.0% reported a minor impact.
Less than half (43.9%) of respondents applied and received employment or emergency response benefits since the start of the COVID-19 pandemic. The Canadian Emergency Response Benefit (54.3%) was the most often reported benefit received during this time, followed by regular Employment Insurance benefits (37.9%). Considerably lower proportions of respondents reported receiving other types of benefits (Table 4).
Participants were asked if they have received relief or payment deferrals for any financial obligations during the COVID-19 pandemic, specifically for rent or mortgage payments, car payments or household bills. Among those who needed relief or payment deferrals, three-quarters (74.9%) reported not receiving relief or deferrals for household bills, 66.9% for car payments, and 58.1% for rent or mortgage payments.
| Indicator | n | TotalFootnote a | % |
|---|---|---|---|
| Work situation before the COVID-19 pandemicFootnote b | |||
| Employed or self-employed full time | 749 | 1,502 | 49.9 |
| Employed or self-employed part time | 283 | 1,502 | 18.8 |
| Full or part time student | 240 | 1,502 | 16.0 |
| Unemployed | 202 | 1,502 | 13.5 |
| Volunteering | 93 | 1,502 | 6.2 |
| Not working due to disabilities | 65 | 1,502 | 4.3 |
| Retired | 62 | 1,502 | 4.1 |
| Looking after children or other family members | 41 | 1,502 | 2.7 |
| Other | 29 | 1,502 | 1.9 |
| Change in work situation since the start of the COVID-19 pandemic | |||
| Little to no change | 749 | 1,493 | 50.2 |
| Reduced hours and/or pay | 279 | 1,493 | 18.7 |
| Had to stop working | 252 | 1,493 | 16.9 |
| Increased hours and/or pay | 213 | 1,493 | 14.3 |
| Main reason for limited or stopped workFootnote c | |||
| Business closure or layoff related to the COVID-19 pandemic | 235 | 532 | 44.2 |
| Personal circumstances related to the COVID-19 pandemicFootnote d | 112 | 532 | 21.1 |
| Unplanned absence not related to the COVID-19 pandemicFootnote e | 58 | 532 | 10.9 |
| Planned absence not related to the COVID-19 pandemicFootnote f | 26 | 532 | 4.9 |
| Other unspecified reason | 101 | 532 | 19.0 |
| Impact of the COVID-19 pandemic on ability to pay billsFootnote g | |||
| Major impact | 287 | 1,486 | 19.3 |
| Moderate impact | 353 | 1,486 | 23.8 |
| Minor impact | 267 | 1,486 | 18.0 |
| No impact | 449 | 1,486 | 30.2 |
| Too soon to tell | 130 | 1,486 | 8.8 |
| Employment or emergency response benefits received since the start of the COVID-19 pandemic | |||
| Applied and received benefits | 639 | 1,455 | 43.9 |
| Did not apply for any benefits | 486 | 1,455 | 33.4 |
| Did not qualify for any benefits | 330 | 1,455 | 22.7 |
| Type of employment or emergency response benefits received since the start of the COVID-19 pandemicFootnote h | |||
| Canada Emergency Response Benefit (CERB)Footnote i | 347 | 639 | 54.3 |
| Canada Emergency Student Benefit (CESB)Footnote j | 71 | 639 | 11.1 |
| Regular Employment Insurance benefits | 242 | 639 | 37.9 |
| Sickness | 33 | 639 | 5.2 |
| Other Employment Insurance benefit | 33 | 639 | 5.2 |
| Caregiving or compassionate care | 10 | 639 | 1.6 |
| Work-sharing | 6 | 639 | 0.9 |
| Received relief or payment deferrals since the start of the COVID-19 pandemicFootnote k | |||
| Rent or mortgage payments | |||
| I have these payments and I needed relief or payment deferrals but didn't receive them | 179 | 308 | 58.1 |
| I have these payments and I received relief or payment deferrals | 129 | 308 | 41.9 |
| Car payments | |||
| I have these payments and I needed relief or payment deferrals but didn't receive them | 95 | 142 | 66.9 |
| I have these payment and I received relief or payment deferrals | 47 | 142 | 33.1 |
| Household bills | |||
| I have these payments and I needed relief or payment deferrals but didn't receive them | 236 | 315 | 74.9 |
| I have these payments and I received relief or payment deferrals | 79 | 315 | 25.1 |
Abbreviations: STBBI (sexually transmitted and blood-borne infection).
|
|||
Food security
Among all participants, more than half (53.0%) reported experiencing some level of food insecurity during the COVID-19 pandemic (Table 5). The following specific experiences of food insecurity were reported: food didn't last and respondents didn't have money to get more (39.9%), respondents couldn't afford balanced meals (36.6%), respondents (32.6%) or other household members (29.0%) ate less because there was not enough money to buy food, and respondents accessed food (at no cost) from a community organization (26.8%).
| Indicator | n | TotalFootnote a | % |
|---|---|---|---|
| Experienced food insecurity since the start of the COVID-19 pandemicFootnote b | |||
| Experienced food insecurity | 742 | 1,399 | 53.0 |
| Did not experience food insecurity | 657 | 1,399 | 47.0 |
| Specific experiences of food insecurity since the start of the COVID-19 pandemic | |||
| Food didn't last and no money to get more | 558 | 1,400 | 39.9 |
| Couldn't afford balanced meals | 511 | 1,397 | 36.6 |
| Personally ate less because not enough money to buy food | 455 | 1,397 | 32.6 |
| Other household members ate less because not enough money to buy food | 405 | 1,397 | 29.0 |
| Accessed food (at no cost) from a community organization | 376 | 1,403 | 26.8 |
Abbreviations: STBBI (sexually transmitted and blood-borne infection).
|
|||
When looking at food insecurity across reported work situation prior to the pandemic (Figure 2), it was greatest among respondents who were not working due to disabilities (72.9%), who were unemployed (68.8%), and those who reported volunteer work (65.9%). It is worth noting that those who had full-time employment (44.4%) and those retired (47.4%) prior to the COVID-19 pandemic also reported high rates of food insecurity.
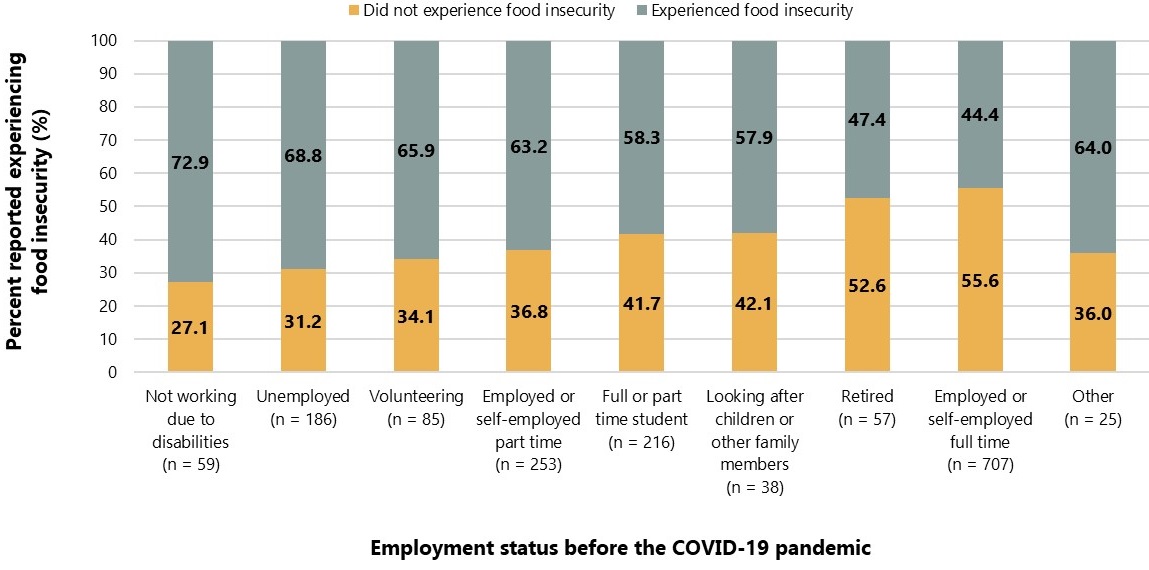
Figure 2: Text description
The graph presents 9 stacked bars displaying the experiences in food insecurity since the start of the COVID-19 pandemic by employment status before the COVID-19 pandemic.
| Experience of food insecurity | Not working due to disabilities | Unemployed | Volunteering | Employed or self-employed part time | Full or part time student | Looking after children or other family members | Retired | Employed or self-employed full time | Other |
|---|---|---|---|---|---|---|---|---|---|
| Did not experience food insecurity | 27.1% | 31.2% | 34.1% | 36.8% | 41.7% | 42.1% | 52.6% | 55.6% | 36.0% |
| Experienced food insecurity | 72.9% | 68.8% | 65.9% | 63.2% | 58.3% | 57.9% | 47.4% | 44.4% | 64.0% |
Food insecurity was also examined among participants by changes in work situation since the start of the COVID-19 pandemic (Figure 3). Food insecurity was greater among those that had to stop working (69.3%) or those who reported reduced hours and/or pay (68.8%) during the COVID-19 pandemic, compared to those that reported little to no change in their work situation (44.1%) or increased hours and/or pay during this time (44.7%).

Figure 3: Text description
The graph presents 4 stacked bars displaying the experiences in food insecurity by changes in work situation since the start of the COVID-19 pandemic.
| Experience of food insecurity by changes in work situation | Had to stop working | Reduced hours and/or pay | Little to no change | Increased hours and/or pay |
|---|---|---|---|---|
| Did not experience food insecurity | 30.7% | 31.2% | 55.9% | 55.3% |
| Experienced food insecurity | 69.3% | 68.8% | 44.1% | 44.7% |
Domestic violence
The majority (62.3%) of respondents reported living with family since the beginning of the COVID-19 pandemic (Table 6). Smaller proportions reported living alone (20.3%) or with roommate(s) or friend(s) (16.8%), and 0.7% reported living in a shelter or experiencing homelessness during this time.
In the year prior to the COVID-19 pandemic, the majority (59.4%) of respondents reported feeling very safe where they lived, with about one-third (33.6%) reported feeling somewhat safe, and a smaller proportion (7.1%) reported feeling not safe. When asked to rate their self-perceived safety where they lived during the COVID-19 pandemic, about three-quarters (74.8%) of respondents reported no change, 17.3% reported feeling less safe, and the remainder (7.9%) feeling more safe.
| Indicator | n | TotalFootnote a | % |
|---|---|---|---|
| Living arrangement since the start of the COVID-19 pandemic | |||
| Living with family | 851 | 1,367 | 62.3 |
| Living alone | 277 | 1,367 | 20.3 |
| Living with roommate(s) or friend(s) | 230 | 1,367 | 16.8 |
| Living in a shelter or homeless | 9 | 1,367 | 0.7 |
| Self-reported safety where participant lived in the year before the COVID-19 pandemic | |||
| Very safe | 790 | 1,331 | 59.4 |
| Somewhat safe | 447 | 1,331 | 33.6 |
| Not safe | 94 | 1,331 | 7.1 |
| Change in self-reported safety where participant lives since the start of the COVID-19 pandemic | |||
| Less safe | 240 | 1,387 | 17.3 |
| The same | 1,037 | 1,387 | 74.8 |
| More safe | 110 | 1,387 | 7.9 |
Abbreviations: STBBI (sexually transmitted and blood-borne infection).
|
|||
Experiences of safety during the pandemic were examined across participants based on the level of safety felt prior to the pandemic (Figure 4). Among those who reported not feeling safe prior to the pandemic, almost half (48.4%) reported feeling less safe during the pandemic, 35.5% felt the same, and 16.1% felt more safe during the pandemic. Distributions of changes in personal safety among participants feeling very and somewhat safe in the year prior to the pandemic were generally similar, with more than three-quarters of respondent reporting no change in personal safety during this time (78.7% and 75.1%, respectively).

Figure 4: Text description
The graph presents 3 stacked bars displaying the changes in feelings of safety since the start of the COVID-19 pandemic by feelings of safety in the home in the year before the pandemic.
| Changes in feelings of safety | Felt very safe | Felt somewhat safe | Did not feel safe |
|---|---|---|---|
| Felt more safe | 7.9% | 6.5% | 16.1% |
| No change | 78.7% | 75.1% | 35.5% |
| Felt less safe | 13.4% | 18.4% | 48.4% |
Since the start of the COVID-19 pandemic, half (50.1%) of participants reported experiencing verbal abuse directed towards them and 42.1% reported experiencing verbal abuse directed towards someone else in the household (Table 7). Almost one-third (30.6%) reported experiencing financial abuse (i.e., someone controlling how money was spent, limiting access or withholding funds). Over one-quarter (26.5%) reported experiencing physical abuse directed towards them and 21.8% directed to someone else in the household. One-in-four (25.0%) participants reported experiencing sexual aggression. Those who experienced any type of domestic violence, were asked to report changes.
| Indicator | n | TotalFootnote a | % |
|---|---|---|---|
| Experienced verbal abuseFootnote b | |||
| Any | 587 | 1,171 | 50.1 |
| None | 584 | 1,171 | 49.9 |
| Change in frequency of verbal abuse | |||
| More often | 214 | 587 | 36.5 |
| The same | 264 | 587 | 45.0 |
| Less often | 109 | 587 | 18.6 |
| Experienced verbal abuse directed at someone else in householdFootnote c | |||
| Any | 501 | 1,191 | 42.1 |
| None | 690 | 690 | 57.9 |
| Change in frequency of verbal abuse to someone else in household | |||
| More often | 174 | 501 | 34.7 |
| The same | 248 | 501 | 49.5 |
| Less often | 79 | 501 | 15.8 |
| Experienced financial abuseFootnote d | |||
| Any | 365 | 1,194 | 30.6 |
| None | 829 | 829 | 69.4 |
| Change in frequency of financial abuse | |||
| More often | 98 | 365 | 26.9 |
| The same | 226 | 365 | 61.9 |
| Less often | 41 | 365 | 11.2 |
| Experienced physical abuseFootnote e | |||
| Any | 314 | 1,186 | 26.5 |
| None | 872 | 872 | 73.5 |
| Change in frequency of physical abuse | |||
| More often | 63 | 314 | 20.1 |
| The same | 205 | 314 | 65.3 |
| Less often | 46 | 314 | 14.7 |
| Experienced physical abuse directed at someone else in householdFootnote f | |||
| Any | 260 | 1,195 | 21.8 |
| None | 935 | 935 | 78.2 |
| Change in frequency of physical abuse to someone else in household | |||
| More often | 36 | 260 | 13.9 |
| The same | 194 | 260 | 74.6 |
| Less often | 30 | 260 | 11.5 |
| Experienced sexual aggressionFootnote g | |||
| Any | 296 | 1,182 | 25.0 |
| None | 886 | 886 | 75.0 |
| Change in frequency of sexual aggression | |||
| More often | 37 | 296 | 12.5 |
| The same | 224 | 296 | 75.7 |
| Less often | 35 | 296 | 11.8 |
Abbreviations: STBBI (sexually transmitted and blood-borne infection).
|
|||
The frequency and changes of specific acts of domestic violence varied depending on the specific acts of abuse (Figure 5). Participants reported the largest increase in verbal abuse directed towards them (36.5%), followed by verbal abuse directed at someone else in the household (34.7%), financial abuse (26.9%), physical abuse directed at them (20.1%), physical abuse directed at someone else in the household (13.9%), and sexual aggression (12.5%).

Figure 5: Text description
The graph presents 6 stacked bars displaying the changes in frequency of experienced domestic violence by specific acts of domestic violence experienced since the start COVID-19 pandemic.
| Changes in frequency of experienced domestic violence | Verbal abuse | Verbal abuse towards others | Financial abuse | Physical abuse | Physical abuse towards others | Sexual aggression |
|---|---|---|---|---|---|---|
| Less often | 18.6% | 15.8% | 11.2% | 14.7% | 11.5% | 11.8% |
| No change | 45.0% | 49.5% | 61.9% | 65.3% | 74.6% | 75.7% |
| More often | 36.5% | 34.7% | 26.9% | 20.1% | 13.9% | 12.5% |
Discrimination
Participants were asked whether they experienced any discrimination when accessing healthcare services in the year before the pandemic and to compare the frequency of these occurrences since the start of the pandemic. This was measured as their perceived experience of discrimination.
Among participants that accessed healthcare services in the year prior to the COVID-19 pandemic, 37.9% reported never experiencing discrimination when accessing these services during that time, while the remainder reported experiencing discrimination often (10.2%), sometimes (32.8%) or rarely (19.1%) (Table 8). Among those who reported accessing healthcare during the COVID-19 pandemic, the majority (65.6%) reported no change in discrimination when accessing healthcare, less than one-in-ten (9.2%) reported a decrease, and about one-quarter (25.2%) reported an increase.
| Indicator | n | TotalFootnote a | % |
|---|---|---|---|
| Frequency of experienced discrimination when accessing healthcare services, in the year before the COVID-19 pandemicFootnote b Footnote c | |||
| Often | 100 | 982 | 10.2 |
| Sometimes | 322 | 982 | 32.8 |
| Rarely | 188 | 982 | 19.1 |
| Never | 372 | 982 | 37.9 |
| Change in frequency of experienced discrimination when accessing healthcare services, since the start of the COVID-19 pandemicFootnote d | |||
| Decrease | 83 | 902 | 9.2 |
| No change | 592 | 902 | 65.6 |
| Increase | 227 | 902 | 25.2 |
| Since the start of the COVID-19 pandemic | |||
| Experienced discrimination based on race or ethnicity or skin color, including anti-Black racismFootnote d | |||
| None | 328 | 975 | 33.6 |
| Any | 647 | 975 | 66.4 |
| Change in experienced discrimination based on race or ethnicity or skin colour, including anti-Black racismFootnote e | |||
| Increase | 202 | 647 | 31.2 |
| No change | 426 | 647 | 65.8 |
| Decrease | 19 | 647 | 2.9 |
| Experienced discrimination based on genderFootnote d | |||
| None | 405 | 960 | 42.2 |
| Any | 555 | 960 | 57.8 |
| Change in experienced discrimination based on genderFootnote e | |||
| Increase | 85 | 555 | 15.3 |
| No change | 453 | 555 | 81.6 |
| Decrease | 17 | 555 | 3.1 |
| Experienced discrimination based on sexual orientationFootnote d | |||
| None | 505 | 950 | 53.2 |
| Any | 445 | 950 | 46.8 |
| Change in experienced discrimination based on sexual orientationFootnote e | |||
| Increase | 48 | 445 | 10.8 |
| No change | 384 | 445 | 86.3 |
| Decrease | 13 | 445 | 2.9 |
| Experienced discrimination based on substance used | |||
| None | 604 | 937 | 64.5 |
| Any | 333 | 937 | 35.5 |
| Change in experienced discrimination based on substance useFootnote e | |||
| Increase | 53 | 333 | 15.9 |
| No change | 270 | 333 | 81.1 |
| Decrease | 10 | 333 | 3.0 |
| Experienced discrimination based on economic statusFootnote d | |||
| None | 414 | 969 | 42.7 |
| Any | 555 | 969 | 57.3 |
| Change in experienced discrimination based on economic statusFootnote e | |||
| Increase | 104 | 555 | 18.7 |
| No change | 376 | 555 | 67.8 |
| Decrease | 75 | 555 | 13.5 |
| Experienced discrimination based on disabilityFootnote d | |||
| None | 565 | 947 | 59.7 |
| Any | 382 | 947 | 40.3 |
| Change in experienced discrimination based on disabilityFootnote e | |||
| Increase | 65 | 382 | 17.0 |
| No change | 294 | 382 | 77.0 |
| Decrease | 23 | 382 | 6.0 |
| Experienced discrimination based on ageFootnote d | |||
| None | 484 | 947 | 51.1 |
| Any | 463 | 947 | 48.9 |
| Change in experienced discrimination based on ageFootnote e | |||
| Increase | 84 | 463 | 18.1 |
| No change | 372 | 463 | 80.4 |
| Decrease | 7 | 463 | 1.5 |
Abbreviations: STBBI (sexually transmitted and blood-borne infection).
|
|||
Reported discrimination when accessing healthcare services during the COVID-19 pandemic was also examined across levels of these experiences in the year prior to the pandemic (Figure 6). Proportionally, respondents that reported often experiencing discrimination prior to the pandemic also reported the greatest increase in these experiences during the pandemic (62.4%). In contrast, the largest proportions of respondents who indicated sometimes, rarely and never experiencing discrimination in the year prior, reported no change, 50.8%, 67.1% and 89.0%, respectively, during the COVID-19 pandemic.

Figure 6: Text description
The graph presents 4 stacked bars displaying the changes in frequency of discrimination since the start of the COVID-19 pandemic by frequency of experienced discrimination in the year before the pandemic.
| Changes in frequency of experienced discrimination | Often | Sometimes | Rarely | Never |
|---|---|---|---|---|
| Decrease | 17.2% | 12.9% | 10.8% | 3.8% |
| No change | 20.4% | 50.8% | 67.1% | 89.0% |
| Increase | 62.4% | 36.4% | 22.2% | 7.2% |
Participants who reported experiencing discrimination when accessing healthcare services during the COVID-19 pandemic were asked to report on the changes in discrimination based on race, gender, sexual orientation, substance use, economic status, disability, and age (Figure 7). Generally, the majority of respondents reported no change based on these attributes, while a minority of respondents reported decreased frequency of discrimination. The greatest increase in discrimination was reported based on race or ethnicity or skin colour, including anti-Black racism (31.2%), followed by economic status (18.7%), age (18.1%), disability (17.0%), use of substances (15.9%), gender (15.3%), and finally sexual orientation (10.8%).

Figure 7: Text description
The graph presents 7 stacked bars displaying the changes in experienced discrimination by attributes related to the discrimination experienced since the start of the COVID-19 pandemic.
| Changes in experienced discrimination by attribute | Race or ethnicity or skin colour | Economic status | Age | Disability | Use of substances | Gender | Sexual orientation |
|---|---|---|---|---|---|---|---|
| Decrease | 2.9% | 13.5% | 1.5% | 6.0% | 3.0% | 3.1% | 2.9% |
| No change | 65.8% | 67.8% | 80.4% | 77.0% | 81.1% | 81.6% | 86.3% |
| Increase | 31.2% | 18.7% | 18.1% | 17.0% | 15.9% | 15.3% | 10.8% |
To explore the potential effect of discrimination on access to healthcare services, ability to access mental health and wellness services was examined across participants based on the reported change in frequency of experienced discrimination since the start of the pandemic (Figure 8). Those who reported an increase in frequency of experienced discrimination had the highest proportion of those who had difficulty accessing mental health and wellness services (45.8%) compared to those who reported a decrease in experienced discrimination (34.9%) and those who reported no change (21.8%).
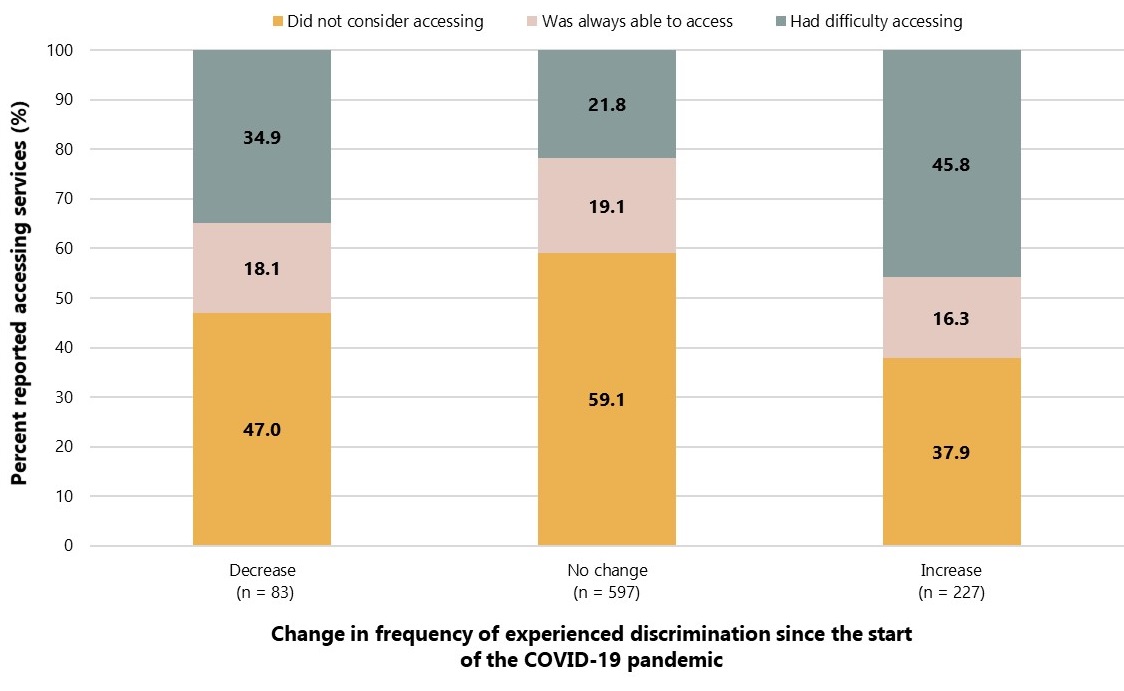
Figure 8: Text description
The graph presents 3 stacked bars displaying the ability to access mental health and wellness services by change in frequency of experienced discrimination since the start of the COVID-19 pandemic.
| Ability to access mental health and wellness services | Decrease | No change | Increase |
|---|---|---|---|
| Did not consider accessing | 47.0% | 59.1% | 37.9% |
| Was always able to access | 18.1% | 19.1% | 16.3% |
| Had difficulty accessing | 34.9% | 21.8% | 45.8% |
Substance use
In the year leading up to the COVID-19 pandemic, one-third (34.8%) of participants reported using alcohol, cannabis or any other substances (illegal drugs or non-medical use of opioids) (data not shown). Among substances used during the COVID-19 pandemic (Table 9), alcohol (49.9%) and cannabis (23.7%) were most frequently used. Smaller proportions of participants reported use of other substances: hallucinogens (5.1%); cocaine or crack (3.9%); ecstasy (3.9%); heroin, fentanyl, or other non-medical opioids (3.4%); speed, methamphetamine, or crystal meth (3.3%); or substances other than what were listed (6.5%).
Respondents that reported using substances since the beginning of the pandemic were asked to describe changes in frequency of their substance use compared to the year prior to the pandemic. Given that small proportions of participants reported illegal substance or non-medical opioid use, only proportions of increased use are reported to preserve anonymity of respondents. Among surveyed substances, the largest increase in use was observed among respondents reporting cannabis use (56.1%); followed by increased hallucinogen use (40.6%); increased alcohol consumption (37.7%); increased cocaine or crack use (37.5%); increased heroin, fentanyl, or other non-medical opioid use (23.3%); increased ecstasy use (20.8%); increased speed, methamphetamine, or crystal meth use (19.5%); and 25.9% of respondents reported an increase use of other substances not listed.
Participants reporting any substance use during the COVID-19 pandemic were asked about changes in their substance use behaviours. Due to a small number of participants reporting substance use, only increases in substance use behaviours are reported in order to maintain participant anonymity. Participants reported the largest increase in experiencing different triggers for use (62.9%); followed by increased use alone (53.4%); increased use of substances not usually used (46.9%); increases in withdrawal symptoms (33.8%); increased worry about overdosing (29.2%); increased sharing of used equipment such as needles or syringes, pipes, tourniquets, swabs, and cookers (22.9%); and finally, increased reports of not being able to get the substances they wanted (22.6%).
Among respondents reporting substance use during the COVID-19 pandemic, 2.5% accessed or wanted to access harm reduction services, while 5.0% accessed or wanted to access substance-use and treatment services (data not shown).
| Indicator | n | TotalFootnote a | % |
|---|---|---|---|
| Drug used since the start of the COVID-19 pandemicFootnote b | |||
| Alcohol | 615 | 1,233 | 49.9 |
| Increased useFootnote c | 232 | 615 | 37.7 |
| Cannabis | 294 | 1,241 | 23.7 |
| Increased useFootnote c | 165 | 294 | 56.1 |
| Cocaine or crack | 48 | 1,244 | 3.9 |
| Increased useFootnote c | 18 | 48 | 37.5 |
| Speed, methamphetamine, or crystal meth | 41 | 1,249 | 3.3 |
| Increased useFootnote c | 8 | 41 | 19.5 |
| Hallucinogens | 64 | 1,248 | 5.1 |
| Increased useFootnote c | 26 | 64 | 40.6 |
| Ecstasy | 48 | 1,247 | 3.9 |
| Increased useFootnote c | 10 | 48 | 20.8 |
| Heroin, fentanyl, or other non-medical opioids | 43 | 1,252 | 3.4 |
| Increased useFootnote c | 10 | 43 | 23.3 |
| Other substances | 81 | 1,245 | 6.5 |
| Increased useFootnote c | 21 | 81 | 25.9 |
| Increases in substance consumption behaviours, since the start of the COVID-19 pandemicFootnote d | |||
| Had different triggers for using | 83 | 132 | 62.9 |
| Used alone | 70 | 131 | 53.4 |
| Used substances I do not usually use | 38 | 81 | 46.9 |
| Had withdrawal symptoms | 25 | 74 | 33.8 |
| Worried about overdosing | 19 | 65 | 29.2 |
| Shared used equipment such as needles or syringes, pipes, tourniquets, swabs, cookers | 11 | 48 | 22.9 |
| Was unable to get the substances I use | 21 | 93 | 22.6 |
Abbreviations: STBBI (sexually transmitted and blood-borne infection; OST (opioid substitution treatment).
|
|||
Access to STBBI-related services
STBBI prevention, testing and treatment services
Since the start of the COVID-19 pandemic, less than one-in-ten (8.8%) respondents accessed or considered accessing STBBI prevention, testing and treatment services (Table 10). Of the participants attempting to access these services during the pandemic, more than half (70.8%) reported not always being able to obtain mental health counselling referrals, community services (60.4%), STBBI information and education including outreach events (55.3%), and interpreter and/or peer health service navigator (53.9%). In addition, 40.5% were not able to access HIV testing, 37.0% hepatitis C virus (HCV) testing, and 47.6% other sexually transmitted infections (STI) testing.
| Indicator | n | TotalFootnote a | % |
|---|---|---|---|
| Access to STBBI prevention, testing and treatment services since the start of the COVID-19 pandemicFootnote b | |||
| Accessed or considered accessing | 113 | 1,281 | 8.8 |
| Did not access or consider accessing | 1,168 | 1,281 | 91.2 |
| Not able to access the following STBBI prevention, testing and treatment services since the start of the COVID-19 pandemicFootnote c | |||
| Mental health counselling referral | 51 | 72 | 70.8 |
| Community services (e.g., Peer support services) | 35 | 58 | 60.4 |
| STBBI information and education including outreach events (e.g., health fairs, festivals, community events, etc.) | 26 | 47 | 55.3 |
| Interpreter and/or peer health service navigator | 14 | 26 | 53.9 |
| PrEP and/or PEP | 18 | 37 | 48.7 |
| Indigenous health or healing services | 10 | 21 | 47.6 |
| Condom and/or dental dam | 28 | 68 | 41.2 |
| Resources about safer sex (postcard, pamphlets, etc.) | 21 | 52 | 40.4 |
| HIV testing | 32 | 79 | 40.5 |
| HCV testing | 17 | 46 | 37.0 |
| Other sexually transmitted infection (STI) testing | 39 | 82 | 47.6 |
| Pre and post HIV test counselling | 14 | 37 | 37.8 |
Abbreviations: STBBI (sexually transmitted and blood-borne infection); HIV (human immunodeficiency virus); HCV (hepatitis C virus); PEP (postexposure prophylaxis); PrEP (preexposure prophylaxis).
|
|||
Among respondents who tried to access STBBI prevention, testing and treatment services, the following barriers were noted (Table 11):
- Difficulty getting a referral, appointment, or contacting a doctor or nurse to get information or advice (55.1%)
- Difficulty accessing service because of COVID-19 related public health measures (35.5%)
- Service not available at the time required (32.7%)
- Waited too long between booking an appointment and visit or waited too long to get healthcare service (28.0%)
| Indicator | n | TotalFootnote a | % |
|---|---|---|---|
| Barriers to accessing STBBI prevention, testing and treatment services since the start of the COVID-19 pandemicFootnote b | |||
| Difficulty getting a referral, appointment, or contacting a doctor or nurse to get information or advice | 59 | 107 | 55.1 |
| Difficulty accessing service because of COVID-19 related public health measures | 38 | 107 | 35.5 |
| The service was not available at time required | 35 | 107 | 32.7 |
| Waited too long between booking an appointment and visit or waited too long to get healthcare service | 30 | 107 | 28.0 |
| Culturally safe and responsive services were not available | 27 | 107 | 25.2 |
| Fear of, or concern about exposure to someone with COVID-19 | 26 | 107 | 24.3 |
| Fear of, concern about or experienced stigma, discrimination, or violence | 24 | 107 | 22.4 |
| Fear of, concern about or experienced racism, including anti-Black racism or anti-Indigenous racism | 24 | 107 | 22.4 |
| Difficulty accessing remote services | 17 | 107 | 15.9 |
| Transportation problems | 16 | 107 | 15.0 |
| Cost | 13 | 107 | 12.2 |
| Language problem | 9 | 107 | 8.4 |
| Other | 22 | 107 | 20.6 |
Abbreviations: STBBI (sexually transmitted and blood-borne infection).
|
|||
Support and treatment for people living with HIV and/or hepatitis C
Among all participants, 10.3% reported they were currently living with HIV and 1.2% reported ever being told they have hepatitis C infection (Table 12).
Among respondents living with HIV, 78.2% were linked to an HIV clinic or provider in the year prior to the COVID-19 pandemic. Since the beginning of the COVID-19 pandemic, 38.1% of respondents living with HIV experienced challenges accessing an HIV care provider or clinic. Among those reporting challenges accessing HIV care during the pandemic, the most frequently reported reasons included (data not shown): difficulty getting a referral, appointment, or contacting a doctor or nurse to get information or advice (51.1%); followed by difficulty accessing service because of COVID-19 related public health measures (48.9%); waited too long between booking an appointment and visit or waited too long to get healthcare service (42.2%); and fear of, or concern about exposure to someone with COVID-19 (42.2%).
| Indicator | n | TotalFootnote a | % |
|---|---|---|---|
| Self-reported HIV and access to HIV care | |||
| Currently living with HIV | 121 | 1,175 | 10.3 |
| Linked to HIV care in the year before the start of the COVID-19 pandemicFootnote b | 93 | 119 | 78.2 |
| Experienced challenges accessing an HIV care provider or clinic since the start of the COVID-19 pandemicFootnote c | 45 | 118 | 38.1 |
| Self-reported hepatitis C and access to hepatitis C care | |||
| Ever been told to have hepatitis C | 15 | 1,209 | 1.2 |
| Currently have hepatitis CFootnote d | 5 | 15 | 33.3 |
| Linked to hepatitis C care the year before the start of the COVID-19 pandemicFootnote e | <5 | 5 | - |
| Experienced challenges accessing hepatitis C care since the start of the COVID-19 pandemicFootnote e | <5 | 5 | - |
Abbreviations: STBBI (sexually transmitted and blood borne); HIV (human immunodeficiency virus).
|
|||
Discussion
Findings from this national Survey of the Impact of COVID-19 on access to STBBI-related services including harm reduction services among African, Caribbean and Black people in Canada, conducted from May to July 2021, highlight a reduced level of access to health services as well as the broader health and social impacts of the pandemic.
During data collection, Canada was in the midst of a third wave of the COVID-19 pandemic. Compared to the first wave, the third wave resulted in more cases, partly due to better testing capacity. In terms of vaccination, Canada authorized the first COVID-19 vaccine on December 9, 2020 and by spring 2021, vaccine delivery had acceleratedFootnote 21. COVID-19-related public health measures in place included restricting non-essential travel (with more stringent restrictions targeting certain countries) and non-essential business activities, requirements of travelers to Canada to obtain negative SARS-CoV-2 tests and quarantine upon entry, as well as school closures Footnote 22 Footnote 23 Footnote 24. All measures impacted the day-to-day lives of people living in Canada. Indeed, measures in place at this time led to reductions and closures of health and social services, with almost half of STBBI prevention, testing and treatment service providers reporting a decreased ability to deliver servicesFootnote 13.
In response to the growing need for disaggregated data and the importance of having an intersectional lens to address the disproportionate impact of the COVID-19 pandemic on ACB people, efforts were put in place to collect more nuanced information on race, gender and immigration statusFootnote 3. Most participants (77%) in this survey were not born in Canada, were mostly Black African (63%), and cisgender female (66%). Almost one-third of participants who were not born in Canada reported living in Canada for less than 5 years. There were smaller proportions of participants from other racial backgrounds (e.g., Black Caribbean, Black Indigenous or Black Canadian) and even smaller proportions of participants who identified as transgender.
Impact of COVID-19 on access to STBBI-related services and harm reduction services
"During the pandemic, the use of some health services noticeably decreased. This may be driven both by fewer people seeking care as well as a decrease in the number and types of services available."
Findings from the survey show that only a small proportion of respondents accessed or considered accessing STBBI-related services. In addition, these respondents reported experiencing difficulties accessing services. Services particularly impacted were the ability to receive mental health counselling referrals, community services, STBBI information and education including outreach events, and access to an interpreter and/or a peer health service navigator. This was in line with decreases reported by STBBI service providers during the COVID-19 pandemic, notably decreases in providing services involving sexual health educational resources and mental health counsellingFootnote 13. These results highlight the barriers to accessing STBBI-related services and it is not known how these barriers will evolve as the COVID-19 pandemic continues and during the post-pandemic period Footnote 25 Footnote 26.
Nearly half of respondents who accessed or considered accessing STI testing (other than HIV or hepatitis C), or PrEP and/or PEP therapy were not always able to do so, and two-in-five (41%) participants were not always able to access HIV testing. The most common barrier reported by half of these participants was difficulty getting a referral or an appointment. In the survey, one-in-ten participants (10%) reported living with HIV, a proportion higher than in the general Canadian population, which was estimated to be two-in-one-thousand people in 2018Footnote 5. ACB people are overrepresented in those living with HIV, highlighting the importance of HIV screening and care interventions for this populationFootnote 3 Footnote 27. Barriers to accessing support and treatment services may have been exacerbated during the COVID-19 pandemic, possibly explaining why 38% of participants living with HIV reported experiencing challenges accessing an HIV care provider or clinic since the beginning of the pandemic.
Access to substance use-related services or treatments among those who reported substance use was also low and further investigation is needed to understand this observation. Many harm reduction, substance use and treatment services decreased their operations at some point during the COVID-19 pandemicFootnote 13. In addition, stigma associated with substance use can act as a barrier to accessing these servicesFootnote 21 Footnote 28 Footnote 29.
Impact of COVID-19 on social determinants of health
"The pandemic put in stark relief the complex interaction of the social determinants of health – factors such as education, economic stability, job security, and stable housing – in shaping health outcomes and driving health inequities."
Findings regarding suboptimal access to healthcare services cannot be considered without taking into account the social determinants of health. These upstream drivers influence risk behaviours and access to healthcare services (21). Of note, nearly one-in-ten (10%) respondents were unaware of their healthcare insurance coverage status, while nearly one-quarter (24%) of respondents did not have coverage, a finding that may have contributed to lower levels of access to care.
Employment and financial security
The COVID-19 pandemic had an economic impact on millions of Canadians who either lost their jobs, worked reduced hours and/or experienced financial instabilityFootnote 21. This was also the case in this survey as 36% of participants reported either working reduced hours or having to stop work since the start of the COVID-19 pandemic. Also, 43% reported that the pandemic had a major or moderate impact on their ability to pay bills. It is worth highlighting that only a small proportion of those who needed relief or payment deferrals, actually received such payments. There were similar gaps between need and access for rent or mortgage payments, car payments, and household bills.
Food security
Experiences of unemployment, precarious employment and income instability may have increased food insecurity for ACB people. In fact, respondents who reported part-time employment, unemployment, volunteer work, and those not working due to disabilities, experienced food insecurity at a higher frequency than those who were employed or self-employed full time. In addition, those who reported reduced hours and/or pay and those that had to stop working since the beginning of the COVID-19 pandemic indicated experiencing food insecurity at a higher rate than those reporting little to no change or increased hours and/or pay during the pandemic. Food insecurity is a key social determinant of health that is strongly associated with a range of adverse health outcomes and it may have increased as a result of the pandemicFootnote 21. Overall, food insecurity among ACB people in this survey (53%) appears higher than what has been observed in the general population during the pandemic. Based on a Statistics Canada survey conducted during the second wave, one-in-ten Canadians reported experiencing food insecurity Footnote 30.
Domestic violence
As COVID-19 surged, experiences of family violence also increased Footnote 31. Among all ACB people surveyed, 17% reported feeling less safe where they lived during the COVID-19 pandemic. This was higher among those who already did not feel safe prior to the pandemic. Based on a survey of the general Canadian population, 10% of women and 9% of men were concerned about the possibility of violence in the home during the first wave of the pandemic but this was lower during the second waveFootnote 21 Footnote 32. The data for this survey were collected during the third wave, suggesting persisting concerns about safety among ACB people. Regarding specific acts of violence, changes in the frequency of experienced domestic violence since the start of the pandemic paralleled the trend for underlying violence. The highest increase was observed for verbal abuse, followed by verbal abuse towards others in the household, financial abuse, physical abuse, physical abuse towards others in the household, and sexual aggression.
Discrimination
Nearly two-thirds (62%) of respondents reported experiencing discrimination when accessing healthcare services prior to the pandemic. Additionally, one-quarter (25%) of respondents reported experiencing an increase in discrimination during the COVID-19 pandemic. Similar to the trend seen in domestic violence, the highest proportion of participants who reported an increase in discrimination (62%) was among those who reported such experiences before the pandemic. Participants reported multiple forms of discrimination. Of note, two-thirds (66%) of participants reported experiencing discrimination based on race or ethnicity or skin color, including anti-Black racism and one third (31%) reported an increase in this experience since the start of the pandemic. Unfortunately, these findings are in line with other surveys conducted during the pandemic. A crowdsourced survey conducted in August 2020 showed that Chinese, Korean, Southeast Asian, and Black respondents were twice as likely to report experiencing discrimination compared to non-visible minority respondentsFootnote 21 Footnote 33. These experiences may have manifested as barriers to seeking healthcare services during the pandemic, highlighting the ongoing need to tackle systemic and anti-Black racism institutionalized within social systems, including healthcare.
Mental health
Regarding mental health during the COVID-19 pandemic, one-in-four (27%) participants reported their mental health as fair or poor. Worsening mental health since the start of the pandemic was highest among these participants compared to others who reported excellent, very good or good mental health at the time of the survey. Similar to the perception of safety at home and discrimination, this highlights how those with pre-existing conditions were disproportionately affected by the pandemic. Similar findings were observed in a Statistics Canada survey conducted in fall 2020 among people aged 18 years or older. It found among those with depression, anxiety or posttraumatic stress disorder, that the majority reported worsened mental health since the start of the pandemic Footnote 34. In this survey of ACB people, three-quarters (80%) of respondents reported being sometimes or always able to access mental health services. Reported barriers, such as difficulty getting a referral or contacting a healthcare practitioner to get information and cost of services, represent potential areas for consideration in the development of future interventions to make services more accessible.
Impact of COVID-19 on substance use
In relation to substance use, half of the surveyed participants reported using alcohol since the start of the pandemic and under half (38%) reported an increase in their use. Cannabis use was reported by 24% of participants and a bit more than half (56%) reported an increase in their use since the start of the pandemic. In a survey conducted by Statistics Canada in January 2021, nearly one-quarter of Canadians who had previously consumed alcohol reported an increase in their consumption and one-third of those who previously consumed cannabis reported an increase in their useFootnote 35.
Strengths and limitations
Given the challenges of using probability-based sampling to reach individuals during a pandemic, an anonymous online survey was selected as the most appropriate sampling method. Due to the nature of convenience sampling used in this survey, it is not possible to generalize the findings to all ACB people in Canada. Generalizability is also limited because of the small sample of participants who reported accessing or considered accessing STBBI-related services. The online nature of the survey may have also contributed to a selection bias, as participants without access to a computer or internet were less likely to participate. This, in turn, may have led to underestimates related to precarious living situations, as well as food and financial insecurity. However, engagement with academic and community stakeholders, such as faculty members of the University of Ottawa, WHIWH and the NEWG, that promoted the survey to help assure appropriate representation across diverse ACB sub-populations, may have mitigated this selection bias. Also, these findings were based on self-reported data and were subject to response biases, such as social desirability. The anonymous nature of the survey likely minimized this bias.
Given the cross-sectional study design, conclusive statements cannot be made regarding the attribution of the COVID-19 pandemic as the "cause" of the changes identified in this report. This study was purposefully designed to identify participants' "perceived" changes in behaviours and other outcomes. Despite this, the data collected provide a rich source of information on respondents' personal perceptions of the impacts of the COVID-19 pandemic on their lives, including access to STBBI-related services.
Conclusion
"If Canada is to have an exceptional public health evidence base, ongoing knowledge exchange and established arrangements between public health organizations and a range of disciplines (e.g., social science, geography, economics) must be prioritized. Interdisciplinary collaborations are particularly important for understanding and responding to the complex, layered, and interconnected determinants of health."
This survey offers important insights on the impact of the COVID-19 pandemic on the social determinants of health and, in turn, on access to STBBI-related services among ACB people in Canada.
The survey identified several intersecting social and structural factors that may have impacted access to STBBI-related services before the COVID-19 pandemic only to be further exacerbated during the pandemic. Worsening financial instability for ACB people meant they were also more likely to experience food insecurity. Household members experiencing domestic violence, reported feeling disproportionately less safe since the start of the pandemic. Together these stressors can also impact mental health. This was seen in the early phase of the pandemic where Canadians experiencing food insecurity were more likely to perceive their mental health as fair or poor Footnote 36. In addition, the discrimination often faced by ACB people was likely exacerbated during the pandemic possibly leading to a decrease in access to healthcare services.
These findings add to the existing and growing evidence of health inequities faced by ACB people. One of the primary aims of the public health system in Canada is to achieve equitable health outcomes, and this cannot be tackled without an equitable lens that focuses on the social determinants of health Footnote 37 Footnote 38. As emphasized in the Chief Public Health Officer of Canada's Report on the State of Public Health in Canada 2021, the "causes of the causes" need to be addressed through upstream interventions that target economic and social policies. It is through these interventions, along with downstream interventions that support people already experiencing these challenges that the health of the Canadian population can improveFootnote 21. Targeting upstream interventions and policies can only be achieved through intersectoral collaboration across federal, provincial, territorial, and regional health departments; community-led organizations; and relevant stakeholders and disciplines, such as social sciences and economy. By addressing barriers to STBBI-related services that are rooted within the social determinants of health, it will be possible to achieve the global targets and meet the strategic goals of the Pan-Canadian STBBI Framework for Action Footnote 39 Footnote 40.
References
- Footnote 1
-
Melamed OC, Hahn MK, Agarwal SM, Taylor VH, Mulsant BH, Selby P. Physical health among people with serious mental illness in the face of COVID-19: Concerns and mitigation strategies. General hospital psychiatry. 2020 Sep 1;66:30-3.
- Footnote 2
-
Volkow ND. Collision of the COVID-19 and addiction epidemics. Annals of internal medicine. 2020 Jul 7;173(1):61-2.
- Footnote 3
-
Etowa J, Hyman I. Unpacking the health and social consequences of COVID-19 through a race, migration and gender lens. Canadian Journal of Public Health. 2021 Feb;112(1):8-11.
- Footnote 4
-
Power T, Wilson D, Best O, Brockie T, Bearskin LB, Millender E, Lowe J. COVID‐19 and Indigenous Peoples: An imperative for action. Journal of clinical nursing. 2020 Aug 1.
- Footnote 5
-
Public Health Agency of Canada. Estimates of HIV Incidence, Prevalence and Canada's Progress On Meeting the 90-90-90 HIV Targets 2018. 2020 Dec. Available from: https://www.canada.ca/content/dam/hc-sc/documents/services/publications/diseases-conditions/summary-estimates-hiv-incidence-prevalence-canadas-progress-90-90-90/national-hiv-estimates-report-2018-en.pdf
- Footnote 6
-
Singer M. Introduction to syndemics: A critical systems approach to public and community health. John Wiley & Sons; 2009 Jun 3.
- Footnote 7
-
Tarasuk J, Zhang J, Lemyre A, Cholette F, Bryson M, Paquette D. National findings from the Tracks survey of people who inject drugs in Canada, Phase 4, 2017–2019. Canada Communicable Disease Report. 2020 May 7;46(5):138-48.
- Footnote 8
-
Jordan RE, Adab P, Cheng K. Covid-19: risk factors for severe disease and death. BMJ. 2020 Mar 26;368.
- Footnote 9
-
Klassen S, Murphy S. Equity as both a means and an end: Lessons for resilient food systems from COVID-19. World Development. 2020 Dec 1;136:105104.
- Footnote 10
-
Price-Haywood EG, Burton J, Fort D, Seoane L. Hospitalization and mortality among black patients and white patients with Covid-19. New England Journal of Medicine. 2020 Jun 25;382(26):2534-43.
- Footnote 11
-
Sundaram ME, Calzavara A, Mishra S, Kustra R, Chan AK, Hamilton MA, Djebli M, Rosella LC, Watson T, Chen H, Chen B. Individual and social determinants of SARS-CoV-2 testing and positivity in Ontario, Canada: a population-wide study. Cmaj. 2021 May 17;193(20):E723-34.
- Footnote 12
-
Yehia BR, Winegar A, Fogel R, Fakih M, Ottenbacher A, Jesser C, Bufalino A, Huang RH, Cacchione J. Association of race with mortality among patients hospitalized with coronavirus disease 2019 (COVID-19) at 92 US hospitals. JAMA network open. 2020 Aug 3;3(8):e2018039.
- Footnote 13
-
Public Health Agency of Canada, Centre for Communicable Diseases and Infection Control. Survey on the impact of COVID-19 on the delivery of STBBI prevention, testing and treatment including harm reduction services in Canada. 2021. Available from: https://www.canada.ca/en/public-health/services/publications/diseases-conditions/survey-impact-covid-19-delivery-stbbi-prevention-testing-treatment.html
- Footnote 14
-
EMCDDA, Impact of COVID-19 on drug services and help-seeking in Europe, EMCDDA trendspotter briefing, EMCDDA, Lisbon. 2020. Available from: https://www.emcdda.europa.eu/system/files/publications/13073/EMCDDA-Trendspotter-Covid-19_Wave-1-2.pdf
- Footnote 15
-
Johns Hopkins University (JHU). COVID-19 Community Response Survey. 2020. Available from: https://www.nlm.nih.gov/dr2/JHU_COVID-19_Community_Response_Survey_v1.3.pdf
- Footnote 16
-
Statistics Canada. Canadian Perspectives Survey Series (CPSS). 2020. Available from: https://www23.statcan.gc.ca/imdb/p2SV.pl?Function=getSurvey&SDDS=5311
- Footnote 17
-
Statistics Canada. Canadian Community Health Survey (CCHS) – 2019. 2019 Dec. Available from:
https://www23.statcan.gc.ca/imdb/p3Instr.pl?Function=assembleInstr&lang=en&Item_Id=1207185#qb1208907 - Footnote 18
-
Board of Governors of the Federal Reserve System. Report on the Economic Well-Being of U.S. Households in 2013. 2014. Available from: https://www.federalreserve.gov/econresdata/2014-economic-well-being-of-us-households-in-2013-appendix-2.htm#subsection-157-9D40F64E
- Footnote 19
-
Community Based Research Center. Sex Now Survey COVID-19 Edition - Full questionnaire. 2020. Available from: https://www.cbrc.net/sex_now_survey_covid_19_edition_full_questionnaire
- Footnote 20
-
Bauer GR, Braimoh J, Scheim AI, Dharma C. Transgender-inclusive measures of sex/gender for population surveys: Mixed-methods evaluation and recommendations. PloS one. 2017 May 25;12(5):e0178043.
- Footnote 21
-
Public Health Agency of Canada. The Chief Public Health Officer of Canada's Report on the State of Public Health in Canada. A Vision to Transform Canada's Public Health System. 2021. Available from: https://www.canada.ca/en/public-health/corporate/publications/chief-public-health-officer-reports-state-public-health-canada/state-public-health-canada-2021.html#a5.2
- Footnote 22
-
Employment and Social Development Canada. Backgrounder: New measures to protect foreign workers and prevent the spread of COVID-19 for the 2021 season. 2021. Available from: https://www.canada.ca/en/employment-social-development/news/2021/03/backgrounder-tfw.html
- Footnote 23
-
Public Health Agency of Canada. Government of Canada extends quarantine measures and travel restrictions. 2021 May 21. Available from: https://www.canada.ca/en/public-health/news/2021/05/government-of-canada-extends-quarantine-measures-and-travel-restrictions.html
- Footnote 24
-
Canadian Institute for Health Information. COVID-19 Intervention Timeline in Canada. 2022. Available from: https://www.cihi.ca/en/covid-19-intervention-timeline-in-canada
- Footnote 25
-
Public Health Agency of Canada. The Chief Public Health Officer of Canada's Report on the State of Public Health in Canada. From Risk to Resilience: An Equity Approach to COVID-19. 2020. Available from: https://www.canada.ca/en/public-health/corporate/publications/chief-public-health-officer-reports-state-public-health-canada/from-risk-resilience-equity-approach-covid-19.html
- Footnote 26
-
Gilbert M, Chang HJ, Ablona A, Salway T, Ogilvie GS, Wong J, Haag D, Pedersen HN, Bannar-Martin S, Campeau L, Ford G. Accessing needed sexual health services during the COVID-19 pandemic in British Columbia, Canada: a survey of sexual health service clients. Sexually transmitted infections. 2021 Nov 5.
- Footnote 27
-
Antabe R, Konkor I, McIntosh M, Lawson E, Husbands W, Wong J, Arku G, Luginaah I. "I went in there, had a bit of an issue with those folks": everyday challenges of heterosexual African, Caribbean and black (ACB) men in accessing HIV/AIDS services in London, Ontario. BMC Public Health. 2021 Dec;21(1):1-4.
- Footnote 28
-
Health Canada. Background Document: Public Consultation on Strengthening Canada's Approach to Substance Use Issues. 2018. Available from: https://www.canada.ca/en/health-canada/services/substance-use/canadian-drugs-substances-strategy/strengthening-canada-approach-substance-use-issue.html
- Footnote 29
-
Health Canada. Stigma: Why Words Matter. 2021. Available from: https://www.canada.ca/en/health-canada/services/publications/healthy-living/stigma-why-words-matter-fact-sheet.html
- Footnote 30
-
Statistics Canada. Household food insecurity during the COVID-19 pandemic. 2022. Available from: https://www150.statcan.gc.ca/n1/daily-quotidien/220216/dq220216f-eng.htm
- Footnote 31
-
CBC News. Minister says COVID-19 is empowering domestic violence abusers as rates rise in parts of Canada. 2020. Available from: https://www.cbc.ca/news/politics/domestic-violence-rates-rising-due-to-covid19-1.5545851
- Footnote 32
-
Statistics Canada. Canadian Perspectives Survey Series 1: Impacts of COVID-19. 2020. Available from: https://www150.statcan.gc.ca/n1/daily-quotidien/200408/dq200408c-eng.htm
- Footnote 33
-
Statistics Canada. Experiences of discrimination during the COVID-19 pandemic. 2020. Available from: https://www150.statcan.gc.ca/n1/daily-quotidien/200917/dq200917a-eng.htm
- Footnote 34
-
Statistics Canada. Survey on COVID-19 and mental health, September to December 2020. 2021. Available from https://www150.statcan.gc.ca/n1/daily-quotidien/210318/dq210318a-eng.htm
- Footnote 35
-
Statistics Canada. Alcohol and Cannabis use during the pandemic: Canadian Perspectives Survey Series 6. 2021. Available from: https://www150.statcan.gc.ca/n1/daily-quotidien/210304/dq210304a-eng.htm
- Footnote 36
-
Statistics Canada. Food insecurity and mental health during the COVID-19 pandemic. 2020. Available from: https://www150.statcan.gc.ca/n1/daily-quotidien/201216/dq201216d-eng.htm
- Footnote 37
-
Amri M, Chatur A, O'Campo P. Intersectoral and multisectoral approaches to health policy: an umbrella review protocol. Health Research Policy and Systems. 2022 Dec;20(1):1-5.
- Footnote 38
-
United Nations. Department of Economic and Social Affairs. Sustainable Development. Sustainable Development Goals. Available from: https://sdgs.un.org/goals
- Footnote 39
-
Public Health Agency of Canada. A pan-Canadian framework for action: Reducing the health impact of sexually transmitted and blood-borne infections in Canada by 2030: A pan-Canadian STBBI framework for action. 2018 Jun 29. Available from: https://www.canada.ca/en/public-health/services/infectious-diseases/sexual-health-sexually-transmitted-infections/reports-publications/sexually-transmitted-blood-borne-infections-action-framework.html
- Footnote 40
-
Public Health Agency of Canada. Accelerating our response: Government of Canada five-year action plan on sexually transmitted and blood-borne infections. 2019 Jul 17. Available from: https://www.canada.ca/en/public-health/services/reports-publications/accelerating-our-response-five-year-action-plan-sexually-transmitted-blood-borne-infections.html