
Tuberculosis: Drug resistance in Canada 2014
Acknowledgements
The Surveillance and Epidemiology Division at the Public Health Agency of Canada would like to acknowledge the members of the Canadian Tuberculosis Laboratory Technical Network and their teams as well as, colleagues at the National Microbiology Laboratory for their contribution to and participation in the Canadian Tuberculosis Laboratory Surveillance System.
Table of contents:

Download the alternative format
(PDF format, 2.21 MB, 46 pages)
Related Topics
List of figures
- Figure 1: Number of Mycobacterium tuberculosis complex isolates tested by province or territory of origin, 2014
- Figure 2: Percentage of isolates tested with any resistance to isoniazid, pyrazinamide, rifampin, and ethambutol, 2014
- Figure 3: Percentage of isolates tested with any resistance to isoniazid, pyrazinamide, rifampin, and ethambutol, 2004 to 2014
- Figure 4: Tuberculosis drug resistance patterns as a percentage of isolates tested, 2014
- Figure 5: Tuberculosis drug resistance patterns as a percentage of isolates tested, 2004 to 2014
List of tables
- Table 1: Critical concentrations for routine testing of anti-tuberculosis drugs
- Table 2: Total number of Mycobacterium tuberculosis complex isolates by reporting and originating province/territory, 2014
- Table 3: Total number of Mycobacterium tuberculosis complex isolates and number and percentage identified with any resistance, as multidrug- and as extensively drug-resistant in Canada, 2004 to 2014
- Table 4: Overall pattern of reported tuberculosis drug resistance in Canada, 2004 to 2014
- Table 5: Results for routine drug susceptibility testing of Mycobacterium tuberculosis complex isolates to anti-tuberculosis drugs for Alberta, 2004 to 2014
- Table 6: Results for routine drug susceptibility testing of Mycobacterium tuberculosis complex isolates to anti-tuberculosis drugs for British Columbia, 2004 to 2014
- Table 7: Results for routine drug susceptibility testing of Mycobacterium tuberculosis complex isolates to anti-tuberculosis drugs for Manitoba, 2004 to 2014
- Table 8: Results for routine drug susceptibility testing of Mycobacterium tuberculosis complex isolates to anti-tuberculosis drugs for New Brunswick, 2004 to 2014
- Table 9: Results for routine drug susceptibility testing of Mycobacterium tuberculosis complex isolates to anti-tuberculosis drugs for Newfoundland and Labrador, 2004 to 2014
- Table 10: Results for routine drug susceptibility testing of Mycobacterium tuberculosis complex isolates to anti-tuberculosis drugs for Northwest Territories, 2004 to 2014
- Table 11: Results for routine drug susceptibility testing of Mycobacterium tuberculosis complex isolates to anti-tuberculosis drugs for Nova Scotia, 2004 to 2014
- Table 12: Results for routine drug susceptibility testing of Mycobacterium tuberculosis complex isolates to anti-tuberculosis drugs for Nunavut, 2004 to 2014
- Table 13: Results for routine drug susceptibility testing of Mycobacterium tuberculosis complex isolates to anti-tuberculosis drugs for Ontario, 2004 to 2014
- Table 14: Results for routine drug susceptibility testing of Mycobacterium tuberculosis complex isolates to anti-tuberculosis drugs, for Prince Edward Island, 2004 to 2014
- Table 15: Results for routine drug susceptibility testing of Mycobacterium tuberculosis complex isolates to anti-tuberculosis drugs for Quebec, 2004 to 2014
- Table 16: Results for routine drug susceptibility testing of Mycobacterium tuberculosis complex isolates to anti-tuberculosis drugs for Saskatchewan, 2004 to 2014
- Table 17: Results for routine drug susceptibility testing of Mycobacterium tuberculosis complex isolates to anti-tuberculosis drugs for Yukon, 2004 to 2014
- Table 18: Multidrug-resistant tuberculosis and extensively drug-resistant tuberculosis isolates by province/territory of origin, 2014
- Table 19: Provincial/territorial breakdown by any resistance, multidrug-resistant tuberculosis and extensively drug-resistant tuberculosis in Canada, 2004 to 2014
- Table 20: Tuberculosis drug resistance by sex and age group in Canada, 2014
List of appendices
Acronyms and abbreviations
- Alta.
- Alberta
- AK
- Amikacin
- B.C.
- British Columbia
- BCG
- Bacillus Calmette-Guérin
- CI
- Confidence interval
- CLSI
- Clinical and Laboratory Standards Institute
- CM
- Capreomycin
- CPHLN
- Canadian Public Health Laboratory Network
- CTBLSS
- Canadian Tuberculosis Laboratory Surveillance System
- CTLTN
- Canadian Tuberculosis Laboratory Technical Network
- EMB
- Ethambutol
- ETH
- Ethionamide
- INH
- Isoniazid
- KM
- Kanamycin
- LIN
- Linezolid
- M. africanum
- Mycobacterium africanum
- M. bovis
- Mycobacterium bovis
- M. canetti
- Mycobacterium canetti
- M. caprae
- Mycobacterium caprae
- M. microti
- Mycobacterium microti
- M. pinnipedii
- Mycobacterium pinnipedii
- M. tuberculosis
- Mycobacterium tuberculosis
- Man.
- Manitoba
- MDR-TB
- Multidrug-resistant tuberculosis
- MOX
- Moxifloxacin
- MTBC
- Mycobacterium tuberculosis complex
- N.B.
- New Brunswick
- N.L.
- Newfoundland and Labrador
- NRCM
- National Reference Centre for Mycobacteriology
- N.S.
- Nova Scotia
- Nvt.
- Nunavut
- N.W.T.
- Northwest Territories
- OFL
- Ofloxacin
- Ont.
- Ontario
- PAS
- Para-aminosalicylic acid
- PHAC
- Public Health Agency of Canada
- P.E.I.
- Prince Edward Island
- ProvLab
- Provincial Laboratory of Public Health (Alberta)
- PZA
- Pyrazinamide
- Que.
- Quebec
- RBT
- Rifabutin
- RMP
- Rifampin
- Sask.
- Saskatchewan
- SM
- Streptomycin
- TB
- Tuberculosis
- XDR-TB
- Extensively drug-resistant tuberculosis
- Y.T.
- Yukon
Introduction
Drug-resistant strains of tuberculosis (TB) pose a serious threat to Canadian TB prevention and control efforts. Although drug-resistant TB has not yet been identified as a major problem in Canada, it is a potential issue both because Canadians frequently travel abroad and because many individuals migrate to Canada from countries with high TB rates and associated drug resistance.
The Canadian Tuberculosis Laboratory Surveillance System (CTBLSS) was created in 1998 as part of Canada's response to a growing worldwide concern about TB drug resistance. It was established by Health Canada's Division of Tuberculosis Prevention and Control in the Bureau of HIV/AIDS, STD and TB at the Laboratory Centre for Disease Control in collaboration with the Canadian Tuberculosis Laboratory Technical Network (CTLTN) and participating laboratories. The CTBLSS was designed to monitor emerging trends and patterns in anti-tuberculosis drug resistance in Canada and is currently managed by the Public Health Agency of Canada (PHAC).
This report is part of an annual surveillance report series that describes data collected through the CTBLSS. Specifically, this report provides details on the overall level of TB drug resistance in Canada for the period 2004 to 2014, with a focus on 2014.
The data presented in this report is intended to inform public health action as well as policy and program development and assessment.
Background
Patterns of drug resistance
TB drug resistance is determined through susceptibility testing of clinical specimens obtained from individuals with culture-positive TB.Footnote 1 People with TB are said to have drug-resistant TB if the strain of Mycobacterium tuberculosis causing their disease is resistant to one or more of the four first-line drugs, isoniazid, rifampin, pyrazinamide or ethambutol. The following resistance patterns are described in this report:
- Monoresistance – defined as resistance to one first-line anti-TB drug only (isoniazid, rifampin, ethambutol or pyrazinamide).
- Polyresistance (other patterns) – defined as resistance to more than one first-line anti-TB drug, not including the isoniazid and rifampin combination.
- Multidrug-resistant tuberculosis (MDR-TB) – defined as resistance to isoniazid and rifampin with or without resistance to other anti-tuberculosis drugs.
- Extensively drug-resistant TB (XDR-TB) – defined as resistance to isoniazid and rifampin and any fluoroquinolone and at least one of the three injectable second-line drugs (amikacin, capreomycin or kanamycin).Footnote 2
TB drug resistance standards and testing in Canada
The mission of the CTLTN is to promote excellence, standardization and quality assurance in mycobacteriology services. The CTLTN is a pan-Canadian network of technical and scientific heads of provincial and territorial TB laboratories (Appendix I).
The goals of the CTLTN are to:
- standardize laboratory methodologies;
- improve biosafety operational practices and physical requirements;
- implement biosafety guidelines;
- participate in national surveillance and proficiency programs; and
- exchange services and information about new technologies.
Laboratory testing methods in Canada, including drug selection and the critical concentrations used for routine drug susceptibility testing, are in line with recommended laboratory standards.Footnote i, Footnote 3, Footnote 4 Participating CTLTN laboratories perform routine susceptibility testing of Mycobacterium tuberculosis or Mycobacterium tuberculosis complex (MTBC) isolates against first-line anti-tuberculosis drugs using fluorometric proportion method BACTEC® MGIT 960. Table 1 provides a list of recommended first-line and second-line anti-tuberculosis drugs and the recommended critical concentrations to be used for testing.Footnote 3, Footnote 4
Second-line drug susceptibility testing varies across jurisdictions. Typically, isolates are tested for resistance to amikacin, kanamycin, capreomycin, ethionamide, linezolid, ofloxacin, moxifloxacin, para-aminosalicylic acid and rifabutin.
Methods
Overview of the Canadian Tuberculosis Laboratory Surveillance System
The CTBLSS is an isolate-based surveillance system designed to collect data on TB drug resistance across Canada. Drug susceptibility test results of all unique isolates tested in the previous calendar year are voluntarily submitted annually to PHAC by provincial TB laboratories for inclusion in the CTBLSS. Participating laboratories are members of the CTLTN (representing all provinces and territories).
Data for the CTBLSS are collected either through the manual completion of a standard reporting form (Appendix II) or electronically. Standardized data recoding procedures are applied to all data to create a national dataset. The following information is submitted to PHAC:
- the date the isolate or specimen was received at the laboratory;
- the specimen identification number provided by the laboratory;
- the province/territory where the isolate was tested;
- the province/territory from which the isolate originated;
- the sex of the individual from whom the isolate originated;
- the date of birth or age at time of testing of the individual from whom the isolate originated; and
- drug susceptibility results (drug tested, including concentration of the drug tested).
Data are submitted for confirmed cases of MTBC demonstrated on culture, including M. tuberculosis, M. africanum, M. canetti, M. caprae, M. microti, M. pinnipedii or M. bovis. Results may be submitted at the species level or for MTBC only without species identification. Some laboratories also submit results for the M. bovis BCG strain, a complication of TB vaccination often found in immunocompromised patients. These results are excluded from this report because this strain is not infectious.
All participating laboratories test for resistance to the first-line antibiotics isoniazid, ethambutol, and rifampin. Although the Canadian Tuberculosis Standards (7th edition) recommends that laboratories perform drug susceptibility testing to pyrazinamideFootnote 1, British Columbia does not routinely test for resistance to this drug. If resistance to any first-line drug is detected, British Columbia will subsequently test the isolate for resistance to pyrazinamide.
Results of second-line drug susceptibility testing are submitted for isolates showing resistance to isoniazid and rifampin. To rule out XDR-TB, laboratories are asked to report results for at least one of the fluoroquinolones (ofloxacin, moxifloxacin or levofloxacin) and at least one of the injectable agents (amikacin, kanamycin and capreomycin).
Not all provinces and territories have the capacity to perform drug susceptibility testing. Those without this capacity prepare the isolates and forward them to other provincial laboratories for testing. In some instances, the laboratory that tests the sample submits the results to PHAC on behalf of the originating province or territory.
The British Columbia Public Health Microbiology and Reference Laboratory at the British Columbia Centre for Disease Control tests and reports first-line susceptibility results for British Columbia and Yukon. The Provincial Laboratory of Public Health (ProvLab) in Alberta tests and reports isolates for Alberta and Northwest Territories, and the Central Public Health Laboratory in Ontario tests and reports results for Ontario and Nunavut. The National Reference Centre for Mycobacteriology (NRCM)Footnote ii located in Manitoba conducts first-line susceptibility testing for Newfoundland and Labrador, Manitoba, New Brunswick, Nova Scotia and Prince Edward Island. In this case, the NRCM returns test results to the originating province and the originating province submits their results to PHAC. All remaining provinces conduct their own first-line testing and do not routinely report results for any other jurisdiction.
Four laboratories in Canada conduct second-line drug susceptibility testing: the ProvLab in Alberta, the Central Public Health Laboratory in Ontario, the Laboratoire de santé publique du Québec and the NRCM. The NRCM tests the susceptibility of isolates to second-line drugs for all provinces and territories that do not conduct such testing at their laboratories. Upon request, the NRCM also tests isolates submitted by any provincial laboratory to confirm resistance patterns. Results from testing done by NRCM are returned to the provincial laboratory that submitted the isolates for testing and the provincial laboratory then submits these results to PHAC.
Tabulation and presentation of results
This report provides an overview of TB drug resistance in Canada for the period 2004 to 2014. Select data are presented by province/territory and by age and sex where feasible. Data from 2014 (the most recent reporting year for which data are available) are highlighted as well as important trends over time.
The data presented in this report were extracted from the CTBLSS database on March 30, 2015 and have been validated by the reporting laboratory. Results from cultures that grow in a given year are included in the statistics for that calendar year, otherwise the results are reflected in the subsequent year's report. For example, if a specimen was received by the laboratory on December 20, 2014 and the culture did not grow M. tuberculosis until January 2015, these results would be reflected in the 2015 report.
Samples submitted to the laboratory for drug susceptibility testing may be obtained at the time of the individual's diagnosis or at any time during treatment. Depending on the treatment duration, an individual may be tested multiple times over several years. The number of isolates described in this report, therefore, is not equal to the number of culture-positive cases reported through the case-based surveillance system over the same time period. That is because an individual with culture-positive TB is only reported once in the year of diagnosis but may be tested repeatedly for drug resistance over the course of several years until cured or until the prescribed treatment is completed. In the event that two specimens are confirmed to be from the same individual in a given calendar year, only the most recent susceptibility result is retained.
No statistical procedures were used for comparative analyses in this report, nor were any statistical techniques applied to account for missing data. Data in tables with small cell sizes (n ≤ 5) were not suppressed, since disclosure is not deemed to pose any risk of identifying individuals. These procedures are consistent with PHAC's Directive for the collection, use and dissemination of information relating to public health.Footnote 5
Results
In 2014, anti-tuberculosis drug susceptibility test results for 1,393 isolates were reported to PHAC. Of these, 790 (56.7%) were reported as MTBC where the species was known (786 were M. tuberculosis, two were M. africanum and two were M. bovis) and 586 (42.1%) were MTBC of an unknown species. Seventeen (1.2%) isolates were identified as M. bovis BCG (13 originating from Ontario, three from Alberta and one from Manitoba) and were excluded from further analyses (data not shown). Laboratory results for 1,376 MTBC isolates were analyzed for this report. Table 2 provides a breakdown of the number of isolates by reporting and originating province or territory. Figure 1 shows the number of MTBC isolates tested by the province or territory of origin.
Figure 1: Number of Mycobacterium tuberculosis complex isolates tested by province or territory of origin, 2014
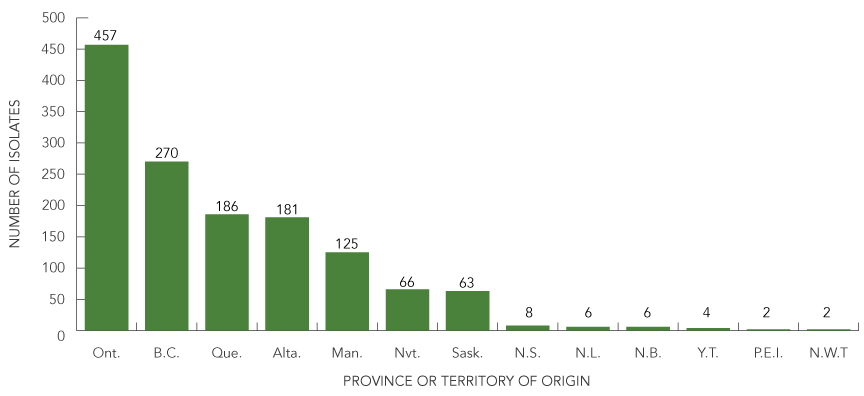
Figure 1 - Description
The bar chart shows the breakdown of the total number of isolates tested by the province or territory of origin. The horizontal axis names the provinces and territories. The vertical axis shows the number of isolates from 0 to 500 in increments of 50.
In descending order, the number of isolates tested by originating province or territory for 2014 was as follows:
| Province or territory of origin | Number of reported isolates |
|---|---|
| Ontario | 457 |
| British Columbia | 270 |
| Quebec | 186 |
| Alberta | 181 |
| Manitoba | 125 |
| Nunavut | 66 |
| Saskatchewan | 63 |
| Nova Scotia | 8 |
| Newfoundland and Labrador | 6 |
| New Brunswick | 6 |
| Yukon | 4 |
| Prince Edward Island | 2 |
| Northwest Territories | 2 |
For the period 2004 to 2014, drug susceptibility test results were reported for 14,813 isolates (Table 3). Of the results received between 2004 and 2014, 1,382 (9.3%) were resistant to one or more of the first-line medications, 168 isolates (1.1%) were identified as multidrug-resistant and seven (< 0.1%) were identified as extensively drug-resistant (Table 3).
Any first-line drug resistance
In 2014, all 1,376 MTBC isolates were tested for resistance to isoniazid, rifampin and ethambutol and 1,143 (83%) were tested for resistance to pyrazinamide (Table 4). One hundred and seven (7.8%) of the isolates tested were resistant to isoniazid, 30 (2.6%) were resistant to pyrazinamide, 24 (1.7%) were resistant to rifampin and six (0.4%) were resistant to ethambutol (Figure 2).
Figure 2: Percentage of isolates tested with any resistance to isoniazid, pyrazinamide, rifampin and ethambutol 2014.
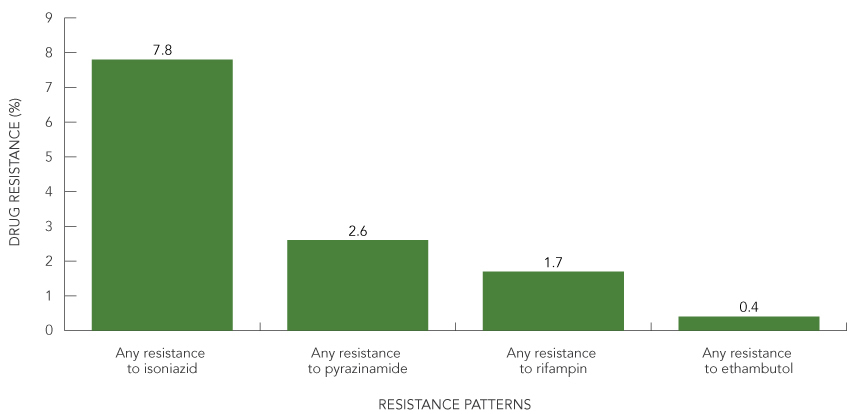
Figure 2 - Description
The bar chart shows the percentage of the total number of isolates tested with resistance to each of the four first-line drugs. The horizontal axis lists the drugs tested; from left to right, isoniazid (INH), pyrazinamide (PZA), rifampin (RMP), and ethambutol (EMB). The vertical axis shows the drug resistance percentage ranging from 0 to 9% in increments of 1%.
| Resistance pattern | Drug resistance (%) |
|---|---|
| Any resistance to isoniazid | 7.8% |
| Any resistance to pyrazinamide | 2.6% |
| Any resistance to rifampin | 1.7% |
| Any resistance to ethambutol | 0.4% |
Figure 3 shows the changes over time in the percentage of isolates resistant to each of the first-line drugs for the period 2004 to 2014. There has been very little change in the percentage of tested isolates showing any resistance. For the period 2004 to 2014, 7.9% (range: 6.7% to 9.2%) of all isolates tested were resistant to isoniazid (Table 4). Ethambutol, rifampin and pyrazinamide resistance have remained below 3%.
Figure 3: Percentage of isolates tested with any resistance to isoniazid, pyrazinamide, rifampin and ethambutol, 2004 to 2014
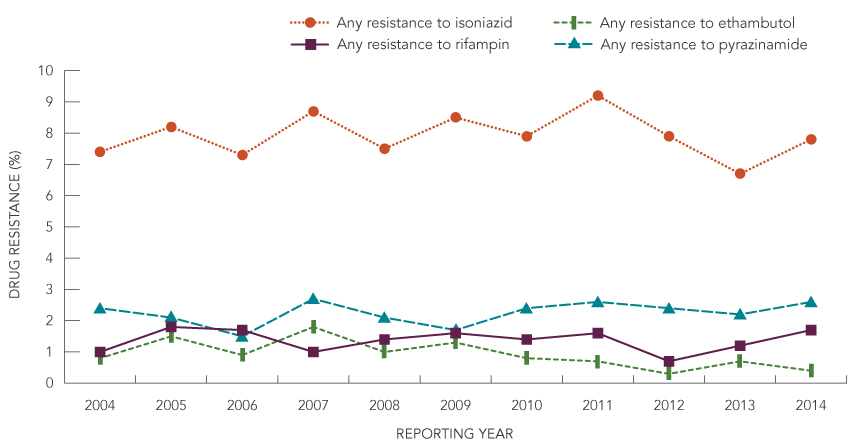
Figure 3 - Description
The line graph shows the percentage of isolates with resistance to each of the four first-line anti-tuberculosis drugs from 2004 to 2014. Each line represents one of the four drugs. The horizontal axis displays the reporting year from 2004 to 2014. The vertical axis shows the drug resistance percentage from 0 to 10% in increments of 1%.
The percentage of isolates tested with any resistance to isoniazid, rifampin, ethambutol, and pyrazinamide for 2004 to 2014 are as follows:
| Drug resistance (%) | Reporting year | ||||||||||
|---|---|---|---|---|---|---|---|---|---|---|---|
| 2004 | 2005 | 2006 | 2007 | 2008 | 2009 | 2010 | 2011 | 2012 | 2013 | 2014 | |
| Any resistance to isoniazid | 7.4% | 8.2% | 7.3% | 8.7% | 7.5% | 8.5% | 7.9% | 9.2% | 7.9% | 6.7% | 7.8% |
| Any resistance to rifampin | 1.0% | 1.8% | 1.7% | 1.0% | 1.4% | 1.6% | 1.4% | 1.6% | 0.7% | 1.2% | 1.7% |
| Any resistance to ethambutol | 0.8% | 1.5% | 0.9% | 1.8% | 1.0% | 1.3% | 0.8% | 0.7% | 0.3% | 0.7% | 0.4% |
| Any resistance to pyrazinamide | 2.4% | 2.1% | 1.5% | 2.7% | 2.1% | 1.7% | 2.4% | 2.6% | 2.8% | 2.2% | 2.6% |
Monoresistance
Overall, in 2014, 131 TB isolates (9.5% of all isolates tested) were reported to be resistant to at least one of the four first-line drugs (Table 4). The majority 108, (82.4%) were monoresistant. Of these 84 (77.8%) were isoniazid monoresistant, 19 (17.6%) were pyrazinamide monoresistant and five (4.6%) were rifampin monoresistant. No isolates were identified as ethambutol monoresistant (Table 5 to Table 17). For the period 2004 to 2014, 7.7% of all isolates tested were monoresistant, ranging from a high of 9.0% in 2011 to a low of 6.7% in 2013 (Table 4).
For the period 2004 to 2014, 28 isolates (0.2% of all isolates tested) were identified as rifampin-monoresistant. Of these, 15 (53.6%) originated from British Columbia; six (21.4%) from Ontario, two (7.1%) each from Alberta and Quebec, and one (3.6%) each from Saskatchewan, Northwest Territories and Nunavut. With the exception of 2004 and 2010 in which there were no reports of rifampin-monoresistant isolates, one to three rifampin-monoresistant isolates were reported each year from 2005 to 2014. In 2006, eight (0.6%) rifampin-monoresistant isolates were reported, representing an atypically high number for a one-year period (Table 5 to Table 17).
Polyresistance, multidrug-resistant and extensively drug-resistant TB
In 2014, four isolates (0.3%) were resistant to two or more of the first-line drugs excluding the isoniazid and rifampin combination (Table 4). All four were resistant to both isoniazid and pyrazinamide and susceptible to rifampin and ethambutol. Between 2004 and 2014 there were 64 (0.4%) isolates identified as polyresistant. Of these, 29 (45.3%) were resistant to isoniazid and ethambutol and 26 (40.6 %) were resistant to isoniazid and pyrazinamide. Of the remaining nine isolates, six were resistant to isoniazid, ethambutol, and pyrazinamide, two were resistant to rifampin and pyrazinamide, and one was resistant to ethambutol and pyrazinamide (Table 5 to Table 17).
In 2014, 19 (1.4%) of all isolates tested were resistant to both isoniazid and rifampin (identifying them as at least MDR-TB). Of these 19 isolates, ten (52.6%) were resistant only to isoniazid and rifampin, three (15.8%) were also resistant to ethambutol, two (10.5%) were also resistant to pyrazinamide and four (21.0%) were also resistant to pyrazinamide and ethambutol (Table 18).
To rule out XDR-TB, all 19 isolates found to be resistant to both isoniazid and rifampin were subsequently tested for resistance to select second-line drugs. Of these, 16 (84.2%) isolates were susceptible to both the injectable agents and the fluoroquinolones, one (5.2%) was resistant to an injectable agent but susceptible to the fluoroquinolones and one (5.2%) was resistant to a fluoroquinolone but susceptible to the injectable agents (data not shown). The remaining isolate was resistant to at least one of the injectable agents and to a fluoroquinolone. Therefore, in 2014, 18 isolates were identified as MDR-TB and one was identified as XDR-TB. Figure 4 presents patterns of TB drug resistance as a percentage of all isolates tested in 2014.
Figure 4: Tuberculosis drug resistance patterns as a percentage of isolates tested, 2014
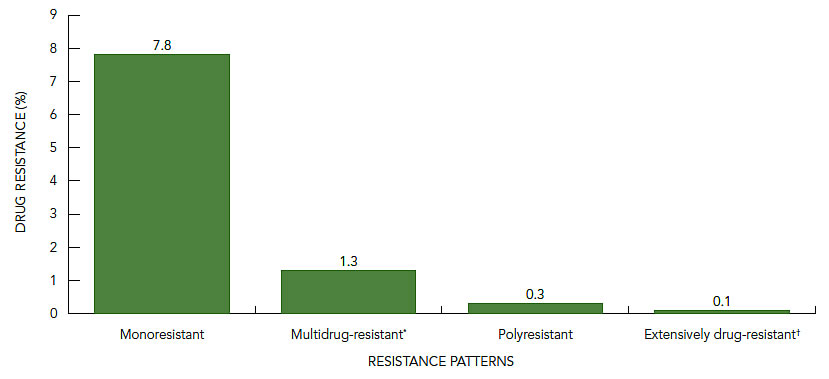
* Multidrug-resistant TB is TB that is resistant to isoniazid and rifampin but does not meet the definition of extensively drug-resistant TB.
† Extensively drug-resistant TB is TB that is resistant isoniazid and rifampin, any fluoroquinolone and at least one of three injectable second-line drugs (amikacin, capreomycin and kanamycin).
Figure 4 - Description
The bar graph shows the percentage of the total number of isolates tested in 2014 that were drug resistant by type of resistance. The horizontal axis shows the resistance pattern including isolates that are monoresistant, isolates that are multidrug-resistant, polyresistant and extensively drug-resistant. The vertical axis displays the drug resistance percentage ranging for 0 to 9% in increments of 1%.
The drug resistance patterns as a percentage of isolates tested in 2014 are as follows:
| Resistance pattern | Drug resistance (%) |
|---|---|
| Monoresistant | 7.8% |
| Multidrug-resistant | 1.3% |
| Polyresistant | 0.3% |
| Extensively drug-resistant | 0.1% |
Note that multidrug-resistant TB is TB that is resistant to at least isoniazid and rifampin, but does not meet the definition of extensively drug-resistant TB. Extensively drug-resistant TB is TB that is resistant isoniazid and rifampin, any fluoroquinolone and at least one of three injectable second–line drugs (amikacin, capreomycin and kanamycin).
For the period 2004 to 2014, 168 isolates were classified as MDR-TB, representing 1.1% of isolates tested over this time (Table 4). Seven isolates were classified as XDR-TB, representing an annual average of less than 0.1% of the total number of isolates tested for this period. An average of 15 MDR-TB isolates were reported each year, ranging from a low of eight in 2012 (0.6% of all isolates) to a high of 22 in 2005 (1.6% of all isolates tested).
Figure 5 shows the overall pattern of reported TB drug resistance as a percentage of isolates tested for the period 2004 to 2014. While there were small fluctuations in the percentage of isolates showing various resistance patterns, there was no notable trend over time.
Figure 5: Tuberculosis drug resistance patterns as a percentage of isolates tested, 2004 to 2014

* Multidrug-resistant TB is TB that is resistant to isoniazid and rifampin but does not meet the definition of extensively drug-resistant TB.
† Extensively drug-resistant TB is TB that is resistant isoniazid and rifampin, any fluoroquinolone and at least one of three injectable second-line drugs (amikacin, capreomycin and kanamycin).
Figure 5 - Description
The line graph shows the percentage of isolates showing resistance based on the pattern of resistance to anti-TB medication from 2004 to 2014. The type of resistance presented includes isolates that are monoresistant, isolates that are multidrug-resistant, isolates that are extensively drug-resistant, and other patterns.
The tuberculosis drug resistance patterns as a percentage of isolates tested from 2004 to 2014 are as follows:
| Resistance pattern | Reporting year | ||||||||||
|---|---|---|---|---|---|---|---|---|---|---|---|
| 2004 | 2005 | 2006 | 2007 | 2008 | 2009 | 2010 | 2011 | 2012 | 2013 | 2014 | |
| Monoresistance | 6.8% | 7.7% | 7.7% | 8.8% | 6.9% | 7.4% | 6.9% | 9.0% | 9.1% | 6.7% | 7.8% |
| Multidrug-resistant TB | 0.9% | 1.6% | 1.1% | 0.9% | 1.1% | 1.4% | 1.3% | 1.4% | 0.6% | 1.0% | 1.3% |
| Polyresistant | 0.9% | 0.2% | 0.2% | 90.0% | 40.0% | 0.8% | 0.5% | 0.1% | 0.1% | 0.3% | 0.3% |
| Extensively drug-resistant TB | 0.0% | 0.0% | 0.1% | 0.0% | 0.1% | 0.0% | 0.1% | 0.1% | 0.1% | 0.1% | 0.1% |
Note that multidrug-resistant TB is TB that is resistant to at least isoniazid and rifampin, but does not meet the definition of extensively drug-resistant TB. Extensively drug-resistant TB is TB that is resistant isoniazid and rifampin, any fluoroquinolone and at least one of three injectable second–line drugs (amikacin, capreomycin and kanamycin).
Geographical distribution
Overall, the total number of isolates tested and reported in 2014 (1,376) was similar to the number reported in 2013 (1,381) (Table 2). In 2014, the majority of reported isolates originated from five provinces: Ontario (33.2%), British Columbia (19.6%), Quebec (13.5%), Alberta (13.2%), and Manitoba (9.1%). Saskatchewan accounted for fewer than 5% of reported isolates while the territories (Northwest Territories, Nunavut and Yukon) and the Atlantic provinces (New Brunswick, Newfoundland and Labrador, Nova Scotia and Prince Edward Island) together accounted for fewer than 7% of reported isolates in 2014.
All isolates from Northwest Territories, Nunavut, Yukon, New Brunswick, Newfoundland and Labrador, and Prince Edward Island were fully susceptible to all first-line drugs tested. Of the 19 isolates resistant to both isoniazid and rifampin in 2014, four originated from Alberta, six from British Columbia, seven from Ontario and two from Quebec (Table 18).
For the period 2004 to 2014, all 168 MDR-TB isolates originated from six provinces: Alberta, British Columbia, Manitoba, Ontario, Quebec and Saskatchewan (Table 19). Of the seven isolates identified as XDR-TB, five originated from Ontario, one from Manitoba and one from Quebec.
Tables 5 through 17 present results of routine drug susceptibility testing of MTBC isolates to anti-tuberculosis drugs for the period 2004 to 2014, by province and territory.
Demographic information
In 2014, age or date of birth was reported for all but one of the 1,376 individuals from whom reported isolates were obtained (Table 20). Of the 131 isolates with drug resistance, 22.9% were from individuals 25 to 34 years of age and 20.6% were from individuals 35 to 44 years of age. 1.6% of isolates were from individuals under 15 years of age (Table 20). The XDR-TB isolate was from an individual 25 to 34 years of age.
In 2014, sex was known for individuals from whom 1,374 (99.9%) of the 1,376 isolates were obtained (Table 20). Males accounted for 56.6% of reported isolates in 2014 (Table 20). Of isolates with any resistance, females accounted for 51.9%, and one half were isolates with resistance to both isoniazid and rifampin. The XDR-TB isolate was from a female.
Discussion
In many parts of the world, drug resistance is a major challenge to preventing and controlling TB. Eastern Europe and Central Asia continue to have the world's highest proportion of MDR-TB cases.Footnote 6
Organisms resistant to both isoniazid and rifampin pose a considerable challenge to treatment and prevention efforts because effective anti-tuberculosis drugs are limited. Data published by the World Health Organization show that globally in 2012, about 3.6% (95% CI: 2.1% - 5.1%) of new TB cases and 20.2% (95% CI: 13.3% - 27.2%) of previously treated TB cases were MDR-TB.Footnote 6 Although the data captured through the CTBLSS do not distinguish between isolates from new versus previously treated cases of TB, the fact that only 1.3 % of isolates tested in 2014 were MDR-TB is a considerably lower finding than global estimates. In addition, the identification of seven XDR-TB cases over the period 2004 to 2014 indicates that XDR-TB in Canada is still a relatively rare event.
Overall, there was no notable change in the percentage of isolates with resistance to first-line medications in Canada from 2004 to 2014; however, geographic distribution changed. The percentage of isolates originating from Ontario decreased whereas the percentage originating from Alberta and British Columbia increased relative to the number of reports received in previous years. This may indicate a change in the overall distribution of TB disease in Canada, and requires further monitoring.
Strengths and limitations
The CTBLSS is the result of successful collaboration between federal, provincial and territorial governments and the CTLTN. The primary objective of the CTBLSS is to monitor emerging trends and patterns in anti-tuberculosis drug resistance in Canada. This report presents detailed data on the extent of first- and second-line TB drug resistance in Canada, disaggregated by province/territory and, where feasible, by sex and age. As the primary source of national data on TB drug resistance in Canada, the data within this report provide timely information for public health action, as well as policy and program development and assessment.
Prior to analysis and report preparation, all data were reviewed for errors, inconsistencies and completeness. Submitting laboratories were provided with a summary report of their data for review. Following validation by the reporting laboratories, the data were integrated into the CTBLSS database. Nevertheless, like most surveillance data, the data in this report are subject to possible coding, reporting and processing errors.
Previously published data are subject to updates resulting from late reporting or when revisions are received from participating laboratories. Any revisions to previously reported data are reflected in subsequent reports. Therefore, the data presented in this report are considered the most up-to-date and replace those previously published in this report series.
Although efforts are made to ensure that multiple records for any one individual in a given year are removed, given the minimal identifying information available for each isolate (age and sex), it is possible that multiple records from one individual may be included in the database. This bias is likely minimal given the validation process with the data providers.
Demographic and clinical data collected through the CTBLSS are limited. No data are collected on ethnic origin, diagnostic/clinical information, or treatment outcome. Additional demographic and clinical information on individuals from whom the TB isolates were obtained would facilitate a more in-depth epidemiological assessment of drug resistance patterns in Canada. Additionally, differentiation between primary and acquired drug resistance and differing resistance pattern among new cases in comparison to re-treatment cases is not possible based on data collected through this surveillance system. However, the Tuberculosis in Canada report, which provides an overview of the overall number of reported active TB cases and corresponding incidence rates in Canada by select demographic and clinical characteristics, presents case-based (vs. isolate-based) data on primary and acquired drug resistance in Canada that are not presented here. Together, these two reports provide a comprehensive overview of TB case and drug resistance surveillance data from a national perspective.
Typically, only isolates with MDR-TB or other extensive resistance patterns will undergo drug sensitivity testing to select second-line drugs. Although the Clinical and Laboratory Standards Institute (CLSI) recommends that isoniazid-monoresistant isolates, as well as other polyresistant, non-MDR isolates be tested for second-line drug resistance, this is not universally reported in Canada. Other isolates which are not MDR-TB may be resistant to fluoroquinolones because of the widespread use of these antibiotics for other respiratory infections. To some extent, this limits our understanding of the emergence of second-line drug resistance within Canada.
Conclusion
Data collected through the CTBLSS indicate that the presence of TB drug resistance in Canada is currently below the global average and has remained relatively stable since reporting began. However, the CTBLSS remains vital to the monitoring of TB drug resistance in Canada in order to respond to growing worldwide concern about resistance and the emergence of XDR-TB.
Appendices
Appendix I: Participating Laboratories of the Canadian Tuberculosis Laboratory Technical Network (CTLTN)
Provincial Laboratory of Public Health
Calgary
Cary Shandro
Technologist Mycobacteriology
Dr. Greg Tyrrell
Clinical Microbiologist
Graham Tipples
Medical/Scientific Director
British Columbia Centre for Disease Control
Public Health Microbiology and Reference Laboratory
Vancouver
Dr. Mabel Rodrigues
Mycobacteriology/TB Laboratory, Section Head
Dr. Patrick Tang
Medical Microbiologist
Dr. Judy L. Isaac-Renton
Director, Laboratory Services
Diagnostics Services Manitoba
Health Sciences Centre
Winnipeg
Assunta Rendina
Charge Technologist, Mycobacteriology
Doug Swidinsky
Senior Technologist
New Brunswick
Department of Laboratory Medicine
Saint John Regional Hospital
Saint John
Hope MacKenzie
MLT3-Supervisor CL3 Lab
Dr. Duncan Webster
Medical Microbiologist/ Infectious Disease
Dr. Marek Godlewski
Laboratory Director
Newfoundland and Labrador
Newfoundland and Labrador Public Health Laboratory
St. John's
Audrey Martin
Tech II
Lourens Robberts
Director & Clinical Microbiologist
Stanton Territorial Hospital
Yellowknife
Sherrill Webber
Tech II, Microbiology
Carolyn Russell
Laboratory Supervisor
Cheryl Case
Manager
Therapeutic & Diagnostic Services
Department of Pathology & Laboratory Medicine
Queen Elizabeth II Health Sciences Centre
Halifax
Sherry Maston
Division of Medical Microbiology
Dr. David Haldane,
Director, Provincial Public Health Laboratory Network and Special Pathogens
Dr. Todd Hatchette
Director, Pathology and Laboratory Medicine
Qikiqtani General Hospital
Iqaluit
Laboratory Health
Central Public Health Laboratory
Ontario Agency for Health
Protection and Promotion
Toronto
Kevin May
Operational Lead, Mycobacteriology
Dr. Frances Jamieson
Medical Microbiologist -TB and Mycobacteriology
Alex Marchand-Austin
Manager, Laboratory Surveillance and Data Management
Laboratoire de santé publique du Québec
Institut national de santé publique du Québec
Sainte-Anne-de-Bellevue
Hafid Soualhine
Head, Mycobacteriology & Aerobic Actinomycetes
Dr. Cécile Tremblay
Director
Saskatchewan Disease Control Laboratory
Regina
Rita Thomas
Technologist, TB/Bacteriology
Dr. Christine Turenne
Microbiologist
Dr. Paul Levett
Microbiologist
Dr. David Alexander
Microbiologist
Director, Saskatchewan Health
National Microbiology Laboratory
Public Health Agency of Canada
Winnipeg
Joyce Wolfe
Program Manager, Mycobacteriology
Appendix II: M. tuberculosis Complex Antimicrobial Susceptibility Reporting Form
Please note

Appendix III: Data Tables
| Anti-tuberculosis drugs | Critical concentrationsTable 1 Footnote * (mg/L) BACTEC® 960 | Comments | |
|---|---|---|---|
| First-line | Isoniazid (INH) | 0.1 | When resistance to INH is 0.1 mg/L, tests are repeated with INH 0.4 mg/L to determine the level of resistance. Nevertheless, the isolate is reported as resistant using the 0.1 mg/L cut-off level. |
| Rifampin (RMP) | 1.0 | ||
| Ethambutol (EMB) | 5.0 | ||
| Pyrazinamide (PZA) | 100.0 | Routine testing is not performed for isolates from British Columbia. | |
| Second-line | Amikacin (AK) | 1.0 | |
| Capreomycin (CM) | 2.5 | ||
| Ethionamide (ETH) | 5.0 | ||
| Kanamycin (KM) | 2.5 | ||
| Linezolid (LIN) | 1.0 | ||
| Moxifloxacin (MOX) | 0.3 | ||
| Ofloxacin (OFL) | 2.0 | ||
| Para-aminosalicylic acid (PAS) | 4.0 | ||
| Rifabutin (RBT) | 0.5 | ||
| Streptomycin (SM) | 1.0 | ||
|
|||
| Reporting province | Canada | Originating province | ||||||||||||
|---|---|---|---|---|---|---|---|---|---|---|---|---|---|---|
| N.L. | P.E.I. | N.S. | N.B. | Que. | Ont. | Man. | Sask. | Alta. | B.C. | Y.T. | N.W.T | Nvt. | ||
| N.L. | 6 | 6 | 0 | 0 | 0 | 0 | 0 | 0 | 0 | 0 | 0 | 0 | 0 | 0 |
| N.S. | 10 | 0 | 2 | 8 | 0 | 0 | 0 | 0 | 0 | 0 | 0 | 0 | 0 | 0 |
| N.B. | 6 | 0 | 0 | 0 | 6 | 0 | 0 | 0 | 0 | 0 | 0 | 0 | 0 | 0 |
| Que. | 183 | 0 | 0 | 0 | 0 | 183 | 0 | 0 | 0 | 0 | 0 | 0 | 0 | 0 |
| Ont. | 523 | 0 | 0 | 0 | 0 | 3 | 457 | 0 | 0 | 0 | 2 | 0 | 0 | 61 |
| Man. | 125 | 0 | 0 | 0 | 0 | 0 | 0 | 125 | 0 | 0 | 0 | 0 | 0 | 0 |
| Sask. | 63 | 0 | 0 | 0 | 0 | 0 | 0 | 0 | 63 | 0 | 0 | 0 | 0 | 0 |
| Alta. | 188 | 0 | 0 | 0 | 0 | 0 | 0 | 0 | 0 | 180 | 1 | 0 | 2 | 5 |
| B.C. | 272 | 0 | 0 | 0 | 0 | 0 | 0 | 0 | 0 | 1 | 267 | 4 | 0 | 0 |
| TOTAL | 1,376 | 6 | 2 | 8 | 6 | 186 | 457 | 125 | 63 | 181 | 270 | 4 | 2 | 66 |
|
Abbreviations: Alta.= Alberta; B.C.= British Columbia; Man.= Manitoba; N.B.= New Brunswick; N.L.= Newfoundland and Labrador; N.S.= Nova Scotia; Nvt.= Nunavut; N.W.T.= Northwest Territories; Ont.= Ontario; P.E.I.= Prince Edward Island; Que.= Quebec; Sask.= Saskatchewan; Y.T.= Yukon Territory. |
||||||||||||||
| Reporting year | Total number of reported MTBC isolates | Resistant to one or more first line drugs | Multidrug-resistant TBTable 3 Footnote * | Extensively drug-resistant TBTable 3 Footnote † | |||
|---|---|---|---|---|---|---|---|
| Number | Percent (%) | Number | Percent (%) | Number | Percent (%) | ||
| 2004 | 1,376 | 119 | 8.6 | 12 | 0.9 | 0 | 0.0 |
| 2005 | 1,335 | 128 | 9.6 | 22 | 1.6 | 0 | 0.0 |
| 2006 | 1,389 | 126 | 9.1 | 15 | 1.1 | 1 | 0.1 |
| 2007 | 1,267 | 133 | 10.5 | 11 | 0.9 | 0 | 0.0 |
| 2008 | 1,356 | 116 | 8.6 | 15 | 1.1 | 1 | 0.1 |
| 2009 | 1,331 | 127 | 9.5 | 18 | 1.4 | 0 | 0.0 |
| 2010 | 1,279 | 112 | 8.8 | 17 | 1.3 | 1 | 0.1 |
| 2011 | 1,319 | 139 | 10.5 | 18 | 1.4 | 1 | 0.1 |
| 2012 | 1,404 | 139 | 9.9 | 8 | 0.6 | 1 | 0.1 |
| 2013 | 1,381 | 112 | 8.1 | 14 | 1.0 | 1 | 0.1 |
| 2014 | 1,376 | 131 | 9.5 | 18 | 1.3 | 1 | 0.1 |
| TOTAL | 14,813 | 1,382 | 9.3 | 168 | 1.1 | 7 | <0.1 |
Abbreviations: MTBC= Mycobacterium tuberculosis complex
|
|||||||
| Reporting year | ||||||||||||||||||||||||
|---|---|---|---|---|---|---|---|---|---|---|---|---|---|---|---|---|---|---|---|---|---|---|---|---|
| 2004 | 2005 | 2006 | 2007 | 2008 | 2009 | 2010 | 2011 | 2012 | 2013 | 2014 | TOTAL | |||||||||||||
| n | % | n | % | n | % | n | % | n | % | n | % | n | % | n | % | n | % | n | % | n | % | n | % | |
| Total number of isolates tested | 1,376 | 100.0 | 1,335 | 100.0 | 1,389 | 100.0 | 1,267 | 100.0 | 1,356 | 100.0 | 1,331 | 100.0 | 1,279 | 100.0 | 1,319 | 100.0 | 1,404 | 100.0 | 1,381 | 100.0 | 1,376 | 100.0 | 14,813 | 100.0 |
| Isolates tested that were susceptible | 1,257 | 91.4 | 1,207 | 90.4 | 1,263 | 90.9 | 1,134 | 89.5 | 1,240 | 91.4 | 1,204 | 90.5 | 1,167 | 91.2 | 1,180 | 89.5 | 1,265 | 90.1 | 1,269 | 91.9 | 1,245 | 90.5 | 13,431 | 90.7 |
| Isolates showing any resistance to first-line drugs | ||||||||||||||||||||||||
| Any resistance to isoniazid | 102 | 7.4 | 109 | 8.2 | 101 | 7.3 | 110 | 8.7 | 102 | 7.5 | 113 | 8.5 | 101 | 7.9 | 122 | 9.2 | 111 | 7.9 | 93 | 6.7 | 107 | 7.8 | 1,171 | 7.9 |
| Any resistance to rifampin | 14 | 1.0 | 24 | 1.8 | 24 | 1.7 | 13 | 1.0 | 19 | 1.4 | 21 | 1.6 | 18 | 1.4 | 21 | 1.6 | 10 | 0.7 | 17 | 1.2 | 24 | 1.7 | 205 | 1.4 |
| Any resistance to ethambutol | 11 | 0.8 | 20 | 1.5 | 12 | 0.9 | 23 | 1.8 | 13 | 1.0 | 17 | 1.3 | 10 | 0.8 | 9 | 0.7 | 4 | 0.3 | 10 | 0.7 | 6 | 0.4 | 135 | 0.9 |
| Any resistance to pyrazinamideTable 4 Footnote * | 26 | 2.4 | 22 | 2.1 | 16 | 1.5 | 27 | 2.7 | 22 | 1.7 | 18 | 2.4 | 25 | 2.6 | 28 | 2.4 | 33 | 2.4 | 26 | 2.2 | 30 | 2.6 | 273 | 2.6 |
| Isolates resistant to one or more first-line TB drugs | 119 | 8.6 | 128 | 9.6 | 126 | 9.1 | 133 | 10.5 | 116 | 8.6 | 127 | 9.5 | 112 | 8.8 | 139 | 10.5 | 139 | 9.9 | 112 | 8.1 | 131 | 9.5 | 1,382 | 9.3 |
| Monoresistant | 94 | 6.8 | 103 | 7.7 | 107 | 7.7 | 111 | 8.8 | 94 | 6.9 | 98 | 7.4 | 88 | 6.9 | 119 | 9.0 | 128 | 9.1 | 93 | 6.7 | 108 | 7.8 | 1,143 | 7.7 |
| Multidrug-resistantTable 4 Footnote † | 12 | 0.9 | 22 | 1.6 | 15 | 1.1 | 11 | 0.9 | 15 | 1.1 | 18 | 1.4 | 17 | 1.3 | 18 | 1.4 | 8 | 0.6 | 14 | 1.0 | 18 | 1.3 | 168 | 1.1 |
| Polyresistant | 13 | 0.9 | 3 | 0.2 | 3 | 0.2 | 11 | 0.9 | 6 | 0.4 | 11 | 0.8 | 6 | 0.5 | 1 | 0.1 | 2 | 0.1 | 4 | 0.3 | 4 | 0.3 | 64 | 0.4 |
| Extensively drug-resistantTable 4 Footnote ‡ | 0 | 0.0 | 0 | 0.0 | 1 | 0.1 | 0 | 0.0 | 1 | 0.1 | 0 | 0.0 | 1 | 0.1 | 1 | 0.1 | 1 | 0.1 | 1 | 0.1 | 1 | 0.1 | 7 | <0.1 |
|
||||||||||||||||||||||||
| Reporting year | ||||||||||||||||||||||
|---|---|---|---|---|---|---|---|---|---|---|---|---|---|---|---|---|---|---|---|---|---|---|
| 2004 | 2005 | 2006 | 2007 | 2008 | 2009 | 2010 | 2011 | 2012 | 2013 | 2014 | ||||||||||||
| n | % | n | % | n | % | n | % | n | % | n | % | n | % | n | % | n | % | n | % | n | % | |
| Isolates tested for resistance to INH, RMP, EMB & PZA Table 5 Footnote * | 94 | 100.0 | 129 | 100.0 | 104 | 100.0 | 98 | 100.0 | 134 | 100.0 | 159 | 100.0 | 107 | 100.0 | 156 | 100.0 | 163 | 100.0 | 154 | 100.0 | 181 | 100.0 |
| Isolates susceptible to all first-line TB drugs | 82 | 87.2 | 115 | 89.1 | 95 | 91.3 | 92 | 93.9 | 123 | 91.8 | 145 | 91.2 | 96 | 89.7 | 133 | 85.3 | 148 | 90.8 | 140 | 90.9 | 165 | 91.2 |
| Resistant to one or more first line drugs | 12 | 12.8 | 14 | 10.9 | 9 | 8.7 | 6 | 6.1 | 11 | 8.2 | 14 | 8.8 | 11 | 10.3 | 23 | 14.7 | 15 | 9.2 | 14 | 9.1 | 16 | 8.8 |
| Monoresistant TB | ||||||||||||||||||||||
| INH | 7 | 7.4 | 10 | 7.8 | 7 | 6.7 | 5 | 5.1 | 8 | 6.0 | 8 | 5.0 | 6 | 5.6 | 14 | 9.0 | 10 | 6.1 | 9 | 5.8 | 11 | 6.1 |
| RMP | 0 | 0.0 | 0 | 0.0 | 0 | 0.0 | 0 | 0.0 | 0 | 0.0 | 1 | 0.6 | 0 | 0.0 | 0 | 0.0 | 0 | 0.0 | 0 | 0.0 | 1 | 0.6 |
| EMB | 0 | 0.0 | 0 | 0.0 | 0 | 0.0 | 0 | 0.0 | 0 | 0.0 | 0 | 0.0 | 0 | 0.0 | 0 | 0.0 | 0 | 0.0 | 0 | 0.0 | 0 | 0.0 |
| PZA | 2 | 2.1 | 0 | 0.0 | 1 | 1.0 | 1 | 1.0 | 0 | 0.0 | 3 | 1.9 | 0 | 0.0 | 2 | 1.3 | 3 | 1.8 | 4 | 2.6 | 0 | 0.0 |
| Total | 9 | 9.6 | 10 | 7.8 | 8 | 7.7 | 6 | 6.1 | 8 | 6.0 | 12 | 7.5 | 6 | 5.6 | 16 | 10.3 | 13 | 8.0 | 13 | 8.4 | 12 | 6.6 |
| Polyresistant | ||||||||||||||||||||||
| INH & PZA | 1 | 1.1 | 0 | 0.0 | 0 | 0.0 | 0 | 0.0 | 0 | 0.0 | 1 | 0.6 | 1 | 0.9 | 0 | 0.0 | 1 | 0.6 | 0 | 0.0 | 0 | 0.0 |
| INH & EMB | 0 | 0.0 | 0 | 0.0 | 0 | 0.0 | 0 | 0.0 | 1 | 0.7 | 1 | 0.6 | 0 | 0.0 | 0 | 0.0 | 0 | 0.0 | 0 | 0.0 | 0 | 0.0 |
| INH & EMB & PZA | 0 | 0.0 | 0 | 0.0 | 0 | 0.0 | 0 | 0.0 | 0 | 0.0 | 0 | 0.0 | 1 | 0.9 | 0 | 0.0 | 0 | 0.0 | 1 | 0.6 | 0 | 0.0 |
| Total | 1 | 1.1 | 0 | 0.0 | 0 | 0.0 | 0 | 0.0 | 1 | 0.7 | 2 | 1.3 | 2 | 1.9 | 0 | 0.0 | 1 | 0.6 | 1 | 0.6 | 0 | 0.0 |
| Multidrug-resistant TBTable 5 Footnote † | ||||||||||||||||||||||
| INH & RMP | 0 | 0.0 | 0 | 0.0 | 0 | 0.0 | 0 | 0.0 | 0 | 0.0 | 0 | 0.0 | 0 | 0.0 | 1 | 0.6 | 0 | 0.0 | 0 | 0.0 | 0 | 0.0 |
| INH & RMP & EMB | 0 | 0.0 | 1 | 0.8 | 0 | 0.0 | 0 | 0.0 | 0 | 0.0 | 0 | 0.0 | 0 | 0.0 | 0 | 0.0 | 0 | 0.0 | 0 | 0.0 | 0 | 0.0 |
| INH & RMP & EMB & AK & KM & RBT | 1 | 1.1 | 0 | 0.0 | 0 | 0.0 | 0 | 0.0 | 0 | 0.0 | 0 | 0.0 | 0 | 0.0 | 0 | 0.0 | 0 | 0.0 | 0 | 0.0 | 0 | 0.0 |
| INH & RMP & EMB & PZA | 0 | 0.0 | 1 | 0.8 | 0 | 0.0 | 0 | 0.0 | 1 | 0.7 | 0 | 0.0 | 0 | 0.0 | 0 | 0.0 | 0 | 0.0 | 0 | 0.0 | 0 | 0.0 |
| INH & RMP & EMB & PZA & RBT | 0 | 0.0 | 0 | 0.0 | 0 | 0.0 | 0 | 0.0 | 0 | 0.0 | 0 | 0.0 | 0 | 0.0 | 0 | 0.0 | 0 | 0.0 | 0 | 0.0 | 1 | 0.6 |
| INH & RMP & EMB & PZA & SM | 0 | 0.0 | 1 | 0.8 | 0 | 0.0 | 0 | 0.0 | 0 | 0.0 | 0 | 0.0 | 0 | 0.0 | 0 | 0.0 | 0 | 0.0 | 0 | 0.0 | 0 | 0.0 |
| INH & RMP & EMB & PZA & SM & OFL & MOX & ETH & RBT | 0 | 0.0 | 0 | 0.0 | 0 | 0.0 | 0 | 0.0 | 0 | 0.0 | 0 | 0.0 | 0 | 0.0 | 0 | 0.0 | 0 | 0.0 | 0 | 0.0 | 1 | 0.6 |
| INH & RMP & EMB & PZA & SM & RBT | 0 | 0.0 | 0 | 0.0 | 0 | 0.0 | 0 | 0.0 | 1 | 0.7 | 0 | 0.0 | 1 | 0.9 | 1 | 0.6 | 0 | 0.0 | 0 | 0.0 | 0 | 0.0 |
| INH & RMP & EMB & SM | 0 | 0.0 | 0 | 0.0 | 1 | 1.0 | 0 | 0.0 | 0 | 0.0 | 0 | 0.0 | 0 | 0.0 | 0 | 0.0 | 0 | 0.0 | 0 | 0.0 | 0 | 0.0 |
| INH & RMP & EMB & SM & OFL | 1 | 1.1 | 0 | 0.0 | 0 | 0.0 | 0 | 0.0 | 0 | 0.0 | 0 | 0.0 | 0 | 0.0 | 0 | 0.0 | 0 | 0.0 | 0 | 0.0 | 0 | 0.0 |
| INH & RMP & ETH & RBT | 0 | 0.0 | 0 | 0.0 | 0 | 0.0 | 0 | 0.0 | 0 | 0.0 | 0 | 0.0 | 0 | 0.0 | 2 | 1.3 | 0 | 0.0 | 0 | 0.0 | 1 | 0.6 |
| INH & RMP & PZA & SM & ETH | 0 | 0.0 | 0 | 0.0 | 0 | 0.0 | 0 | 0.0 | 0 | 0.0 | 0 | 0.0 | 0 | 0.0 | 1 | 0.6 | 0 | 0.0 | 0 | 0.0 | 0 | 0.0 |
| INH & RMP & PZA & SM & OFL & RBT | 0 | 0.0 | 0 | 0.0 | 0 | 0.0 | 0 | 0.0 | 0 | 0.0 | 0 | 0.0 | 1 | 0.9 | 0 | 0.0 | 0 | 0.0 | 0 | 0.0 | 0 | 0.0 |
| INH & RMP & PZA & SM & RBT | 0 | 0.0 | 0 | 0.0 | 0 | 0.0 | 0 | 0.0 | 0 | 0.0 | 0 | 0.0 | 1 | 0.9 | 1 | 0.6 | 0 | 0.0 | 0 | 0.0 | 0 | 0.0 |
| INH & RMP & RBT | 0 | 0.0 | 0 | 0.0 | 0 | 0.0 | 0 | 0.0 | 0 | 0.0 | 0 | 0.0 | 0 | 0.0 | 1 | 0.6 | 0 | 0.0 | 0 | 0.0 | 0 | 0.0 |
| INH & RMP & SM | 0 | 0.0 | 1 | 0.8 | 0 | 0.0 | 0 | 0.0 | 0 | 0.0 | 0 | 0.0 | 0 | 0.0 | 0 | 0.0 | 0 | 0.0 | 0 | 0.0 | 0 | 0.0 |
| INH & RMP & SM & ETH & RBT | 0 | 0.0 | 0 | 0.0 | 0 | 0.0 | 0 | 0.0 | 0 | 0.0 | 0 | 0.0 | 0 | 0.0 | 0 | 0.0 | 0 | 0.0 | 0 | 0.0 | 1 | 0.6 |
| INH & RMP & SM & RBT | 0 | 0.0 | 0 | 0.0 | 0 | 0.0 | 0 | 0.0 | 0 | 0.0 | 0 | 0.0 | 0 | 0.0 | 0 | 0.0 | 1 | 0.6 | 0 | 0.0 | 0 | 0.0 |
| Total | 2 | 2.1 | 4 | 3.1 | 1 | 1.0 | 0 | 0.0 | 2 | 1.5 | 0 | 0.0 | 3 | 2.8 | 7 | 4.5 | 1 | 0.6 | 0 | 0.0 | 4 | 2.2 |
Abbreviations: AK=amikacin;EMB=ethambutol; ETH=ethionamide; INH=isoniazid; KM=kanamycin; MOX=moxifloxacin; OFL=ofloxacin; PAS=para-aminosalicylic acid; PZA=pyrazinamide; RBT=rifabutin; RMP=rifampin; SM=streptomycin.
|
||||||||||||||||||||||
| Reporting year | ||||||||||||||||||||||
|---|---|---|---|---|---|---|---|---|---|---|---|---|---|---|---|---|---|---|---|---|---|---|
| 2004 | 2005 | 2006 | 2007 | 2008 | 2009 | 2010 | 2011 | 2012 | 2013 | 2014 | ||||||||||||
| n | % | n | % | n | % | n | % | n | % | n | % | n | % | n | % | n | % | n | % | n | % | |
| Isolates tested for resistance to INH, RMP, EMBTable 6 Footnote *,Table 6 Footnote † | 263 | 100.0 | 204 | 100.0 | 275 | 100.0 | 231 | 100.0 | 254 | 100.0 | 239 | 100.0 | 204 | 100.0 | 194 | 100.0 | 254 | 100.0 | 223 | 100.0 | 270 | 100.0 |
| Isolates susceptible to all first-line TB drugs | 237 | 90.1 | 182 | 89.2 | 257 | 93.5 | 210 | 90.9 | 230 | 90.6 | 215 | 90.0 | 185 | 90.7 | 170 | 87.6 | 231 | 90.9 | 204 | 91.5 | 235 | 87.0 |
| Resistant to one or more first line drugs | 26 | 9.9 | 22 | 10.8 | 18 | 6.5 | 21 | 9.1 | 24 | 9.4 | 24 | 10.0 | 19 | 9.3 | 24 | 12.4 | 23 | 9.1 | 19 | 8.5 | 35 | 13.0 |
| Monoresistant TB | ||||||||||||||||||||||
| INH | 13 | 4.9 | 11 | 5.4 | 7 | 2.5 | 13 | 5.6 | 18 | 7.1 | 22 | 9.2 | 16 | 7.8 | 21 | 10.8 | 21 | 8.3 | 19 | 8.5 | 25 | 9.3 |
| RMP | 0 | 0.0 | 2 | 1.0 | 6 | 2.2 | 0 | 0.0 | 3 | 1.2 | 1 | 0.4 | 0 | 0.0 | 1 | 0.5 | 0 | 0.0 | 0 | 0.0 | 2 | 0.7 |
| EMB | 1 | 0.4 | 4 | 2.0 | 3 | 1.1 | 4 | 1.7 | 0 | 0.0 | 0 | 0.0 | 1 | 0.5 | 0 | 0.0 | 0 | 0.0 | 0 | 0.0 | 0 | 0.0 |
| PZA | 3 | 1.1 | 0 | 0.0 | 0 | 0.0 | 0 | 0.0 | 0 | 0.0 | 0 | 0.0 | 1 | 0.5 | 0 | 0.0 | 0 | 0.0 | 0 | 0.0 | 0 | 0.0 |
| Total | 17 | 6.5 | 17 | 8.3 | 16 | 5.8 | 17 | 7.4 | 21 | 8.3 | 23 | 9.6 | 18 | 8.8 | 22 | 11.3 | 21 | 8.3 | 19 | 8.5 | 27 | 10.0 |
| Polyresistant | ||||||||||||||||||||||
| RMP & PZA | 2 | 0.8 | 0 | 0.0 | 0 | 0.0 | 0 | 0.0 | 0 | 0.0 | 0 | 0.0 | 0 | 0.0 | 0 | 0.0 | 0 | 0.0 | 0 | 0.0 | 0 | 0.0 |
| INH & PZA | 4 | 1.5 | 0 | 0.0 | 0 | 0.0 | 0 | 0.0 | 0 | 0.0 | 0 | 0.0 | 0 | 0.0 | 1 | 0.5 | 0 | 0.0 | 0 | 0.0 | 2 | 0.7 |
| INH & EMB | 1 | 0.4 | 1 | 0.5 | 0 | 0.0 | 2 | 0.9 | 0 | 0.0 | 1 | 0.4 | 0 | 0.0 | 0 | 0.0 | 0 | 0.0 | 0 | 0.0 | 0 | 0.0 |
| Total | 7 | 2.7 | 1 | 0.5 | 0 | 0.0 | 2 | 0.9 | 0 | 0.0 | 1 | 0.4 | 0 | 0.0 | 1 | 0.5 | 0 | 0.0 | 0 | 0.0 | 2 | 0.7 |
| Multidrug-resistant TBTable 6 Footnote ‡ | ||||||||||||||||||||||
| INH & RMP | 0 | 0.0 | 0 | 0.0 | 1 | 0.4 | 0 | 0.0 | 0 | 0.0 | 0 | 0.0 | 0 | 0.0 | 0 | 0.0 | 0 | 0.0 | 0 | 0.0 | 0 | 0.0 |
| INH & RMP & EMB & PZA & ETH & RBT | 1 | 0.4 | 0 | 0.0 | 0 | 0.0 | 0 | 0.0 | 0 | 0.0 | 0 | 0.0 | 0 | 0.0 | 0 | 0.0 | 0 | 0.0 | 0 | 0.0 | 0 | 0.0 |
| INH & RMP & EMB & PZA & KM & CM & ETH & RBT | 0 | 0.0 | 0 | 0.0 | 0 | 0.0 | 1 | 0.4 | 0 | 0.0 | 0 | 0.0 | 0 | 0.0 | 0 | 0.0 | 0 | 0.0 | 0 | 0.0 | 0 | 0.0 |
| INH & RMP & EMB & PZA & PAS | 0 | 0.0 | 0 | 0.0 | 0 | 0.0 | 0 | 0.0 | 1 | 0.4 | 0 | 0.0 | 0 | 0.0 | 0 | 0.0 | 0 | 0.0 | 0 | 0.0 | 0 | 0.0 |
| INH & RMP & EMB & PZA & RBT | 0 | 0.0 | 0 | 0.0 | 0 | 0.0 | 0 | 0.0 | 1 | 0.4 | 0 | 0.0 | 0 | 0.0 | 0 | 0.0 | 0 | 0.0 | 0 | 0.0 | 0 | 0.0 |
| INH & RMP & EMB & PZA & SM & ETH & RBT & PAS | 0 | 0.0 | 0 | 0.0 | 1 | 0.4 | 0 | 0.0 | 0 | 0.0 | 0 | 0.0 | 0 | 0.0 | 0 | 0.0 | 0 | 0.0 | 0 | 0.0 | 0 | 0.0 |
| INH & RMP & EMB & PZA & SM & KM & RBT | 0 | 0.0 | 0 | 0.0 | 0 | 0.0 | 0 | 0.0 | 0 | 0.0 | 0 | 0.0 | 0 | 0.0 | 0 | 0.0 | 1 | 0.4 | 0 | 0.0 | 0 | 0.0 |
| INH & RMP & EMB & PZA & SM & OFL & ETH & RBT & PAS | 0 | 0.0 | 0 | 0.0 | 0 | 0.0 | 1 | 0.4 | 0 | 0.0 | 0 | 0.0 | 0 | 0.0 | 0 | 0.0 | 0 | 0.0 | 0 | 0.0 | 0 | 0.0 |
| INH & RMP & EMB & PZA & SM & RBT | 0 | 0.0 | 1 | 0.5 | 0 | 0.0 | 0 | 0.0 | 0 | 0.0 | 0 | 0.0 | 0 | 0.0 | 0 | 0.0 | 0 | 0.0 | 0 | 0.0 | 0 | 0.0 |
| INH & RMP & EMB & RBT | 1 | 0.4 | 0 | 0.0 | 0 | 0.0 | 0 | 0.0 | 0 | 0.0 | 0 | 0.0 | 0 | 0.0 | 0 | 0.0 | 0 | 0.0 | 0 | 0.0 | 0 | 0.0 |
| INH & RMP & EMB & SM & ETH & RBT | 0 | 0.0 | 1 | 0.5 | 0 | 0.0 | 0 | 0.0 | 0 | 0.0 | 0 | 0.0 | 0 | 0.0 | 0 | 0.0 | 0 | 0.0 | 0 | 0.0 | 1 | 0.4 |
| INH & RMP & EMB & SM & ETH & RBT & PAS | 0 | 0.0 | 1 | 0.5 | 0 | 0.0 | 0 | 0.0 | 0 | 0.0 | 0 | 0.0 | 0 | 0.0 | 0 | 0.0 | 0 | 0.0 | 0 | 0.0 | 0 | 0.0 |
| INH & RMP & ETH & RBT | 0 | 0.0 | 0 | 0.0 | 0 | 0.0 | 0 | 0.0 | 0 | 0.0 | 0 | 0.0 | 0 | 0.0 | 0 | 0.0 | 0 | 0.0 | 0 | 0.0 | 1 | 0.4 |
| INH & RMP & PZA & RBT | 0 | 0.0 | 0 | 0.0 | 0 | 0.0 | 0 | 0.0 | 0 | 0.0 | 0 | 0.0 | 0 | 0.0 | 0 | 0.0 | 0 | 0.0 | 0 | 0.0 | 1 | 0.4 |
| INH & RMP & PZA & SM & RBT | 0 | 0.0 | 1 | 0.5 | 0 | 0.0 | 0 | 0.0 | 0 | 0.0 | 0 | 0.0 | 1 | 0.5 | 0 | 0.0 | 1 | 0.4 | 0 | 0.0 | 0 | 0.0 |
| INH & RMP & PZA & SM & RBT & PAS | 0 | 0.0 | 0 | 0.0 | 0 | 0.0 | 0 | 0.0 | 0 | 0.0 | 0 | 0.0 | 0 | 0.0 | 1 | 0.5 | 0 | 0.0 | 0 | 0.0 | 0 | 0.0 |
| INH & RMP & RBT | 0 | 0.0 | 0 | 0.0 | 0 | 0.0 | 0 | 0.0 | 1 | 0.4 | 0 | 0.0 | 0 | 0.0 | 0 | 0.0 | 0 | 0.0 | 0 | 0.0 | 2 | 0.7 |
| INH & RMP & SM & RBT | 0 | 0.0 | 0 | 0.0 | 0 | 0.0 | 0 | 0.0 | 0 | 0.0 | 0 | 0.0 | 0 | 0.0 | 0 | 0.0 | 0 | 0.0 | 0 | 0.0 | 1 | 0.4 |
| Total | 2 | 0.8 | 4 | 2.0 | 2 | 0.7 | 2 | 0.9 | 3 | 1.2 | 0 | 0.0 | 1 | 0.5 | 1 | 0.5 | 2 | 0.8 | 0 | 0.0 | 6 | 2.2 |
Abbreviations: CM=capreomycin; EMB=ethambutol; ETH=ethionamide; INH=isoniazid; KM=kanamycin; MOX=moxifloxacin; OFL=ofloxacin; PAS=para-aminosalicylic acid; PZA=pyrazinamide; RBT=rifabutin; RMP=rifampin; SM=streptomycin.
|
||||||||||||||||||||||
| Reporting year | ||||||||||||||||||||||
|---|---|---|---|---|---|---|---|---|---|---|---|---|---|---|---|---|---|---|---|---|---|---|
| 2004 | 2005 | 2006 | 2007 | 2008 | 2009 | 2010 | 2011 | 2012 | 2013 | 2014 | ||||||||||||
| n | % | n | % | n | % | n | % | n | % | n | % | n | % | n | % | n | % | n | % | n | % | |
| Isolates tested for resistance to INH, RMP, EMB & PZATable 7 Footnote * | 122 | 100.0 | 94 | 100.0 | 119 | 100.0 | 84 | 100.0 | 116 | 100.0 | 106 | 100.0 | 113 | 100.0 | 97 | 100.0 | 123 | 100.0 | 148 | 100.0 | 125 | 100.0 |
| Isolates susceptible to all first-line TB drugs | 121 | 99.2 | 92 | 97.9 | 113 | 95.0 | 75 | 89.3 | 111 | 95.7 | 99 | 93.4 | 99 | 87.6 | 90 | 92.8 | 113 | 91.9 | 144 | 97.3 | 120 | 96.0 |
| Resistant to one or more first line drugs | 1 | 0.8 | 2 | 2.1 | 6 | 5.0 | 9 | 10.7 | 5 | 4.3 | 7 | 6.6 | 14 | 12.4 | 7 | 7.2 | 10 | 8.1 | 4 | 2.7 | 5 | 4.0 |
| Monoresistant TB | ||||||||||||||||||||||
| INH | 0 | 0.0 | 2 | 2.1 | 6 | 5.0 | 7 | 8.3 | 4 | 3.4 | 4 | 3.8 | 10 | 8.8 | 5 | 5.2 | 10 | 8.1 | 4 | 2.7 | 5 | 4.0 |
| RMP | 0 | 0.0 | 0 | 0.0 | 0 | 0.0 | 0 | 0.0 | 0 | 0.0 | 0 | 0.0 | 0 | 0.0 | 0 | 0.0 | 0 | 0.0 | 0 | 0.0 | 0 | 0.0 |
| EMB | 0 | 0.0 | 0 | 0.0 | 0 | 0.0 | 0 | 0.0 | 0 | 0.0 | 0 | 0.0 | 0 | 0.0 | 0 | 0.0 | 0 | 0.0 | 0 | 0.0 | 0 | 0.0 |
| PZA | 1 | 0.8 | 0 | 0.0 | 0 | 0.0 | 1 | 1.2 | 0 | 0.0 | 1 | 0.9 | 1 | 0.9 | 0 | 0.0 | 0 | 0.0 | 0 | 0.0 | 0 | 0.0 |
| Total | 1 | 0.8 | 2 | 2.1 | 6 | 5.0 | 8 | 9.5 | 4 | 3.4 | 5 | 4.7 | 11 | 9.7 | 5 | 5.2 | 10 | 8.1 | 4 | 2.7 | 5 | 4.0 |
| Polyresistant | ||||||||||||||||||||||
| INH & PZA | 0 | 0.0 | 0 | 0.0 | 0 | 0.0 | 0 | 0.0 | 0 | 0.0 | 1 | 0.9 | 1 | 0.9 | 0 | 0.0 | 0 | 0.0 | 0 | 0.0 | 0 | 0.0 |
| INH & EMB | 0 | 0.0 | 0 | 0.0 | 0 | 0.0 | 1 | 1.2 | 0 | 0.0 | 1 | 0.9 | 0 | 0.0 | 0 | 0.0 | 0 | 0.0 | 0 | 0.0 | 0 | 0.0 |
| Total | 0 | 0.0 | 0 | 0.0 | 0 | 0.0 | 1 | 1.2 | 0 | 0.0 | 2 | 1.9 | 1 | 0.9 | 0 | 0.0 | 0 | 0.0 | 0 | 0.0 | 0 | 0.0 |
| Multidrug-resistant TBTable 7 Footnote † | ||||||||||||||||||||||
| INH & RMP | 0 | 0.0 | 0 | 0.0 | 0 | 0.0 | 0 | 0.0 | 0 | 0.0 | 0 | 0.0 | 1 | 0.9 | 0 | 0.0 | 0 | 0.0 | 0 | 0.0 | 0 | 0.0 |
| INH & RMP & EMB & PZA & SM & AK & KM & CM & ETH & PAS | 0 | 0.0 | 0 | 0.0 | 0 | 0.0 | 0 | 0.0 | 0 | 0.0 | 0 | 0.0 | 0 | 0.0 | 1 | 1.0 | 0 | 0.0 | 0 | 0.0 | 0 | 0.0 |
| INH & RMP & PZA & SM & RBT | 0 | 0.0 | 0 | 0.0 | 0 | 0.0 | 0 | 0.0 | 1 | 0.9 | 0 | 0.0 | 0 | 0.0 | 0 | 0.0 | 0 | 0.0 | 0 | 0.0 | 0 | 0.0 |
| INH & RMP & RBT | 0 | 0.0 | 0 | 0.0 | 0 | 0.0 | 0 | 0.0 | 0 | 0.0 | 0 | 0.0 | 0 | 0.0 | 1 | 1.0 | 0 | 0.0 | 0 | 0.0 | 0 | 0.0 |
| Total | 0 | 0.0 | 0 | 0.0 | 0 | 0.0 | 0 | 0.0 | 1 | 0.9 | 0 | 0.0 | 1 | 0.9 | 2 | 2.1 | 0 | 0.0 | 0 | 0.0 | 0 | 0.0 |
| Extensively drug-resistant‡ | ||||||||||||||||||||||
| INH & RMP & EMB & PZA & KM & OFL & ETH & RBT | 0 | 0.0 | 0 | 0.0 | 0 | 0.0 | 0 | 0.0 | 0 | 0.0 | 0 | 0.0 | 1 | 0.9 | 0 | 0.0 | 0 | 0.0 | 0 | 0.0 | 0 | 0.0 |
| Total | 0 | 0.0 | 0 | 0.0 | 0 | 0.0 | 0 | 0.0 | 0 | 0.0 | 0 | 0.0 | 1 | 0.9 | 0 | 0.0 | 0 | 0.0 | 0 | 0.0 | 0 | 0.0 |
Abbreviations: CM=capreomycin; EMB=ethambutol; ETH=ethionamide; INH=isoniazid; KM=kanamycin; MOX=moxifloxacin; OFL=ofloxacin; PAS=para-aminosalicylic acid; PZA=pyrazinamide; RBT=rifabutin; RMP=rifampin; SM=streptomycin.
|
||||||||||||||||||||||
| Reporting year | ||||||||||||||||||||||
|---|---|---|---|---|---|---|---|---|---|---|---|---|---|---|---|---|---|---|---|---|---|---|
| 2004 | 2005 | 2006 | 2007 | 2008 | 2009 | 2010 | 2011 | 2012 | 2013 | 2014 | ||||||||||||
| n | % | n | % | n | % | n | % | n | % | n | % | n | % | n | % | n | % | n | % | n | % | |
| Isolates tested for resistance to INH, RMP, EMB & PZATable 8 Footnote * | 11 | 100.0 | 5 | 100.0 | 3 | 100.0 | 5 | 100.0 | 3 | 100.0 | 10 | 100.0 | 9 | 100.0 | 5 | 100.0 | 4 | 100.0 | 3 | 100.0 | 6 | 100.0 |
| Isolates susceptible to all first-line TB drugs | 10 | 90.9 | 4 | 80.0 | 3 | 100.0 | 5 | 100.0 | 3 | 100.0 | 10 | 100.0 | 7 | 77.8 | 5 | 100.0 | 3 | 75.0 | 2 | 66.7 | 6 | 100.0 |
| Resistant to one or more first line drugs | 1 | 9.1 | 1 | 20.0 | 0 | 0.0 | 0 | 0.0 | 0 | 0.0 | 0 | 0.0 | 2 | 22.2 | 0 | 0.0 | 1 | 25.0 | 1 | 33.3 | 0 | 0.0 |
| Monoresistant TB | ||||||||||||||||||||||
| INH | 0 | 0.0 | 0 | 0.0 | 0 | 0.0 | 0 | 0.0 | 0 | 0.0 | 0 | 0.0 | 2 | 22.2 | 0 | 0.0 | 0 | 0.0 | 1 | 33.3 | 0 | 0.0 |
| RMP | 0 | 0.0 | 0 | 0.0 | 0 | 0.0 | 0 | 0.0 | 0 | 0.0 | 0 | 0.0 | 0 | 0.0 | 0 | 0.0 | 0 | 0.0 | 0 | 0.0 | 0 | 0.0 |
| EMB | 0 | 0.0 | 0 | 0.0 | 0 | 0.0 | 0 | 0.0 | 0 | 0.0 | 0 | 0.0 | 0 | 0.0 | 0 | 0.0 | 0 | 0.0 | 0 | 0.0 | 0 | 0.0 |
| PZA | 1 | 9.1 | 1 | 20.0 | 0 | 0.0 | 0 | 0.0 | 0 | 0.0 | 0 | 0.0 | 0 | 0.0 | 0 | 0.0 | 1 | 25.0 | 0 | 0.0 | 0 | 0.0 |
| Total | 1 | 9.1 | 1 | 20.0 | 0 | 0.0 | 0 | 0.0 | 0 | 0.0 | 0 | 0.0 | 2 | 22.2 | 0 | 0.0 | 1 | 25.0 | 1 | 33.3 | 0 | 0.0 |
Abbreviations: EMB=ethambutol; INH=isoniazid; PZA=pyrazinamide; RMP=rifampin.
|
||||||||||||||||||||||
| Reporting year | ||||||||||||||||||||||
|---|---|---|---|---|---|---|---|---|---|---|---|---|---|---|---|---|---|---|---|---|---|---|
| 2004 | 2005 | 2006 | 2007 | 2008 | 2009 | 2010 | 2011 | 2012 | 2013 | 2014 | ||||||||||||
| n | % | n | % | n | % | n | % | n | % | n | % | n | % | n | % | n | % | n | % | n | % | |
| Isolates tested for resistance to INH, RMP, EMB & PZA | 8 | 100.0 | 6 | 100.0 | 11 | 100.0 | 5 | 100.0 | 5 | 100.0 | 10 | 100.0 | 9 | 100.0 | 5 | 100.0 | 5 | 100.0 | 11 | 100.0 | 6 | 100.0 |
| Isolates susceptible to all first-line TB drugs | 8 | 100.0 | 5 | 83.3 | 11 | 100.0 | 5 | 100.0 | 5 | 100.0 | 10 | 100.0 | 9 | 100.0 | 5 | 100.0 | 5 | 100.0 | 11 | 100.0 | 6 | 100.0 |
| Resistant to one or more first line drugs | 0 | 0.0 | 1 | 16.7 | 0 | 0.0 | 0 | 0.0 | 0 | 0.0 | 0 | 0.0 | 0 | 0.0 | 0 | 0.0 | 0 | 0.0 | 0 | 0.0 | 0 | 0.0 |
| Monoresistant TB | ||||||||||||||||||||||
| INH | 0 | 0.0 | 1 | 16.7 | 0 | 0.0 | 0 | 0.0 | 0 | 0.0 | 0 | 0.0 | 0 | 0.0 | 0 | 0.0 | 0 | 0.0 | 0 | 0.0 | 0 | 0.0 |
| RMP | 0 | 0.0 | 0 | 0.0 | 0 | 0.0 | 0 | 0.0 | 0 | 0.0 | 0 | 0.0 | 0 | 0.0 | 0 | 0.0 | 0 | 0.0 | 0 | 0.0 | 0 | 0.0 |
| EMB | 0 | 0.0 | 0 | 0.0 | 0 | 0.0 | 0 | 0.0 | 0 | 0.0 | 0 | 0.0 | 0 | 0.0 | 0 | 0.0 | 0 | 0.0 | 0 | 0.0 | 0 | 0.0 |
| PZA | 0 | 0.0 | 0 | 0.0 | 0 | 0.0 | 0 | 0.0 | 0 | 0.0 | 0 | 0.0 | 0 | 0.0 | 0 | 0.0 | 0 | 0.0 | 0 | 0.0 | 0 | 0.0 |
| Total | 0 | 0.0 | 1 | 16.7 | 0 | 0.0 | 0 | 0.0 | 0 | 0.0 | 0 | 0.0 | 0 | 0.0 | 0 | 0.0 | 0 | 0.0 | 0 | 0.0 | 0 | 0.0 |
Abbreviations: EMB=ethambutol; INH=isoniazid; PZA=pyrazinamide; RMP=rifampin. |
||||||||||||||||||||||
| Reporting year | ||||||||||||||||||||||
|---|---|---|---|---|---|---|---|---|---|---|---|---|---|---|---|---|---|---|---|---|---|---|
| 2004 | 2005 | 2006 | 2007 | 2008 | 2009 | 2010 | 2011 | 2012 | 2013 | 2014 | ||||||||||||
| n | % | n | % | n | % | n | % | n | % | n | % | n | % | n | % | n | % | n | % | n | % | |
| Isolates tested for resistance to INH, RMP, EMB & PZA | 9 | 100.0 | 6 | 100.0 | 4 | 100.0 | 14 | 100.0 | 13 | 100.0 | 10 | 100.0 | 5 | 100.0 | 8 | 100.0 | 6 | 100.0 | 3 | 100.0 | 2 | 100.0 |
| Isolates susceptible to all first-line TB drugs | 9 | 100.0 | 6 | 100.0 | 3 | 75.0 | 14 | 100.0 | 13 | 100.0 | 9 | 90.0 | 4 | 80.0 | 8 | 100.0 | 6 | 100.0 | 3 | 100.0 | 2 | 100.0 |
| Resistant to one or more first line drugs | 0 | 0.0 | 0 | 0.0 | 1 | 25.0 | 0 | 0.0 | 0 | 0.0 | 1 | 10.0 | 1 | 20.0 | 0 | 0.0 | 0 | 0.0 | 0 | 0.0 | 0 | 0.0 |
| Monoresistant TB | ||||||||||||||||||||||
| INH | 0 | 0.0 | 0 | 0.0 | 1 | 25.0 | 0 | 0.0 | 0 | 0.0 | 0 | 0.0 | 1 | 20.0 | 0 | 0.0 | 0 | 0.0 | 0 | 0.0 | 0 | 0.0 |
| RMP | 0 | 0.0 | 0 | 0.0 | 0 | 0.0 | 0 | 0.0 | 0 | 0.0 | 1 | 10.0 | 0 | 0.0 | 0 | 0.0 | 0 | 0.0 | 0 | 0.0 | 0 | 0.0 |
| EMB | 0 | 0.0 | 0 | 0.0 | 0 | 0.0 | 0 | 0.0 | 0 | 0.0 | 0 | 0.0 | 0 | 0.0 | 0 | 0.0 | 0 | 0.0 | 0 | 0.0 | 0 | 0.0 |
| PZA | 0 | 0.0 | 0 | 0.0 | 0 | 0.0 | 0 | 0.0 | 0 | 0.0 | 0 | 0.0 | 0 | 0.0 | 0 | 0.0 | 0 | 0.0 | 0 | 0.0 | 0 | 0.0 |
| Total | 0 | 0.0 | 0 | 0.0 | 1 | 25.0 | 0 | 0.0 | 0 | 0.0 | 1 | 10.0 | 1 | 20.0 | 0 | 0.0 | 0 | 0.0 | 0 | 0.0 | 0 | 0.0 |
Abbreviations: EMB=ethambutol; INH=isoniazid; PZA=pyrazinamide; RMP=rifampin. |
||||||||||||||||||||||
| Reporting year | ||||||||||||||||||||||
|---|---|---|---|---|---|---|---|---|---|---|---|---|---|---|---|---|---|---|---|---|---|---|
| 2004 | 2005 | 2006 | 2007 | 2008 | 2009 | 2010 | 2011 | 2012 | 2013 | 2014 | ||||||||||||
| n | % | n | % | n | % | n | % | n | % | n | % | n | % | n | % | n | % | n | % | n | % | |
| Isolates tested for resistance to INH, RMP, EMB & PZATable 11 Footnote * | 9 | 100.0 | 7 | 100.0 | 8 | 100.0 | 5 | 100.0 | 3 | 100.0 | 7 | 100.0 | 8 | 100.0 | 7 | 100.0 | 9 | 100.0 | 9 | 100.0 | 8 | 100.0 |
| Isolates susceptible to all first-line TB drugs | 9 | 100.0 | 6 | 85.7 | 8 | 100.0 | 5 | 100.0 | 3 | 100.0 | 7 | 100.0 | 5 | 62.5 | 7 | 100.0 | 9 | 100.0 | 8 | 88.9 | 5 | 62.5 |
| Resistant to one or more first line drugs | 0 | 0.0 | 1 | 14.3 | 0 | 0.0 | 0 | 0.0 | 0 | 0.0 | 0 | 0.0 | 3 | 37.5 | 0 | 0.0 | 0 | 0.0 | 1 | 11.1 | 3 | 37.5 |
| Monoresistant TB | ||||||||||||||||||||||
| INH | 0 | 0.0 | 0 | 0.0 | 0 | 0.0 | 0 | 0.0 | 0 | 0.0 | 0 | 0.0 | 1 | 12.5 | 0 | 0.0 | 0 | 0.0 | 1 | 11.1 | 3 | 37.5 |
| RMP | 0 | 0.0 | 0 | 0.0 | 0 | 0.0 | 0 | 0.0 | 0 | 0.0 | 0 | 0.0 | 0 | 0.0 | 0 | 0.0 | 0 | 0.0 | 0 | 0.0 | 0 | 0.0 |
| EMB | 0 | 0.0 | 0 | 0.0 | 0 | 0.0 | 0 | 0.0 | 0 | 0.0 | 0 | 0.0 | 0 | 0.0 | 0 | 0.0 | 0 | 0.0 | 0 | 0.0 | 0 | 0.0 |
| PZA | 0 | 0.0 | 1 | 14.3 | 0 | 0.0 | 0 | 0.0 | 0 | 0.0 | 0 | 0.0 | 1 | 12.5 | 0 | 0.0 | 0 | 0.0 | 0 | 0.0 | 0 | 0.0 |
| Total | 0 | 0.0 | 1 | 14.3 | 0 | 0.0 | 0 | 0.0 | 0 | 0.0 | 0 | 0.0 | 2 | 25.0 | 0 | 0.0 | 0 | 0.0 | 1 | 11.1 | 3 | 37.5 |
| Polyresistant | ||||||||||||||||||||||
| INH & PZA | 0 | 0.0 | 0 | 0.0 | 0 | 0.0 | 0 | 0.0 | 0 | 0.0 | 0 | 0.0 | 1 | 12.5 | 0 | 0.0 | 0 | 0.0 | 0 | 0.0 | 0 | 0.0 |
| Total | 0 | 0.0 | 0 | 0.0 | 0 | 0.0 | 0 | 0.0 | 0 | 0.0 | 0 | 0.0 | 1 | 12.5 | 0 | 0.0 | 0 | 0.0 | 0 | 0.0 | 0 | 0.0 |
Abbreviations: EMB=ethambutol; INH=isoniazid; PZA=pyrazinamide; RMP=rifampin.
|
||||||||||||||||||||||
| Reporting year | ||||||||||||||||||||||
|---|---|---|---|---|---|---|---|---|---|---|---|---|---|---|---|---|---|---|---|---|---|---|
| 2004 | 2005 | 2006 | 2007 | 2008 | 2009 | 2010 | 2011 | 2012 | 2013 | 2014 | ||||||||||||
| n | % | n | % | n | % | n | % | n | % | n | % | n | % | n | % | n | % | n | % | n | % | |
| Isolates tested for resistance to INH, RMP, EMB & PZA | 16 | 100.0 | 28 | 100.0 | 37 | 100.0 | 25 | 100.0 | 51 | 100.0 | 50 | 100.0 | 71 | 100.0 | 64 | 100.0 | 65 | 100.0 | 42 | 100.0 | 66 | 100.0 |
| Isolates susceptible to all first-line TB drugs | 16 | 100.0 | 28 | 100.0 | 37 | 100.0 | 24 | 96.0 | 51 | 100.0 | 49 | 98.0 | 70 | 98.6 | 62 | 96.9 | 65 | 100.0 | 42 | 100.0 | 66 | 100.0 |
| Resistant to one or more first line drugs | 0 | 0.0 | 0 | 0.0 | 0 | 0.0 | 1 | 4.0 | 0 | 0.0 | 1 | 2.0 | 1 | 1.4 | 2 | 3.1 | 0 | 0.0 | 0 | 0.0 | 0 | 0.0 |
| Monoresistant TB | ||||||||||||||||||||||
| INH | 0 | 0.0 | 0 | 0.0 | 0 | 0.0 | 1 | 4.0 | 0 | 0.0 | 1 | 2.0 | 1 | 1.4 | 1 | 1.6 | 0 | 0.0 | 0 | 0.0 | 0 | 0.0 |
| RMP | 0 | 0.0 | 0 | 0.0 | 0 | 0.0 | 0 | 0.0 | 0 | 0.0 | 0 | 0.0 | 0 | 0.0 | 1 | 1.6 | 0 | 0.0 | 0 | 0.0 | 0 | 0.0 |
| EMB | 0 | 0.0 | 0 | 0.0 | 0 | 0.0 | 0 | 0.0 | 0 | 0.0 | 0 | 0.0 | 0 | 0.0 | 0 | 0.0 | 0 | 0.0 | 0 | 0.0 | 0 | 0.0 |
| PZA | 0 | 0.0 | 0 | 0.0 | 0 | 0.0 | 0 | 0.0 | 0 | 0.0 | 0 | 0.0 | 0 | 0.0 | 0 | 0.0 | 0 | 0.0 | 0 | 0.0 | 0 | 0.0 |
| Total | 0 | 0.0 | 0 | 0.0 | 0 | 0.0 | 1 | 4.0 | 0 | 0.0 | 1 | 2.0 | 1 | 1.4 | 2 | 3.1 | 0 | 0.0 | 0 | 0.0 | 0 | 0.0 |
Abbreviations: EMB=ethambutol; INH=isoniazid; PZA=pyrazinamide; RMP=rifampin. |
||||||||||||||||||||||
| Reporting year | ||||||||||||||||||||||
|---|---|---|---|---|---|---|---|---|---|---|---|---|---|---|---|---|---|---|---|---|---|---|
| 2004 | 2005 | 2006 | 2007 | 2008 | 2009 | 2010 | 2011 | 2012 | 2013 | 2014 | ||||||||||||
| n | % | n | % | n | % | n | % | n | % | n | % | n | % | n | % | n | % | n | % | n | % | |
| Isolates tested for resistance to INH, RMP, EMB & PZATable 13 Footnote * | 599 | 100.0 | 553 | 100.0 | 567 | 100.0 | 538 | 100.0 | 479 | 100.0 | 488 | 100.0 | 496 | 100.0 | 507 | 100.0 | 493 | 100.0 | 511 | 100.0 | 457 | 100.0 |
| Isolates susceptible to all first-line TB drugs | 539 | 90.0 | 487 | 88.1 | 504 | 88.9 | 466 | 86.6 | 427 | 89.1 | 428 | 87.7 | 456 | 91.9 | 454 | 89.5 | 429 | 87.0 | 458 | 89.6 | 407 | 89.1 |
| Resistant to one or more first line drugs | 60 | 10.0 | 66 | 11.9 | 63 | 11.1 | 72 | 13.4 | 52 | 10.9 | 60 | 12.3 | 40 | 8.1 | 53 | 10.5 | 64 | 13.0 | 53 | 10.4 | 50 | 10.9 |
| Monoresistant TB | ||||||||||||||||||||||
| INH | 46 | 7.7 | 44 | 8.0 | 39 | 6.9 | 50 | 9.3 | 33 | 6.9 | 39 | 8.0 | 27 | 5.4 | 39 | 7.7 | 45 | 9.1 | 27 | 5.3 | 30 | 6.6 |
| RMP | 0 | 0.0 | 0 | 0.0 | 1 | 0.2 | 1 | 0.2 | 0 | 0.0 | 0 | 0.0 | 0 | 0.0 | 0 | 0.0 | 1 | 0.2 | 2 | 0.4 | 1 | 0.2 |
| EMB | 0 | 0.0 | 0 | 0.0 | 0 | 0.0 | 1 | 0.2 | 1 | 0.2 | 1 | 0.2 | 0 | 0.0 | 0 | 0.0 | 1 | 0.2 | 0 | 0.0 | 0 | 0.0 |
| PZA | 3 | 0.5 | 7 | 1.3 | 9 | 1.6 | 9 | 1.7 | 6 | 1.3 | 4 | 0.8 | 2 | 0.4 | 6 | 1.2 | 10 | 2.0 | 8 | 1.6 | 11 | 2.4 |
| Total | 49 | 8.2 | 51 | 9.2 | 49 | 8.6 | 61 | 11.3 | 40 | 8.4 | 44 | 9.0 | 29 | 5.8 | 45 | 8.9 | 57 | 11.6 | 37 | 7.2 | 42 | 9.2 |
| Polyresistant | ||||||||||||||||||||||
| EMB & PZA | 0 | 0.0 | 0 | 0.0 | 0 | 0.0 | 1 | 0.2 | 0 | 0.0 | 0 | 0.0 | 0 | 0.0 | 0 | 0.0 | 0 | 0.0 | 0 | 0.0 | 0 | 0.0 |
| INH & EMB | 3 | 0.5 | 2 | 0.4 | 3 | 0.5 | 1 | 0.2 | 2 | 0.4 | 3 | 0.6 | 0 | 0.0 | 0 | 0.0 | 0 | 0.0 | 1 | 0.2 | 0 | 0.0 |
| INH & PZA | 1 | 0.2 | 0 | 0.0 | 0 | 0.0 | 2 | 0.4 | 0 | 0.0 | 0 | 0.0 | 1 | 0.2 | 0 | 0.0 | 1 | 0.2 | 2 | 0.4 | 1 | 0.2 |
| INH & EMB & PZA | 0 | 0.0 | 0 | 0.0 | 0 | 0.0 | 0 | 0.0 | 2 | 0.4 | 2 | 0.4 | 0 | 0.0 | 0 | 0.0 | 0 | 0.0 | 0 | 0.0 | 0 | 0.0 |
| Total | 4 | 0.7 | 2 | 0.4 | 3 | 0.5 | 4 | 0.7 | 4 | 0.8 | 5 | 1.0 | 1 | 0.2 | 0 | 0.0 | 1 | 0.2 | 3 | 0.6 | 1 | 0.2 |
| Multidrug-resistant TBTable 13 Footnote † | ||||||||||||||||||||||
| INH & RMP | 1 | 0.2 | 0 | 0.0 | 2 | 0.4 | 0 | 0.0 | 0 | 0.0 | 1 | 0.2 | 0 | 0.0 | 0 | 0.0 | 0 | 0.0 | 0 | 0.0 | 0 | 0.0 |
| INH & RMP & AK & CM & RBT | 0 | 0.0 | 0 | 0.0 | 1 | 0.2 | 0 | 0.0 | 0 | 0.0 | 0 | 0.0 | 0 | 0.0 | 0 | 0.0 | 0 | 0.0 | 0 | 0.0 | 0 | 0.0 |
| INH & RMP & CM & ETH & RBT | 1 | 0.2 | 0 | 0.0 | 0 | 0.0 | 0 | 0.0 | 0 | 0.0 | 0 | 0.0 | 0 | 0.0 | 0 | 0.0 | 0 | 0.0 | 0 | 0.0 | 0 | 0.0 |
| INH & RMP & CM & RBT | 0 | 0.0 | 0 | 0.0 | 1 | 0.2 | 0 | 0.0 | 0 | 0.0 | 0 | 0.0 | 0 | 0.0 | 0 | 0.0 | 0 | 0.0 | 0 | 0.0 | 0 | 0.0 |
| INH & RMP & EMB & ETH & RBT | 0 | 0.0 | 0 | 0.0 | 0 | 0.0 | 0 | 0.0 | 0 | 0.0 | 0 | 0.0 | 0 | 0.0 | 0 | 0.0 | 0 | 0.0 | 1 | 0.2 | 0 | 0.0 |
| INH & RMP & EMB & PZA & AK & CM & ETH & RBT | 0 | 0.0 | 0 | 0.0 | 0 | 0.0 | 1 | 0.2 | 0 | 0.0 | 0 | 0.0 | 0 | 0.0 | 0 | 0.0 | 0 | 0.0 | 0 | 0.0 | 0 | 0.0 |
| INH & RMP & EMB & PZA & CM & RBT | 0 | 0.0 | 0 | 0.0 | 0 | 0.0 | 0 | 0.0 | 0 | 0.0 | 0 | 0.0 | 0 | 0.0 | 0 | 0.0 | 1 | 0.2 | 0 | 0.0 | 0 | 0.0 |
| INH & RMP & EMB & PZA & ETH & RBT | 0 | 0.0 | 0 | 0.0 | 0 | 0.0 | 2 | 0.4 | 0 | 0.0 | 0 | 0.0 | 0 | 0.0 | 0 | 0.0 | 0 | 0.0 | 0 | 0.0 | 0 | 0.0 |
| INH & RMP & EMB & PZA & RBT | 0 | 0.0 | 0 | 0.0 | 0 | 0.0 | 1 | 0.2 | 0 | 0.0 | 0 | 0.0 | 0 | 0.0 | 0 | 0.0 | 0 | 0.0 | 0 | 0.0 | 1 | 0.2 |
| INH & RMP & EMB & PZA & RBT & PAS | 0 | 0.0 | 0 | 0.0 | 0 | 0.0 | 0 | 0.0 | 0 | 0.0 | 0 | 0.0 | 0 | 0.0 | 1 | 0.2 | 0 | 0.0 | 0 | 0.0 | 0 | 0.0 |
| INH & RMP & EMB & PZA & SM | 0 | 0.0 | 1 | 0.2 | 0 | 0.0 | 0 | 0.0 | 0 | 0.0 | 0 | 0.0 | 0 | 0.0 | 1 | 0.2 | 0 | 0.0 | 0 | 0.0 | 0 | 0.0 |
| INH & RMP & EMB & PZA & SM & ETH & RBT | 0 | 0.0 | 1 | 0.2 | 0 | 0.0 | 0 | 0.0 | 0 | 0.0 | 0 | 0.0 | 1 | 0.2 | 1 | 0.2 | 0 | 0.0 | 1 | 0.2 | 0 | 0.0 |
| INH & RMP & EMB & PZA & SM & ETH & RBT & PAS | 0 | 0.0 | 0 | 0.0 | 0 | 0.0 | 0 | 0.0 | 0 | 0.0 | 0 | 0.0 | 1 | 0.2 | 0 | 0.0 | 0 | 0.0 | 0 | 0.0 | 0 | 0.0 |
| INH & RMP & EMB & PZA & SM & OFL & ETH & RBT | 1 | 0.2 | 0 | 0.0 | 0 | 0.0 | 0 | 0.0 | 0 | 0.0 | 0 | 0.0 | 0 | 0.0 | 0 | 0.0 | 0 | 0.0 | 0 | 0.0 | 0 | 0.0 |
| INH & RMP & EMB & PZA & SM & OFL & MOX & ETH & RBT | 0 | 0.0 | 0 | 0.0 | 0 | 0.0 | 0 | 0.0 | 0 | 0.0 | 0 | 0.0 | 0 | 0.0 | 0 | 0.0 | 0 | 0.0 | 1 | 0.2 | 0 | 0.0 |
| INH & RMP & EMB & PZA & SM & OFL & RBT | 0 | 0.0 | 1 | 0.2 | 0 | 0.0 | 0 | 0.0 | 0 | 0.0 | 0 | 0.0 | 0 | 0.0 | 0 | 0.0 | 0 | 0.0 | 0 | 0.0 | 0 | 0.0 |
| INH & RMP & EMB & PZA & SM & RBT | 0 | 0.0 | 0 | 0.0 | 0 | 0.0 | 1 | 0.2 | 1 | 0.2 | 1 | 0.2 | 0 | 0.0 | 1 | 0.2 | 0 | 0.0 | 1 | 0.2 | 0 | 0.0 |
| INH & RMP & EMB & RBT | 0 | 0.0 | 0 | 0.0 | 2 | 0.4 | 1 | 0.2 | 1 | 0.2 | 2 | 0.4 | 0 | 0.0 | 0 | 0.0 | 0 | 0.0 | 0 | 0.0 | 0 | 0.0 |
| INH & RMP & EMB & SM & AK & CM | 0 | 0.0 | 0 | 0.0 | 0 | 0.0 | 0 | 0.0 | 0 | 0.0 | 0 | 0.0 | 1 | 0.2 | 0 | 0.0 | 0 | 0.0 | 0 | 0.0 | 0 | 0.0 |
| INH & RMP & EMB & SM & ETH & RBT | 0 | 0.0 | 1 | 0.2 | 0 | 0.0 | 0 | 0.0 | 0 | 0.0 | 1 | 0.2 | 0 | 0.0 | 0 | 0.0 | 0 | 0.0 | 0 | 0.0 | 0 | 0.0 |
| INH & RMP & EMB & SM & ETH & RBT & PAS | 0 | 0.0 | 0 | 0.0 | 0 | 0.0 | 0 | 0.0 | 0 | 0.0 | 0 | 0.0 | 0 | 0.0 | 0 | 0.0 | 0 | 0.0 | 1 | 0.2 | 0 | 0.0 |
| INH & RMP & EMB & SM & KM & RBT & PAS | 0 | 0.0 | 0 | 0.0 | 0 | 0.0 | 0 | 0.0 | 0 | 0.0 | 0 | 0.0 | 1 | 0.2 | 0 | 0.0 | 0 | 0.0 | 0 | 0.0 | 0 | 0.0 |
| INH & RMP & EMB & SM & OFL & ETH & RBT | 0 | 0.0 | 0 | 0.0 | 0 | 0.0 | 0 | 0.0 | 0 | 0.0 | 1 | 0.2 | 1 | 0.2 | 0 | 0.0 | 0 | 0.0 | 0 | 0.0 | 0 | 0.0 |
| INH & RMP & EMB & SM & OFL & MOX & ETH & RBT | 0 | 0.0 | 0 | 0.0 | 0 | 0.0 | 0 | 0.0 | 0 | 0.0 | 0 | 0.0 | 0 | 0.0 | 1 | 0.2 | 0 | 0.0 | 0 | 0.0 | 0 | 0.0 |
| INH & RMP & EMB & SM & OFL & RBT | 0 | 0.0 | 1 | 0.2 | 0 | 0.0 | 0 | 0.0 | 0 | 0.0 | 0 | 0.0 | 0 | 0.0 | 0 | 0.0 | 0 | 0.0 | 0 | 0.0 | 0 | 0.0 |
| INH & RMP & EMB & SM & RBT | 0 | 0.0 | 2 | 0.4 | 0 | 0.0 | 0 | 0.0 | 0 | 0.0 | 0 | 0.0 | 0 | 0.0 | 0 | 0.0 | 0 | 0.0 | 1 | 0.2 | 1 | 0.2 |
| INH & RMP & ETH & RBT | 0 | 0.0 | 0 | 0.0 | 1 | 0.2 | 0 | 0.0 | 1 | 0.2 | 1 | 0.2 | 0 | 0.0 | 0 | 0.0 | 0 | 0.0 | 1 | 0.2 | 0 | 0.0 |
| INH & RMP & ETH & RBT & PAS | 0 | 0.0 | 0 | 0.0 | 0 | 0.0 | 0 | 0.0 | 0 | 0.0 | 0 | 0.0 | 1 | 0.2 | 0 | 0.0 | 0 | 0.0 | 0 | 0.0 | 0 | 0.0 |
| INH & RMP & OFL & ETH & RBT | 2 | 0.3 | 0 | 0.0 | 0 | 0.0 | 0 | 0.0 | 0 | 0.0 | 0 | 0.0 | 0 | 0.0 | 0 | 0.0 | 0 | 0.0 | 0 | 0.0 | 0 | 0.0 |
| INH & RMP & OFL & ETH & RBT & PAS | 0 | 0.0 | 0 | 0.0 | 1 | 0.2 | 0 | 0.0 | 0 | 0.0 | 0 | 0.0 | 0 | 0.0 | 0 | 0.0 | 0 | 0.0 | 0 | 0.0 | 0 | 0.0 |
| INH & RMP & PZA & ETH & RBT | 0 | 0.0 | 1 | 0.2 | 1 | 0.2 | 0 | 0.0 | 0 | 0.0 | 0 | 0.0 | 0 | 0.0 | 0 | 0.0 | 0 | 0.0 | 0 | 0.0 | 0 | 0.0 |
| INH & RMP & PZA & RBT | 1 | 0.2 | 0 | 0.0 | 0 | 0.0 | 0 | 0.0 | 0 | 0.0 | 0 | 0.0 | 0 | 0.0 | 0 | 0.0 | 0 | 0.0 | 0 | 0.0 | 0 | 0.0 |
| INH & RMP & PZA & SM | 1 | 0.2 | 0 | 0.0 | 0 | 0.0 | 0 | 0.0 | 0 | 0.0 | 0 | 0.0 | 0 | 0.0 | 0 | 0.0 | 0 | 0.0 | 0 | 0.0 | 0 | 0.0 |
| INH & RMP & PZA & SM & ETH & RBT | 0 | 0.0 | 0 | 0.0 | 0 | 0.0 | 1 | 0.2 | 1 | 0.2 | 1 | 0.2 | 1 | 0.2 | 0 | 0.0 | 0 | 0.0 | 0 | 0.0 | 0 | 0.0 |
| INH & RMP & PZA & SM & OFL & MOX & RBT | 0 | 0.0 | 0 | 0.0 | 0 | 0.0 | 0 | 0.0 | 0 | 0.0 | 0 | 0.0 | 0 | 0.0 | 0 | 0.0 | 1 | 0.2 | 0 | 0.0 | 0 | 0.0 |
| INH & RMP & PZA & SM & RBT | 0 | 0.0 | 0 | 0.0 | 0 | 0.0 | 0 | 0.0 | 0 | 0.0 | 0 | 0.0 | 0 | 0.0 | 1 | 0.2 | 0 | 0.0 | 1 | 0.2 | 1 | 0.2 |
| INH & RMP & RBT | 0 | 0.0 | 3 | 0.5 | 1 | 0.2 | 0 | 0.0 | 0 | 0.0 | 0 | 0.0 | 1 | 0.2 | 0 | 0.0 | 0 | 0.0 | 2 | 0.4 | 0 | 0.0 |
| INH & RMP & SM | 0 | 0.0 | 0 | 0.0 | 0 | 0.0 | 0 | 0.0 | 0 | 0.0 | 0 | 0.0 | 0 | 0.0 | 0 | 0.0 | 1 | 0.2 | 1 | 0.2 | 0 | 0.0 |
| INH & RMP & SM & CM & RBT | 0 | 0.0 | 0 | 0.0 | 0 | 0.0 | 0 | 0.0 | 0 | 0.0 | 0 | 0.0 | 0 | 0.0 | 0 | 0.0 | 0 | 0.0 | 0 | 0.0 | 1 | 0.2 |
| INH & RMP & SM & ETH & RBT | 0 | 0.0 | 0 | 0.0 | 0 | 0.0 | 0 | 0.0 | 0 | 0.0 | 1 | 0.2 | 0 | 0.0 | 0 | 0.0 | 0 | 0.0 | 0 | 0.0 | 0 | 0.0 |
| INH & RMP & SM & ETH & RBT & PAS | 0 | 0.0 | 0 | 0.0 | 0 | 0.0 | 0 | 0.0 | 0 | 0.0 | 0 | 0.0 | 0 | 0.0 | 0 | 0.0 | 0 | 0.0 | 0 | 0.0 | 1 | 0.2 |
| INH & RMP & SM & KM & ETH & RBT | 0 | 0.0 | 0 | 0.0 | 0 | 0.0 | 0 | 0.0 | 0 | 0.0 | 0 | 0.0 | 0 | 0.0 | 0 | 0.0 | 1 | 0.2 | 0 | 0.0 | 0 | 0.0 |
| INH & RMP & SM & OFL & ETH & RBT | 0 | 0.0 | 0 | 0.0 | 0 | 0.0 | 0 | 0.0 | 0 | 0.0 | 1 | 0.2 | 1 | 0.2 | 0 | 0.0 | 0 | 0.0 | 0 | 0.0 | 0 | 0.0 |
| INH & RMP & SM & RBT | 0 | 0.0 | 2 | 0.4 | 0 | 0.0 | 0 | 0.0 | 3 | 0.6 | 1 | 0.2 | 1 | 0.2 | 1 | 0.2 | 1 | 0.2 | 2 | 0.4 | 1 | 0.2 |
| Total | 7 | 1.2 | 13 | 2.4 | 10 | 1.8 | 7 | 1.3 | 7 | 1.5 | 11 | 2.3 | 10 | 2.0 | 7 | 1.4 | 5 | 1.0 | 13 | 2.5 | 6 | 1.3 |
| Extensively drug-resistant TBTable 13 Footnote ‡ | ||||||||||||||||||||||
| INH & RMP & AK & CM & OFL & ETH & RBT | 0 | 0.0 | 0 | 0.0 | 1 | 0.2 | 0 | 0.0 | 0 | 0.0 | 0 | 0.0 | 0 | 0.0 | 0 | 0.0 | 0 | 0.0 | 0 | 0.0 | 0 | 0.0 |
| INH & RMP & EMB & PZA & CM & OFL & ETH & RBT & PAS | 0 | 0.0 | 0 | 0.0 | 0 | 0.0 | 0 | 0.0 | 1 | 0.2 | 0 | 0.0 | 0 | 0.0 | 0 | 0.0 | 0 | 0.0 | 0 | 0.0 | 0 | 0.0 |
| INH & RMP & EMB & PZA & SM & KM & OFL & MOX & ETH & RBT | 0 | 0.0 | 0 | 0.0 | 0 | 0.0 | 0 | 0.0 | 0 | 0.0 | 0 | 0.0 | 0 | 0.0 | 0 | 0.0 | 1 | 0.2 | 0 | 0.0 | 0 | 0.0 |
| INH & RMP & EMB & PZA & SM & KM & OFL & MOX & ETH & RBT & PAS | 0 | 0.0 | 0 | 0.0 | 0 | 0.0 | 0 | 0.0 | 0 | 0.0 | 0 | 0.0 | 0 | 0.0 | 1 | 0.2 | 0 | 0.0 | 0 | 0.0 | 0 | 0.0 |
| INH & RMP & EMB & PZA & SM & KM & OFL & MOX & RBT & ETA & PAS | 0 | 0.0 | 0 | 0.0 | 0 | 0.0 | 0 | 0.0 | 0 | 0.0 | 0 | 0.0 | 0 | 0.0 | 0 | 0.0 | 0 | 0.0 | 0 | 0.0 | 1 | 0.2 |
| Total | 0 | 0.0 | 0 | 0.0 | 1 | 0.2 | 0 | 0.0 | 1 | 0.2 | 0 | 0.0 | 0 | 0.0 | 1 | 0.2 | 1 | 0.2 | 0 | 0.0 | 1 | 0.2 |
Abbreviations: AK=amikacin; CM=capreomycin; EMB=ethambutol; ETH=ethionamide; INH=isoniazid; KM=kanamycin; MOX=moxifloxacin; OFL=ofloxacin; PAS=para-aminosalicylic acid; PZA=pyrazinamide; RBT=rifabutin; RMP=rifampin; SM=streptomycin.
|
||||||||||||||||||||||
| Reporting year | ||||||||||||||||||||||
|---|---|---|---|---|---|---|---|---|---|---|---|---|---|---|---|---|---|---|---|---|---|---|
| 2004 | 2005 | 2006 | 2007 | 2008 | 2009 | 2010 | 2011 | 2012 | 2013 | 2014 | ||||||||||||
| n | % | n | % | n | % | n | % | n | % | n | % | n | % | n | % | n | % | n | % | n | % | |
| Isolates tested for resistance to INH, RMP, EMB & PZA | 1 | 100.0 | 1 | 100.0 | 0 | 0 | 0 | 0 | 0 | 0 | 1 | 100.0 | 1 | 100.0 | 3 | 100.0 | 0 | 0 | 0 | 0 | 2 | 100.0 |
| Isolates susceptible to all first-line TB drugs | 1 | 100.0 | 1 | 100.0 | 0 | 0 | 0 | 0 | 0 | 0 | 1 | 100.0 | 1 | 100.0 | 2 | 66.7 | 0 | 0 | 0 | 0 | 2 | 100.0 |
| Resistant to one or more first line drugs | 0 | 0.0 | 0 | 0.0 | 0 | 0 | 0 | 0 | 0 | 0 | 0 | 0.0 | 0 | 0.0 | 1 | 33.3 | 0 | 0 | 0 | 0 | 0 | 0.0 |
| Monoresistant TB | ||||||||||||||||||||||
| INH | 0 | 0.0 | 0 | 0.0 | 0 | 0 | 0 | 0 | 0 | 0 | 0 | 0.0 | 0 | 0.0 | 0 | 0.0 | 0 | 0 | 0 | 0 | 0 | 0.0 |
| RMP | 0 | 0.0 | 0 | 0.0 | 0 | 0 | 0 | 0 | 0 | 0 | 0 | 0.0 | 0 | 0.0 | 0 | 0.0 | 0 | 0 | 0 | 0 | 0 | 0.0 |
| EMB | 0 | 0.0 | 0 | 0.0 | 0 | 0 | 0 | 0 | 0 | 0 | 0 | 0.0 | 0 | 0.0 | 0 | 0.0 | 0 | 0 | 0 | 0 | 0 | 0.0 |
| PZA | 0 | 0.0 | 0 | 0.0 | 0 | 0 | 0 | 0 | 0 | 0 | 0 | 0.0 | 0 | 0.0 | 1 | 33.3 | 0 | 0 | 0 | 0 | 0 | 0.0 |
| Total | 0 | 0.0 | 0 | 0.0 | 0 | 0 | 0 | 0 | 0 | 0 | 0 | 0.0 | 0 | 0.0 | 1 | 33.3 | 0 | 0 | 0 | 0 | 0 | 0.0 |
| Reporting year | ||||||||||||||||||||||
|---|---|---|---|---|---|---|---|---|---|---|---|---|---|---|---|---|---|---|---|---|---|---|
| 2004 | 2005 | 2006 | 2007 | 2008 | 2009 | 2010 | 2011 | 2012 | 2013 | 2014 | ||||||||||||
| n | % | n | % | n | % | n | % | n | % | n | % | n | % | n | % | n | % | n | % | n | % | |
| Isolates tested for resistance to INH, RMP, EMB & PZATable 15 Footnote * | 207 | 100.0 | 226 | 100.0 | 201 | 100.0 | 200 | 100.0 | 210 | 100.0 | 171 | 100.0 | 197 | 100.0 | 205 | 100.0 | 209 | 100.0 | 205 | 100.0 | 186 | 100.0 |
| Isolates susceptible to all first-line TB drugs | 190 | 91.8 | 207 | 91.6 | 173 | 86.1 | 177 | 88.5 | 188 | 89.5 | 156 | 91.2 | 179 | 90.9 | 180 | 87.8 | 187 | 89.5 | 187 | 91.2 | 167 | 89.8 |
| Resistant to one or more first line drugs | 17 | 8.2 | 19 | 8.4 | 28 | 13.9 | 23 | 11.5 | 22 | 10.5 | 15 | 8.8 | 18 | 9.1 | 25 | 12.2 | 22 | 10.5 | 18 | 8.8 | 19 | 10.2 |
| Monoresistant TB | ||||||||||||||||||||||
| INH | 11 | 5.3 | 14 | 6.2 | 21 | 10.4 | 12 | 6.0 | 15 | 7.1 | 7 | 4.1 | 11 | 5.6 | 18 | 8.8 | 13 | 6.2 | 12 | 5.9 | 10 | 5.4 |
| RMP | 0 | 0.0 | 0 | 0.0 | 1 | 0.5 | 1 | 0.5 | 0 | 0.0 | 0 | 0.0 | 0 | 0.0 | 0 | 0.0 | 0 | 0.0 | 0 | 0.0 | 0 | 0.0 |
| EMB | 0 | 0.0 | 0 | 0.0 | 0 | 0.0 | 0 | 0.0 | 0 | 0.0 | 0 | 0.0 | 0 | 0.0 | 0 | 0.0 | 0 | 0.0 | 0 | 0.0 | 0 | 0.0 |
| PZA | 4 | 1.9 | 4 | 1.8 | 4 | 2.0 | 4 | 2.0 | 4 | 1.9 | 2 | 1.2 | 5 | 2.5 | 6 | 2.9 | 9 | 4.3 | 4 | 2.0 | 7 | 3.8 |
| Total | 15 | 7.2 | 18 | 8.0 | 26 | 12.9 | 17 | 8.5 | 19 | 9.0 | 9 | 5.3 | 16 | 8.1 | 24 | 11.7 | 22 | 10.5 | 16 | 7.8 | 17 | 9.1 |
| Polyresistant | ||||||||||||||||||||||
| INH & PZA | 0 | 0.0 | 0 | 0.0 | 0 | 0.0 | 1 | 0.5 | 1 | 0.5 | 0 | 0.0 | 1 | 0.5 | 0 | 0.0 | 0 | 0.0 | 0 | 0.0 | 0 | 0.0 |
| INH & EMB | 1 | 0.5 | 0 | 0.0 | 0 | 0.0 | 3 | 1.5 | 0 | 0.0 | 0 | 0.0 | 0 | 0.0 | 0 | 0.0 | 0 | 0.0 | 0 | 0.0 | 0 | 0.0 |
| Total | 1 | 0.5 | 0 | 0.0 | 0 | 0.0 | 4 | 2.0 | 1 | 0.5 | 0 | 0.0 | 1 | 0.5 | 0 | 0.0 | 0 | 0.0 | 0 | 0.0 | 0 | 0.0 |
| Multidrug-resistant TBTable 15 Footnote † | ||||||||||||||||||||||
| INH & RMP & EMB & ETH & RBT | 0 | 0.0 | 0 | 0.0 | 1 | 0.5 | 0 | 0.0 | 0 | 0.0 | 0 | 0.0 | 0 | 0.0 | 0 | 0.0 | 0 | 0.0 | 0 | 0.0 | 0 | 0.0 |
| INH & RMP & EMB & PZA & RBT | 0 | 0.0 | 0 | 0.0 | 0 | 0.0 | 0 | 0.0 | 0 | 0.0 | 1 | 0.6 | 0 | 0.0 | 0 | 0.0 | 0 | 0.0 | 0 | 0.0 | 0 | 0.0 |
| INH & RMP & EMB & PZA & SM & ETH | 0 | 0.0 | 0 | 0.0 | 0 | 0.0 | 0 | 0.0 | 0 | 0.0 | 0 | 0.0 | 1 | 0.5 | 0 | 0.0 | 0 | 0.0 | 0 | 0.0 | 0 | 0.0 |
| INH & RMP & EMB & PZA & SM & KM & ETH & RBT & PAS | 0 | 0.0 | 0 | 0.0 | 0 | 0.0 | 0 | 0.0 | 0 | 0.0 | 0 | 0.0 | 0 | 0.0 | 0 | 0.0 | 0 | 0.0 | 1 | 0.5 | 0 | 0.0 |
| INH & RMP & EMB & PZA & SM & RBT | 0 | 0.0 | 0 | 0.0 | 0 | 0.0 | 0 | 0.0 | 0 | 0.0 | 0 | 0.0 | 0 | 0.0 | 1 | 0.5 | 0 | 0.0 | 0 | 0.0 | 0 | 0.0 |
| INH & RMP & EMB & RBT | 0 | 0.0 | 0 | 0.0 | 0 | 0.0 | 1 | 0.5 | 0 | 0.0 | 1 | 0.6 | 0 | 0.0 | 0 | 0.0 | 0 | 0.0 | 0 | 0.0 | 0 | 0.0 |
| INH & RMP & EMB & SM & RBT | 0 | 0.0 | 0 | 0.0 | 1 | 0.5 | 1 | 0.5 | 0 | 0.0 | 0 | 0.0 | 0 | 0.0 | 0 | 0.0 | 0 | 0.0 | 0 | 0.0 | 0 | 0.0 |
| INH & RMP & PZA & ETH & RBT | 0 | 0.0 | 1 | 0.4 | 0 | 0.0 | 0 | 0.0 | 0 | 0.0 | 0 | 0.0 | 0 | 0.0 | 0 | 0.0 | 0 | 0.0 | 0 | 0.0 | 0 | 0.0 |
| INH & RMP & PZA & RBT | 0 | 0.0 | 0 | 0.0 | 0 | 0.0 | 0 | 0.0 | 0 | 0.0 | 0 | 0.0 | 0 | 0.0 | 0 | 0.0 | 0 | 0.0 | 0 | 0.0 | 1 | 0.5 |
| INH & RMP & PZA & SM & AK & KM & CM | 0 | 0.0 | 0 | 0.0 | 0 | 0.0 | 0 | 0.0 | 1 | 0.5 | 0 | 0.0 | 0 | 0.0 | 0 | 0.0 | 0 | 0.0 | 0 | 0.0 | 0 | 0.0 |
| INH & RMP & PZA & SM & KM & CM & ETH | 0 | 0.0 | 0 | 0.0 | 0 | 0.0 | 0 | 0.0 | 0 | 0.0 | 1 | 0.6 | 0 | 0.0 | 0 | 0.0 | 0 | 0.0 | 0 | 0.0 | 0 | 0.0 |
| INH & RMP & RBT | 1 | 0.5 | 0 | 0.0 | 0 | 0.0 | 0 | 0.0 | 0 | 0.0 | 1 | 0.6 | 0 | 0.0 | 0 | 0.0 | 0 | 0.0 | 0 | 0.0 | 0 | 0.0 |
| INH & RMP & SM & RBT | 0 | 0.0 | 0 | 0.0 | 0 | 0.0 | 0 | 0.0 | 1 | 0.5 | 2 | 1.2 | 0 | 0.0 | 0 | 0.0 | 0 | 0.0 | 0 | 0.0 | 1 | 0.5 |
| Total | 1 | 0.5 | 1 | 0.4 | 2 | 1.0 | 2 | 1.0 | 2 | 1.0 | 6 | 3.5 | 1 | 0.5 | 1 | 0.5 | 0 | 0.0 | 1 | 0.5 | 2 | 1.1 |
| Extensively drug-resistant TBTable 15 Footnote ‡ | ||||||||||||||||||||||
| INH & RMP & EMB & PZA & SM & AK & KM & CM & OFL & MOX & ETH & RBT | 0 | 0.0 | 0 | 0.0 | 0 | 0.0 | 0 | 0.0 | 0 | 0.0 | 0 | 0.0 | 0 | 0.0 | 0 | 0.0 | 0 | 0.0 | 1 | 0.5 | 0 | 0.0 |
| Total | 0 | 0.0 | 0 | 0.0 | 0 | 0.0 | 0 | 0.0 | 0 | 0.0 | 0 | 0.0 | 0 | 0.0 | 0 | 0.0 | 0 | 0.0 | 1 | 0.5 | 0 | 0.0 |
Abbreviations: AK= amikacin; CM= capreomycin; ETH= ethionamide; KM= kanamycin; MOX=moxifloxacin; OFL= ofloxacin; PAS= para-aminosalicylic acid; RBT= rifabutin; RMP= rifampin; SM= streptomycin.
|
||||||||||||||||||||||
| Reporting year | ||||||||||||||||||||||
|---|---|---|---|---|---|---|---|---|---|---|---|---|---|---|---|---|---|---|---|---|---|---|
| 2004 | 2005 | 2006 | 2007 | 2008 | 2009 | 2010 | 2011 | 2012 | 2013 | 2014 | ||||||||||||
| n | % | n | % | n | % | n | % | n | % | n | % | n | % | n | % | n | % | n | % | n | % | |
| Isolates tested for resistance to INH, RMP, EMB & PZA | 34 | 100.0 | 74 | 100.0 | 58 | 100.0 | 60 | 100.0 | 81 | 100.0 | 77 | 100.0 | 54 | 100.0 | 66 | 100.0 | 72 | 100.0 | 71 | 100.0 | 63 | 100.0 |
| Isolates susceptible to all first-line TB drugs | 32 | 94.1 | 72 | 97.3 | 57 | 98.3 | 59 | 98.3 | 79 | 97.5 | 72 | 93.5 | 51 | 94.4 | 62 | 93.9 | 68 | 94.4 | 69 | 97.2 | 60 | 95.2 |
| Resistant to one or more first line drugs | 2 | 5.9 | 2 | 2.7 | 1 | 1.7 | 1 | 1.7 | 2 | 2.5 | 5 | 6.5 | 3 | 5.6 | 4 | 6.1 | 4 | 5.6 | 2 | 2.8 | 3 | 4.8 |
| Monoresistant TB | ||||||||||||||||||||||
| INH | 2 | 5.9 | 2 | 2.7 | 1 | 1.7 | 1 | 1.7 | 2 | 2.5 | 3 | 3.9 | 2 | 3.7 | 4 | 6.1 | 1 | 1.4 | 1 | 1.4 | 0 | 0.0 |
| RMP | 0 | 0.0 | 0 | 0.0 | 0 | 0.0 | 0 | 0.0 | 0 | 0.0 | 0 | 0.0 | 0 | 0.0 | 0 | 0.0 | 0 | 0.0 | 0 | 0.0 | 1 | 1.6 |
| EMB | 0 | 0.0 | 0 | 0.0 | 0 | 0.0 | 0 | 0.0 | 0 | 0.0 | 0 | 0.0 | 0 | 0.0 | 0 | 0.0 | 0 | 0.0 | 0 | 0.0 | 0 | 0.0 |
| PZA | 0 | 0.0 | 0 | 0.0 | 0 | 0.0 | 0 | 0.0 | 0 | 0.0 | 0 | 0.0 | 0 | 0.0 | 0 | 0.0 | 3 | 4.2 | 1 | 1.4 | 1 | 1.6 |
| Total | 2 | 5.9 | 2 | 2.7 | 1 | 1.7 | 1 | 1.7 | 2 | 2.5 | 3 | 3.9 | 2 | 3.7 | 4 | 6.1 | 4 | 5.6 | 2 | 2.8 | 2 | 3.2 |
| Polyresistant | ||||||||||||||||||||||
| INH & PZA | 0 | 0.0 | 0 | 0.0 | 0 | 0.0 | 0 | 0.0 | 0 | 0.0 | 0 | 0.0 | 0 | 0.0 | 0 | 0.0 | 0 | 0.0 | 0 | 0.0 | 1 | 1.6 |
| INH & EMB | 0 | 0.0 | 0 | 0.0 | 0 | 0.0 | 0 | 0.0 | 0 | 0.0 | 1 | 1.3 | 0 | 0.0 | 0 | 0.0 | 0 | 0.0 | 0 | 0.0 | 0 | 0.0 |
| Total | 0 | 0.0 | 0 | 0.0 | 0 | 0.0 | 0 | 0.0 | 0 | 0.0 | 1 | 1.3 | 0 | 0.0 | 0 | 0.0 | 0 | 0.0 | 0 | 0.0 | 1 | 1.6 |
| Multidrug-resistant TBTable 16 Footnote * | ||||||||||||||||||||||
| INH & RMP & RBT | 0 | 0.0 | 0 | 0.0 | 0 | 0.0 | 0 | 0.0 | 0 | 0.0 | 0 | 0.0 | 1 | 1.9 | 0 | 0.0 | 0 | 0.0 | 0 | 0.0 | 0 | 0.0 |
| INH & RMP & SM | 0 | 0.0 | 0 | 0.0 | 0 | 0.0 | 0 | 0.0 | 0 | 0.0 | 1 | 1.3 | 0 | 0.0 | 0 | 0.0 | 0 | 0.0 | 0 | 0.0 | 0 | 0.0 |
| Total | 0 | 0.0 | 0 | 0.0 | 0 | 0.0 | 0 | 0.0 | 0 | 0.0 | 1 | 1.3 | 1 | 1.9 | 0 | 0.0 | 0 | 0.0 | 0 | 0.0 | 0 | 0.0 |
Abbreviations: EMB=ethambutol; INH=isoniazid; PZA=pyrazinamide; RBT = rifabutin; RMP=rifampin; SM=streptomycin.
|
||||||||||||||||||||||
| Reporting year | ||||||||||||||||||||||
|---|---|---|---|---|---|---|---|---|---|---|---|---|---|---|---|---|---|---|---|---|---|---|
| 2004 | 2005 | 2006 | 2007 | 2008 | 2009 | 2010 | 2011 | 2012 | 2013 | 2014 | ||||||||||||
| n | % | n | % | n | % | n | % | n | % | n | % | n | % | n | % | n | % | n | % | n | % | |
| Isolates tested for resistance to INH, RMP & EMBTable 17 Footnote * | 3 | 100.0 | 2 | 100.0 | 2 | 100.0 | 2 | 100.0 | 7 | 100.0 | 3 | 100.0 | 5 | 100.0 | 2 | 100.0 | 1 | 100.0 | 1 | 100.0 | 4 | 100.0 |
| Isolates susceptible to all first-line TB drugs | 3 | 100.0 | 2 | 100.0 | 2 | 100.0 | 2 | 100.0 | 7 | 100.0 | 3 | 100.0 | 5 | 100.0 | 2 | 100.0 | 1 | 100.0 | 1 | 100.0 | 4 | 100.0 |
Abbreviations: EMB=ethambutol; INH=isoniazid; PZA=pyrazinamide; RMP=rifampin.
|
||||||||||||||||||||||
| Originating province | ||||||||||||||
|---|---|---|---|---|---|---|---|---|---|---|---|---|---|---|
| Canada | N.L. | P.E.I. | N.S. | N.B. | Que. | Ont. | Man. | Sask. | Alta. | B.C. | Y.T. | N.W.T | Nvt. | |
| Total Number of MTBC isolates tested | 1,376 | 6 | 2 | 8 | 6 | 186 | 457 | 125 | 63 | 181 | 270 | 4 | 2 | 66 |
| Multidrug-resistant TBTable 18 Footnote * | ||||||||||||||
| Isoniazid & rifampin | 10 | 0 | 0 | 0 | 0 | 1 | 3 | 0 | 0 | 2 | 4 | 0 | 0 | 0 |
| Isoniazid & rifampin & ethambutol | 3 | 0 | 0 | 0 | 0 | 0 | 1 | 0 | 0 | 0 | 2 | 0 | 0 | 0 |
| Isoniazid & rifampin & pyrazinamide | 2 | 0 | 0 | 0 | 0 | 1 | 1 | 0 | 0 | 0 | 0 | 0 | 0 | 0 |
| Isoniazid & rifampin & pyrazinamide & ethambutol | 3 | 0 | 0 | 0 | 0 | 0 | 1 | 0 | 0 | 2 | 0 | 0 | 0 | 0 |
| Total | 18 | 0 | 0 | 0 | 0 | 2 | 6 | 0 | 0 | 4 | 6 | 0 | 0 | 0 |
| Extensively drug-resistant TBTable 18 Footnote † | ||||||||||||||
| Isoniazid & rifampin & pyrazinamide & ethambutol & streptomycin & kanamycin & ofloxacin & moxifloxacin & rifabutin | 1 | 0 | 0 | 0 | 0 | 0 | 1 | 0 | 0 | 0 | 0 | 0 | 0 | 0 |
| Total | 1 | 0 | 0 | 0 | 0 | 0 | 1 | 0 | 0 | 0 | 0 | 0 | 0 | 0 |
Abbreviations: Alta.= Alberta; B.C.= British Columbia; Man.= Manitoba; N.B.= New Brunswick; N.L.= Newfoundland and Labrador; N.S.= Nova Scotia; Nvt.= Nunavut; N.W.T.= Northwest Territories; Ont.= Ontario; P.E.I.= Prince Edward Island; Que.= Quebec; Sask.= Saskatchewan; Y.T.= Yukon.
|
||||||||||||||
| Originating province | Total number of reported MTBC isolates | Resistant to one or more first line drugs | Multidrug-resistant TBTable 19 Footnote * | Extensively drug-resistant TBTable 19 Footnote † | |||
|---|---|---|---|---|---|---|---|
| Number | Percent (%) | Number | Percent (%) | Number | Percent (%) | ||
| Ontario | 5,688 | 633 | 11.1 | 96 | 1.7 | 5 | 0.1 |
| British Columbia | 2,611 | 255 | 9.8 | 23 | 0.9 | 0 | 0.0 |
| Quebec | 2,217 | 226 | 10.2 | 19 | 0.9 | 1 | 0.0 |
| Alberta | 1,479 | 145 | 9.8 | 24 | 1.6 | 0 | 0.0 |
| Manitoba | 1,247 | 70 | 5.6 | 4 | 0.3 | 1 | 0.1 |
| Saskatchewan | 710 | 29 | 4.1 | 2 | 0.3 | 0 | 0.0 |
| Nunavut | 515 | 5 | 1.0 | 0 | 0.0 | 0 | 0.0 |
| Newfoundland and Labrador | 81 | 1 | 1.2 | 0 | 0.0 | 0 | 0.0 |
| Nova Scotia | 80 | 8 | 10.0 | 0 | 0.0 | 0 | 0.0 |
| Northwest Territories | 80 | 3 | 3.8 | 0 | 0.0 | 0 | 0.0 |
| New Brunswick | 64 | 6 | 9.4 | 0 | 0.0 | 0 | 0.0 |
| Yukon | 32 | 0 | 0.0 | 0 | 0.0 | 0 | 0.0 |
| Prince Edward Island | 9 | 1 | 11.1 | 0 | 0.0 | 0 | 0.0 |
| Canada | 14,813 | 1,382 | 9.3 | 168 | 1.1 | 7 | <0.1 |
|
|||||||
| Age group and sex | Isolates reported | Resistant to one or more first line drugs | Multidrug-resistantTable 20 Footnote * | Extensively drug-resistantTable 20 Footnote † | |||||
|---|---|---|---|---|---|---|---|---|---|
| Number | Percent (%) | Number | Percent (%) | Number | Percent (%) | Number | Percent (%) | ||
| 0 to 4 | Male | 8 | 0.6 | 0 | 0.0 | 0 | 0.0 | 0 | 0.0 |
| Female | 4 | 0.3 | 1 | 0.8 | 1 | 5.6 | 0 | 0.0 | |
| Unknown | 0 | 0.0 | 0 | 0.0 | 0 | 0.0 | 0 | 0.0 | |
| Total | 12 | 0.9 | 1 | 0.8 | 1 | 5.6 | 0 | 0.0 | |
| 5 to 14 | Male | 12 | 0.9 | 1 | 0.8 | 0 | 0.0 | 0 | 0.0 |
| Female | 10 | 0.7 | 0 | 0.0 | 0 | 0.0 | 0 | 0.0 | |
| Unknown | 0 | 0.0 | 0 | 0.0 | 0 | 0.0 | 0 | 0.0 | |
| Total | 22 | 1.6 | 1 | 0.8 | 0 | 0.0 | 0 | 0.0 | |
| 15 to 24 | Male | 93 | 6.8 | 4 | 3.1 | 1 | 5.6 | 0 | 0.0 |
| Female | 81 | 5.9 | 9 | 6.9 | 1 | 5.6 | 0 | 0.0 | |
| Unknown | 0 | 0.0 | 0 | 0.0 | 0 | 0.0 | 0 | 0.0 | |
| Total | 174 | 12.6 | 13 | 9.9 | 2 | 11.1 | 0 | 0.0 | |
| 25 to 34 | Male | 116 | 8.4 | 9 | 6.9 | 3 | 16.7 | 0 | 0.0 |
| Female | 134 | 9.7 | 21 | 16.0 | 2 | 11.1 | 1 | 100.0 | |
| Unknown | 0 | 0.0 | 0 | 0.0 | 0 | 0.0 | 0 | 0.0 | |
| Total | 250 | 18.2 | 30 | 22.9 | 5 | 27.8 | 1 | 100.0 | |
| 35 to 44 | Male | 103 | 7.5 | 11 | 8.4 | 0 | 0.0 | 0 | 0.0 |
| Female | 113 | 8.2 | 16 | 12.2 | 3 | 16.7 | 0 | 0.0 | |
| Unknown | 0 | 0.0 | 0 | 0.0 | 0 | 0.0 | 0 | 0.0 | |
| Total | 216 | 15.7 | 27 | 20.6 | 3 | 16.7 | 0 | 0.0 | |
| 45 to 54 | Male | 120 | 8.7 | 9 | 6.9 | 2 | 11.1 | 0 | 0.0 |
| Female | 70 | 5.1 | 7 | 5.3 | 1 | 5.6 | 0 | 0.0 | |
| Unknown | 0 | 0.0 | 0 | 0.0 | 0 | 0.0 | 0 | 0.0 | |
| Total | 190 | 13.8 | 16 | 12.2 | 3 | 16.7 | 0 | 0.0 | |
| 55 to 64 | Male | 110 | 8.0 | 12 | 9.2 | 1 | 5.6 | 0 | 0.0 |
| Female | 49 | 3.6 | 5 | 3.8 | 0 | 0.0 | 0 | 0.0 | |
| Unknown | 0 | 0.0 | 0 | 0.0 | 0 | 0.0 | 0 | 0.0 | |
| Total | 159 | 11.6 | 17 | 13.0 | 1 | 5.6 | 0 | 0.0 | |
| 65 to 74 | Male | 90 | 6.5 | 12 | 9.2 | 1 | 5.6 | 0 | 0.0 |
| Female | 50 | 3.6 | 4 | 3.1 | 0 | 0.0 | 0 | 0.0 | |
| Unknown | 1 | 0.1 | 0 | 0.0 | 0 | 0.0 | 0 | 0.0 | |
| Total | 141 | 10.2 | 16 | 12.2 | 1 | 5.6 | 0 | 0.0 | |
| 75+ | Male | 127 | 9.2 | 5 | 3.8 | 1 | 5.6 | 0 | 0.0 |
| Female | 83 | 6.0 | 5 | 3.8 | 1 | 5.6 | 0 | 0.0 | |
| Unknown | 1 | 0.1 | 0 | 0.0 | 0 | 0.0 | 0 | 0.0 | |
| Total | 211 | 15.3 | 10 | 7.6 | 2 | 11.1 | 0 | 0.0 | |
| Unknown | Male | 0 | 0.0 | 0 | 0.0 | 0 | 0.0 | 0 | 0.0 |
| Female | 1 | 0.1 | 0 | 0.0 | 0 | 0.0 | 0 | 0.0 | |
| Unknown | 0 | 0.0 | 0 | 0.0 | 0 | 0.0 | 0 | 0.0 | |
| Total | 1 | 0.1 | 0 | 0.0 | 0 | 0.0 | 0 | 0.0 | |
| Total | Male | 779 | 56.6 | 63 | 48.1 | 9 | 50.0 | 0 | 0.0 |
| Female | 595 | 43.2 | 68 | 51.9 | 9 | 50.0 | 1 | 100.0 | |
| Unknown | 2 | 0.1 | 0 | 0.0 | 0 | 0.0 | 0 | 0.0 | |
| Total | 1,376 | 100.0 | 131 | 100.0 | 18 | 100.0 | 1 | 100.0 | |
|
|||||||||