
Tuberculosis surveillance in Canada summary report: 2012-2021
Download the alternative format
(1.5 MB, 31 pages)
Organization: Public Health Agency of Canada
Date published: 2023-10-18
Table of contents
Acknowledgements
The publication of this report would not have been possible without the collaboration of public health surveillance and epidemiology partners and laboratories in all provinces and territories. We appreciate and acknowledge the collaboration of all our surveillance partners. The Appendix contains a complete list of all data contributors.
Introduction
The Public Health Agency of Canada (PHAC) works with provincial and territorial governments, other federal departments and agencies and Indigenous partners, towards the goal of tuberculosis (TB) elimination in Canada as part of The End TB Strategy of the World Health Organization (WHO)Footnote 1. This report provides a summary of the descriptive epidemiology of active TB in Canada from 2012 to 2021 with a specific focus on data from 2021, along with information on the incidence of drug-resistant TB disease, and treatment outcomes. A more detailed report on TB in Canada examining trends between 2012 and 2021 will be published later in 2023.
Methods
Data collection
PHAC, in collaboration with provincial and territorial public health authorities, monitors TB in Canada through the Canadian Tuberculosis Reporting System (CTBRS), a national case-based surveillance system that collects and maintains non-nominal data on persons diagnosed with active TB. Active TB occurs when Mycobacterium tuberculosis causes an infection, either through primary infection or reactivation of latent TB, usually affecting the lungs although other organs or systems may be involved. For surveillance purposes, cases of active TB are either laboratory confirmed or clinically diagnosed and are defined as follows:
Laboratory confirmed TB case:
- A person for whom laboratory testing has detected Mycobacterium tuberculosis complex (excluding M. bovis BCG strain) on culture.
or
- A person for whom laboratory testing has detected Mycobacterium tuberculosis complex (excluding M. bovis BCG strain) by nucleic acid amplification testing (NAAT) and with clinical findings consistent with TB disease.
Clinically diagnosed case:
- A person for whom microbiological confirmation of active TB is absent and who meets one or more of the following criteria:
- Signs or symptoms clinically compatible with active TB (respiratory or non-respiratory);
- Diagnostic imaging findings compatible with active TB (respiratory or non-respiratory imaging);
- Pathologic evidence of active TB (e.g., compatible histopathology, positive AFB staining);
- Post-mortem evidence of active TB;
- Favourable response to a therapeutic trial of TB drugs.
Cases that meet this definition are submitted to the CTBRS by the respective provincial and territorial public health authorities on a voluntary basis. Information is additionally collected for the following variables:
- diagnostic classification based on the disease site (respiratory or non-respiratory)
- demographic data (age, sex, population group, country of birth, and place of residence)
- clinical information (medical co-morbidity: HIV, diabetes, end-stage renal disease abnormal chest X-ray, transplant-related immunosuppression, and corticosteroid use)
- selected social determinants of health (e.g., housing and substance use)
- other potential risk factors (e.g., contact with active TB, travel history to a high burden TB country, history of incarceration, etc.)
Active TB is classified as either respiratory or non-respiratory. Respiratory TB includes infection of the lungs and conducting airways (pulmonary), intrathoracic or mediastinal lymph nodes, larynx, nasopharynx, nose or sinusesFootnote 2. Pulmonary TB is the most common form of respiratory TB and includes tuberculous fibrosis of the lung, tuberculous bronchiectasis, tuberculous pneumonia and tuberculous pneumothorax, isolated tracheal or bronchial TB, and tuberculous laryngitis Footnote 2. Non-respiratory TB includes all other disease sites (the peripheral lymph nodes, central nervous system and meninges, intestines, peritoneum and mesenteric glands, bones and joints, genito-urinary system, miliary, eyes, etc.).
Due to time required for TB treatment, data on treatment outcomes are submitted to the CTBRS one year (one reporting cycle) following the submission of the initial case report of incident TB. When treatment is still ongoing at the time of this second data submission, the reporting jurisdiction submits an interim report followed by subsequent annual updates until the case file is resolved or closed. Updated data from previous years are always reflected in the most current surveillance report. The surveillance definition of treatment success includes cured (i.e., culture-negative at the end of treatment) or completion of the full-prescribed course of TB treatment. WHO definitions were used to calculate this indicatorFootnote 1.
Antimicrobial resistance data were captured through the Canadian Tuberculosis Laboratory Surveillance System (CTBLSS). All Mycobacterium tuberculosis complex isolates are sent to provincial laboratories or to the NML (Atlantic region and Manitoba) for drug susceptibility testing using culture-based, phenotypic methods. Susceptibility testing is completed for first-line TB drugs, and isolates demonstrating resistance to first-line drugs are then submitted for testing against second-line TB drugs. Resistant isolates are classified as follows:
- Mono-resistance, defined as resistance to one first-line anti-TB drug only (isoniazid, rifampin, ethambutol or pyrazinamide);
- Poly-resistance, defined as resistance to more than one first-line anti-TB drug, not including the combination of isoniazid and rifampin;
- Multidrug-resistance (MDR), which is the resistance to isoniazid and rifampin with or without resistance to other TB drugs; and
- Extensive drug-resistance (XDR), defined as resistance to first-line agents (isoniazid and rifampicin), AND any fluoroquinolone, AND to one or more second-line injectable drug (amikacin, kanamycin, or capreomycin).
- Although a new WHO definition for XDR was introduced in 2021, this report uses the previous definition as the collection of laboratory data required to meet the new definition began in 2023.
Together with demographic data (sex, age, and province of residence), the results of culture-based, phenotypic drug susceptibility testing of isolates from active TB cases are submitted voluntarily to the CTBLSS by provincial TB laboratories every year. Territorial drug-susceptibility testing results are submitted by provincial laboratories on their behalf. The present report covers the 10-year period from 2012 to 2021.
Latent TB infection is not nationally notifiable, and not reported through either the CTBLSS or CTBRS surveillance systems and therefore is not included in this report.
Data in this report are considered provisional and may be subject to change in future TB surveillance reports. If there are discrepancies between the data summarized in this report and provincial and territorial reports, the most recent provincial and territorial report should be used because updated national data may still be pending.
Data analysis
The incidence of active TB was calculated as the number of cases per 100,000 population. Denominator data used to calculate these rates came from multiple sources. Canadian population data were based on midyear estimates of the Canadian population from Statistics Canada. For persons born outside Canada, data were obtained from population projections based on the most recent Canadian Census Footnote 3. Denominators for First Nations, Métis and Inuit were obtained from Statistics Canada Projections of Indigenous Households in Canada, 2016 to 2041 Footnote 4.
Data received from the provinces and territories were maintained according to PHAC's Directive for the Collection, Use and Dissemination of Information Relating to Public Health. Data were cleaned and analyzed using SASTM Enterprise Guide and MicrosoftTM Excel 2016. No statistical procedures were used for comparative analyses, nor were any statistical techniques applied to account for missing data.
It should be noted that certain analyses do not include all jurisdictions due to missing data. British Columbia has not submitted information on Indigenous identity for TB cases since 2016. Since this time, cases from British Columbia have been reported as either Canadian-born or born outside Canada. For Quebec the 2021 data were not available at the time of analysis for certain variables. In agreement with Quebec, data for these variables were not included in the report.
Results
TB in Canada
In 2021, there were 1,829 people in Canada diagnosed with active TB, corresponding to an incidence of 4.8 cases per 100,000 population (Figure 1). Between 2012 and 2021 the number of new cases per year ranged from 1,615 to 1,921, however the incidence remained stable (from 4.6 per 100,000 to 5.1 per 100,000).
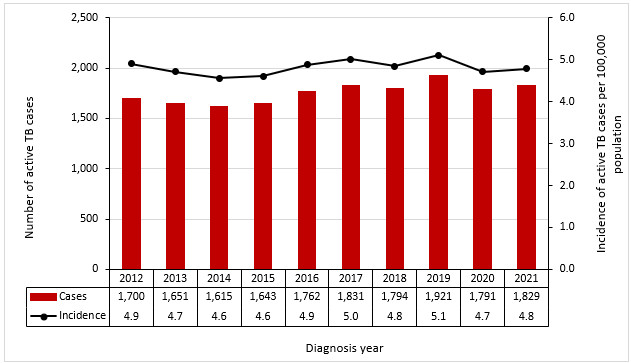
Figure 1 - Text description
| 2012 | 2013 | 2014 | 2015 | 2016 | 2017 | 2018 | 2019 | 2020 | 2021 | |
|---|---|---|---|---|---|---|---|---|---|---|
| Cases | 1,700 | 1,651 | 1,615 | 1,643 | 1,762 | 1,831 | 1,794 | 1,921 | 1,791 | 1,829 |
| Incidence | 4.9 | 4.7 | 4.6 | 4.6 | 4.9 | 5.0 | 4.8 | 5.1 | 4.7 | 4.8 |
Active TB by age and sex
In 2021, the incidence of active TB in Canada among males was higher (5.3 cases per 100,000) compared with females (4.3 cases per 100,000) (Figure 2). These sex-specific rates changed minimally over the 2012-2021 period, with the incidence among males remaining consistently higher than females. During this period, the incidence of active TB for males ranged from 4.9 to 5.8 per 100,000; in comparison, the rate among females (per 100,000) ranged from 4.0 to 4.5 (Figure 2).
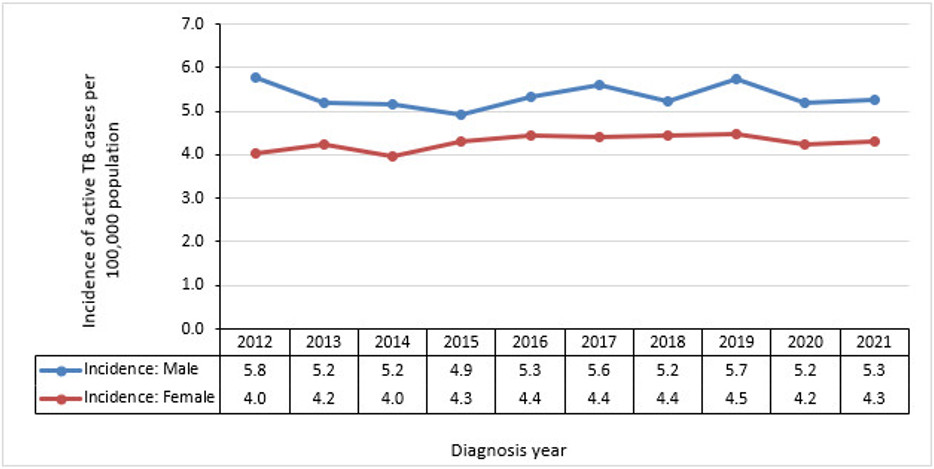
Figure 2 - Text description
| Sex | 2012 | 2013 | 2014 | 2015 | 2016 | 2017 | 2018 | 2019 | 2020 | 2021 |
|---|---|---|---|---|---|---|---|---|---|---|
| Male | 5.8 | 5.2 | 5.2 | 4.9 | 5.3 | 5.6 | 5.2 | 5.7 | 5.2 | 5.3 |
| Female | 4.0 | 4.2 | 4.0 | 4.3 | 4.4 | 4.4 | 4.4 | 4.5 | 4.2 | 4.3 |
Examining TB incidence by age, in 2021 individuals aged 75 years and older had the highest incidence of active TB at 8.1 cases per 100,000, this represented an overall decrease since 2012 (Figure 3). The second highest incidence was in the 25-34-year age group at 6.8 cases per 100,000. The gap in incidence between males and females was larger in the age groups over 45 years relative to younger age groups (Figure 4). Incidence was lowest among pediatric cases: 1.2 per 100,000 among those aged 5 to 14 years and 2.1 per 100,000 among those under the age of 5. Trends in age-specific incidence were relatively stable over the 10-year surveillance period for most age groups, except for a small increase in incidence observed in the 15-to-24-year age group from 4.3 per 100,000 in 2014 to 5.8 per 100,000 in 2021. There was also a decrease in the oldest age groups: 6.3 per 100,000 to 4.7 per 100,000 among those aged 65 to 74 years and 9.3 to 8.1 among those aged 75 years and older (Figure 3).
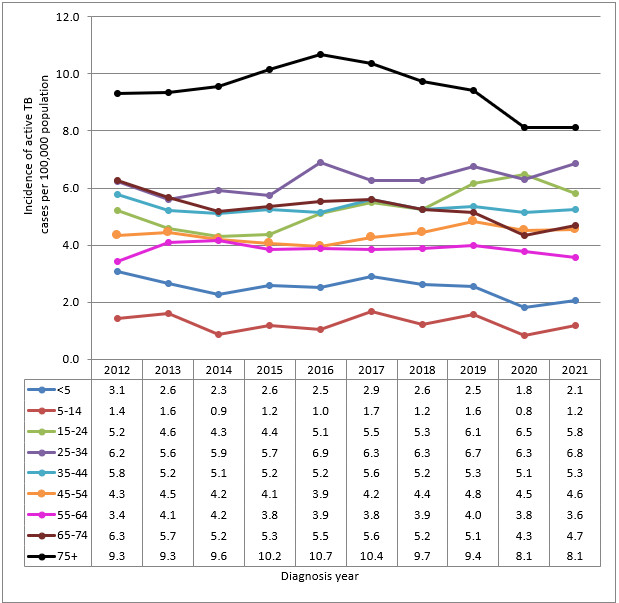
Figure 3 - Text description
| Age group | 2012 | 2013 | 2014 | 2015 | 2016 | 2017 | 2018 | 2019 | 2020 | 2021 |
|---|---|---|---|---|---|---|---|---|---|---|
| <5 | 3.1 | 2.6 | 2.3 | 2.6 | 2.5 | 2.9 | 2.6 | 2.5 | 1.8 | 2.1 |
| 5-14 | 1.4 | 1.6 | 0.9 | 1.2 | 1.0 | 1.7 | 1.2 | 1.6 | 0.8 | 1.2 |
| 15-24 | 5.2 | 4.6 | 4.3 | 4.4 | 5.1 | 5.5 | 5.3 | 6.1 | 6.5 | 5.8 |
| 25-34 | 6.2 | 5.6 | 5.9 | 5.7 | 6.9 | 6.3 | 6.3 | 6.7 | 6.3 | 6.8 |
| 35-44 | 5.8 | 5.2 | 5.1 | 5.2 | 5.2 | 5.6 | 5.2 | 5.3 | 5.1 | 5.3 |
| 45-54 | 4.3 | 4.5 | 4.2 | 4.1 | 3.9 | 4.2 | 4.4 | 4.8 | 4.5 | 4.6 |
| 55-64 | 3.4 | 4.1 | 4.2 | 3.8 | 3.9 | 3.8 | 3.9 | 4.0 | 3.8 | 3.6 |
| 65-74 | 6.3 | 5.7 | 5.2 | 5.3 | 5.5 | 5.6 | 5.2 | 5.1 | 4.3 | 4.7 |
| 75+ | 9.3 | 9.3 | 9.6 | 10.2 | 10.7 | 10.4 | 9.7 | 9.4 | 8.1 | 8.1 |
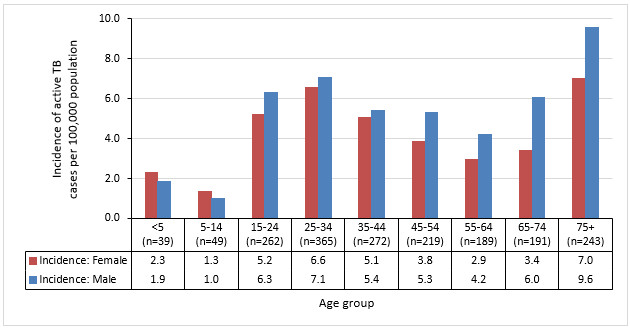
Figure 4 - Text description
| Sex | <5 (n=39) |
5-14 (n=49) |
15-24 (n=262) |
25-34 (n=365) |
35-44 (n=272) |
45-54 (n=219) |
55-64 (n=189) |
65-74 (n=191) |
75+ (n=243) |
|---|---|---|---|---|---|---|---|---|---|
| Female | 2.3 | 1.3 | 5.2 | 6.6 | 5.1 | 3.8 | 2.9 | 3.4 | 7.0 |
| Male | 1.9 | 1.0 | 6.3 | 7.1 | 5.4 | 5.3 | 4.2 | 6.0 | 9.6 |
In 2021, most cases (95.2%; n=1,741) occurred in individuals 15 years of age or older, with pediatric cases (<15 years) accounting for 4.8% of cases nationally (Table 1). While the highest rates were observed in the 75 and older group, the young adult age groups accounted for the highest proportion of cases in 2021 (20.0%, n=365 for persons aged 25 to 34 years and 14.3%, n=262 for persons aged 15 to 24 years) (Table 1).
| Age group | 2021 | |
|---|---|---|
| n | % | |
| < 5 years old | 39 | 2.1% |
| 5-14 years old | 49 | 2.7% |
| 15-24 years old | 262 | 14.3% |
| 25-34 years old | 365 | 20.0% |
| 35-44 years old | 272 | 14.9% |
| 45-54 years old | 219 | 12.0% |
| 55-64 years old | 189 | 10.3% |
| 65-74 years old | 191 | 10.4% |
| 75 years + | 243 | 13.3% |
| Total | 1,829 | 100% |
Active TB by population group
In 2021, information on population group (i.e., born outside Canada, Indigenous Peoples, non-Indigenous Canadian-born, and Canadian-born unspecified Indigeneous identity) was reported for 86% (n=1,376/1,600) of incident active TB cases. Over three quarters (76.7%) of active TB cases were among people born outside Canada. Another 16.9% of cases occurred among Indigenous Peoples and non-Indigenous Canadian-born persons represented 3.6% of all cases. A further 2.8% of cases were born in Canada, but their Indigenous identity was not known (Figure 5).
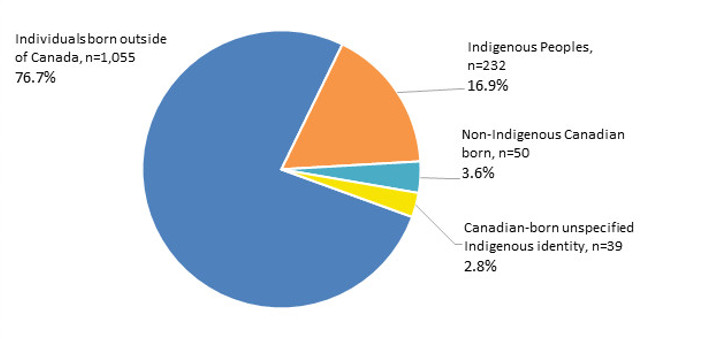
Figure 5 - Text description
| Population group | Number of cases | Percentage |
|---|---|---|
| Individuals born outside of Canada | 1,055 | 76.7% |
| Indigenous Peoples | 232 | 16.9% |
| Non-Indigenous Canadian born | 50 | 3.6% |
| Canadian-born unspecified Indigenous identity | 39 | 2.8% |
Note: 2021 data were not available for Quebec population groups.
2016-2021 data were not available for BC Indigenous identity and the non-Indigenous Canadian born.
Trends in the incidence of active TB are presented in Figure 6. The incidence of active TB in 2021 varied significantly by population group and was highest among Inuit (135.1 per 100,000) followed by First Nations (16.1 per 100,000) and persons born outside of Canada (12.3 per 100,000). The incidence of active TB for the Métis was 2.1 per 100,000 and for non-Indigenous Canadian-born people was 0.3 per 100,000 (Figure 6).
Examining trends over time, the incidence of active TB among Inuit decreased between 2019 and 2020 from 188.7 to 81.9 per 100,000 but increased again in 2021 to 135.1 per 100,000 (Figure 6). These changes are difficult to interpret given the potential impact of the COVID-19 pandemic on reporting and diagnosis of TB in these years. Incidence was higher in 2012 at 251.6 per 100,000 potentially due to outbreaks.
There was a slight decline in the incidence of TB among First Nations in Canada over the surveillance period from 21.2 per 100,000 in 2012 to 16.1 per 100,000 in 2021. In comparison the incidence of active TB for the Métis has remained relatively stable over this reporting period (Figure 6).
For persons born outside of Canada, the incidence of active TB in 2021 (12.3 cases per 100,000) was slightly lower than the incidence observed since 2012 (ranging from 14.2 to 15.9 per 100,000 population) (Figure 6). Possible contributing factors to this decrease in 2021 include an update to the denominator used for this population and the exclusion of Quebec from the analysis.
For the non-Indigenous Canadian-born population, the incidence of active TB in 2021 was the same as in 2020 at 0.3 per 100,000, with an overall declining trend since 2012 from 0.7 to 0.3 per 100,000 (Figure 6).
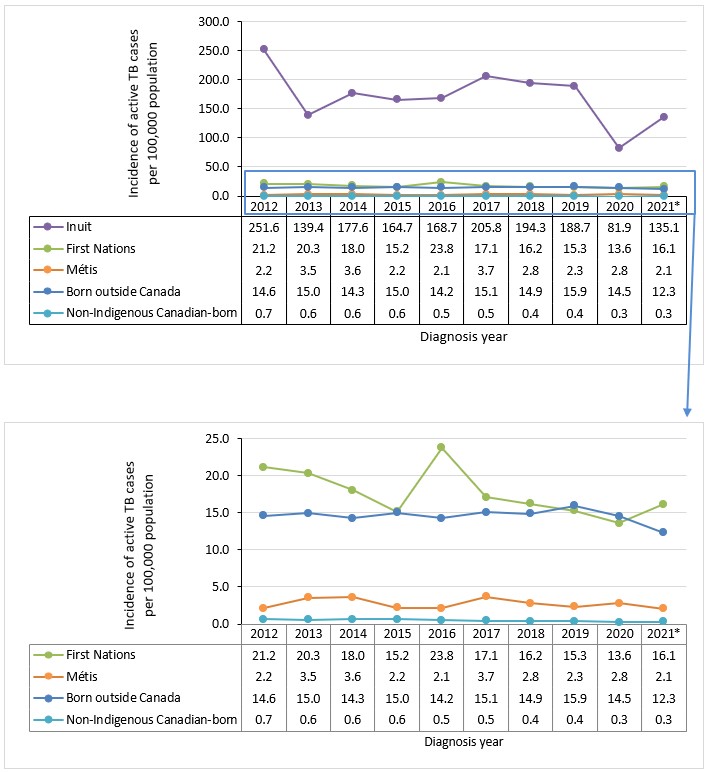
Figure 6 - Text description
| Population group | 2012 | 2013 | 2014 | 2015 | 2016 | 2017 | 2018 | 2019 | 2020 | 2021Footnote * |
|---|---|---|---|---|---|---|---|---|---|---|
| Inuit | 251.6 | 139.4 | 177.6 | 164.7 | 168.7 | 205.8 | 194.3 | 188.7 | 81.9 | 135.1 |
| First Nations | 21.2 | 20.3 | 18.0 | 15.2 | 23.8 | 17.1 | 16.2 | 15.3 | 13.6 | 16.1 |
| Métis | 2.2 | 3.5 | 3.6 | 2.2 | 2.1 | 3.7 | 2.8 | 2.3 | 2.8 | 2.1 |
| Born outside Canada | 14.6 | 15.0 | 14.3 | 15.0 | 14.2 | 15.1 | 14.9 | 15.9 | 14.5 | 12.3 |
| Non-Indigenous Canadian born | 0.7 | 0.6 | 0.6 | 0.6 | 0.5 | 0.5 | 0.4 | 0.4 | 0.3 | 0.3 |
|
||||||||||
Notes: *2021 data were not available for Quebec population groups, except for the Inuit population.
2016-2021 data were not available for BC for Indigenous identity and the Non-Indigenous Canadian born.
Risk factors
Among cases where risk factor data was reported, travel to a high-incidence TB country for more than a week in the previous two years, having diabetes mellitus, and contact with an active TB case two years before TB diagnosis, were the factors most commonly reported in 2021 (Table 2). It should be noted that given incomplete reporting of all TB risk factors (between 53.6% (n=858/1,600) and 82.5% (n=1,320/1,600) of data were missing) these findings should be interpreted with caution.
| Risk factor | Total number of cases with reported data | Unknown (data not provided) | Prevalence of risk factor (among cases with reported data) | ||
|---|---|---|---|---|---|
| n | n | % | n | % | |
| Travel to high-incidence TB country for >1 week in last 2 years | 361 | 1,239 | 77.4% | 136 | 37.7% |
| Diabetes Mellitus type 1 or 2 | 569 | 1,031 | 64.4% | 159 | 27.9% |
| Contact with an active TB case in the last 2 years | 560 | 1,040 | 65.0% | 128 | 22.9% |
| Previous abnormal chest x-ray | 498 | 1,102 | 68.9% | 77 | 15.5% |
| Substance use | 511 | 1,089 | 68.1% | 42 | 8.2% |
| End-stage renal disease | 501 | 1,099 | 68.7% | 28 | 5.6% |
| HIV | 742 | 858 | 53.6% | 38 | 5.1% |
| Homelessness at the time of TB diagnosis or 12 months prior | 494 | 1,106 | 69.1% | 20 | 4.0% |
| Transplant-related immunosuppression | 489 | 1,111 | 69.4% | 11 | 2.2% |
| Recent history of incarceration | 280 | 1,320 | 82.5% | 4 | 1.4% |
HIV reporting is an important indicator for TB programs. In 2021 the prevalence of HIV among active TB cases was 5.1% (n=38/742). However, HIV status was reported for only 46.4% (n=742/1,600) of active TB cases (Table 3). Examining trends over time, between 2017 and 2019 when the reporting of HIV status was higher (range: 1,237 to 1,334), the prevalence of HIV among persons with active TB was observed to be lower, at between 2.2% and 2.7% (Table 3).
| 2012 | 2013 | 2014 | 2015 | 2016 | 2017 | 2018 | 2019 | 2020 | 2021Footnote * | |||
|---|---|---|---|---|---|---|---|---|---|---|---|---|
| HIV-status reported | Positive | n | 56 | 70 | 65 | 67 | 92 | 28 | 42 | 37 | 51 | 38 |
| (%) | 7.6% | 10.1% | 7.8% | 9.2% | 11.8% | 2.2% | 3.5% | 2.7% | 5.2% | 5.1% | ||
| Negative | n | 682 | 625 | 772 | 659 | 690 | 1,237 | 1,161 | 1,334 | 936 | 704 | |
| (%) | 92.4% | 89.9% | 92.2% | 90.8% | 88.2% | 97.8% | 96.5% | 97.3% | 94.8% | 94.9% | ||
| Subtotal with reported status | n | 738 | 695 | 837 | 726 | 782 | 1,265 | 1,203 | 1,371 | 987 | 742 | |
| (%) | 43.4% | 42.1% | 51.8% | 44.2% | 44.4% | 69.1% | 67.1% | 71.4% | 55.1% | 46.4% | ||
| HIV status unknown | HIV test not offered | n | 61 | 74 | 39 | 53 | 47 | 57 | 52 | 29 | 36 | 12 |
| (%) | 6.3% | 8.4% | 5.3% | 6.2% | 5.1% | 11.3% | 9.7% | 5.6% | 4.7% | 1.4% | ||
| HIV test refused | n | 71 | 2 | 4 | 7 | 6 | 3 | 1 | 0 | 0 | 0 | |
| (%) | 7.4% | 0.2% | 0.5% | 0.8% | 0.6% | 0.5% | 0.2% | 0.0% | 0.0% | 0.0% | ||
| Not reported | n | 830 | 880 | 735 | 857 | 927 | 506 | 538 | 521 | 768 | 846 | |
| (%) | 86.3% | 92.1% | 94.5% | 93.5% | 94.6% | 89.4% | 91.0% | 94.7% | 95.5% | 98.6% | ||
| Subtotal with status unknown | n | 962 | 956 | 778 | 917 | 980 | 566 | 591 | 550 | 804 | 858 | |
| (%) | 56.6% | 57.9% | 48.2% | 55.8% | 55.6% | 30.9% | 32.9% | 28.6% | 44.9% | 53.6% | ||
| Total | n | 1,700 | 1,651 | 1,615 | 1,643 | 1,762 | 1,831 | 1,794 | 1,921 | 1,791 | 1,600 | |
| (%) | 100% | 100% | 100% | 100% | 100% | 100% | 100% | 100% | 100% | 100% | ||
|
||||||||||||
Diagnostic sites for active TB
As observed in previous years, pulmonary TB was the most commonly reported diagnostic site for active TB in 2021 and accounted for 65.8% (n=1,052/1,600) of all cases for which data were available (Table 4). Among non-respiratory TB cases, peripheral lymph nodes were the most common diagnostic site (12.4%; n=199/1,600). For other forms of respiratory and non-respiratory TB, the proportion for each category was much lower and did not exceed 3.4% (n=54/1,600).
| Diagnostic Sites | Total | ||
|---|---|---|---|
| n | (%) | ||
| Respiratory TB | Pulmonary | 1,052 | 65.8% |
| Primary | 40 | 2.5% | |
| Pleurisy | 30 | 1.9% | |
| Other Respiratory | 22 | 1.4% | |
| Intrathoracic lymph nodes | 10 | 0.6% | |
| Respiratory TB Subtotal | 1,154 | 72.1% | |
| Non-Respiratory TB | Peripheral Lymph Nodes | 199 | 12.4% |
| Intestines, Peritoneum & mesenteric glands | 54 | 3.4% | |
| Bones & Joints | 51 | 3.2% | |
| Other Specified Organs | 27 | 1.7% | |
| Other non-respiratory | 23 | 1.4% | |
| Eyes | 19 | 1.2% | |
| CNS & Meninges | 17 | 1.1% | |
| Skin | 16 | 1.0% | |
| Miliary | 15 | 0.9% | |
| Genito-urinary system | 15 | 0.9% | |
| Non-Respiratory TB Subtotal | 436 | 27.3% | |
| Unknown | Diagnostic Site Unknown | 10 | 0.6% |
| Total TB cases with reported diagnostic site | 1,600 | 100.0% | |
| Diagnostic Sites | Canadian-born | Persons born outside of Canada | Unknown country of birth | Total | ||||||||
|---|---|---|---|---|---|---|---|---|---|---|---|---|
| Indigenous | Non-Indigenous | Indigenous identity unspecified | ||||||||||
| n | (%) | n | (%) | n | (%) | n | (%) | n | (%) | n | (%) | |
| Respiratory TB | 202 | 87.1% | 38 | 76.0% | 35 | 89.7% | 713 | 67.6% | 166 | 74.1% | 1,154 | 72.1% |
| Non-Respiratory TB | 25 | 10.8% | 12 | 24.0% | 4 | 10.3% | 339 | 32.1% | 56 | 25.0% | 436 | 27.3% |
| Unknown | 5 | 2.2% | 0 | 0.0% | 0 | 0.0% | 3 | 0.3% | 2 | 0.9% | 10 | 0.6% |
| Total TB cases reporting on diagnostic site | 232 | 14.5% | 50 | 3.1% | 39 | 2.4% | 1,055 | 65.9% | 224 | 14.0% | 1,600 | 100.0% |
Examining diagnostic sites for active TB by population group, respiratory TB was the most common form of TB across all groups in 2021 (72.1%; n=1,154/1,600). The proportion of respiratory cases was 87.1% (n=202/232) for Indigenous Peoples, 76.0% (n=38/50) for the non-Indigenous Canadian-born population and 67.6% (n=713/1,055) for persons born outside of Canada. Non-respiratory forms of TB were more common among individuals born outside of Canada (32.1%; n=339/1,055). Country of birth was unknown for 14.0% (n=224/1,600) of TB cases with reported diagnostic site in 2021, and among these, respiratory sites were the most predominant at 74.1% (n=166/224) (Table 5).
Drug-resistance
Data on drug-resistance was collected through the CTBLSS. In 2021, drug susceptibility testing was performed on 1,536 MTB isolates, and most cases (90.1%; n=1,384) were susceptible to first line drugs for the treatment of TB. Resistance to any TB drug was detected in 9.9% (n=152) of isolates. Mono-resistance was detected in 131 isolates (8.4%), poly-resistance in four isolates (0.3%), MDR-TB in 16 isolates (1.0%) and XDR-TB in one isolate (0.1%) (Figure 7). Between 2012 and 2021, XDR-TB was detected in five isolates (Table 6). Overall, there has been little change in drug resistance patterns since 2012.
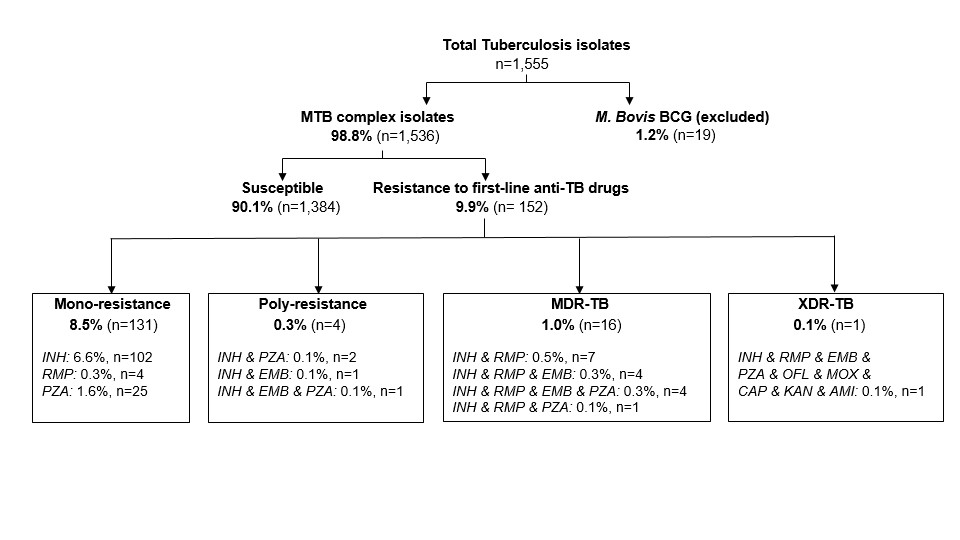
Figure 7 - Text description
Flow chart of the number of Mycobacterium tuberculosis (MTB) isolates tested for drug susceptibility, as reported to the CTBLSS in 2021. A total of 1,555 TB isolates were tested, of which 1,536 were identified as MTB complex and subsequently tested for drug susceptibility, while 19 were identified as Mycobacterium bovis and excluded from further testing. Among MTB isolates, 1,384 (90.1%) were susceptible and 152 (9.9%) were resistant to first line drugs.
The following table summarizes the type of drug resistance identified in 152 isolates with resistance to first line drugs:
| Type of drug resistance | Number of MTB isolates | Percentage |
|---|---|---|
| Mono-resistance | 131 | 8.5% |
| Poly-resistance | 4 | 0.3% |
| Multidrug-resistance | 16 | 1.0% |
| Extensive drug resistance | 1 | 0.1% |
The following table summarizes the type of TB drug resistance in 131 mono-resistant isolates:
| Drug type | Number of MTB isolates | Percentage |
|---|---|---|
| Isoniazid | 102 | 6.6% |
| Rifampin | 4 | 0.3% |
| Pyrazinamide | 25 | 1.6% |
The following table summarizes the type of TB drug resistance in 4 poly-resistant isolates:
| Drug type | Number of MTB isolates | Percentage |
|---|---|---|
| Isoniazid & Pyrazinamide | 2 | 0.1% |
| Isoniazid & Ethambutol | 1 | 0.1% |
| Isoniazid & Ethambutol & Pyrazinamide | 1 | 0.1% |
The following table summarizes the type of TB drug resistance in 16 multidrug-resistant isolates:
| Drug type | Number of MTB isolates | Percentage |
|---|---|---|
| Isoniazid & Rifampin | 7 | 0.5% |
| Isoniazid & Rifampin & Ethambutol | 4 | 0.3% |
| Isoniazid & Rifampin & Ethambutol & Pyrazinamide | 4 | 0.3% |
| Isoniazid & Rifampin & Pyrazinamide | 1 | 0.1% |
The following table summarizes the type of TB drug resistance in 1 extensively drug-resistant isolate:
| Drug type | Number of MTB isolates | Percentage |
|---|---|---|
| Isoniazid & Rifampin & Ethambutol & Pyrazinamide & Ofloxacin & Moxifloxacin & Capreomycin & Kanamycin & Amikacin | 1 | 0.1% |
Notes: MDR-TB, multi-drug resistance; XDR-TB, extensive drug resistance; INH, Isoniazid; RMP, Rifampin; PZA, pyrazinamide; EMB, Ethambutol; OFL, ofloxacin; MOX, moxifloxacin; CAP, capreomycin; KAN, kanamycin; AMI, amikacin.
| 2012 | 2013 | 2014 | 2015 | 2016 | 2017 | 2018 | 2019 | 2020 | 2021 | ||
|---|---|---|---|---|---|---|---|---|---|---|---|
| Mono-resistant | n | 128 | 93 | 107 | 114 | 108 | 101 | 121 | 146 | 131 | 131 |
| % | 9.1% | 6.8% | 7.8% | 8.5% | 7.4% | 6.6% | 8.3% | 9.0% | 8.2% | 8.5% | |
| Poly-resistant | n | 2 | 4 | 4 | 3 | 5 | 6 | 5 | 5 | 7 | 4 |
| % | 0.1% | 0.3% | 0.3% | 0.2% | 0.3% | 0.4% | 0.3% | 0.3% | 0.4% | 0.3% | |
| MDR | n | 9 | 15 | 19 | 22 | 17 | 14 | 22 | 20 | 15 | 16 |
| % | 0.6% | 1.0% | 1.3% | 1.6% | 1.2% | 0.9% | 1.4% | 1.2% | 0.9% | 1.0% | |
| XDR | n | 1 | 1 | 1 | 0 | 0 | 0 | 1 | 0 | 0 | 1 |
| % | 0.1% | 0.1% | 0.1% | 0.0% | 0.0% | 0.0% | 0.1% | 0.0% | 0.0% | 0.1% | |
While CTBLSS is the most complete source of TB-drug resistance data, this data is also collected in the CTBRS. The CTBRS provides an indication of patterns of resistance by population group. Among drug resistant TB cases with reported population group (n=73), in 2021, 87.7% (n=64) of isolates were reported in persons born outside Canada. Another 2.7% (n=2) of isolates resistant to TB drugs occurred in the Indigenous group and 9.6% (n=7) were reported for the non-Indigenous Canadian-born group (Figure 8).
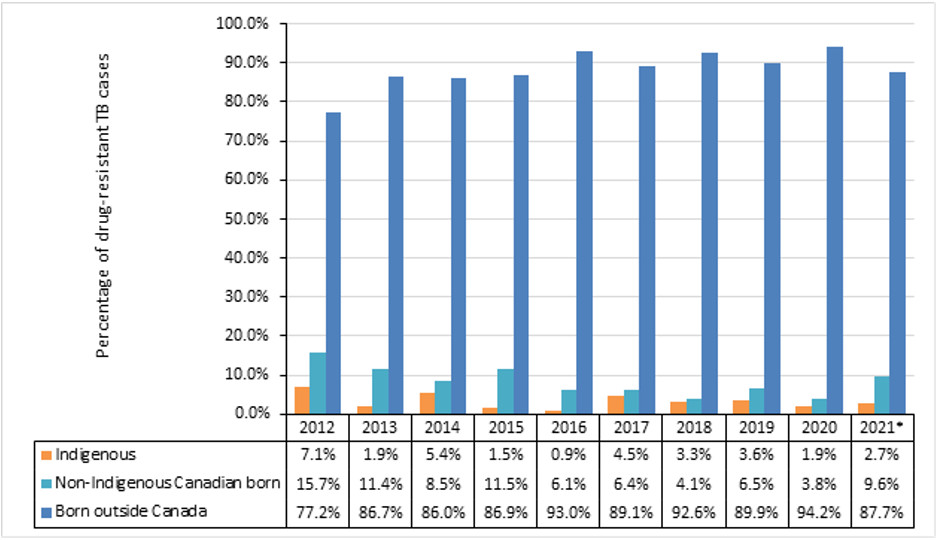
Figure 8 - Text description
| Population group | 2012 | 2013 | 2014 | 2015 | 2016 | 2017 | 2018 | 2019 | 2020 | 2021Footnote * |
|---|---|---|---|---|---|---|---|---|---|---|
| Indigenous | 7.1% | 1.9% | 5.4% | 1.5% | 0.9% | 4.5% | 3.3% | 3.6% | 1.9% | 2.7% |
| Non-Indigenous Canadian born | 15.7% | 11.4% | 8.5% | 11.5% | 6.1% | 6.4% | 4.1% | 6.5% | 3.8% | 9.6% |
| Born outside Canada | 77.2% | 86.7% | 86.0% | 86.9% | 93.0% | 89.1% | 92.6% | 89.9% | 94.2% | 87.7% |
|
||||||||||
Note: *2021 data were not available for Quebec.
2016-2021 data were not available for BC Indigenous identity and the non-Indigenous Canadian born.
Proportions for 2021 are based on the total drug resistant TB cases with reported population (n=73).
TB treatment outcomes
Treatment outcomes for active TB cases in Canada between 2011 and 2020 are presented in Table 7. In 2021, TB treatment outcome data on 1,551 active TB cases (outcome data for cases identified in the 2020 surveillance year) were submitted to the CTBRS. Treatment was successful for 76.1% of these cases (n=1,181), meaning they were either cured or successfully completed the full course of treatment prescribed. Treatment failure was reported in only 0.3% (n=5) of cases. About 5% (n=73) of cases were still receiving ongoing treatment, and 9.4% (n=146) were not evaluated at the time of data submission to PHAC. This latter group includes cases that were 'transferred out' meaning they were diagnosed and reported in a particular province/territory but moved out of that province/territory prior to treatment completion. Although TB care and treatment is often transferred and completed in the new province/territory of residence, due to the nature of the reporting, the outcomes of these patients are often not reported to the national surveillance system.
The percentage of TB cases successfully treated has been consistently below the ≥90% target recommended in the Canadian TB Standards for the past decade, ranging from 75.8% to 84.3%. However, it should be noted that treatment success excludes TB cases that were still undergoing treatment at the time of reporting, and cases where outcomes were not evaluated, and may be underestimated due to incomplete or underreporting of outcomes. The treatment failure rate remained very low over the past decade, at 0.1% to 0.6%.
| Treatment success | Treatment ongoing | Treatment failure | Died | Not evaluated | Lost to follow-up | Total cases reported | |||||||||||
|---|---|---|---|---|---|---|---|---|---|---|---|---|---|---|---|---|---|
| TB-related | TB-unrelated | Unknown | |||||||||||||||
| n | (%) | n | (%) | n | (%) | n | (%) | n | (%) | n | (%) | n | (%) | n | (%) | n | |
| 2011 | 1,228 | 75.8% | 48 | 3.0% | 4 | 0.2% | 103 | 6.4% | 32 | 2.0% | 5 | 0.3% | 195 | 12.0% | 6 | 0.4% | 1,621 |
| 2012 | 1,415 | 83.2% | 66 | 3.9% | 8 | 0.5% | 79 | 4.6% | 46 | 2.7% | 4 | 0.2% | 60 | 3.5% | 22 | 1.3% | 1,700 |
| 2013 | 1,378 | 83.5% | 62 | 3.8% | 10 | 0.6% | 82 | 5.0% | 33 | 2.0% | 11 | 0.7% | 58 | 3.5% | 17 | 1.0% | 1,651 |
| 2014 | 1,361 | 84.3% | 39 | 2.4% | 10 | 0.6% | 91 | 5.6% | 22 | 1.4% | 9 | 0.6% | 63 | 3.9% | 20 | 1.2% | 1,615 |
| 2015 | 1,382 | 84.1% | 31 | 1.9% | 4 | 0.2% | 107 | 6.5% | 25 | 1.5% | 10 | 0.6% | 66 | 4.0% | 18 | 1.1% | 1,643 |
| 2016 | 1,406 | 79.8% | 73 | 4.1% | 2 | 0.1% | 89 | 5.1% | 35 | 2.0% | 11 | 0.6% | 136 | 7.7% | 10 | 0.6% | 1,762 |
| 2017 | 1,484 | 81.0% | 71 | 3.9% | 1 | 0.1% | 90 | 4.9% | 20 | 1.1% | 18 | 1.0% | 126 | 6.9% | 21 | 1.1% | 1,831 |
| 2018 | 1,464 | 81.6% | 44 | 2.5% | 2 | 0.1% | 99 | 5.5% | 32 | 1.8% | 7 | 0.4% | 122 | 6.8% | 24 | 1.3% | 1,794 |
| 2019 | 1,519 | 79.1% | 82 | 4.3% | 7 | 0.4% | 69 | 3.6% | 35 | 1.8% | 16 | 0.8% | 153 | 8.0% | 40 | 2.1% | 1,921 |
| 2020Footnote * | 1,181 | 76.1% | 73 | 4.7% | 5 | 0.3% | 78 | 5.0% | 21 | 1.4% | 23 | 1.5% | 146 | 9.4% | 24 | 1.5% | 1,551 |
|
|||||||||||||||||
TB related deaths
Among the 1,551 active TB cases reported in 2020, there were 122 (7.9%) individuals who died of any cause either before or during the prescribed TB treatment (Table 8). The majority (73.1%; n=57) of TB related deaths in 2020 were among individuals 65 years of age or older. For the remaining 21 TB related deaths, 20 (25.6%) involved persons 25 to 64 years of age, and one (1.3%) was in the 15- to 24-year-old age group. No TB related deaths were reported among pediatric cases younger than 15 years of age (Table 8).
TB was the underlying cause or a contributing factor for 78 (63.9%) of the 122 deaths. In 2020, the case fatality rate was 5% (n=78/1,551). TB case fatality has remained relatively stable between 2011 and 2020, ranging between 4.6% and 6.5%, except for a slightly lower rate of 3.6% in 2019 (Figure 9).
| Age Group | TB caused or contributed to death | Death not related to TB | Unknown if TB contributed to death | Total | ||||
|---|---|---|---|---|---|---|---|---|
| n | % | n | % | n | % | n | % | |
| <15 years old | 0 | 0.0% | 0 | 0.0% | 0 | 0.0% | 0 | 0.0% |
| 15-24 years old | 1 | 1.3% | 1 | 4.8% | 1 | 4.3% | 3 | 2.5% |
| 25-64 years old | 20 | 25.6% | 8 | 38.1% | 7 | 30.4% | 35 | 28.7% |
| 65+ years old | 57 | 73.1% | 23 | 57.1% | 15 | 65.2% | 84 | 68.9% |
| All ages | 78 | 63.9% | 21 | 17.2% | 23 | 18.9% | 122 | 100% |
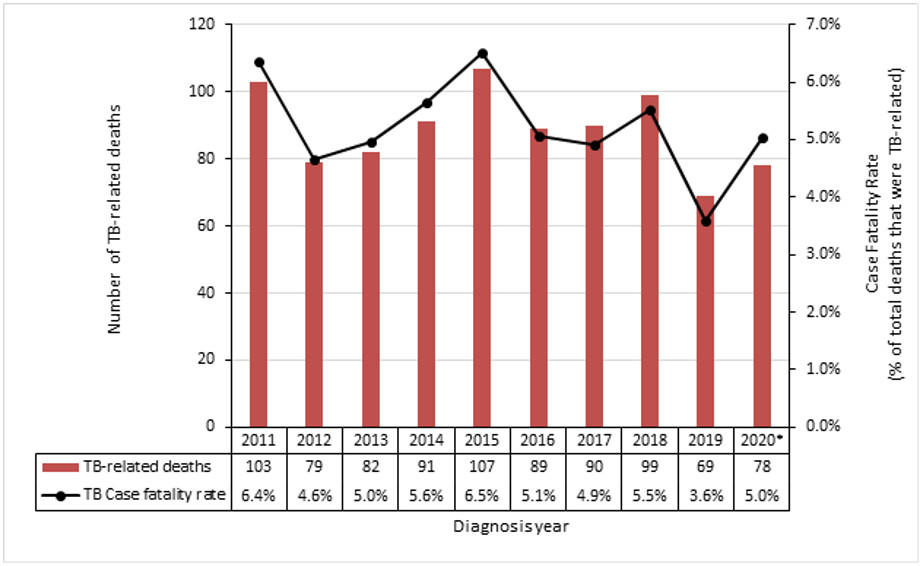
Figure 9 - Text description
| 2011 | 2012 | 2013 | 2014 | 2015 | 2016 | 2017 | 2018 | 2019 | 2020Footnote * | |
|---|---|---|---|---|---|---|---|---|---|---|
| TB-related deaths | 103 | 79 | 82 | 91 | 107 | 89 | 90 | 99 | 69 | 78 |
| TB case fatality rate | 6.4% | 4.6% | 5.0% | 5.6% | 6.5% | 5.1% | 4.9% | 5.5% | 3.6% | 5.0% |
|
||||||||||
Note: *2021 data were not available for Quebec.
Individuals born outside Canada accounted for 73.1% (n=57) of all TB-related deaths (Table 9), compared with 1.3% (n=1) of deaths reported among non-Indigenous Canadian-born persons, and 11.5% (n=9) of deaths among Indigenous Peoples. Information on population group was not available on 11.5% (n=9) of deaths reported (Table 9).
| Age group | Born outside Canada | Canadian-born | Unknown | Total | ||||||||
|---|---|---|---|---|---|---|---|---|---|---|---|---|
| Non-Indigenous | Indigenous | Unknown Indigenous identity | ||||||||||
| n | % | n | % | n | % | n | % | n | % | n | % | |
| <15 years old | 0 | 0.0% | 0 | 0.0% | 0 | 0.0% | 0 | 0.0% | 0 | 0.0% | 0 | 0.0% |
| 15-24 years old | 1 | 1.8% | 0 | 0.0% | 0 | 0.0% | 0 | 0.0% | 0 | 0.0% | 1 | 1.3% |
| 25-64 years old | 12 | 21.0% | 1 | 100% | 3 | 33.3% | 1 | 50.0% | 3 | 33.3% | 20 | 25.6% |
| 65+ years old | 44 | 77.2% | 0 | 0.0% | 6 | 66.7% | 1 | 50.0% | 6 | 66.7% | 57 | 73.1% |
| Total | 57 | 73.1% | 1 | 1.3% | 9 | 11.5% | 2 | 2.6% | 9 | 11.5% | 78 | 100% |
Conclusion
The overall incidence of TB in Canada remained unchanged in 2021 at 4.8 per 100,000, with rates having plateaued at this level for well over a decade. This is notably above the pre-elimination target of less than one TB case per 100,000 population by 2035. In Canada, data on mortality was available until 2020. The case fatality rates remained relatively stable at 5.0%, with most deaths reported in individuals aged 65 years and older. Epidemiological trends during the pandemic period must be interpreted with caution given data completeness concerns for the 2021 TB cases and 2020 treatment outcomes. There is a recognized need for collaborative action across jurisdictions and sectors to accelerate progress towards Canada's TB elimination goals Footnote 5.
The COVID-19 pandemic impacted global TB incidence and mortality. Globally, estimated TB incidence increased in 2021 by 3.6% following almost two decades of consistent declines of about 2% per yearFootnote 1. Global TB mortality also increased slightly in 2021 (20 deaths per 100,000 compared to 19 deaths per 100,000 in 2019), after almost 20 years of steady declineFootnote 1. The full impact of COVID-19 pandemic disruptions on TB services and care, decreased capacity for contact follow-up, decreased screening, and decreased surveillance reporting are yet to be fully appreciated and will require close monitoring of TB rates in the years to come.
In Canada, the incidence of active TB remains markedly and unacceptably high among Indigenous Peoples, with the highest rate reported for Inuit. By proportion, Indigenous Peoples were disproportionately impacted, representing 16.9% of all TB cases in Canada. Social equity remains at the heart of the substantial gap in incidence rates between Indigenous Peoples and other population groups. Addressing the social determinants of health and developing strategies that are led by the impacted communities will continue to be essential. There are many stories of strength and hope as exemplified by the leadership by the Inuit Tapiriit Kanatami (ITK) in developing and operationalizing the Inuit TB Elimination Framework, anchored in principles including respect, commitment to health equity, and meaningful involvement of Inuit and Inuit communities.
Additionally, individuals born outside of Canada are significantly impacted by TB and continue to account for the largest proportion of cases in Canada at 76.7% in 2021, a trend which has been consistently observed over the past decade. As with many low-incidence countries, migration dynamics, including the planned increase in immigration in Canada, might influence trends in TB epidemiology moving forward. Addressing the unique needs of persons immigrating to Canada as highlighted in the WHO's Towards TB elimination: an action framework in low-incidence countries, will be a critical priority action area to achieve TB elimination in Canada.
TB drug resistance increased globally in 2021, with a 3.1% increase in reported rates of rifampin-resistance and multidrug-resistance from 20201. Fortunately, drug resistance for TB has remained low in Canada over the past decade, at around 10% of TB cases having any resistance and consistently less than 2% of TB isolates being multidrug-resistant. However, patterns of increasing TB drug resistance on a global scale are of concern and further highlight the importance of addressing the unique health needs of migrants and people arriving to Canada.
In conclusion, TB is a preventable and treatable infectious disease that has a significant impact on individuals and families which can include but are not limited to stigma, drug related adverse events, loss of income, and mental health challenges. In the future, collaborative efforts will be required in Canada across federal, provincial, territorial, Indigenous and community partners to work towards elimination targeting four key areas:
- Enhancing current efforts to prevent and control TB disease.
- Facilitating identification and treatment of latent TB infection for those at highest risk.
- Championing collaborative action to address underlying TB risk factors.
- Ensuring approaches are community-driven with a health equity lens.
Appendix
| Province/Territory | Name | Organization |
|---|---|---|
| Newfoundland & Labrador |
|
Department of Health & Community Services |
| Prince Edward Island |
|
Public Health Office |
| Nova Scotia |
|
Department of Health & Wellness |
| New Brunswick |
|
Public Health New Brunswick |
| Quebec |
|
Montréal Public Health Department Quebec National Institute of Public Health |
| Ontario |
|
Public Health Ontario |
| Manitoba |
|
Manitoba Health, Seniors & Active Living |
| Saskatchewan |
|
Saskatchewan Health Authority |
| Alberta |
|
Alberta Health/ Alberta Health Services |
| British Columbia |
|
BC Centre for Disease Control |
| Northwest Territories |
|
Department of Health & Social Services |
| Nunavut |
|
Department of Health |
| Yukon Territories |
|
Yukon Communicable Disease Control |
| Province/Territory | Name | Organization |
|---|---|---|
| Newfoundland & Labrador |
|
Department of Health & Community Services |
| Prince Edward Island |
|
Public Health Office |
| Nova Scotia |
|
Department of Health & Wellness (Provincial Public Health Laboratory network) |
| New Brunswick |
|
Public Health New Brunswick (Saint John Regional Hospital) |
| Quebec |
|
Quebec National Institute of Public Health (Quebec Public Health Laboratory) |
| Ontario |
|
Public Health Ontario (Public Health Ontario Laboratory) |
| Manitoba |
|
Manitoba Health, Seniors & Active Living (Diagnostic Services, Shared Health) |
| Saskatchewan |
|
Saskatchewan Health Authority (Saskatchewan Disease Control Laboratory) |
| Alberta |
|
Alberta Health Services |
| British Columbia |
|
BC Centre for Disease Control (BCCDC Public Health Laboratory) |
| Nunavut |
|
Department of Health (Qikiqtani General Hospital) |
| Yukon Territories |
|
Yukon Communicable Disease Control |
| Northwest Territories |
|
Department of Health & Social Services (Stanton Territorial Hospital) |
| Branch/Centre | Name |
|---|---|
| National Microbiology Laboratory |
|
| Infectious Disease and Vaccination Programs Branch, Centre for Communicable Diseases and Infection Control |
|
References
- Footnote 1
-
World Health Organization. Global tuberculosis report 2022. Geneva (CH): World Health Organization; 2022. https://www.who.int/teams/global-tuberculosis-programme/tb-reports/global-tuberculosis-report-2022 (Accessed April 17, 2023).
- Footnote 2
-
Canadian Tuberculosis Standards - 8th Edition. Canadian Journal of Respiratory, Critical Care, and Sleep Medicine. 2022, Vol. 6, no. s1. https://www.tandfonline.com/toc/ucts20/6/sup1 (Accessed April 17, 2023).
- Footnote 3
-
Statistics Canada. Table 98-10-0302-01 Immigrant status and period of immigration by place of birth and citizenship: Canada, provinces and territories and census metropolitan areas with parts. DOI: https://doi.org/10.25318/9810030201-eng
- Footnote 4
-
Statistics Canada. Custom projection based on "Projections of the Indigenous populations and households in Canada, 2016 to 2041: Overview of data sources, methods, assumptions and scenarios". Catalogue no. 17-20-0001. https://www150.statcan.gc.ca/n1/en/catalogue/172000012021001
- Footnote 5
-
Public Health Agency of Canada. The time is now - Chief Public Health Officer spotlight on eliminating tuberculosis in Canada. https://www.canada.ca/en/public-health/corporate/publications/chief-public-health-officer-reports-state-public-health-canada/eliminating-tuberculosis.html (Accessed on April 17, 2023).