
Canadian Antimicrobial Resistance Surveillance System Report 2021
Download in PDF format
(PDF format 6.34 MB, 90 pages)
Contact us: carss-scsra@phac-aspc.gc.ca
Organization: Public Health Agency of Canada
Published: 2022-04-04
Table of contents
- Glossary
- Introduction
- Executive summary
- Key findings
- Technical annex
- Methicillin-resistant Staphylococcus aureus bloodstream infections
- Vancomycin-resistant Enterococcus (VRE) bloodstream infections
- Carbapenemase-producing Enterobacterales (CPE) infections and colonization
- Clostridioides difficile infections (CDI)
- Neisseria gonorhoeae (GC) infections
- Mycobacterium tuberculosis (TB) infections
- Invasive Streptococcus pneumonia diseases (IPD)
- Invasive Streptococcus pyogenes (group A Streptococcus) infections
- Antimicrobial consumption by humans, Canada 2015-2019
- Key findings
- Overall antimicrobial consumption by humans: National perspective
- Overall antimicrobial consumption by humans: Canadian jurisdiction
- Overall antimicrobial consumption by humans: Top 5 antimicrobial classes
- Overall antimicrobial consumption by humans: AWaRe categorization
- Overall antimicrobial consumption by humans: International perspective
- Antimicrobial consumption by humans in the community sector: Defined daily doses
- Antimicrobial consumption by humans in the community sector: Prescriptions filled
- Antimicrobial consumption by humans in the community sector: Prescription origin
- Antimicrobial consumption by humans in the community sector: Carbapenems dispensed
- Antimicrobials purchased by the hospital sector: Defined daily doses
- Antimicrobial prescribing in the community sector, before and during the COVID-19 pandemic
- Antimicrobials intended for use in animals in Canada
- Authors
- Appendices
- Footnotes
- References
Glossary
- AMR
- Antimicrobial resistance
- AMU
- Antimicrobial use
- ARO
- Antimicrobial-resistant organism
- AST
- Antimicrobial susceptibility testing
- ATC
- Anatomical therapeutic chemical
- BSI
- Bloodstream infection
- CA
- Community-associated
- CAHI
- Canadian Animal Health Institute
- CARSS
- Canadian Antimicrobial Resistance Surveillance System
- CDI
- Clostridioides difficile infection
- CIPARS
- Canadian Integrated Program for Antimicrobial Resistance Surveillance
- CNDSS
- Canadian Notifiable Disease Surveillance System
- CNISP
- Canadian Nosocomial Infection Surveillance Program
- CPE
- Carbapenemase-producing Enterobacteriaceae
- CTBLSS
- Canadian Tuberculosis Laboratory Surveillance System
- DDD
- Defined Daily Dose
- DDDvetCA
- Veterinarian-Defined Daily Dose Canadian standard
- ESAC-Net
- European Surveillance of Antimicrobial Consumption Network
- eSTREP
- National Laboratory Surveillance of Invasive Streptococcal Disease
- ESVAC
- European Surveillance of Veterinary Antimicrobial Consumption
- GAS
- Group A Streptococcus pyogenes
- GASP–Canada
- Gonococcal Antimicrobial Surveillance Program – Canada
- HA
- Healthcare-associated
- Kg
- Kilogram
- KPC
- Klebsiella pneumoniae carbapenemase
- MDR
- Multidrug-resistant
- mg/PCU
- Milligrams per population correction unit
- MIC
- Minimum inhibitory concentration
- MLST
- Multi-locus sequence typing
- MRSA
- Methicillin-resistant Staphylococcus aureus
- NAP
- North American pulse type
- NDM
- New Delhi metallo-β-lactamase
- NIHB
- Non-Insured Health Benefits
- NML
- National Microbiology Laboratory
- OXA
- Oxacillinase
- PCU
- Population corrected unit
- PHAC
- Public Health Agency of Canada
- PMRA
- Pest Management Regulatory Agency
- SME
- Serratia marcescens enzyme
- ST
- Sequence type
- TB
- Tuberculosis (Mycobacterium tuberculosis)
- VRE
- Vancomycin-resistant Enterococcus
- WHO
- World Health Organization
- XDR
- Extensively drug-resistant
Introduction
Antimicrobial resistance (AMR) is an increasing threat to global heath and is recognized by the World Health Organization and the United Nations as one of the top ten global health threats facing humanity. Globally, an estimated 4.95 million deaths in 2019 were associated with antimicrobial-resistant bacterial infections, of which 1.27 million deaths were directly attributable to AMR (Murray et al., 2022). In Canada, it was estimated that in 2018, over one-quarter of bacterial infections were resistant to at least one antibiotic and that 14,000 Canadian deaths were associated with AMR, of which AMR was directly responsible for 5,400 (Canadian Council of Academies, 2019). As increasing levels of AMR threaten the continued effectiveness of antimicrobial therapies, efforts must be made to develop and access new antimicrobials, as well as preserve the effectiveness of existing antimicrobials through improvements to their judicious use; otherwise, the delivery of common procedures, including chemotherapy, caesarian sections and invasive surgery, will be jeopardized.
The 2021 Canadian Antimicrobial Resistance Surveillance System (CARSS) report presents an integrated view of available national-level data on antimicrobial resistance (AMR) and antimicrobial use (AMU) generated by the Public Health Agency of Canada (PHAC) and its partners from human populations and animal populations. While it must be acknowledged that there is always opportunity to further strengthen the AMR and AMU data included in this report, data from these contributing surveillance systems can be used to detect changes in epidemiological trends over time associated with AMR in priority organisms and AMU in humans and animals.
Addressing AMR in Canada requires a coordinated multi-sectoral response from partners in government, human health, animal health, agri-food, industry, academia, professional associations and the general public. While there are many areas that warrant further attention in Canada, PHAC is committed to improving the surveillance of AMR and AMU in priority areas. This includes:
- Capturing AMR and AMU trends in key under-represented rural and remote regions by recruiting additional hospitals and expanding surveillance into regions that are currently not represented by PHAC data.
- Assessing the burden of AMR and the appropriateness of AMU in older Canadians, the highest prescribed age group by far, by gathering data from long-term care to further determine the risk posed for to this specific at-risk population group.
- Detecting and monitoring the spread of AMR in Canada by integrating diagnostic laboratory data generated by provincial, territorial and private public health partners to identify new AMR threats.
- Monitoring trends of AMU in populations through wastewater-based epidemiology to allow for more targeted trends analysis and interventions.
- Improving our knowledge of populations impacted by antimicrobial-resistant gonorrhea to better inform interventions and prevent further spread.
- Initiating the surveillance of AMR and AMU in the community setting through the use of de-identified electronic medical records to investigate the burden of AMR in the primary care setting and identity inappropriate prescribing practices.
- Improving the detection of AMR threats in the food chain by expanding agri-food surveillance to include beef and dairy cow farms, and increasing the number of retail meat-products tested for AMR.
The surveillance findings presented in this report largely reflect the pre-pandemic period. The effects of the COVID-19 pandemic on AMR and AMU in Canada are only now beginning to emerge, and are likely to be complex. For example, while outpatient AMU appears to have decreased in the early stages of the pandemic, the inappropriate use of antimicrobials (a primary driver of AMR) in acute-care settings may have increased as a result of real or perceived risks of COVID-19 bacterial co-infection. Additionally, risks associated with healthcare resource constraints (e.g. reallocated or insufficient staffing) may have limited AMR surveillance activities, preventing a timely response to potential AMR threats. Conversely, heightened infection prevention and control measures enacted to prevent the spread of COVID-19 may have the collateral benefit of preventing the spread of AMR, and the overall decrease in the number of Canadians admitted to hospitals may consequently reduce the frequency of healthcare-acquired infections. To date, the net effect of pandemic-related factors on the burden of AMR in Canada remains unknown.
Through the response to COVID-19, Canada has strengthened multi-sectoral collaboration and public health capacity, and is better positioned to address emerging and future public health threats, including AMR. The additional surveillance actions being undertaken will serve to further strengthen the gathering and analysis of AMR and AMU trends to inform the development of additional targeted interventions to address the growing threat posed by AMR.
Executive summary
This 2021 Canadian Antimicrobial Resistance Surveillance System (CARSS) report builds on previously published data and methodologies, prioritizing data acquired by the Public Health Agency of Canada and its partners on antimicrobial resistance and antimicrobial use in humans, animals and crops.
While most of the information in this report predates the COVID-19 pandemic, these data will contribute to the pre-COVID-19 trends of AMR and AMU in Canada and will come to serve as an important reference for future analyses.
Summary of results between 2015 and 2019 (unless otherwise stated)
Antimicrobial resistance in humans:
Resistance rates increased for 3 of the 4 priority organisms monitored in hospitalized inpatients: methicillin-resistant Staphylococcus aureus (MRSA) bloodstream infections (BSI), vancomycin-resistant Enterococcus (VRE)-BSI and carbapenemase-producing Enterobacterales (CPE); but decreased for Clostridioides difficile infection.
Other trends of specific concern include:
- While MRSA-BSIs have traditionally been associated with hospitalizations, the rate of community-associated MRSA-BSIs more than doubled.
- The number of patients testing positive for CPE (with or without signs of infection) increased by 250%.
For infections typically acquired in the community sector, the main concern is a 44% increase in the rate of multidrug-resistant gonorrhoea.
Other trends include:
- The proportion of vaccine-preventable (PCV-13) multidrug-resistant invasive Streptococcus pneumoniae infections increased by 25% (2014 to 2018), but remained universally susceptible to penicillin.
- Rates of AMR in culture-positive Mycobacterium tuberculosis remained stable.
Antimicrobial use in humans:
Overall, antimicrobial use (AMU) decreased by 5%, however there are some areas of concern:
- Antimicrobial prescribing in seniors aged 80 years or more increased by 13%.
- The community use of carbapenems, the broadest spectrum antimicrobials available, increased by 68%.
- The per capita consumption of "Reserve" category antimicrobialsFootnote 1 increased by 2%.
Antimicrobial prescribing in the community sector during the first 8 months of the COVID-19 pandemic was lower compared to previous years. This trend appears to be related to a decrease in the number of physician visits during this time.
- The overall rate of antimicrobial prescribing decreased by up to 40%.
- The largest decrease in the rate of antimicrobial prescribing was observed in the pediatric populations (by 70%); however, the rate of antimicrobial prescribing in seniors (aged 80 years or more) only decreased by 28%.
Antimicrobial use in animalsFootnote 2:
In 2019, approximately 1 million kilograms of antimicrobials were sold for use in animals, which represents 78% of all antimicrobials distributed in Canada (compared to 79% in 2018). Other trends include:
- Overall, the tonnage of active antimicrobial ingredients sold for use in production animals decreased by 11% between 2018 and 2019.
- Adjusted for animal populations and weights, animals in Canada consumed nearly 3-times as many antibiotics in 2019 compared to the median value reported by 31 European countries in 2018.
Key findings
This trend summary provides a high-level interpretation drawn from clinical, epidemiological and/or resistance information available at the time of publication. More information can be found in the Technical annex.
Trend summary
| Topic | Reporting years | Trend |
|---|---|---|
| Methicillin-resistant Staphylococcus aureus (MRSA) bloodstream infections | 2015-2019 | Getting Worse |
| Vancomycin-resistant Enterococcus (VRE) bloodstream infections | 2015-2019 | Getting Worse |
| Carbapenemase-producing Enterobacterales (CPE) infection and colonization | 2015-2019 | Getting Worse |
| Clostridioides difficile infections (CDI) | 2015-2019 | Getting Better |
| Neisseria Gonorrhoeae (GC) infections | 2015-2019 | Getting Worse |
| Drug-resistant Mycobacterium tuberculosis (TB) infections | 2015-2019 | Stable |
| Invasive Streptococcus pneumoniae diseases (IPD) | 2014-2018 | Getting Worse |
| Invasive Streptococcus pyogenes infections (Group A Streptococcus) | 2014-2018 | Stable |
| Antimicrobial use in humans | 2015-2019 | Caution |
| Antimicrobials intended for use in animals | 2015-2019 | Caution |
| Impact of COVID-19 on antimicrobial use in humans | 2019-2020 | Trending down |
Methicillin-resistant Staphylococcus aureus (MRSA) bloodstream infections (BSI): 2015-2019
- The rate of methicillin-resistant Staphylococcus aureus (MRSA) bloodstream infections (BSI) increased by 57%, driven by a 125% increase in community-associated (CA)-MRSA.
- 18% of MRSA-BSI cases died within 30 days of diagnosis (all-cause mortality).
- All MRSA blood isolates remained susceptible to linezolid and vancomycin. Resistance remained high for clindamycin, erythromycin and resistance to tetracycline doubled.
In total:
- 61 to 69 reporting hospitals
- 3,333 MRSA-BSI cases
- 589 deaths
Source:
- The Canadian Nosocomial Infection Surveillance Program (CNISP)
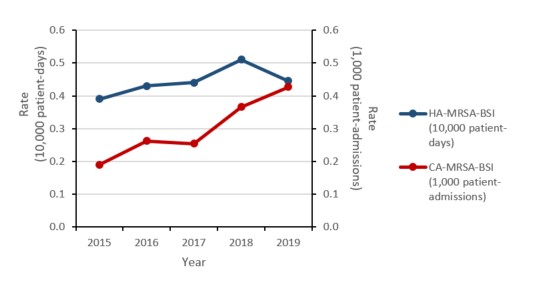
Figure a: Text description
| Year | 2015 | 2016 | 2017 | 2018 | 2019 |
|---|---|---|---|---|---|
| HA-MRSA-BSI (10,000 patient-days) |
0.39 | 0.43 | 0.44 | 0.51 | 0.45 |
| CA-MRSA-BSI (1,000 patient-admissions) |
0.19 | 0.26 | 0.25 | 0.37 | 0.43 |
Vancomycin-resistant Enterococcus (VRE) bloodstream infections (BSI): 2015-2019
- The rate of healthcare-associated (HA) VRE-BSI doubled.
- Daptomycin resistance increased from 0.0% in 2015 to 4.3% in 2019
- 34% of HA-VRE-BSI cases died within 30 days of diagnosis (all-cause mortality).
In total:
- 57 to 68 reporting hospitals
- 773 HA-VRE-BSI cases
- 275 deaths
Source:
- The Canadian Nosocomial Infection Surveillance Program (CNISP)
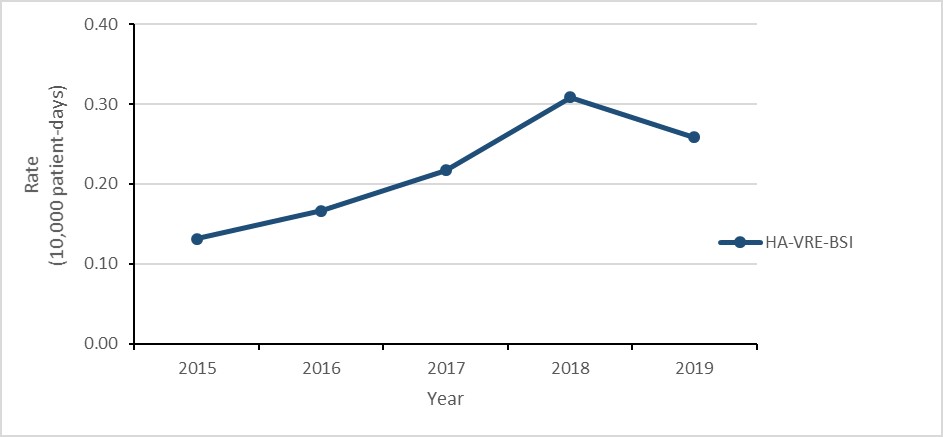
Figure b: Text description
| Year | 2015 | 2016 | 2017 | 2018 | 2019 |
|---|---|---|---|---|---|
| HA-VRE-BSI | 0.13 | 0.17 | 0.22 | 0.31 | 0.26 |
Carbapenemase-producing Enterobacterales (CPE) infections and colonization: 2015-2019
- The rate of healthcare-associated (HA) CPE colonization tripled.
- While the number of HA-CPE infections remained low, the rate of HA-CPE infection more than doubled.
- 21% of patients with HA-CPE infection died within 30 days of diagnosis (all-cause mortality).
- CPE remains highly resistant to most antimicrobials.
In total:
- 58 to 72 reporting hospitals
- 110 HA-CPE infections
- 23 deaths
Source:
- The Canadian Nosocomial Infection Surveillance Program (CNISP)
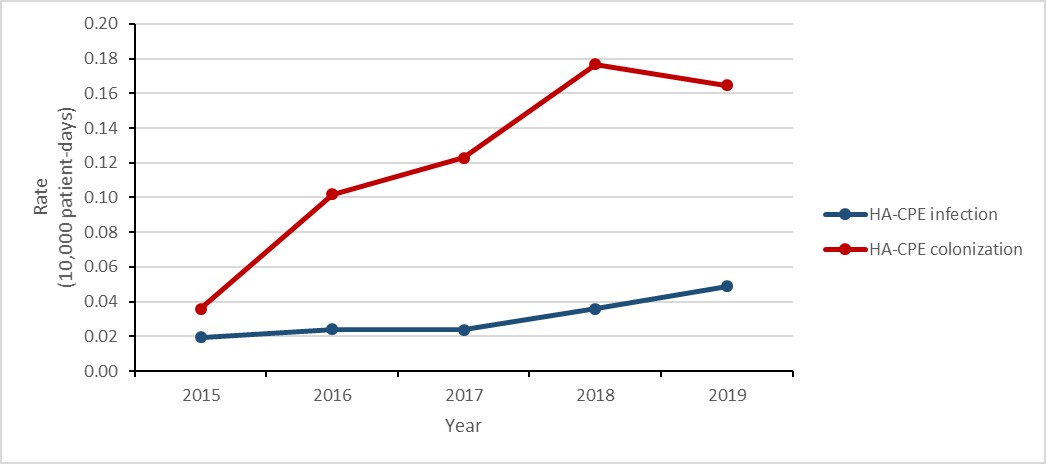
Figure c: Text description
| Year | 2015 | 2016 | 2017 | 2018 | 2019 |
|---|---|---|---|---|---|
| HA-CPE infection | 0.02 | 0.02 | 0.02 | 0.04 | 0.05 |
| HA-CPE colonization | 0.04 | 0.10 | 0.12 | 0.18 | 0.16 |
Clostridioides difficile infections (CDI): 2015-2019
- The rate of healthcare-associated (HA) Clostridioides difficile infections (CDI decreased by 22%.
- 2.4% of HA-CDI cases died within 30 days of diagnosis (attributable mortality).
- The rate of community-associated (CA) CDI decreased by 22%.
In total:
- 66 to 73 reporting hospitals
- 19,579 CDI cases (HA + CA)
- 1,684 deaths (estimated)
- 450 attributable to CDI (estimated)
Source:
- The Canadian Nosocomial Infection Surveillance Program (CNISP)
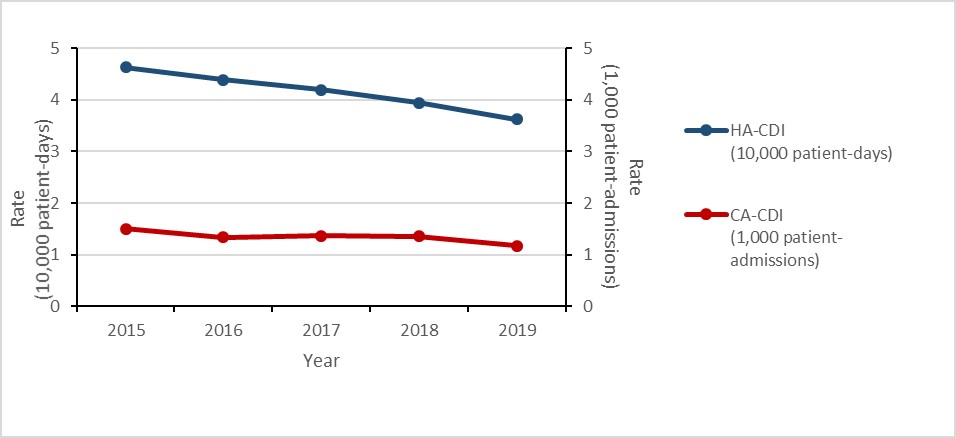
Figure d: Text description
| Year | 2015 | 2016 | 2017 | 2018 | 2019 |
|---|---|---|---|---|---|
| HA-CDI (10,000 patient-days) | 4.63 | 4.39 | 4.19 | 3.94 | 3.62 |
| CA-CDI (1,000 patient-admissions) | 1.50 | 1.34 | 1.37 | 1.36 | 1.17 |
Neisseria Gonorrhoeae infections: 2015-2019
- The rate of gonorrhea infection increased by 70%.
- The proportion of cultured multidrug-resistant (MDR) Neisseria gonorrhoeae (GC) isolates increased by 44%
- Eleven cases of extensively drug-resistant (XDR) gonococci were identified in Canada
In total:
- 142,633 reported cases
- 24,484 tested for AMR
- 2,489 MDR cases
Source: The Gonococcal Antimicrobial Surveillance Program (GASP-Canada) and the Canadian Notifiable Disease Surveillance System
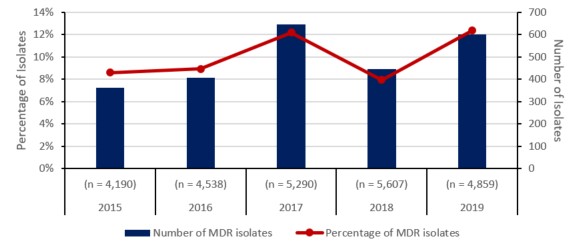
Figure e: Text description
| Year | 2015 | 2016 | 2017 | 2018 | 2019 |
|---|---|---|---|---|---|
| Total isolates tested (n) | (n = 4,190) | (n = 4,538) | (n = 5,290) | (n = 5,607) | (n = 4,859) |
| Number of MDR isolates | 361 | 406 | 645 | 446 | 601 |
| Percentage of MDR isolates | 9% | 9% | 12% | 8% | 12% |
Drug-resistant Mycobacterium tuberculosis (TB) infections: 2015-2019
- The rate of TB infection in Canada remained stable at approximately 4.8 cases per 100,000 population.
- The proportion of culture-positive TB isolates resistant to one or more anti-TB drug was 10% in 2019.
- The proportion of multidrug-resistant (MDR) culture-positive TB isolatesFootnote 3 was 1.3% in 2019.
- Only one case of extensively drug-resistant (XDR) TB has been reported since 2015.
In total:
- 7,361 TB cases
- 701 resistant culture-positive TB cases
- 95 multidrug-resistant (MDR-TB) cases
Source:
- The Canadian Tuberculosis Laboratory Surveillance Program (CTBLSS)
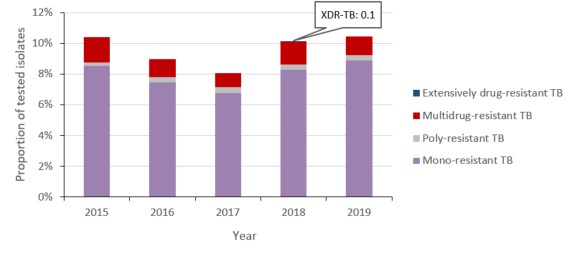
Figure f: Text description
| Year | 2015 | 2016 | 2017 | 2018 | 2019 |
|---|---|---|---|---|---|
| Mono-resistant TB | 8.5% | 7.4% | 6.8% | 8.3% | 8.9% |
| Poly-resistant TB | 0.2% | 0.3% | 0.4% | 0.3% | 0.3% |
| Multidrug-resistant TB | 1.6% | 1.2% | 0.9% | 1.4% | 1.2% |
| Extensively drug-resistant TB | 0.0% | 0.0% | 0.0% | 0.1% | 0.0% |
Streptococcus pneumoniae - invasive pneumococcal diseases (IPD): 2014-2018
- The rate of invasive pneumococcal disease (IPD) increased from 9.0 to 10.9 cases per 100,000 population.
- The proportion of multidrug resistance (i.e. Streptococcus pneumoniae isolates resistant to three or more classes of antimicrobials) identified in vaccine preventable (PCV13) IPD cases increased by 25%, from 9.2% to 11.5%.
- The proportion of multidrug resistant (MDR) isolates identified in non-vaccine preventable (non-PCV13) IPD cases increased by 74%.
In total:
- 17,182 cases of IPD
- 1,220 cases of MDR-IPD (estimated)
Source:
- The National Surveillance of Invasive Streptococcal Disease (eSTREP) and the Canadian Notifiable Disease Surveillance System (CNDSS)
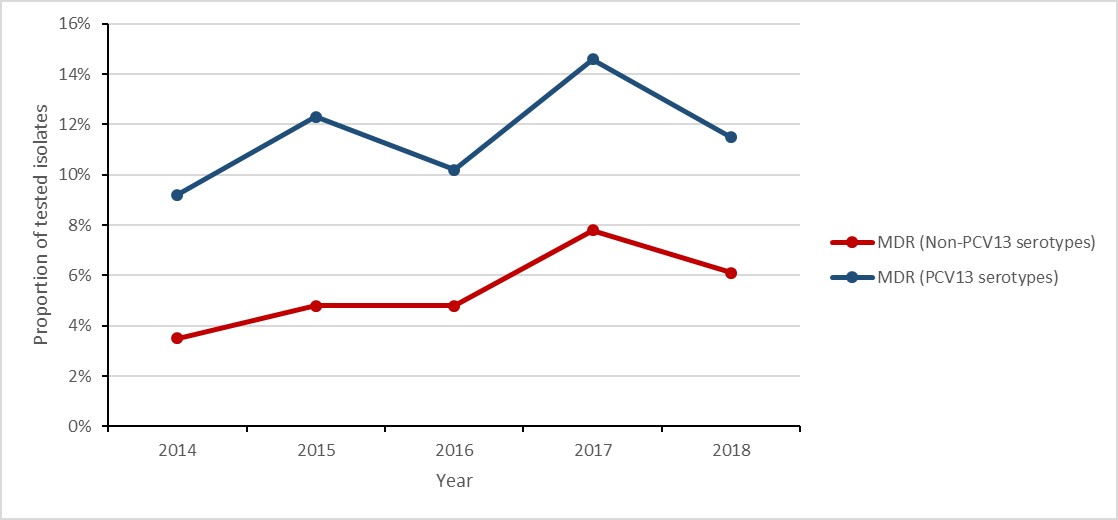
Figure g: Text description
| Year | 2014 | 2015 | 2016 | 2017 | 2018 |
|---|---|---|---|---|---|
| MDR (PCV13 serotypes) | 9.2% | 12.3% | 10.2% | 14.6% | 11.5% |
| MDR (Non-PCV13 serotypes) | 3.5% | 4.8% | 4.8% | 7.8% | 6.1% |
Invasive Streptococcus pyogenes – Group A Streptococcus (iGAS) infections: 2014-2018
- The rate of invasive Group A Streptococcus (iGAS) infections increased by 65%.
- All Streptococcus pyogenes isolatestested were susceptible to penicillin.
In total:
- 11,310 cases of GAS
- 0 cases resistant to penicillin
Source:
- The National Surveillance of Invasive Streptococcal Disease (eSTREP) and the Canadian Notifiable Disease Surveillance System (CNDSS)
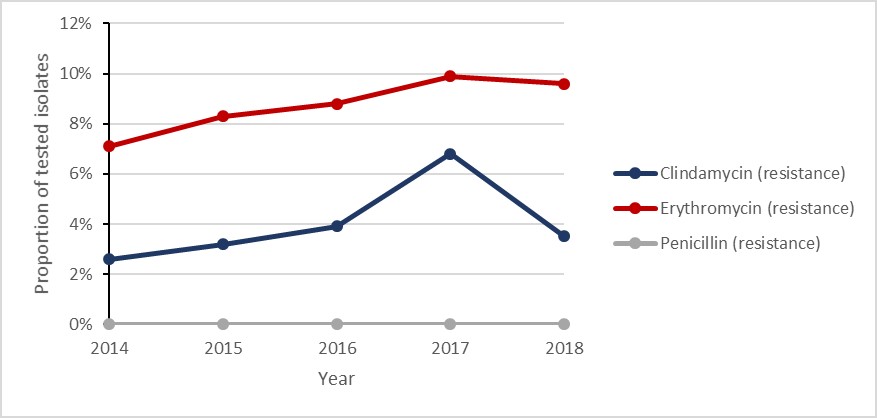
Figure h: Text description
| Year | 2014 | 2015 | 2016 | 2017 | 2018 |
|---|---|---|---|---|---|
| Penicillin (resistance) | 0.0% | 0.0% | 0.0% | 0.0% | 0.0% |
| Erythromycin (resistance) | 7.1% | 8.3% | 8.8% | 9.9% | 9.6% |
| Clindamycin (resistance) | 2.6% | 3.2% | 3.9% | 6.8% | 3.5% |
Antimicrobial use in humans: 2015-2019
- The consumption of antimicrobials by humans decreased by 5%.
- Seniors aged 80 years or more continued to have the highest rates of antimicrobial prescribing in the community sector, increasing by 13%.
- The rate of community prescribing for carbapenem-class antimicrobials increased by 68%.
In total:
- 207.6 million defined daily doses were filled by community retail pharmacies in 2019
- 16.4 million defined daily doses purchased by hospitals in 2019
Source:
- IQVIA, Indigenous Services Canada, Statistics Canada and the World Health Organization
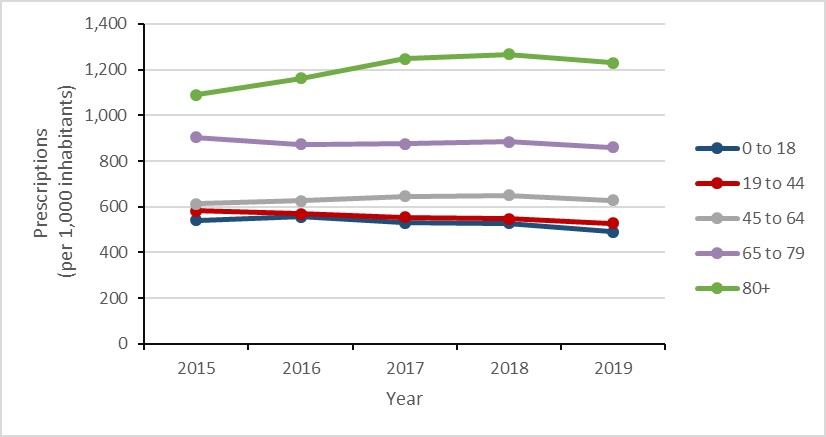
Figure i: Text description
| Year | 2015 | 2016 | 2017 | 2018 | 2019 |
|---|---|---|---|---|---|
| 0 to 18 | 539.9 | 556.1 | 530.6 | 526.7 | 490.9 |
| 19 to 44 | 582.5 | 570.0 | 554.1 | 547.7 | 528.4 |
| 45 to 64 | 611.9 | 626.3 | 645.5 | 649.6 | 628.6 |
| 65 to 79 | 903.6 | 873.7 | 875.7 | 883.1 | 859.3 |
| 80+ | 1090.4 | 1161.3 | 1246.1 | 1266.3 | 1230.7 |
Antimicrobials intended for use in animals
- The number of kilograms of active antimicrobial ingredients sold for use in production animals decreased by 11% between 2018 and 2019.
- Between 2018 and 2019:
- antimicrobial sales for use in pigs, poultry, and fish decreased;
- antimicrobial sales for use in cattle, horses, companion animals and small ruminants increased.
- In 2019, Canada distributed the eighth highest quantity of antimicrobials intended for use in animals compared to the latest data from 31 European countries.
In total:
- 975,000 kilograms of antimicrobials distributed
Sources:
- The Canadian Integrated Program for Antimicrobial Resistance Surveillance (CIPARS), the Canadian Animal Health Institute (CAHI), Health Canada (HC) and the European Surveillance of Veterinary Antimicrobial Consumption (ESVAC), Fisheries and Oceans Canada, Statistics Canada, Agriculture and Agri-Food Canada, Equestrian Canada, Chicken Farmers of Canada, Egg Farmers of Canada, Canadian Hatching Egg Producers, and Canfax.
Notes:
- As of December 1st, 2018, HC regulations require manufacturers, importers and compounders to report annual sales of medically important antimicrobials intended for use in animals. This data replaces the data historically provided on a voluntary basis by CAHI. Trends across these data sources should be interpreted with caution.
- The use of antimicrobial growth promoters have transitioned to medically important antimicrobials.
- The PCU (Population correction unit) accounts for the size of the animal population, including the number and average weight at treatment. Mg/PCU (milligrams per PCU) is the mg of antimicrobials sold or used in animals divided by the population correction unit. This excludes ionophores and chemical coccidiostats.
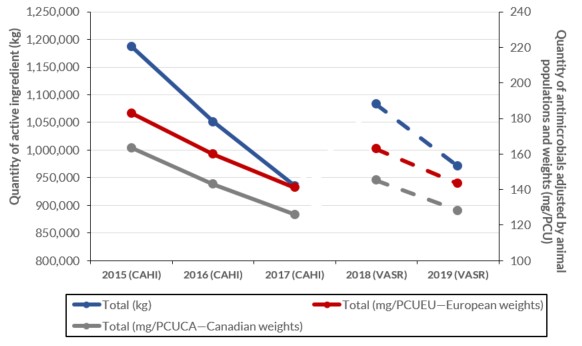
Figure j: Text description
| Data for figure | Total (kg) | Total (mg/PCUEU—European weights) | Total (mg/PCUCA—Canadian weights) |
|---|---|---|---|
| 2015 (CAHI) | 1187135.8 | 183.0 | 175.2 |
| 2016 (CAHI) | 1051010.0 | 160.0 | 154.2 |
| 2017 (CAHI) | 934872.7 | 141.2 | 136.8 |
| 2018 (VASR) | 1082768.0 | 162.9 | 150.3 |
| 2019 (VASR) | 968985.0 | 143.0 | 131.7 |
Special analysis: Antimicrobial prescribing in humans during the COVID-19 pandemic
To describe the impact of the COVID-19 pandemic on human antimicrobial consumption in Canada, the monthly rate of prescriptions in 2020 was compared against the same month in 2019. March was selected as the beginning of the Canadian COVID-19 pandemic, corresponding with the closure of the Canada-United States land boarder.
- Between March and October 2020, the overall rate of antimicrobial prescribing in the community sector decreased by 26%.
- The overall rate of antimicrobial prescribing in the community decreased by a maximum of 40% in May 2020.
The rate of antimicrobial prescribing to pediatrics decreased by a maximum of 70%, compared to a maximum of 29% in seniors aged 80 years or more.
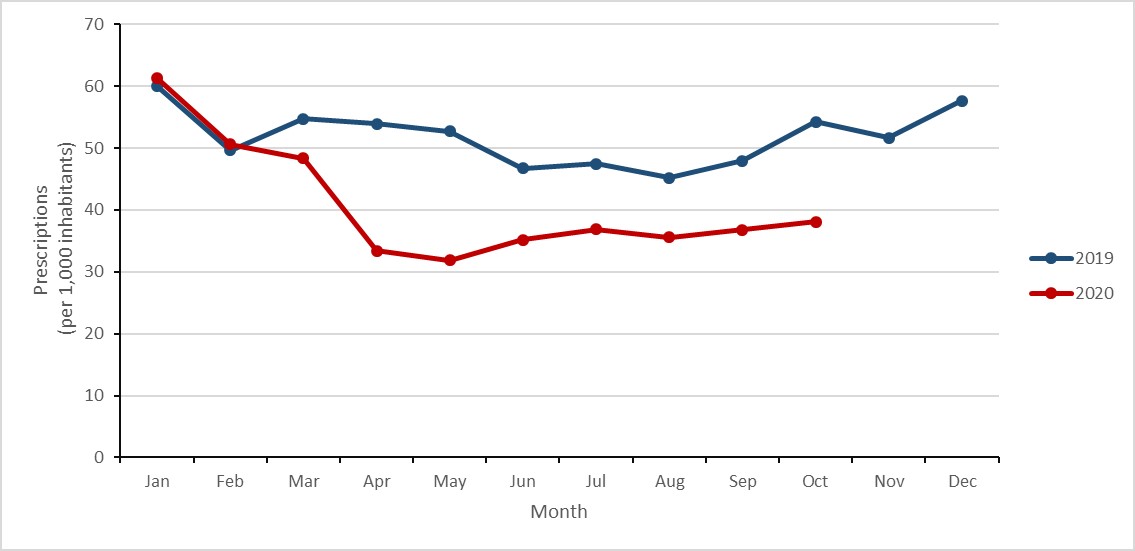
Figure k: Text description
| Month | Jan | Feb | Mar | Apr | May | Jun | Jul | Aug | Sep | Oct | Nov | Dec |
|---|---|---|---|---|---|---|---|---|---|---|---|---|
| Year 2019 | 60.0 | 49.7 | 54.7 | 54.0 | 52.7 | 46.7 | 47.5 | 45.2 | 47.9 | 54.2 | 51.7 | 57.6 |
| Year 2020 | 61.3 | 50.6 | 48.4 | 33.4 | 31.9 | 35.2 | 36.9 | 35.6 | 36.8 | 38.1 | n/a | n/a |
Technical annex
Methicillin-resistant Staphylococcus aureus (MRSA) bloodstream infections (BSI): 2015-2019
Key findings
- The rate of community-associated (CA) methicillin-resistant Staphylococcus aureus (MRSA) bloodstream infections (BSI) more than doubled between 2015 and 2019.
- 18% of MRSA-BSI cases identified between 2015 and 2019 died within 30 days of diagnosis (all-cause mortality).
- All MRSA blood isolates were susceptible to vancomycin and linezolid.
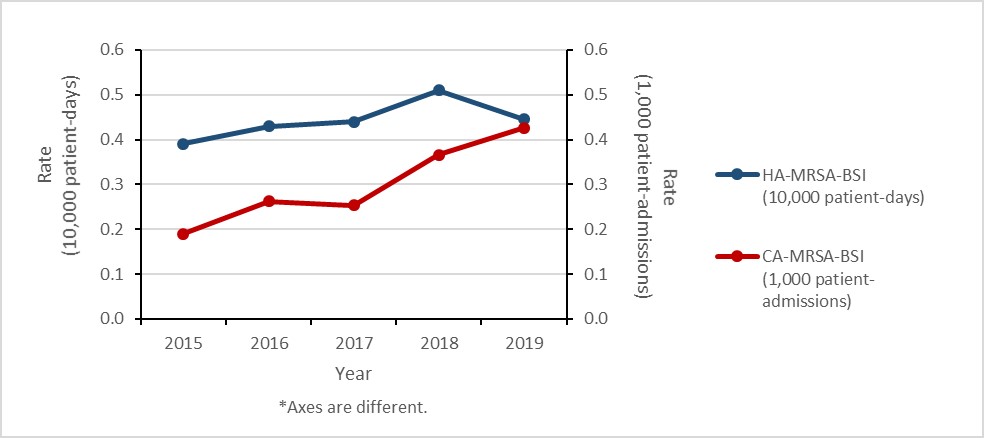
Figure 1: Text description
| Year | 2015 | 2016 | 2017 | 2018 | 2019 |
|---|---|---|---|---|---|
| HA-MRSA-BSI (10,000 patient-days) | 0.39 | 0.43 | 0.44 | 0.51 | 0.45 |
| CA-MRSA-BSI (1,000 patient-admissions) | 0.19 | 0.26 | 0.25 | 0.37 | 0.43 |
Healthcare-associated (HA) MRSA-BSI results
Between 2015 and 2019, the rate of HA-MRSA-BSI increased by 15.4%, from 0.39 to 0.45 cases per 10,000 patient-days. For all cases of HA-MRSA-BSI identified between 2015 and 2019, all-cause mortality within 30 days of diagnosis was 22.1%.
In 2019, laboratory results were available for 79.3% of reported HA-MRSA-BSI cases. Between 2015 and 2019, the proportion of strain type CMRSA 2 decreased from 56.3% to 36.1%, CMRSA 7 increased from 5.0% to 6.1% and CMRSA 10 increased from 26.6% to 37.5%.
| Canadian standard | American standard | Sector |
|---|---|---|
| CMRSA2 | USA100/USA800 | Historically healthcare-associated |
| CMRSA7 | USA400 | Historically community-associated |
| CMRSA10 | USA300 |
Between 2015 and 2019, all HA-MRSA blood isolates were susceptible to vancomycin (the most used antimicrobial in this setting) and less than 1% were non-susceptible to daptomycin. The overall MRSA susceptibility pattern for 2019, including those antimicrobials that are not used for bloodstream MRSA infections was as follows: no resistance to linezolid was detected and the prevalence of resistance to tetracycline (6.9%), rifampin (2.3%) and trimethoprim-sulfamethoxazole (1.1%) was low. Resistance to tetracycline increased by 115.6%, from 3.2% to 6.9% between 2015 and 2019.
| Proportion (%) of resistant isolates per year | |||||
|---|---|---|---|---|---|
| Year | 2015 | 2016 | 2017 | 2018 | 2019 |
| Isolates tested (n) | 219 | 273 | 296 | 334 | 261 |
| Ciprofloxacin | 80.4 | 78.4 | 77.0 | 74.6 | 72.0 |
| Clindamycin | 66.7 | 48.0 | 47.6 | 50.3 | 49.2 |
| Daptomycin | 0.0 | 1.1 | 0.7 | 0.0 | 0.0 |
| Erythromycin | 84.0 | 79.9 | 80.7 | 76.9 | 75.1 |
| Linezolid | 0.0 | 0.0 | 0.0 | 0.0 | 0.0 |
| Rifampin | 0.5 | 2.6 | 1.0 | 0.9 | 2.3 |
| Tetracycline | 3.2 | 4.8 | 5.4 | 4.5 | 6.9 |
| Tigecycline | 0.9 | 0.0 | 0.0 | 0.0 | 0.0 |
| Trimethoprim-sulfamethoxazole | 1.8 | 1.5 | 1.4 | 0.9 | 1.1 |
| vancomycin | 0.0 | 0.0 | 0.0 | 0.0 | 0.0 |
A subset of isolates were tested against ciprofloxacin in 2015 and clindamycin in 2019. Some antimicrobials are presented for epidemiological purposes only. Daptomycin and tigecycline are reported as non-susceptible.
Community-associated MRSA-BSI results
Between 2015 and 2019, the rate of CA-MRSA-BSI increased by 126.3%, from 0.19 to 0.43 cases per 1,000 patient-admissions. For all cases of CA-MRSA-BSI identified between 2015 and 2019, all-cause mortality within 30 days of diagnosis was 13.3%.
In 2019, laboratory results were available for 71.4% of reported CA-MRSA-BSI cases identified in hospital inpatients. Between 2015 and 2019, the proportion of strain type CMRSA 2 increased from 13.0% to 15.2%, CMRSA 7 increased from 11.0% to 14.4% and CMRSA 10 decreased from 62.3% to 59.2%.
Between 2015 and 2019, all CA-MRSA blood isolates were susceptible to vancomycin (the most used antimicrobial in this setting) and less than 1% were non-susceptible to daptomycin. The overall MRSA susceptibility pattern for 2019, including those antimicrobials that are not used for bloodstream infections was as follows: no resistance to linezolid and rifampin was detected and the prevalence of resistance to tetracycline (6.6%) and trimethoprim-sulfamethoxazole (1.6%) was low.
| Proportion (%) of resistant isolates per year | |||||
|---|---|---|---|---|---|
| Year | 2015 | 2016 | 2017 | 2018 | 2019 |
| Isolates tested (n) | 154 | 228 | 232 | 334 | 320 |
| Ciprofloxacin | 81.1 | 75.4 | 76.3 | 69.2 | 68.1 |
| Clindamycin | 36.4 | 39.5 | 36.6 | 33.2 | 29.4 |
| Daptomycin | 0.6 | 0.9 | 1.3 | 0.0 | 0.0 |
| Erythromycin | 77.9 | 75.9 | 81.0 | 73.4 | 76.3 |
| Linezolid | 0.0 | 0.0 | 0.0 | 0.0 | 0.0 |
| Rifampin | 0.6 | 1.3 | 2.6 | 0.9 | 0.0 |
| Tetracycline | 3.9 | 7.5 | 7.8 | 9.9 | 6.6 |
| Tigecycline | 0.6 | 0.0 | 0.0 | 0.0 | 0.0 |
| Trimethoprim-sufamethoxazole | 1.3 | 2.6 | 1.3 | 3.3 | 1.6 |
| Vancomycin | 0.0 | 0.0 | 0.0 | 0.0 | 0.0 |
A subset of isolates were tested against ciprofloxacin in 2015 and daptomycin in 2019. Some antimicrobials are presented for epidemiological purposes only. Daptomycin and tigecycline reported as non-susceptible.
Data source: Canadian Nosocomial Infection Surveillance Program (61 to 69 reporting hospitals).
Methodology has been previously published in the 2020 CARSS Report.
Vancomycin-resistant Enterococcus bloodstream infections: 2015-2019
Key findings
- The rate of healthcare-associated (HA) vancomycin-resistant Enterococcus (VRE) bloodstream infection (BSI) doubled between 2015 and 2019, decreasing 16% between 2018 and 2019.
- 34% of HA-VRE-BSI cases identified between 2015 and 2019 died within 30 days of diagnosis (all-cause mortality).
Healthcare-associated VRE-BSI results
Between 2015 and 2019, the rate of HA-VRE-BSI doubled (0.13 to 0.26 per 10,000 patient-days), despite a decrease of 16.1% between 2018 and 2019 (0.31 to 0.26 per 10,000 patient-days). For all cases of HA-VRE-BSI identified between 2015 and 2019, all-cause mortality within 30 days of diagnosis was 33.6%. In 2019, 86.6% of all reported VRE-BSI were healthcare-associated, down from 96.3% in 2015.

Figure 2: Text description
| Year | 2015 | 2016 | 2017 | 2018 | 2019 |
|---|---|---|---|---|---|
| HA-VRE-BSI | 0.13 | 0.17 | 0.22 | 0.31 | 0.26 |
Healthcare-associated VRE-BSI in adult and pediatric populations
While the number of HA-VRE-BSI identified in pediatric hospitals between 2015 and 2019 was low (n=19), the rate increased by over 700% (0.03 to 0.25 cases per 10,000 patient-days). During the same time-period, the rate of HA-VRE-BSI identified in adult hospitals more than doubled (from 0.16 to 0.35 cases per 10,000 patient-days), noting a decrease of 22.2% between 2018 and 2019 (0.45 to 0.35 per 10,000 patient-days). The increases reported in pediatric hospitals in 2019 was limited to two hospitals and preliminary 2020 rates indicate a significant decrease.
Multi-locus sequence typing (MLST) and antimicrobial susceptibility testing
In 2019, the organisms identified as causing HA-VRE-BSI were 98.8% E. faecium and 1.2% E. faecalis; MLST and antimicrobial susceptibility testing results were available for 98.2% of E. faecium isolates. ST1478 remained the predominant strain type (32.7%), followed by ST734 (11.5%) and ST117 (9.7%).
In 2019, daptomycin non-susceptibility remained detectable (4.3%), resistance to high-level gentamicin remained high (30.4%) and resistance to linezolid increased (0.0% in 2015 to 2.2% in 2019).
| Proportion (%) of resistant isolates per year | |||||
|---|---|---|---|---|---|
| Year | 2015 | 2016 | 2017 | 2018 | 2019 |
| Isolates tested (n) | 73 | 83 | 108 | 159 | 138 |
| Ampicillin | 100.0 | 100.0 | 100.0 | 100.0 | 100.0 |
| Chloramphenicol | 0.0 | 2.4 | 9.3 | 2.5 | 17.4 |
| Ciprofloxacin | 100.0 | 100.0 | 100.0 | 100.0 | 100.0 |
| Daptomycin | 0.0 | 8.4 | 8.3 | 6.9 | 4.3 |
| Erythromycin | 95.9 | 90.4 | 94.4 | 95.6 | 94.9 |
| Gentamycin (high-level) | 8.2 | 14.5 | 38.0 | 43.4 | 30.4 |
| Levofloxacin | 100.0 | 100.0 | 100.0 | 98.7 | 100.0 |
| Linezolid | 0.0 | 1.2 | 0.0 | 1.3 | 2.2 |
| Nitrofurantoin | 31.5 | 36.1 | 44.4 | 29.6 | 38.4 |
| Penicillin | 100.0 | 100.0 | 100.0 | 100.0 | 100.0 |
| Synergicid | 2.7 | 9.6 | 7.4 | 10.1 | 9.4 |
| Rifampin | 94.5 | 94.0 | 94.4 | 89.3 | 89.9 |
| Streptomycin (high-level) | 35.6 | 34.9 | 35.2 | 32.1 | 26.1 |
| Tetracycline | 60.3 | 51.8 | 57.4 | 64.2 | 71.0 |
| Tigecycline | 0.0 | 0.0 | 0.0 | 0.6 | 0.0 |
Some antimicrobials are presented for epidemiological purposes only. Daptomycin is reported as non-susceptible.
Data source: Canadian Nosocomial Infection Surveillance Program (CNISP) (57 to 68 reporting hospitals).
Methodology has been previously published in the 2020 CARSS report.
Carbapenemase-producing Enterobacterales (CPE) infections and colonization: 2015-2019
Key findings
- Between 2015 and 2019, the rate of healthcare-associated (HA) carbapenemase-producing Enterobacterales (CPE) colonization tripled.
- While the rate of HA-CPE infections more than doubles, the overall number infections remained low.
- 21% of patients with HA-CPE infection died within 30 days of diagnosis (all-cause mortality).
CPE colonization and infection results
Between 2015 and 2019, the rate of HA-CPE colonization in hospital inpatients still tripled (0.04 to 0.17 per 10,000 patient-days), despite a decrease of 5.6% between 2018 and 2019. Similarly, between 2015 and 2019, the rate of HA-CPE infection in hospital inpatients increased by 150% (0.02 to 0.05 cases per 10,000 patient-days). For all HA-CPE infections identified between 2015 and 2019, all-cause mortality was 20.9% (n=23/110). While the relationship between the increased detection of CPE and hospital screening practices was not assessed, CPE remains an important emerging public health threat.
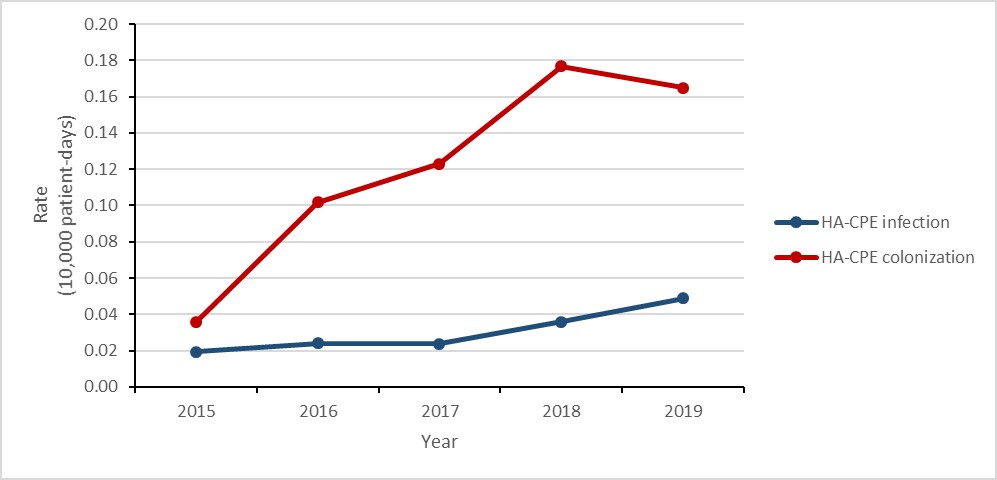
Figure 3: Text description
| Year | 2015 | 2016 | 2017 | 2018 | 2019 |
|---|---|---|---|---|---|
| HA-CPE infection | 0.02 | 0.02 | 0.02 | 0.04 | 0.05 |
| HA-CPE colonization | 0.04 | 0.10 | 0.12 | 0.18 | 0.16 |
In total, 918 CPE isolates were submitted to PHAC for analysis between 2015 and 2019 (i.e. clinical, screening and reference testing isolates from inpatient and outpatient settings). The most predominant carbapenemases were klebsiella pneumoniae (KPC) (48.7%), New Delhi metallo-β-lactamase (NDM) (28.2%) and oxacillinase-48 (OXA-48) (14.8%). The proportion of resistance remained high for the majority of antimicrobials tested.
| Proportion (%) of resistant isolates per year | |||||
|---|---|---|---|---|---|
| Year | 2015 | 2016 | 2017 | 2018 | 2019 |
| Isolates tested (n) | 81 | 161 | 187 | 228 | 261 |
| Amikacin | 27.2 | 26.1 | 17.1 | 19.3 | 8.8 |
| Cefotaxime | 90.1 | 92.5 | 92.5 | 93.0 | 95.8 |
| ceftazidime | 85.2 | 86.3 | 85.6 | 84.2 | 89.3 |
| Ciprofloxacin | 79.0 | 82.6 | 73.8 | 69.3 | 70.1 |
| Gentamicin | 49.4 | 38.5 | 34.2 | 35.1 | 33.0 |
| Meropenem | 84.0 | 87.0 | 80.0 | 86.8 | 72.8 |
| Piperacillin-tazobactam | 92.6 | 72.0 | 85.0 | 92.1 | 90.8 |
| Tigecycline | 16.0 | 19.9 | 9.6 | 13.2 | 13.8 |
| Tobramycin | 49.4 | 46.6 | 38.0 | 44.3 | 46.4 |
| Trimethoprim-sulfamethoxazole | 72.8 | 63.4 | 60.4 | 62.7 | 73.9 |
Source: Canadian Nosocomial Infection Surveillance Program (CNISP) (58 to 72 reporting hospitals).
Methodology has been previously published in the 2020 CARSS report.
“The global emergence of carbapenemase producing bacteria capable of hydrolyzing the once effective carbapenem antibiotics is considered a contemporary public health concern” (Hansen, 2021)
All isolates harboured known carbapenemase genes (some demonstrated in vitro susceptibility to meropenem). Some antimicrobials are presented for epidemiological purposes only.
Clostridioides difficile infections: 2015-2019
Key findings
- The rate of healthcare-associated (HA) Clostridioides difficile infection (CDI) decreased by 22% between 2015 and 2019.
- 2% of HA-CDI cases identified between 2015 and 2019 died within 30 days of diagnosis (attributable mortality).
Healthcare-associated CDI results
Between 2015 and 2019, the rate of HA-CDI decreased by 21.7% (4.6 to 3.6 cases per 10,000 patient- days). For all cases of HA-CDI identified between 2015 and 2019, all-cause mortality within 30 days of diagnosis was 9.4% and attributable mortality was 2.4%.

Figure 4: Text description
| Year | 2015 | 2016 | 2017 | 2018 | 2019 |
|---|---|---|---|---|---|
| HA-CDI (10,000 patient-days) | 4.63 | 4.39 | 4.19 | 3.94 | 3.62 |
| CA-CDI (1,000 patient-admissions) | 1.50 | 1.34 | 1.37 | 1.36 | 1.17 |
In 2019, laboratory results were available for 74.6% (n= 425/570) of eligible HA-CDI (i.e. cases identified in March and April). North American pulsed field (NAP) type 4 and NAP-11 associated ribotype strains were predominant (20.5% and 20.2%, respectively), followed by NAP-1 associated ribotype strains (9.4%).
| Proportion (%) of resistant isolates per year | |||||
|---|---|---|---|---|---|
| Year | 2015 | 2016 | 2017 | 2018 | 2019 |
| Isolates tested (n) | 540 | 494 | 526 | 475 | 425 |
| Clindamycin | 25.0 | 22.1 | 21.9 | 47.4 | 40.2 |
| Metronidazole | 0.0 | 0.0 | 0.0 | 0.0 | 0.0 |
| Moxifloxacin | 28.1 | 17.2 | 18.6 | 12.4 | 11.8 |
| Rifampin | 2.0 | 1.6 | 2.5 | 1.7 | 0.7 |
| Vancomycin | 0.0 | 0.0 | 0.0 | 0.0 | 0.0 |
One metronidazole resistant isolate was identified in 2018. The increase in clindamycin resistance in 2018 represents a reclassification (an increase in samples with MIC values of 6–8 mg/L; high-level clindamycin resistance remained stable). Some antimicrobials are presented for epidemiological purposes only.
Community-associated CDI results
Between 2015 and 2019, the rate of CA-CDI decreased by 22.0% (1.5 to 1.2 cases per 1,000 patient-admissions). For all cases of CA-CDI identified between 2015 and 2019, all-cause mortality within 30 days of diagnosis was 5.8% and attributable mortality was 1.9%.
In 2019, laboratory results were available for 74.4% (n=122/164) of eligible CA-CDI (i.e. cases identified in March and April). North American pulsed field (NAP) type 4 and NAP-11 associated ribotype strains were predominant (19.7% and 18.0%, respectively), followed by NAP-1 associated ribotype strains (6.6%).
| Proportion (%) of resistant isolates per year | |||||
|---|---|---|---|---|---|
| Year | 2015 | 2016 | 2017 | 2018 | 2019 |
| Isolates tested (n) | 205 | 163 | 150 | 156 | 122 |
| Clindamycin | 28.8 | 22.1 | 22.7 | 52.6 | 39.3 |
| Metronidazole | 0.0 | 0.0 | 0.0 | 0.0 | 0.0 |
| Moxifloxacin | 16.1 | 11.0 | 10.7 | 7.1 | 11.5 |
| Rifampin | 1.5 | 0.6 | 0.7 | 1.3 | 1.6 |
| Vancomycin | 0.0 | 0.0 | 0.0 | 0.0 | 0.0 |
The increase in clindamycin resistance in 2018 represents a reclassification (an increase in samples with MIC values of 6–8 mg/L; high-level clindamycin resistance remained stable). Some antimicrobials are presented for epidemiological purposes only.
| NAP type | Ribotypes |
|---|---|
| NAP-1 | 027, 176, 075, 385, 080, 036, 019 |
| NAP-4 | 020, 014, 076, 629, 207, 077, 511, 221, 011, ns70, 006, 154, 354, 325, 296 |
| NAP-11 | 106, 103, 024, 072, 016 |
Data source: Canadian Nosocomial Infection Surveillance Program (66 to 73 reporting hospitals).
Methodology has been previously published in the 2020 CARSS Report.
Neisseria gonorrhoeae infections: 2015-2019
Key findings
- The rate of gonorrhea infection increased by 70%, from 55.5 to 94.3 cases per 100,000 inhabitants
- The proportion of cultured multidrug-resistant (MDR) Neisseria gonorrhoeae (GC) isolates increased by 44%, from 8.6% to 12.4%; mainly driven by macrolide (i.e. azithromycin) resistance.
- Eleven cases of extensively drug-resistant (XDR) gonococci were identified in Canada, threatening the success of current treatment recommendations.
Results
Between 2015 and 2019, the number of cases of gonorrhea diagnosed in Canada increased from 55.5 to 94.3 cases per 100,000 inhabitants. In total, 142,633 cases were reported during the five-year period, of which 24,484 (17.2%) were tested for antimicrobial resistance. Resistance to at least one antibiotic was identified in 67.7% (n=16,570/24,484) of tested isolates, 10% (2,459/24,484) were MDR and <0.1% (11/24,484) were XDR.
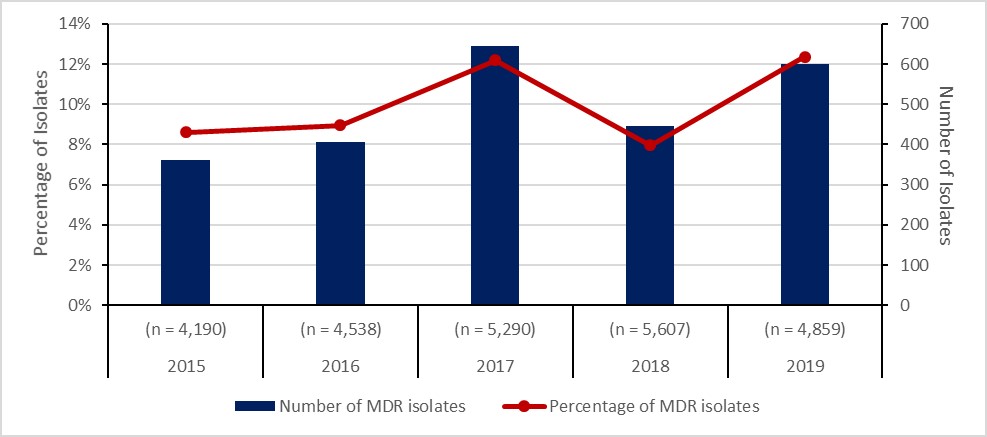
Figure 5: Text description
| Year | 2015 | 2016 | 2017 | 2018 | 2019 |
|---|---|---|---|---|---|
| Total isolates tested (n) | (n = 4,190) | (n = 4,538) | (n = 5,290) | (n = 5,607) | (n = 4,859) |
| Number of MDR isolates | 361 | 406 | 645 | 446 | 601 |
| Percentage of MDR isolates | 9% | 9% | 12% | 8% | 12% |
Notes:
- Data source: Gonococcal Antimicrobial Surveillance Program – Canada and the Canadian Notifiable Disease Surveillance System
- Methodology has been previously published in the 2020 CARSS Report
- With acknowledgement to the participating provincial public health laboratories
Neisseria gonorrhoeae drug resistance definitions
- Multidrug-resistance (MDR) Neisseria gonorrhoeae (GC) is defined as decreased susceptibility to cephalosporin or resistance to azithromycin as well as to at least two other antimicrobials.
- Extensively drug-resistant (XDR) gonococci is defined as decreased susceptibility to a cephalosporin plus resistance to azithromycin as well as resistance to at least two other antimicrobials.
Mycobacterium tuberculosis infections: 2015-2019
Key findings
- The rate of Mycobacterium tuberculosis (TB) infection in Canada remained stable at approximately 4.8 cases per 100,000 population between 2015 and 2019.
- In 2019, 11% of TB isolates were resistant to any first-line anti-TB drug:
- 8.9% were mono-resistant.
- 0.3% were poly-resistant.
- 1.3% were multi-drug resistant.
- Only one case of extensively drug-resistant (XDR) TB has been reported since 2015.
Results
In 2019, 1,627 incident cases of TB were reported in Canada. Mycobacterium Tuberculosis (MTB) complex was isolated in 98.7% (n=1,607) of cases and Mycobacterium bovis (BCG) was isolated in the remaining 1.7% (n=20). Resistance to at least one anti-TB drug was detected in 10.4% (n=168) of culture-positive MTB complex isolates (Figure 6). Of these isolates, 81.5% (n=137) were resistant to isoniazid, 25.6% (n=43) were resistant to pyrazinamide, 13.7% (n=33) were resistant to rifampin. In 2019, 11.9% (n=20) of resistant MTB complex isolates were multi-drug resistant (Figure 6) and no MTB complex isolates were XDR-TB (Table 7).
While there was minimal difference between age groups, MTB complex isolated in older individuals (>74 years) was relatively less resistant to anti-TB drugs than MTB complex isolated from the younger age-groups (Figure 7). Stratified by sex, the proportion of resistant MTB complex isolated in males has historically been lower than the proportion of resistant MTB complex isolated in females; however, the proportion was approximately equal in 2019.
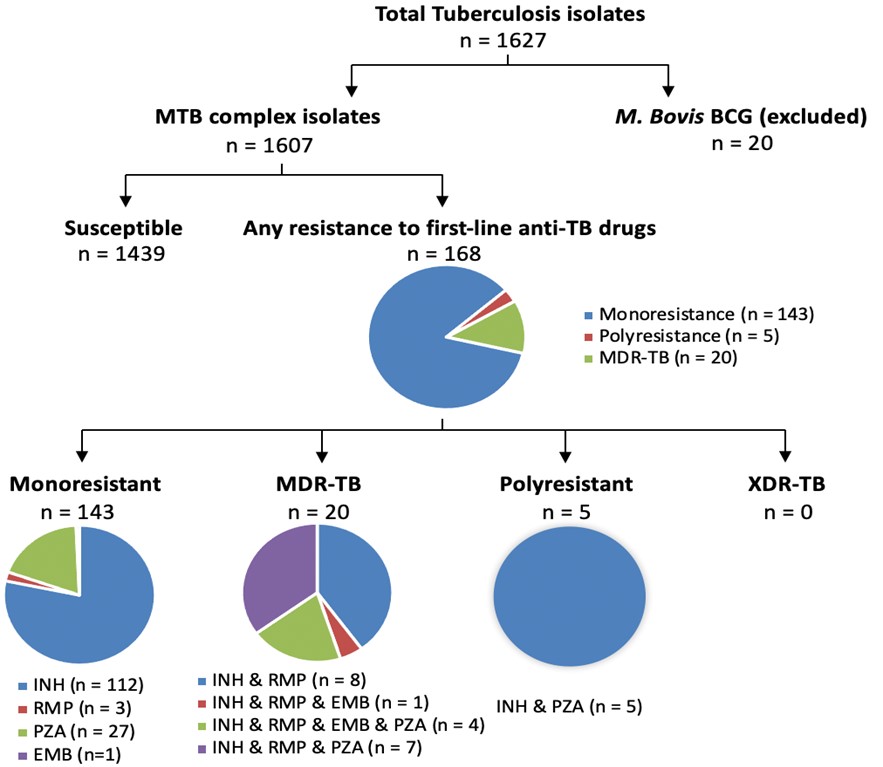
Figure 6: Text description
Pie charts for tuberculosis isolates tested for anti-tuberculosis drug resistance in Canada, in 2019. A total of 1,627 isolates were tested. 20 of those were M. Bovis Bacillus Calmette-Guérin (BCG) isolates; the remaining 1,607 were Mycobacterium tuberculosis (MTB) complex isolates. Of the 1,607 Mycobacterium tuberculosis complex isolates, 1,439 of them were susceptible, while the remaining 168 were resistant to first-line anti-tuberculosis drugs. Of the 168 resistant isolates, 143 were mono-resistant, 5 were poly-resistant, and 20 were multidrug-resistant. Of the 143 mono-resistant isolates, 112 were resistant to isoniazid (INH), 3 were resistant to rifampin (RMP), 27 were resistant to pyrazinamide (PZA), and 1 was resistant to ethambutol (EMB). Of the 20 multidrug-resistant isolates, 8 were resistant to isoniazid and rifampin; 1 was resistant to isoniazid, rifampin and ethambutol; 4 were resistant to isoniazid, rifampin, ethambutol, and pyrazinamide; and 7 were resistant to isoniazid, rifampin, and pyrazinamide. Of the 5 poly-resistant isolates, all 5 were resistant to isoniazid and pyrazinamide. No isolates were extensively drug-resistant.
Abbreviations:
- MTB: Mycobacterium Tuberculosis
- BCG: Mycobacterium bovis
- MDR: Multidrug-resistant
- XDR: Extensively drug-resistant
- INH: Isoniazid
- RMP: Rifampin
- PZA: Pyrazinamide
- EMB: Ethambutol
| Proportion (%) of resistant isolates per year | |||||
|---|---|---|---|---|---|
| Year | 2015 | 2016 | 2017 | 2018 | 2019 |
| Isolates tested (n) | 1331 | 1450 | 1522 | 1458 | 1607 |
| Any resistance | 10.4 | 9 | 8.1 | 10.1 | 10.5 |
| Mono-resistant | 8.5 | 7.4 | 6.8 | 8.3 | 8.9 |
| Poly-resistant | 0.2 | 0.3 | 0.4 | 0.3 | 0.3 |
| Multidrug-resistant | 1.6 | 1.2 | 0.9 | 1.4 | 1.2 |
| Extensively drug-resistant | 0.0 | 0.0 | 0.0 | 0.1 | 0.0 |
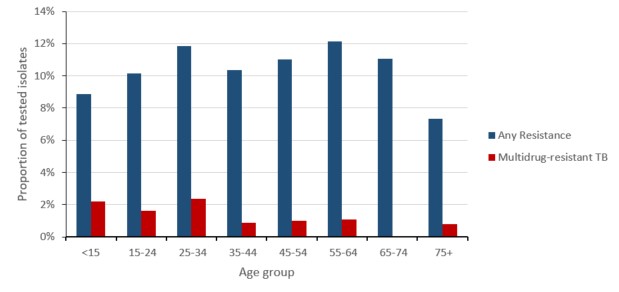
Figure 7: Text description
| Age Group | Any Resistance | Multidrug-resistant TB |
|---|---|---|
| <15 | 8.9% | 2.2% |
| 15-24 | 10.2% | 1.6% |
| 25-34 | 11.9% | 2.4% |
| 35-44 | 10.4% | 0.9% |
| 45-54 | 11.0% | 1.0% |
| 55-64 | 12.2% | 1.1% |
| 65-74 | 11.0% | 0.0% |
| 75+ | 7.3% | 0.8% |
Source: Canadian Tuberculosis Laboratory Surveillance System (CBTLSS) and the Canadian Notifiable Disease Surveillance System (CNDSS)
Methods
MTB resistance data on first-line and second-line anti-TB drugs was submitted by all Canadian jurisdictions to the Canadian Tuberculosis Laboratory Surveillance System (CBTLSS). Isolates from culture-positive TB cases were tested for antimicrobial susceptibility. Any TB isolates demonstrating positive cultures of M. tuberculosis complex (M. tuberculosis, M. africanum, M. canetti, M. caprae, M. microti, M. pinnipedii or M. bovis) were included in the analyses. M. bovis Bacillus Calmette-Guérin (BCG) isolates were excluded since they represent a complication of TB vaccination often found in immune-compromised patients, where the strain is not infectious. Types of drug resistance were tabulated and a five-year trend assessed:
- Mono-resistance (i.e. resistance to only one first-line anti-TB drug);
- Poly-resistance (i.e. resistance to more than one first-line anti-TB drug, other than both isoniazid and rifampin);
- Multi-drug resistance (i.e. resistance to at least both isoniazid and rifampin);
- Extensive drug resistance (i.e. resistance to any fluoroquinolone, such as ciprofloxacin and moxifloxacin), and at least one of three second-line injectable drugs (capreomycin, kanamycin and amikacin), in addition to multi-drug resistance.
Invasive Streptococcus pneumoniae infections (IPD): 2014-2018
Key findings
- The rate of invasive pneumococcal disease (IPD) increased by 21% from 9.0 to 10.9 cases per 100,000 people between 2014 and 2018.
- The proportion of multidrug resistance (i.e. Streptococcus pneumoniae isolates resistant to three or more classes of antimicrobials) identified in vaccine preventable (PCV13) IPD cases increased by 25%, from 9% to 12% between 2014 and 2018.
- The proportion of multidrug resistant (MDR) isolates identified in non-vaccine preventable (non-PCV13) IPD cases increased by 74%, from 4% to 6% between 2014 and 2018.
Results
Between 2014 and 2018, the rate of invasive disease due to S. pneumoniae increased by 21.1%, from 9.0 to 10.9 per 100,000 inhabitants. In 2018, laboratory results were available from 44.5% (n=1,792/4,026) of all IPD cases. The proportion of S. pneumonia isolates resistant to clarithromycin was 25.8%, followed by penicillin (11.1%) and non-susceptibility to doxycycline was 8.4%. All S. pneumoniae isolates were susceptible to daptomycin, linezolid, tigecycline and vancomycin.
Between 2014 and 2018, the proportion of S. pneumoniae isolates identified as MDR (i.e. isolates resistant to three or more classes of antimicrobials) increased by 52.0%, from 5.0% (n=56) to 7.6% (n=137). The proportion MDR was highest in serotypes 15A (non-PCV13) and 19A (PCV13), with 58.0% (n=23) and 29.0% (n=27) demonstrating this pattern of resistance, respectively.
Vaccine preventable drug-resistance in IPD cases
IPD (including some MDR-associated IPD serotypes) can be prevented through the use of the pneumococcal conjugate 13-valent (PCV-13) vaccine and the pneumococcal polysaccharide 23-valent (PNEUMOVAX®23) vaccine. In 2018, the highest proportion of resistance in PCV13-vaccine preventable IPD serotypes was clarithromycin (22.5%), followed by doxycycline (13.8%), clindamycin (11.0%) and penicillin (10.6%). Between 2014 and 2018, no resistance was observed to ertapenem and <1% of isolates were resistant to moxifloxacin. Between 2014 and 2018, the proportion of MDR in PCV13-vaccine preventable IPD serotypes increased by 25.0%, from 9.1% to 11.6%.
| Proportion (%) of resistant isolates per year | |||||
|---|---|---|---|---|---|
| Year | 2014 | 2015 | 2016 | 2017 | 2018 |
| Isolates (n) tested | 294 | 292 | 284 | 295 | 520 |
| Susceptible | 66.7 | 69.5 | 70.4 | 65.8 | 70.6 |
| Resistant to one antimicrobial class | 15.3 | 12.3 | 12.3 | 10.2 | 10.8 |
| Resistant to two antimicrobial classes | 8.8 | 5.8 | 7.0 | 9.5 | 7.1 |
| Multidrug-resistant | 9.2 | 12.3 | 10.2 | 14.6 | 11.5 |
Multidrug-resistance is defined as resistance to three or more antimicrobial classes.
Non-vaccine preventable drug-resistant IPD cases
In 2018, the highest proportion of resistance in non-vaccine preventable IPD serotypes (non-PCV13) was clarithromycin (27.1%) and penicillin (11.3%). Between 2014 and 2018, <1% of isolates were resistant to ertapenem, imipenem and moxifloxacin. Between 2014 and 2018, the proportion of MDR in non-vaccine preventable IPD serotypes (non-PCV13) increased by 74.3%, from 3.5% to 6.1%.
| Proportion (%) of resistant isolates per year | |||||
|---|---|---|---|---|---|
| Year | 2014 | 2015 | 2016 | 2017 | 2018 |
| Isolates (n) tested | 822 | 836 | 830 | 834 | 1,272 |
| Susceptible | 69.0 | 69.6 | 68.8 | 64.5 | 61.5 |
| Resistant to one antimicrobial class | 19.3 | 20.6 | 20.2 | 22.8 | 26.7 |
| Resistant to two antimicrobial classes | 8.2 | 5.0 | 6.1 | 4.9 | 5.7 |
| Multidrug-resistant | 3.5 | 4.8 | 4.8 | 7.8 | 6.1 |
Multidrug-resistance is defined as resistance to three or more antimicrobial classes.
Notes:
- Sources: The National Surveillance of Invasive Streptococcal Disease (eSTREP) and the Canadian Notifiable Disease Surveillance System (CNDSS)
- Methodology has been previously published in the 2020 CARSS Report
- With acknowledgement of contributions from the University of Manitoba, Toronto Bacterial Disease network, Alberta Provincial Laboratory, Laboratoire de santé publique du Quebec and all provincial/territorial public health laboratories who submit isolates to the eSTREP program.
Invasive Streptococcus pyogenes (group A Streptococcus) infections: 2014-2018
Key findings
- The rate of invasive Group A Streptococcal (iGAS) disease increased by 65% from 5.2 to 8.6 cases per 100,000 inhabitants between 2014 and 2018.
- All Streptococcus pyogenes isolates were susceptible to penicillin and vancomycin.
- Erythromycin resistance remained stable with rates at 7.1% - 9.6% between 2014 and 2018
Results
Between 2014 and 2018, the rate of iGAS increased by 65.4%, from 5.2 to 8.6 cases per 100,000 inhabitants. In 2018, laboratory results were available for 94.5% (n=2,760/2,922) of iGAS cases (noting variations in the definition of sterile sites by province). All Streptococcus pyogenes isolates were susceptible to penicillin and vancomycin.
| Proportion (%) of resistant isolates per year | |||||
|---|---|---|---|---|---|
| Year | 2014 | 2015 | 2016 | 2017 | 2018 |
| Isolates tested (n) | 1460 | 1453 | 1768 | 2052 | 2760 |
| Clindamycin (Resistance) | 2.6 | 3.2 | 3.9 | 6.8 | 3.5 |
| Erythromycin (Resistance) | 7.1 | 8.3 | 8.8 | 9.9 | 9.6 |
| Penicillin (Resistance) | 0.0 | 0.0 | 0.0 | 0.0 | 0.0 |
| Vancomycin (Resistance) | 0.0 | 0.0 | 0.0 | 0.0 | 0.0 |
Notes:
- Sources: The National Surveillance of Invasive Streptococcal Disease (eSTREP) and the Canadian Notifiable Disease Surveillance System (CNDSS)
- Methodology has been previously published in the 2020 CARSS Report
- With acknowledgement of contributions from the University of Manitoba, Toronto Bacterial Disease network, Alberta Provincial Laboratory, Laboratoire de santé publique du Quebec and all provincial/territorial public health laboratories who submit isolates to the eSTREP program.
Antimicrobial consumption by humans, Canada, 2015-2019
Key findings
- Between 2015 and 2019, overall human consumption of antimicrobials decreased by 5%, noting an increase of 2% in the use of antimicrobials that should be reserved for suspected or confirmed multidrug-resistant infections.
- The rate of antimicrobial prescribing in the community sector was highest in seniors aged 80 years or more and increased by 13% between 2015 and 2019.
- Between 2015 and 2019, the rate of prescriptions originating from nurses and pharmacists increased by 68% and 210%, respectively.
Overall antimicrobial consumption by humans: National perspective
Between 2015 and 2019, human antimicrobial consumption (including antimicrobials dispensed by community retail pharmacies and antimicrobials purchased by hospitals) decreased by 5.4%, from 17.3 to 16.3 defined daily doses (DDDs) per 1,000 inhabitant-days, driven by a decrease of 19.7% in doses purchased by hospitals.
In 2019, 16.3 antimicrobial doses were consumed each day for every 1,000 people in Canada.
In 2019, 92.7% of DDDs were dispensed in the community sector through community retail pharmacies and the remaining 7.3% were purchased for use by hospitals. Between 2015 and 2019, the estimated cost (adjusted to 2019 Canadian dollars) of all antimicrobials consumed decreased by 9.2%, from $836.3 million to $759.6 million.
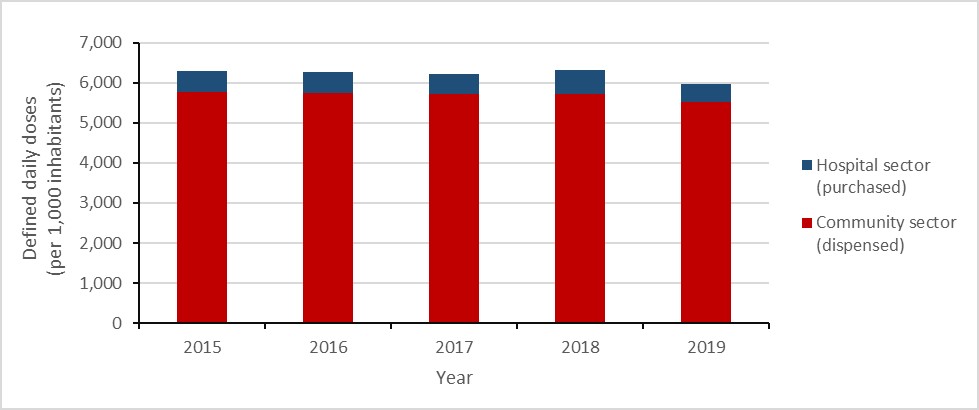
Figure 8: Text description
| Year | 2015 | 2016 | 2017 | 2018 | 2019 |
|---|---|---|---|---|---|
| Hospital sector (purchased) | 544.2 | 526.0 | 509.9 | 611.7 | 437.1 |
| Community sector (dispensed) | 5755.1 | 5741.5 | 5710.4 | 5713.1 | 5523.4 |
Overall antimicrobial consumption by humans: Canadian jurisdictions
In 2019, Prince Edward Island and Newfoundland and Labrador (data combined) consumed the largest quantity of antimicrobials per capita, decreasing by 9.2% since 2015 (10,010.2 to 9,087.1 DDDs per 1,000 inhabitants). British Columbia and the territories (data combined) consumed the smallest quantity of antimicrobials per capita.
Between 2015 and 2019, antimicrobial consumption decreased in all Canadian jurisdictions; Saskatchewan had the largest change in consumption, with a decrease of 10.7% (7,889.4 to 7,045.3 DDDs per 1,000 inhabitants), followed by Prince Edward Island and Newfoundland and Labrador at 9.2% (9,827.9 to 9,087.1 DDDs per 1,000 inhabitants).
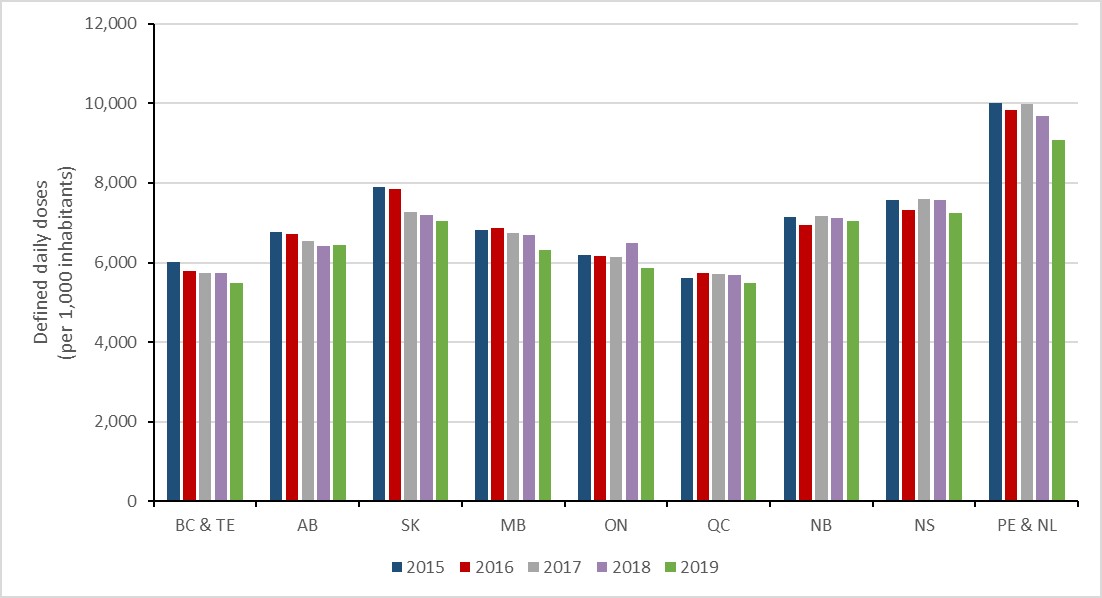
Figure 9: Text description
| Year | 2015 | 2016 | 2017 | 2018 | 2019 |
|---|---|---|---|---|---|
| BC & TE | 6008.3 | 5776.0 | 5745.1 | 5729.8 | 5475.9 |
| AB | 6768.5 | 6708.0 | 6547.2 | 6414.1 | 6442.1 |
| SK | 7889.4 | 7843.2 | 7260.7 | 7189.8 | 7045.3 |
| MB | 6811.7 | 6863.1 | 6747.5 | 6697.0 | 6322.1 |
| ON | 6182.8 | 6164.8 | 6129.2 | 6500.1 | 5860.3 |
| QC | 5603.3 | 5724.8 | 5713.6 | 5676.7 | 5479.6 |
| NB | 7140.0 | 6946.5 | 7171.9 | 7125.2 | 7034.6 |
| NS | 7564.7 | 7316.1 | 7607.1 | 7582.5 | 7245.0 |
| PE & NL | 10010.2 | 9827.9 | 9986.7 | 9682.8 | 9087.1 |
|
Abbreviations: BC & TE = British Columbia combined with Yukon, Northwest Territories and Nunavut; AB = Alberta; SK = Saskatchewan; MB = Manitoba; ON = Ontario; QC = Quebec; NB = New Brunswick; NS = Nova Scotia; PE & NL = Prince Edward Island combined with Newfoundland and Labrador. |
|||||
Overall antimicrobial consumption by humans: Top 5 antimicrobial classes
In 2019, the most consumed classes of antimicrobials by humans were tetracyclines (1,186.2 DDDs per 1,000 inhabitants), penicillins with extended spectrum (1,178.7 DDDs per 1,000 inhabitants), macrolides (781.9 DDDs per 1,000 inhabitants), penicillin combinations (489.4 DDDs per 1,000 inhabitants) and first generation cephalosporins (474.3 DDDs per 1,000 inhabitants). Between 2018 and 2019, fluoroquinolones dropped from the fourth to the sixth most consumed antimicrobial class (551.8 to 469.3 DDDs per 1,000 inhabitants).
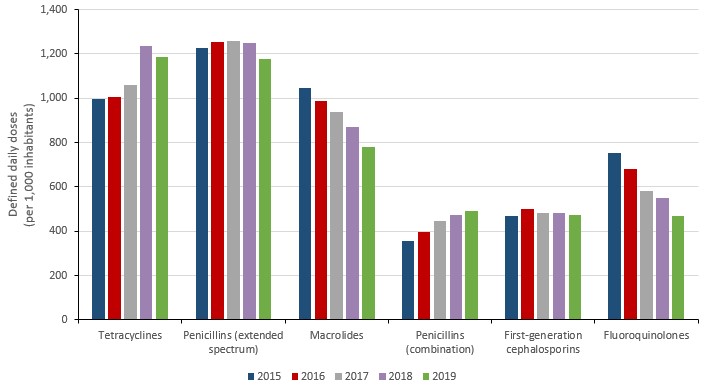
Figure 10: Text description
| Year | 2015 | 2016 | 2017 | 2018 | 2019 |
|---|---|---|---|---|---|
| Tetracyclines | 997.0 | 1008.1 | 1058.6 | 1234.0 | 1186.2 |
| Penicillins (extended spectrum) | 1228.2 | 1255.1 | 1257.3 | 1247.5 | 1178.7 |
| Macrolides | 1047.8 | 987.5 | 937.6 | 872.3 | 781.9 |
| Penicillins (combination) | 355.0 | 396.6 | 446.6 | 471.2 | 489.4 |
| First-generation cephalosporins | 467.4 | 498.9 | 481.2 | 481.7 | 474.3 |
| Fluoroquinolones | 754.5 | 679.9 | 581.9 | 551.8 | 469.3 |
Overall antimicrobial consumption by humans: AWaRe categorization
The World Health Organization’s AWaRe program has published a list of antibiotics that should be reserved for the treatment of suspected or confirmed multidrug-resistant organisms, referred to as “Reserve” antibiotics. Between 2015 and 2019, the consumption of these antibiotics in Canada increased by 2.3%. This increase was largely driven by an increase of 83.1% in the consumption of daptomycin (2.7 to 5.0 DDDs per 1,000 inhabitants).
Between 2015 and 2019, the consumption of WHO AWaRe “Watch” antibiotics (i.e. antibiotics that have high resistance potential) decreased by 25.2% (2,471.4 to 1,848.4 to DDDs per 1,000 inhabitants) and the consumption of WHO AWaRe “Access” (i.e. antibiotics that are active against many common susceptible pathogens and have lower resistance potential) increased by 7.5% (3,817.0 to 4,102.7 DDDs per 1,000 inhabitants).
In 2019, nearly 70% of all antimicrobials consumed by humans in Canada were classified as “Access” by the WHO AWaRe system.
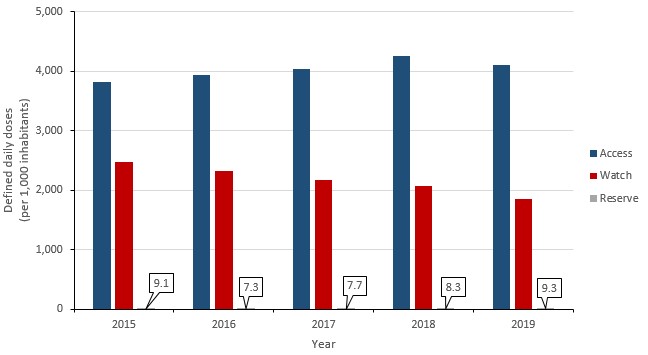
Figure 11: Text description
| Year | Access | Watch | Reserve |
|---|---|---|---|
| 2015 | 3817.0 | 2471.4 | 9.1 |
| 2016 | 3934.3 | 2325.3 | 7.3 |
| 2017 | 4036.6 | 2175.9 | 7.7 |
| 2018 | 4252.2 | 2064.1 | 8.3 |
| 2019 | 4102.6 | 1848.4 | 9.3 |
Overall antimicrobial consumption by humans: International perspective
In 2019, Canada consumed the 13th lowest quantity of antimicrobials when compared to 30 countries reporting to the European Surveillance of Antimicrobial Consumption Network (ESAC-Net) – one of the largest internationally standardized antimicrobial consumption surveillance systems. The metric for comparison is J01 antimicrobials (antibiotics for systemic use) measured by DDDs consumed per capita by humans in the community and hospital sectors.
In general, the rate of human antimicrobial consumption in the Netherlands (the country with the lowest reported consumption, 9.5 DDDs per 1,000 inhabitant-days) is nearly half the rate in Canada (16.3 DDDs per 1,000 inhabitant-days). The rate of human antimicrobial consumption in Canada is approximately half that of the rate in Greece (the country with the highest reported consumption, 34.1 DDDs per 1,000 inhabitant-days).
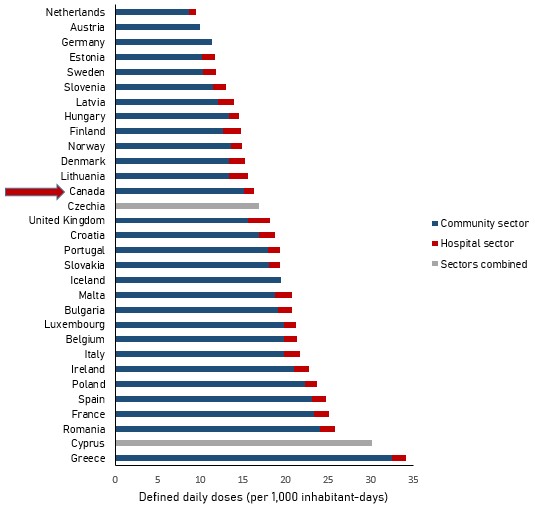
Figure 12: Text description
| Country | Community sector | Hospital sector | Total (as reported by EU) |
|---|---|---|---|
| Greece | 32.4 | 1.68 | 34.1 |
| Cyprus | n/a | n/a | 30.1 |
| Romania | 24 | 1.73 | 25.8 |
| France | 23.3 | 1.74 | 25.1 |
| Spain | 23.1 | 1.63 | 24.7 |
| Poland | 22.2 | 1.42 | 23.6 |
| Ireland | 21 | 1.77 | 22.8 |
| Italy | 19.8 | 1.89 | 21.7 |
| Belgium | 19.8 | 1.54 | 21.3 |
| Luxembourg | 19.8 | 1.38 | 21.1 |
| Bulgaria | 19.1 | 1.63 | 20.7 |
| Malta | 18.7 | 1.99 | 20.7 |
| Iceland | 19.5 | n/a | 19.5 |
| Slovakia | 18 | 1.38 | 19.3 |
| Portugal | 17.9 | 1.4 | 19.3 |
| Croatia | 16.9 | 1.85 | 18.8 |
| United Kingdom | 15.6 | 2.53 | 18.2 |
| Czechia | n/a | n/a | 16.9 |
| Canada | 15.12 | 1.19 | 16.3 |
| Lithuania | 13.4 | 2.12 | 15.6 |
| Denmark | 13.4 | 1.86 | 15.3 |
| Norway | 13.6 | 1.3 | 14.9 |
| Finland | 12.6 | 2.1 | 14.7 |
| Hungary | 13.3 | 1.16 | 14.4 |
| Latvia | 12 | 1.88 | 13.9 |
| Slovenia | 11.5 | 1.5 | 13 |
| Sweden | 10.3 | 1.48 | 11.8 |
| Estonia | 10.2 | 1.54 | 11.8 |
| Germany | 11.4 | n/a | 11.4 |
| Austria | 9.9 | n/a | 9.9 |
| Netherlands | 8.7 | 0.8 | 9.5 |
Notes: Austria, Germany and Iceland report consumption in the community sector only. Czechia and Cyprus report overall consumption (community and hospital sectors combined). Data from the United Kingdom represents England, Northern Ireland and Scotland. Consumption reported by Canada includes vancomycin, metronidazole, colistin and fidaxomicin.
Source: The European Centre for Disease Prevention and Control and the Public Health Agency of Canada.
Antimicrobial consumption by humans in the community sector: Defined daily doses
Between 2015 and 2019, human antimicrobial consumption in the community sector decreased by 4.0% (15.8 to 15.1 DDDs per 1,000 inhabitant-days) and the proportion of total DDDs dispensed in Canada attributed to the community sector increased from 91.4% to 92.7%.
Antimicrobial consumption by humans in the community sector: Prescriptions filled
Between 2015 and 2019, the rate of antimicrobial prescriptions dispensed by retail pharmacies decreased by 3.0% (641.6 to 622.5 prescriptions per 1,000 inhabitants) and the number of DDDs decreased by 4.0% (5,755.1 to 5,523.4 DDDs per 1,000 inhabitants).
In 2019, 1.7 antimicrobial prescriptions were dispensed by Canadian retail pharmacies each day for every 1,000 people in Canada.
In 2019, the rate of antimicrobial prescriptions dispensed by retail pharmacies was highest in females aged 80 years or more (1,310.0 prescriptions per 1,000 inhabitants), followed by males aged 80 years or more (1,112.7 prescriptions per 1,000 inhabitants). The lowest rate was males aged 19 to 44 years (364.9 prescriptions per 1,000 inhabitants), followed by males aged 0 to 18 years (471.1 prescriptions per 1,000 inhabitants) and females aged 0 to 18 (511.7 prescriptions per 1,000 inhabitants).
The rate of antimicrobial prescriptions filled by retail pharmacies decreased for all age categories between 2018 and 2019.
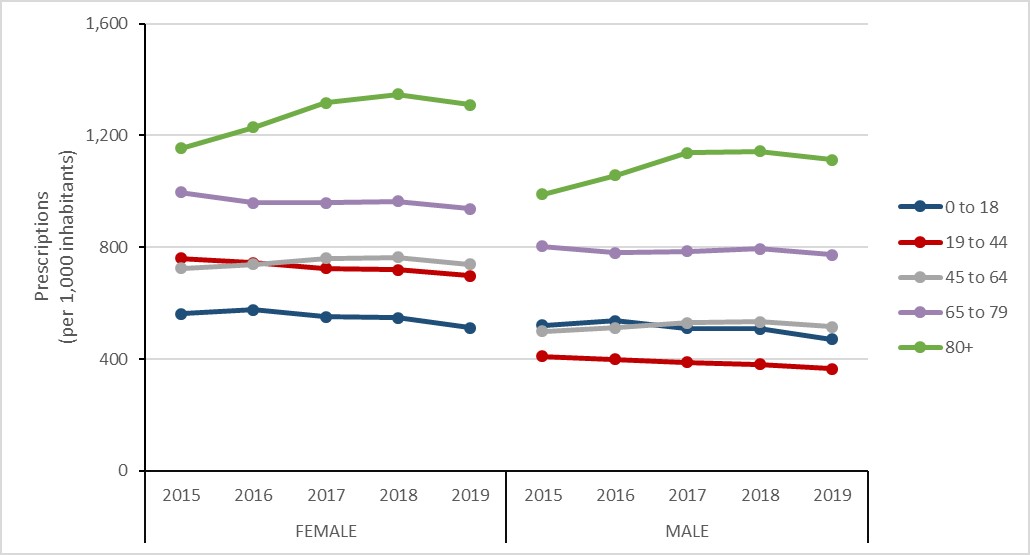
Figure 13: Text description
| Sex | Female | Male | ||||||||
|---|---|---|---|---|---|---|---|---|---|---|
| Year | 2015 | 2016 | 2017 | 2018 | 2019 | 2015 | 2016 | 2017 | 2018 | 2019 |
| 0 to 18 | 561.9 | 576.6 | 551.8 | 546.8 | 511.7 | 519.0 | 536.5 | 510.3 | 507.5 | 471.1 |
| 19 to 44 | 760.9 | 745.1 | 724.4 | 720.0 | 697.3 | 407.5 | 398.9 | 387.9 | 380.3 | 364.9 |
| 45 to 64 | 725.1 | 738.8 | 760.4 | 764.8 | 739.2 | 497.5 | 512.3 | 528.9 | 532.7 | 516.1 |
| 65 to 79 | 996.2 | 958.9 | 958.5 | 965.0 | 938.1 | 802.4 | 780.8 | 785.5 | 793.8 | 773.5 |
| 80+ | 1153.9 | 1228.6 | 1316.4 | 1347.7 | 1310.0 | 989.9 | 1056.9 | 1138.4 | 1143.5 | 1112.7 |
Antimicrobial consumption by humans in the community sector: Prescription origin
Between 2015 and 2019, an 8.4% decrease (420.3 to 384.8 prescriptions per 1,000 inhabitants) was observed in the rates of prescriptions originating from general practitioners (GP) and family physicians (FP) and the rate of prescriptions originating from all other physician specialities increased by 3.4% (83.9 to 86.8 prescriptions per 1,000 inhabitants).
Of non-physician sources, the rate of prescribing increased by 9.8% (137.0 to 150.4 prescriptions per 1,000 inhabitants) between 2015 and 2019. While overall prescribing by dentists increased by 1.2% (46.9 to 47.4 prescriptions per 1,000 inhabitants), prescribing by nurse practitioners and pharmacists increased by 67.6% (10.0 to 16.8 prescriptions per 1,000 inhabitants) and 210.3% (3.3 to 10.1 prescriptions per 1,000 inhabitants), respectively.
In 2019, 61.8% of antimicrobial prescriptions originated from GPs and FPs, 7.6% originated from dentists, 2.7% originated from nurse practitioners and 1.6% originated from pharmacists
In 2019, family physicians and general practitioners were responsible for 62% of prescriptions, compared to dentists (8%), nurses (3%) and pharmacists (2%).
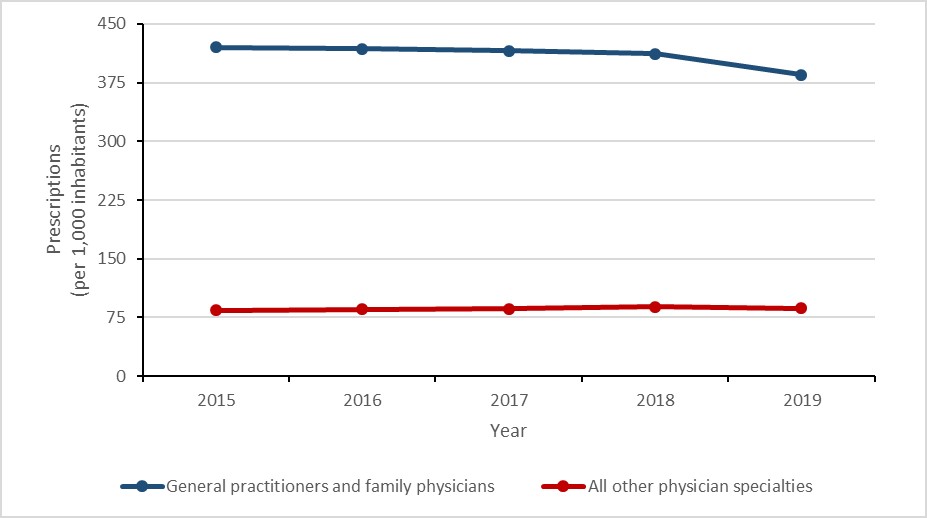
Figure 14: Text description
| Year | General practitioners and family physicians | All other physician specialties |
|---|---|---|
| 2015 | 420.3 | 83.9 |
| 2016 | 418.1 | 85.2 |
| 2017 | 415.9 | 86.2 |
| 2018 | 412.0 | 88.4 |
| 2019 | 384.8 | 86.8 |
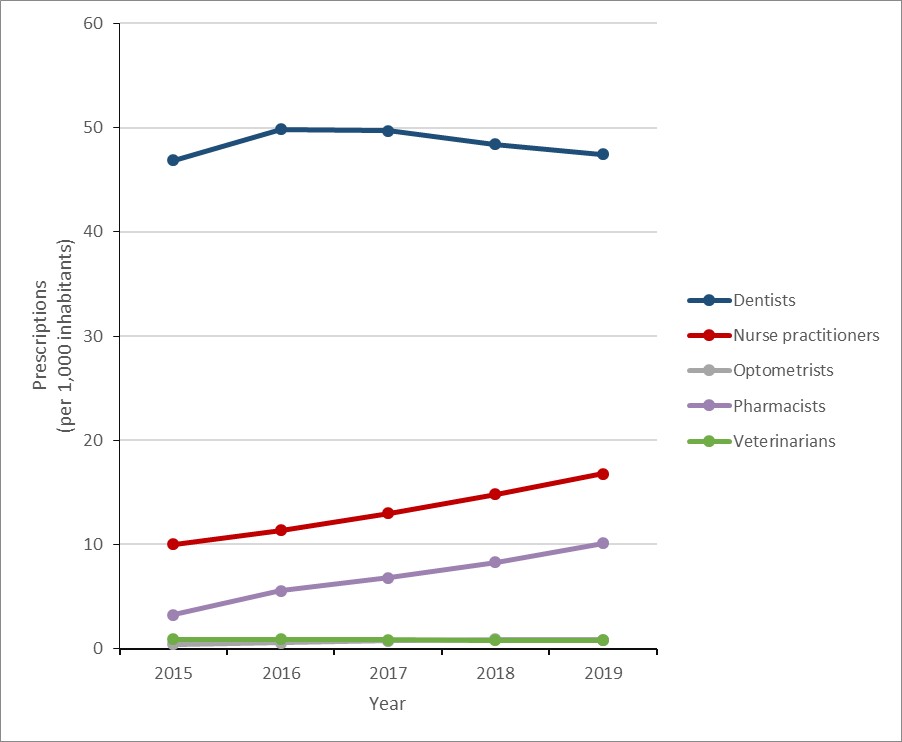
Figure 15: Text description
| Year | Dentists | Nurse practitioners | Optometrists | Pharmacists | Veterinarians |
|---|---|---|---|---|---|
| 2015 | 46.9 | 10.0 | 0.4 | 3.3 | 0.9 |
| 2016 | 49.8 | 11.3 | 0.6 | 5.6 | 0.9 |
| 2017 | 49.7 | 13.0 | 0.8 | 6.8 | 0.9 |
| 2018 | 48.4 | 14.8 | 0.9 | 8.3 | 0.8 |
| 2019 | 47.4 | 16.8 | 0.9 | 10.1 | 0.8 |
Antimicrobial consumption by humans in the community sector: Carbapenems dispensed
Carbapenems are a class of antimicrobial that can be used to treat multidrug-resistant infections and are sometimes referred to as a drug of last resort. In Canada, carbapenems have never been licensed for use in animals.
Between 2015 and 2019, carbapenem consumption in the community increased by 68.3% (3.8 to 6.4 DDDs per 1,000 inhabitants), largely driven by an increase of 156.4% in the use of meropenem (0.6 to 1.6 DDDs per 1,000) and an increase of 49.8% in the use of ertapenem (3.1 to 4.6 DDDs per 1,000 inhabitants).
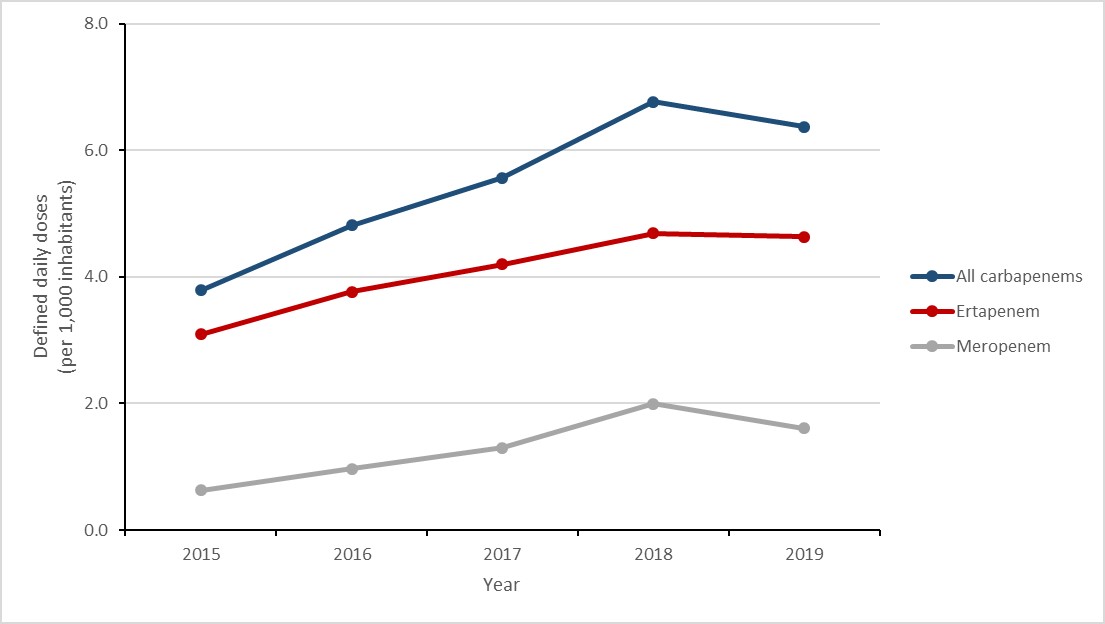
Figure 16: Text description
| Year | All carbapenems | Ertapenem | Meropenem |
|---|---|---|---|
| 2015 | 3.8 | 3.1 | 0.6 |
| 2016 | 4.8 | 3.8 | 1.0 |
| 2017 | 5.6 | 4.2 | 1.3 |
| 2018 | 6.8 | 4.7 | 2.0 |
| 2019 | 6.4 | 4.6 | 1.6 |
Antimicrobials purchased by the hospital sector: Defined daily doses
Between 2015 and 2019, the quantity of antimicrobials purchased by hospitals decreased by 19.7% (from 544.2 to 437.1 DDDs per 1,000 inhabitants), largely driven by a decrease of 28.5% between 2018 and 2019 (611.7 to 437.1 DDDs per 1,000 inhabitants, subject to returns adjustment). The proportion of total DDDs consumed by humans in Canada attributed to hospital purchasing decreased from 8.6% in 2015 to 7.3% in 2019.
Antimicrobial prescribing in the community sector before and during the COVID-19 pandemic: preliminary results, January to October 2020
Key findings
- Between March and October 2020, the overall rate of antimicrobial prescribing decreased by 27% when compared to the same eight-month period in 2019.
- Overall prescribing decreased by a maximum of 40% in May 2020.
- Prescribing to children (aged 0 to 18 years) decreased by a maximum of 70% in April 2020.
- Prescribing to seniors (aged 80 years or more) decreased by a maximum of 28% in May 2020.
Methods
To assess the impact of the COVID-19 pandemic on prescribing practices in Canada, the rate of prescribing by month in 2020 was compared against the corresponding month in 2019. The start of the Canadian pandemic period was defined as March 2020, corresponding with the closure of the Canada-United States land boarder. Final statistics on the entire pandemic period will be published in a future report.
The analysis dataset was comprised of 20 months of community antibiotic prescribing dispensing data from IQVIA’s Canadian CompuScript (CS) database, covering all ten Canadian provinces from March 2019 to October 2020. Information on prescription drug strengths and dosages was obtained from Health Canada’s Drug Product Database (DPD) using drug identification numbers (DIN). Population estimates were obtained from mid-year census population estimates from Statistics Canada.
During the start of the COVID-19 pandemic (March to October 2020), the average rate of antimicrobial prescribing decreased by 26.5% when compared to the same months in 2019 (50.4 to 37.0 prescriptions per 1,000 inhabitants). The largest decreases were observed in the early months of the pandemic; the rate of antimicrobial prescribing decreased by 38% (54.0 to 33.4 prescriptions per 1,000 inhabitants) in April 2020 and by 40% (52.7 to 31.9 prescriptions per 1,000 inhabitants) in May 2020. While the disparity narrowed during the summer months, the rate of antimicrobial prescribing decreased again by 30% (54.2 to 38.1 prescriptions per 1,000 inhabitants) in October 2020.
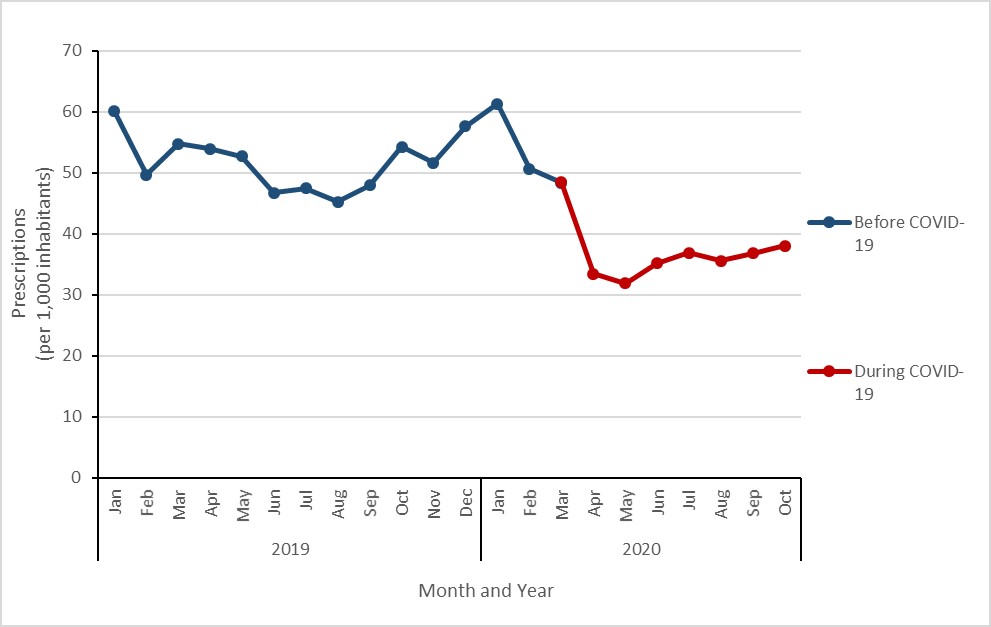
Figure 17: Text description
| Year | 2019 | |||||||||||
|---|---|---|---|---|---|---|---|---|---|---|---|---|
| Month | Jan | Feb | Mar | Apr | May | Jun | Jul | Aug | Sep | Oct | Nov | Dec |
| Before COVID-19 | 60.0 | 49.7 | 54.7 | 54.0 | 52.7 | 46.7 | 47.5 | 45.2 | 47.9 | 54.2 | 51.7 | 57.6 |
| During COVID-19 | n/a | n/a | n/a | n/a | n/a | n/a | n/a | n/a | n/a | n/a | n/a | n/a |
| Year | 2020 | |||||||||||
| Month | Jan | Feb | Mar | Apr | May | Jun | Jul | Aug | Sep | Oct | Nov | Dec |
| Before COVID-19 | 61.3 | 50.6 | n/a | n/a | n/a | n/a | n/a | n/a | n/a | n/a | n/a | n/a |
| During COVID-19 | n/a | n/a | 48.4 | 33.4 | 31.9 | 35.2 | 36.9 | 35.6 | 36.8 | 38.1 | n/a | n/a |
The start of the Canadian pandemic period was defined as March 2020, corresponding with the closure of the Canada-United States land boarder.
Between the months of March to October 2019 compared to the same months in 2020, the rate of antimicrobial prescribing was higher in females compared to males.
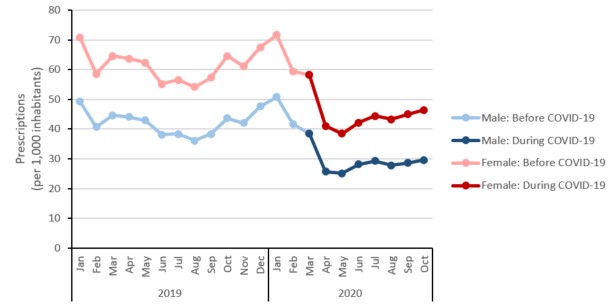
Figure 18: Text description
| Year | 2019 | |||||||||||
|---|---|---|---|---|---|---|---|---|---|---|---|---|
| Month | Jan | Feb | Mar | Apr | May | Jun | Jul | Aug | Sep | Oct | Nov | Dec |
| Male: Before COVID-19 | 49.2 | 40.7 | 44.7 | 44.1 | 43.0 | 38.2 | 38.4 | 36.2 | 38.4 | 43.7 | 42.0 | 47.6 |
| Male: During COVID-19 | n/a | n/a | n/a | n/a | n/a | n/a | n/a | n/a | n/a | n/a | n/a | n/a |
| Female: Before COVID-19 | 70.7 | 58.5 | 64.6 | 63.7 | 62.3 | 55.2 | 56.5 | 54.2 | 57.4 | 64.6 | 61.2 | 67.5 |
| Female: During COVID-19 | n/a | n/a | n/a | n/a | n/a | n/a | n/a | n/a | n/a | n/a | n/a | n/a |
| Year | 2020 | |||||||||||
| Month | Jan | Feb | Mar | Apr | May | Jun | Jul | Aug | Sep | Oct | Nov | Dec |
| Male: Before COVID-19 | 50.9 | 41.7 | n/a | n/a | n/a | n/a | n/a | n/a | n/a | n/a | n/a | n/a |
| Male: During COVID-19 | n/a | n/a | 38.5 | 25.7 | 25.2 | 28.1 | 29.3 | 27.8 | 28.6 | 29.6 | n/a | n/a |
| Female: Before COVID-19 | 71.7 | 59.4 | n/a | n/a | n/a | n/a | n/a | n/a | n/a | n/a | n/a | n/a |
| Female: During COVID-19 | n/a | n/a | 58.2 | 41.0 | 38.5 | 42.1 | 44.4 | 43.2 | 45.0 | 46.4 | n/a | n/a |
The average rate of antimicrobial prescribing decreased for all age categories during the first eight months of the COVID-19 pandemic (March to October). The smallest reduction during this period was in those aged 80 years or more, decreasing by 18.8% (102.8 to 83.5 prescriptions per 1,000 inhabitants); the largest reduction during this period was in those aged 0 to 18 years, decreasing by 50.7% (37.2 to 18.3 prescriptions per 1,000 inhabitants).
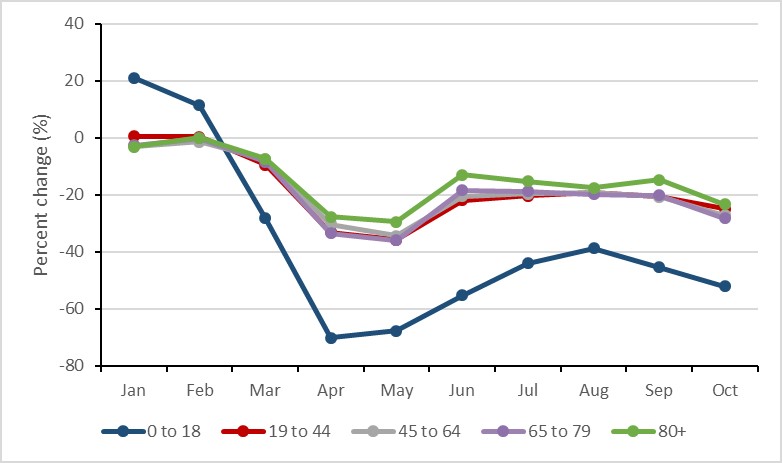
Figure 19: Text description
| Month | Jan | Feb | Mar | Apr | May | Jun | Jul | Aug | Sep | Oct |
|---|---|---|---|---|---|---|---|---|---|---|
| 0 to 18 | 21.12% | 11.50% | -28.12% | -70.07% | -67.60% | -55.16% | -44.03% | -38.68% | -45.31% | -52.03% |
| 19 to 44 | 0.64% | 0.39% | -9.49% | -33.08% | -35.75% | -21.94% | -20.37% | -19.10% | -20.51% | -24.90% |
| 45 to 64 | -2.87% | -1.29% | -7.48% | -30.29% | -34.32% | -20.42% | -19.64% | -19.00% | -20.58% | -27.22% |
| 65 to 79 | -2.60% | -0.19% | -8.43% | -33.53% | -35.87% | -18.30% | -18.69% | -19.80% | -20.08% | -28.13% |
| 80+ | -3.16% | 0.10% | -7.32% | -27.74% | -29.47% | -12.94% | -15.19% | -17.54% | -14.75% | -23.33% |
Antimicrobial intended for use in animals in Canada
Key findings
- Between 2018 and 2019, the tonnage of antimicrobial active ingredient distributed for use in production animals decreased by 11%Footnote 2.
- Between 2018 and 2019:
- antimicrobial sales for use in pigs, poultry and fish decreased;
- antimicrobial sales for use in cattle, horses, companion animals and small ruminants increased.
- In 2019, Canada distributed the eighth highest quantity of antimicrobials intended for use in animals compared to the latest data (2018) from 31 European countries.
Methodology update
Changes to the Food and Drug Regulations (published May of 2017) aim to increase the oversight of antimicrobials available for use in animals. Since 2018, manufacturers, importers, and compounders must provide annual sales reports of medically important antimicrobials intended for use in animals (Health Canada (HC), 2020). These reports will replace the data historically provided on a voluntary basis by the Canadian Animal Health Institute (CAHI).
To help with these reporting requirements, Health Canada’s Veterinary Drugs Directorate and the Public Health Agency of Canada’s Centre for Foodborne, Environment and Zoonotic Infectious Diseases and the Canadian Network for Public Health Intelligence (CNPHI) developed an online sales data collection system, called the Veterinary Antimicrobial Sales Reporting (VASR) system.
This report categorizes antimicrobials according to their importance to human medicine as per a categorization system developed by Health Canada’s Veterinary Drugs Directorate. In this system, Category I antimicrobials are considered of very high importance to human medicine (e.g. fluoroquinolones). Category II are of high importance to human medicine (e.g. macrolides), and Category III antimicrobials are of medium importance to human medicine (e.g. tetracyclines). Category IV antimicrobials (i.e. low importance to human medicine, such as ionophores) are not included in this document. In Canada, antimicrobials that are considered medically important can be found in Health Canada’s List A: List of certain antimicrobial active pharmaceutical ingredients.
Antimicrobials sold for use in animals
Between 2018 and 2019, the kilograms of antimicrobials sold for use in animals decreased by 10.5% (1.1 million to 1.0 million kilograms). Similarly, for production animals, the quantity of antimicrobials measured in milligrams (mg) per population correction unit (PCU) decreased by 12% (150 to 132 mg/PCU) using the Canadian standard weights of animals and by 12% (163 to 143 mg/PCU) using the European standard weights of animals.
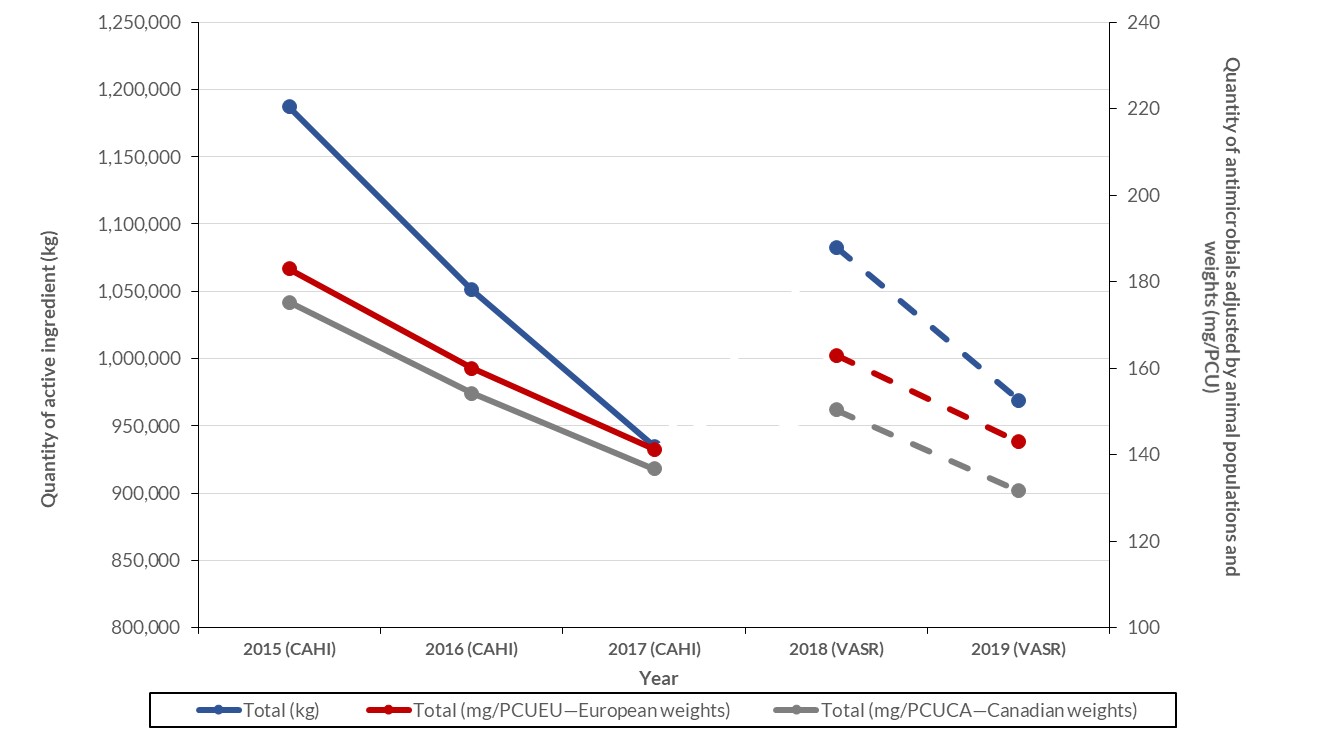
Figure 20: Text description
| Metrics | Total (kg) | Total (mg/PCUEU—European weights) | Total (mg/PCUCA—Canadian weights) |
|---|---|---|---|
| 2015 (CAHI) | 1187135.8 | 183.0 | 175.2 |
| 2016 (CAHI) | 1051010.0 | 160.0 | 154.2 |
| 2017 (CAHI) | 934872.7 | 141.2 | 136.8 |
| 2018 (VASR) | 1082768.0 | 162.9 | 150.3 |
| 2019 (VASR) | 968985.0 | 143.0 | 131.7 |
Notes:
- Population data used for live horses was from 2010. VASR data excludes antifungals, antiparasitics, antivirals, Category IV antimicrobials, and uncategorized not medically important antimicrobials. CAHI data excludes ionophores and chemical coccidiostats.
- Sources: The Canadian Integrated Program for Antimicrobial Resistance Surveillance (CIPARS), The Canadian Integrated Program for Antimicrobial Resistance Surveillance (CIPARS), the Canadian Animal Health Institute (CAHI), the European Surveillance of Veterinary Antimicrobial Consumption (ESVAC), Fisheries and Oceans Canada, Statistics Canada, Agriculture and AgriFood Canada, Equestrian Canada, Chicken Farmers of Canada, Egg Farmers of Canada, Canadian Hatching Egg Producers, and Canfax.
- The figure indicates a break in the lines between the data as provided by CAHI (2015, 2016, and 2017) and the data provided in the VASR system. These two data sources have different data providers; trends should be interpreted with caution.
In 2019, the top five classes of antimicrobial active ingredients sold for use in animals by weight (excluding quantities of antimicrobial classes which cannot be independently reported) were tetracyclines (495,116 kilograms), macrolides (115,822 kilograms), penicillins (91,095 kilograms), sulfonamides (53,226 kilograms) and lincosamides (46,390 kilograms). Overall, one percent of antimicrobial active ingredients sold for use in animals were Category I (i.e. of very high importance to human medicine); however, sales of category I antimicrobials increased by 10% between 2018 and 2019.
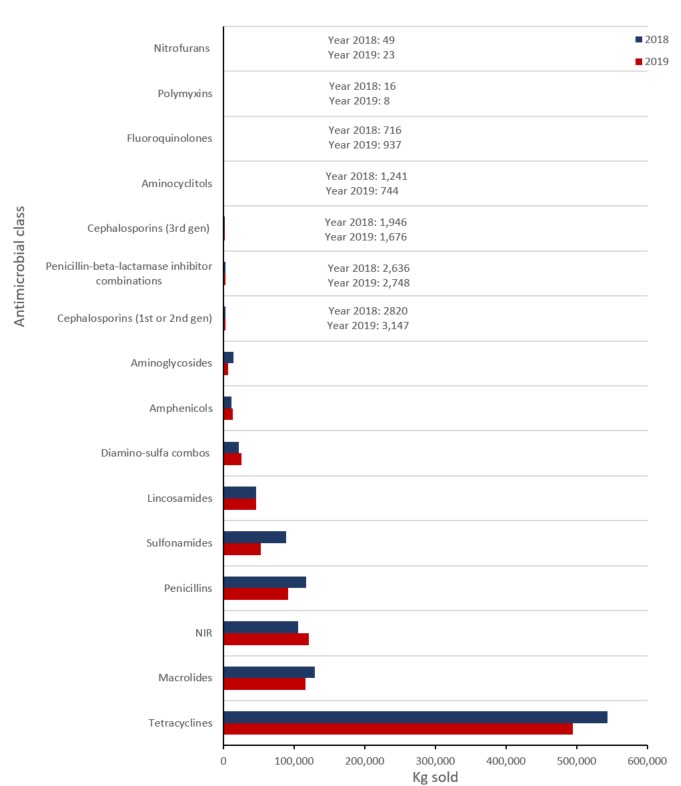
Figure 21: Text description
| Year | 2018 | 2019 |
|---|---|---|
| Nitrofurans | 49 | 23 |
| Polymyxins | 16 | 8 |
| Fluoroquinolones | 716 | 937 |
| Aminocyclitols | 1,241 | 744 |
| Cephalosporins (3rd gen) | 1,946 | 1,676 |
| Penicillin-beta-lactamase inhibitor combinations | 2636 | 2748 |
| Cephalosporins (1st or 2nd gen) | 2,820 | 3,147 |
| Aminoglycosides | 14,467 | 6,487 |
| Amphenicols | 11,318 | 13,030 |
| Diamino-sulfa combos | 22,051 | 25,519 |
| Lincosamides | 46,583 | 46,390 |
| Sulfonamides | 88,274 | 53,226 |
| Penicillins | 117,222 | 91,095 |
| NIR | 106,121 | 120,455 |
| Macrolides | 129,579 | 115,822 |
| Tetracyclines | 544,102 | 495,116 |
Notes: Not independently reported (NIR) antimicrobials include aminocoumarins, bacitracins, diaminopyrimidines, fusidic acid, glycopeptides, nitroimidazoles, orthosomycins, phosphonic acid derivatives, pleuromutilins, pseudomonic acids, streptogramins, and therapeutic agents for tuberculosis. Data exclude antifungals, antiparasitics, antivirals, category IV antimicrobials, and uncategorized not medically important antimicrobials.
Between 2018 and 2019, sales of antimicrobials for use in pigs, poultry and fish decreased; sales for use in cattle, horses, companion animals and small ruminants increased. For additional information on antimicrobials intended for use in veal calves, horses, small ruminants and other animals, please see the most recent CIPARS Report.
Aquaculture
- Kilograms of antimicrobials sold for use in aquaculture decreased by 29% between 2018 and 2019.
- In 2019, the only antimicrobial classes sold for use in aquaculture were tetracyclines and amphenicols.
Beef cattle
- Kilograms of antimicrobials sold for use in beef cattle increased by 14% between 2018 and 2019, noting an increase of 6% in the sales of Category I antimicrobials.
- In 2019, the top three antimicrobial classes sold for use in beef cattle were tetracyclines, macrolides, and amphenicols.
Dairy cattle
- Kilograms of antimicrobials sold for use in dairy cattle increased by 15% between 2018 and 2019 noting a decrease of 25% in the sales of Category I antimicrobials.
- In 2019, the top three antimicrobial classes sold for use in dairy cattle were tetracyclines, diaminopyrimidine-sulfonamide combinations, and penicillins.
Poultry (chickens and turkeys)
- Kilograms of antimicrobials sold for use in poultry decreased by 9% between 2018 and 2019.
- In 2019, the highest quantity of antimicrobials sold for use in poultry was not independently reported;
- Small quantities (less than one kilogram) of fluoroquinolones and third generation cephalosporins (antimicrobials of very high importance to human medicine) were sold or compounded for use in poultry in 2018 and 2019.
Pigs
- Kilograms of antimicrobials sold for use in pigs decreased by 21% between 2018 and 2019, noting a decrease of 24% in the sales of Category I antimicrobials.
- In 2019, the top three antimicrobial classes sold for use in pigs were tetracyclines, macrolides, and penicillins.
Companion animals
- Kilograms of antimicrobials sold for use in companion animals increased by 17% between 2018 and 2019, noting an increase of 24% in the sales of Category I antimicrobials.
- In 2019, the top three antimicrobial classes sold for use in companion animals were first or second generation cephalosporins, penicillins and β-lactamase inhibitors combinations, and antimicrobials grouped in the “not independently reported’’ category.
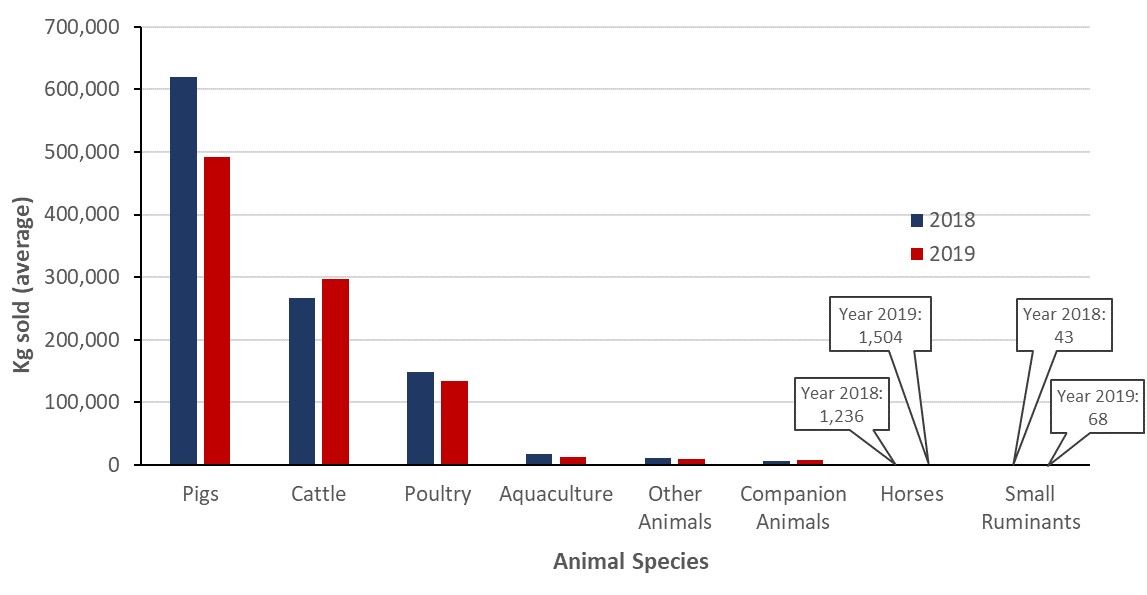
Figure 22: Text description
| Year | 2018 | 2019 |
|---|---|---|
| Animal species | Average | Average |
| Pigs | 620355 | 491640 |
| Cattle | 266343 | 297810 |
| Poultry | 147853 | 134351 |
| Aquaculture | 17596 | 12507 |
| Other Animals | 10274 | 10093 |
| Companion Animals | 6373 | 7440 |
| Horses | 1236 | 1504 |
| Small Ruminants | 43 | 68 |
Notes: VASR data excludes antifungals, antiparasitics, antivirals, Category IV antimicrobials, and uncategorized not medically important antimicrobials.
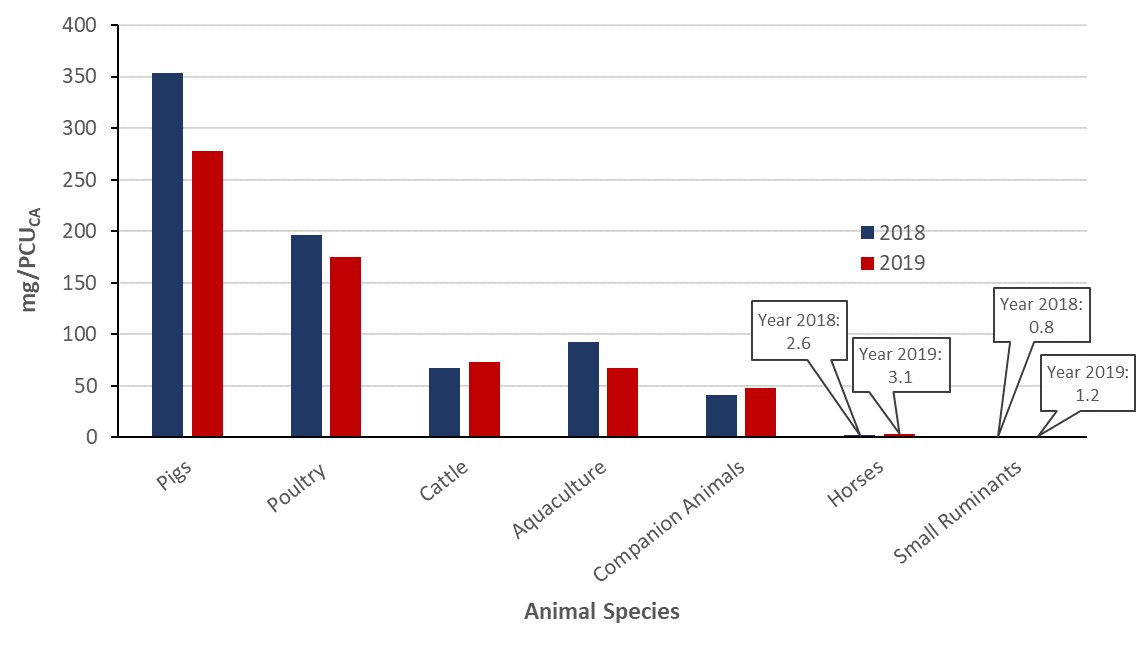
Figure 23: Text description
| Year | 2018 | 2019 |
|---|---|---|
| Animal species | Average | Average |
| Pigs | 353.8 | 277.5 |
| Poultry | 196.7 | 175.2 |
| Cattle | 67.1 | 72.7 |
| Aquaculture | 92.5 | 66.9 |
| Companion Animals | 40.8 | 47.6 |
| Horses | 2.6 | 3.1 |
| Small Ruminants | 0.8 | 1.2 |
Notes: VASR data excludes antifungals, antiparasitics, antivirals, Category IV antimicrobials, and uncategorized not medically important antimicrobials. “Other Animal” species could not be ascribed to any of the current species; hence no denominator could be determined for these species and these data were excluded. Note the denominator for aquaculture was calculated differently than for the terrestrial animal species (modified ESVAC approach). Additional information can be found in the most recent CIPARS Report
Antimicrobials sold for use in animals: International perspective
The European Surveillance of Veterinary Antimicrobial Consumption (ESVAC) Network collects and reports data on the quantity of antimicrobials intended for use in animals in 31 European countries. This information is reported in milligrams per population correction unit (mg/PCU) and was the best publically available source for country-specific international comparisons.
When compared to the latest data provided by ESVAC and making the assumption that the data are comparable, Canada ranked eighth highest in terms of quantities of antimicrobials sold for use in production animals compared to European countries.
It is important to note that the structure and detail in the data for animal production classes available in the European datasets differ from the Canadian datasets; hence this figure should be interpreted with caution. The Canadian denominator data included the numbers of live beef cows, which are not included as a separate category in the European data.
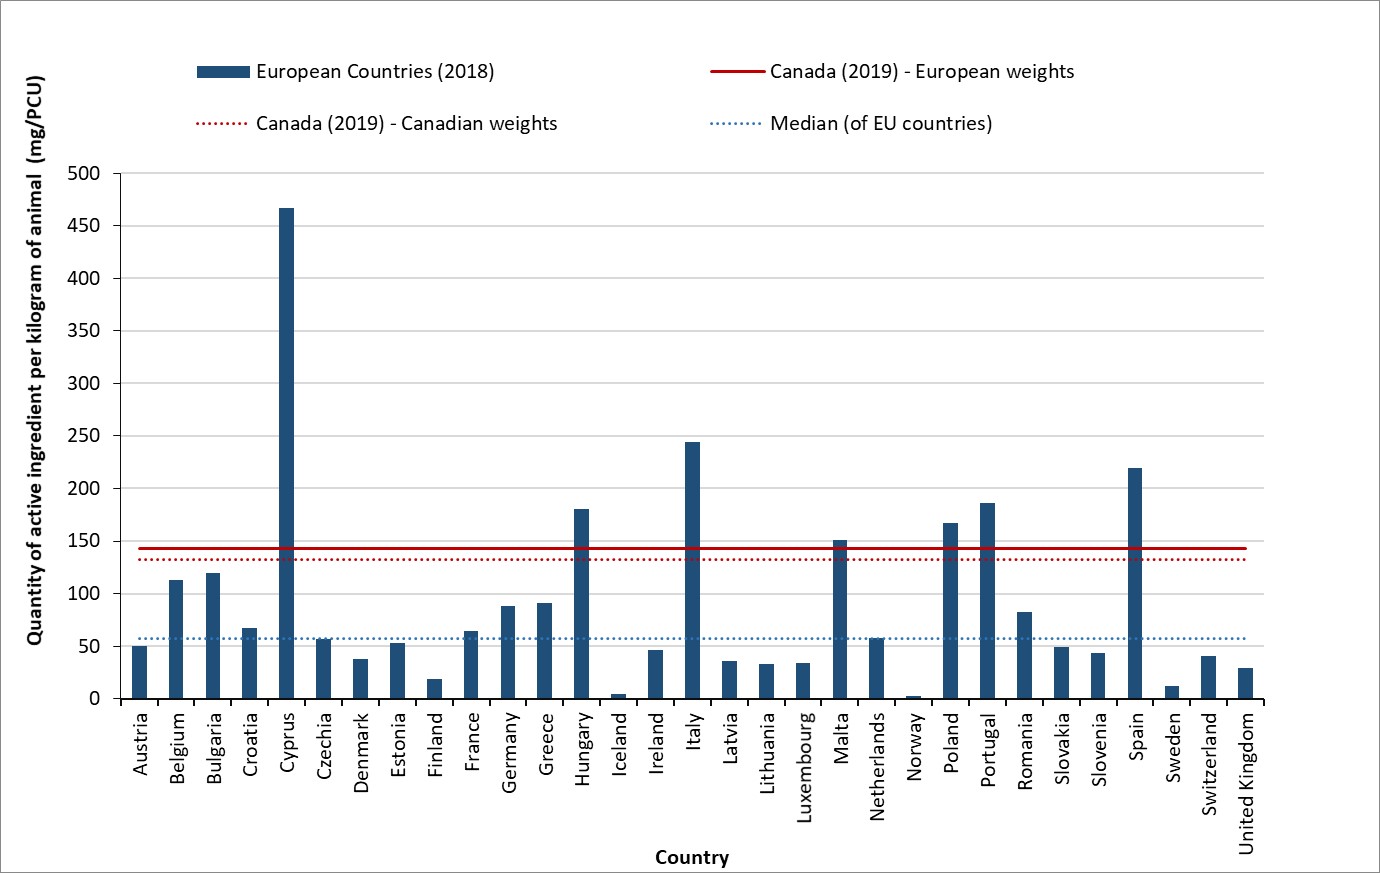
Figure 24: Text description
| European Countries (2018) | European Countries (2018) | Canada (2019) - European weights | Canada (2019) - Canadian weights | Median (of EU countries) |
|---|---|---|---|---|
| Austria | 50 | 143 | 132 | 57 |
| Belgium | 113 | 143 | 132 | 57 |
| Bulgaria | 120 | 143 | 132 | 57 |
| Croatia | 67 | 143 | 132 | 57 |
| Cyprus | 466 | 143 | 132 | 57 |
| Czechia | 57 | 143 | 132 | 57 |
| Denmark | 38 | 143 | 132 | 57 |
| Estonia | 53 | 143 | 132 | 57 |
| Finland | 19 | 143 | 132 | 57 |
| France | 64 | 143 | 132 | 57 |
| Germany | 88 | 143 | 132 | 57 |
| Greece | 91 | 143 | 132 | 57 |
| Hungary | 181 | 143 | 132 | 57 |
| Iceland | 5 | 143 | 132 | 57 |
| Ireland | 46 | 143 | 132 | 57 |
| Italy | 244 | 143 | 132 | 57 |
| Latvia | 36 | 143 | 132 | 57 |
| Lithuania | 33 | 143 | 132 | 57 |
| Luxembourg | 34 | 143 | 132 | 57 |
| Malta | 151 | 143 | 132 | 57 |
| Netherlands | 58 | 143 | 132 | 57 |
| Norway | 3 | 143 | 132 | 57 |
| Poland | 167 | 143 | 132 | 57 |
| Portugal | 187 | 143 | 132 | 57 |
| Romania | 83 | 143 | 132 | 57 |
| Slovakia | 49 | 143 | 132 | 57 |
| Slovenia | 43 | 143 | 132 | 57 |
| Spain | 219 | 143 | 132 | 57 |
| Sweden | 13 | 143 | 132 | 57 |
| Switzerland | 40 | 143 | 132 | 57 |
| United Kingdom | 30 | 143 | 132 | 57 |
Notes: VASR data (manufacturer and importer data) excludes antifungals, antiparasitics, antivirals, Category IV antimicrobials, and uncategorized not medically important antimicrobials. The PCU denominator was harmonized to the greatest extent possible with the ESVAC network (the ESVAC denominator does not include beef cows, whereas in Canada beef cows are a significant population and are included; ESVAC excludes companion animal data from the numerator). The Canadian data used for live horses was from 2010.
Sources: European Medicines Agency, European Surveillance of Veterinary Antimicrobial Consumption, 2020. Sales of veterinary antimicrobial agents in 31 European countries in 2018. (EMA/24309/2020). Available at: https://www.ema.europa.eu/en/documents/report/sales-veterinary-antimicrobial-agents-31-european-countries-2018-trends-2010-2018-tenth-esvac-report_en.pdf. Accessed January 23, 2021.
It is important to note that the structure and detail in the data for animal production classes available in the European datasets differ from the Canadian datasets; hence this figure should be interpreted with caution.
Indication for antimicrobial use in animals (farm-level surveillance)
Information on the indication for AMU in broiler chickens, grower finisher pigs and turkeys was available through sentinel farm surveillance conducted in 2019. The majority of AMU was for disease prevention (primarily for the prevention of enteric diseases)
Figure 25: Text description
| Broiler chicken | |||||
|---|---|---|---|---|---|
| Year | 2015 | 2016 | 2017 | 2018 | 2019 |
| Number of flocks/herds | 135 | 136 | 137 | 141 | 147 |
| Disease treatment | 32.3 | 14.5 | 26.0 | 22.2 | 32.8 |
| Disease prevention | 115.5 | 115.4 | 108.0 | 102.1 | 109.7 |
| Growth promotion | 0.7 | 0.3 | 0.5 | 0.1 | 0.0 |
| Grower-finisher pigs | |||||
| Year | 2015Footnote * | 2016Footnote * | 2017 | 2018 | 2019 |
| Number of flocks/herds | 85 | 91 | 82 | 97 | 107 |
| Disease treatment | 16.0 | 3.7 | 15.1 | 8.9 | 20.2 |
| Disease prevention | 90.0 | 76.8 | 58.2 | 83.5 | 102.1 |
| Growth promotion | 70.3 | 35.0 | 46.1 | 27.6 | 7.9 |
| Turkeys | |||||
| Year | 2015 | 2016 | 2017 | 2018 | 2019 |
| Number of flocks/herds | Not available | 72 | 74 | 95 | 98 |
| Disease treatment | Not available | 2.0 | 6.0 | 6.2 | 16.3 |
| Disease prevention | Not available | 58.1 | 51.9 | 47.0 | 67.2 |
| Growth promotion | Not available | 0.1 | 0.7 | 0.1 | 0.0 |
Footnotes
|
|||||
For broiler chicken flocks
In 2019, there was continued use of medically important antimicrobials for growth promotion purposes on three of the 107 sentinel farms.
Excluding the use of Category IV antimicrobials (including ionophores and flavophospholipols) in feed, the reported quantity of antimicrobials used for growth promotion declined to 21 DDD/1000 PDAR, or 13% (21/162) of overall use in feed for 2019. Comparatively, it was 42 DDD/1000 PDAR, or 24% (42/178) in 2018. Antimicrobials administered by water and injection were used for disease prevention or treatment only, not growth promotion.
For broiler chicken flocks
There were no broiler chicken sentinel farms reporting the use of antimicrobials for growth promotion in 2019.
For turkey flocks
There were no turkey sentinel farms reporting antimicrobials for growth promotion in 2019.
Integrating information on antimicrobials intended for use across sectors (human, animals and crops)
Overall
The total kilograms of antimicrobials sold for use among the human and animal as well as plant sectors was calculated through the integration of data sourced from IQVIA, VASR and the Health Canada’s Pest Management Regulatory Agency.
In 2019, a total of 1.2 million kg of medically important antimicrobials were sold in Canada. Sales for use in production animals represented 78% of the total, humans represented 22%, companion animals represented <1% and antimicrobials for use as pesticides on food crops represented <1%.
However, in 2019, there were approximately 23 animals for every human in Canada (an underestimate, as the numbers of fish are not included in the numbers of animals). When the biomass of people and animals was taken into account, this revealed that approximately 1.4 times more antimicrobials were intended for use in production animals than in people using European standard weights of animals. It would be 1.3 times using Canadian standard weights of animals.
While similar antimicrobial groups were distributed or purchased for use in both sectors, the types of antimicrobials sold varied (Figure 26). Sales for antimicrobials in the animal sector reflected relatively more tetracyclines and macrolides than the human sector. Conversely, there were relatively more sales of third generation (and higher generation) cephalosporins and fluoroquinolones in the human sector than the animal sector. In Canada, the carbapenem class antimicrobials have never been licensed for use in animals.
Figure 26: Text description
| Antimicrobial class | Human Data | Animal Sales Data |
|---|---|---|
| Carbapenems | 1095.7 | 0.0 |
| Fluoroquinolones and quinolones | 16577.0 | 937.0 |
| Cephalosporins (1st and 2nd gen) | 44893.7 | 3234.0 |
| Cephalosporins (3rd gen and higher) | 5863.5 | 1676.0 |
| Aminoglycosides | 167.9 | 6487.0 |
| Lincosamides | 6514.4 | 46390.0 |
| Trimethoprim and sulfas | 19827.0 | 78962.0 |
| Macrolides | 14073.9 | 115822.0 |
| Penicillins | 138390.6 | 93843.0 |
| Others* | 14108.3 | 134044.0 |
| Tetracyclines | 8328.4 | 495116.0 |
Data sources: IQVIA and VASR.
Others for humans includes: bacitracin, ceftobiprole medocaril, ceftolozane:tazobactam, chloramphenicol, colistin, daptomycin, fidaxomicin, fosfomycin, fusidic acid, linezolid, metronidazole, nitrofurantoin, and vancomycin.
Others for animals includes: aminocoumarins, aminocyclitols, amphenicols, cyclic polypeptides, fusidic acid, glycopeptides, nitrofurantoins, nitroimidazoles, orthosomycins, phosphonic acid derivatives, pleuromutilins, polymyxins, pseudomonic acids, streptogramins, and therapeutic agents for tuberculosis.
Methods: Antimicrobial use information (i.e., farm-level data)
In 2019, antimicrobial use information was voluntarily provided by 352 sentinel farms participating in the Canadian Integrated Program for Antimicrobial Resistance Surveillance (CIPARS; 147 broiler chicken flocks, 98 turkey flocks, and 107 grower-finisher pig herds). More details can be found in the CIPARS 2019 Design and Methods (Public health Agency of Canada (PHAC), 2020).
Authors
| Primary authors | Program | Contributing authors | Program | Acknowledgements | Program |
|---|---|---|---|---|---|
| Dr. Oscar Niragira Jayson Shurgold Linda Pelude Dr. Carolee Carson Dr. James Brooks |
CARSS CARSS CNISP CIPARS PHAC |
Dr. Aboubakar Mounchili Dr. Agnes Agunos Dr. Anne Deckert Dr. Donald Sheppard Tanya Lary Averil Griffith Braden D Knight Dr. David Leger Delvin Rao Drew Greydanus George Golding Glenys Smith Irene Martin Kelly Baekyung Choi Laura F. Mataseje Melissa McCracken Michael R. Mulvey Reshele Senoli Perera Robyn Mitchell Dr. Sheryl Gow Tim Du Walter Demczuk |
CTBLSS CIPARS CIPARS AMRTF AMRTF NML CARSS CIPARS CARSS CARSS CNISP CARSS NML CNISP CNISP CNISP NML CTBLSS CNISP CIPARS CNISP NML |
Caroline M Desjardins Anada Silva Cecilla Mcclellan Denise Gravel-Tropper Jami Mackenzie Jennifer Campbell Joëlle Cayen Marianna Ofner Romeo Hizon Vivienne Steele Wallis Rudnick CNISP participating hospitals Contributors to CIPARS Health Canada VASR IQVIA Statistics Canada |
CARSS CNISP CNISP CARSS CARSS CNISP CNISP IPC CNISP CNISP CNISP |
Appendices
Appendix A: Antibiotics included in each antimicrobial class (i.s. ATC grouping), Human sector
| Atc4 | Atc4 description | Atc5 | Atc5 description | Molecule |
|---|---|---|---|---|
| A07a | Intestinal anti-infectives | A07aa | Antibiotics | Fidaxomicin |
| Vancomycin | ||||
| J01a | Tetracyclines | J01aa | Tetracyclines | Doxycycline |
| Minocycline | ||||
| Tetracycline | ||||
| Tigecycline | ||||
| J01b | Amphenicols | J01ba | Amphenicols | Chloramphenicol |
| J01c | Beta-lactam antibacterials, penicillins | J01ca | Penicillins with extended spectrum | Amoxicillin |
| Ampicillin | ||||
| Piperacillin | ||||
| J01ce | Beta-lactamase sensitive penicillins | Penicillin g | ||
| Penicillin v | ||||
| J01cf | Beta-lactamase resistant penicillins | Cloxacillin | ||
| Dicloxacillin | ||||
| Flucloxacillin | ||||
| Oxacillin | ||||
| J01cr | Combinations of penicillins, incl. Beta-lactamase inhibitors | Amoxicillin: clavulanic acid | ||
| Clavulanic acid: ticarcillin | ||||
| Piperacillin | ||||
| Piperacillin: tazobactam | ||||
| J01d | Other beta-lactam antibacterials | J01db | First-generation cephalosporins | Cefadroxil |
| Cefazolin | ||||
| Cephalexin | ||||
| J01dc | Second-generation cephalosporins | Cefaclor | ||
| Cefoxitin | ||||
| Cefprozil | ||||
| Cefuroxime | ||||
| J01dd | Third-generation cephalosporins | Cefixime | ||
| Cefotaxime | ||||
| Ceftazidime | ||||
| Ceftriaxone | ||||
| J01de | Fourth-generation cephalosporins | Cefepime | ||
| J01df | Monobactams | Aztreonam | ||
| J01dh | Carbapenems | Cilastatin: imipenem | ||
| Ertapenem | ||||
| Meropenem | ||||
| J01di | Other cephalosporins and penems | Ceftobiprole medocaril | ||
| Ceftolozane: tazobactam | ||||
| J01e | Sulfonamides and trimethoprim | J01ea | Trimethoprim and derivatives | Trimethoprim |
| J01ec | Intermediate-acting sulfonamides | Sulfadiazine | ||
| Sulfamethoxazole | ||||
| J01ee | Combinations of sulfonamides and trimethoprim, incl. Derivatives | Sulfamethoxazole: trimethoprim | ||
| J01f | Macrolides, lincosamides and streptogramins | J01fa | Macrolides | Azithromycin |
| Clarithromycin | ||||
| Erythromycin | ||||
| Erythromycin ethylsuccinate | ||||
| Spiramycin | ||||
| J01ff | Lincosamides | Clindamycin | ||
| Lincomycin | ||||
| J01g | Aminoglycoside antibacterials | J01ga | Streptomycins | Streptomycin |
| J01gb | Other aminoglycosides | Amikacin | ||
| Gentamicin | ||||
| Tobramycin | ||||
| J01m | Quinolone antibacterials | J01ma | Fluoroquinolones | Ciprofloxacin |
| Gatifloxacin | ||||
| Levofloxacin | ||||
| Moxifloxacin | ||||
| Norfloxacin | ||||
| Ofloxacin | ||||
| J01x | Other antibacterials | J01xa | Glycopeptide antibacterials | Telavancin |
| Vancomycin | ||||
| J01xb | Polymyxins | Colistin | ||
| Polymyxin b | ||||
| J01xc | Steroid antibacterials | Fusidic acid | ||
| J01xd | Imidazole derivatives | Metronidazole | ||
| J01xe | Nitrofuran derivatives | Nitrofurantoin | ||
| J01xx | Other antibacterials | Bacitracin | ||
| Daptomycin | ||||
| Fosfomycin | ||||
| Linezolid | ||||
| Methenamine | ||||
| P01a | Agents against amoebiasis and other protozoal diseases | P01ab | Nitroimidazole derivatives | Metronidazole |
Appendix B: Supplementary figures
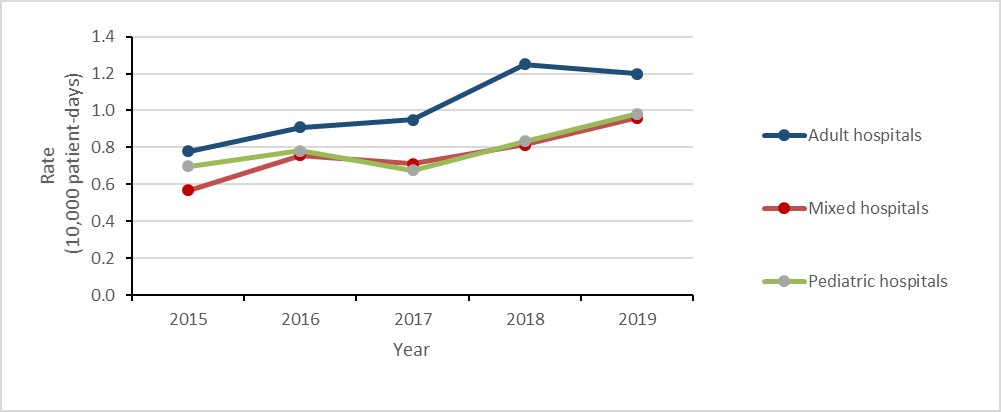
Figure 27: Text description
| Year | 2015 | 2016 | 2017 | 2018 | 2019 |
|---|---|---|---|---|---|
| Adult hospitals | 0.78 | 0.91 | 0.95 | 1.25 | 1.20 |
| Mixed hospitals | 0.57 | 0.76 | 0.71 | 0.81 | 0.96 |
| Pediatric hospitals | 0.70 | 0.78 | 0.68 | 0.83 | 0.98 |
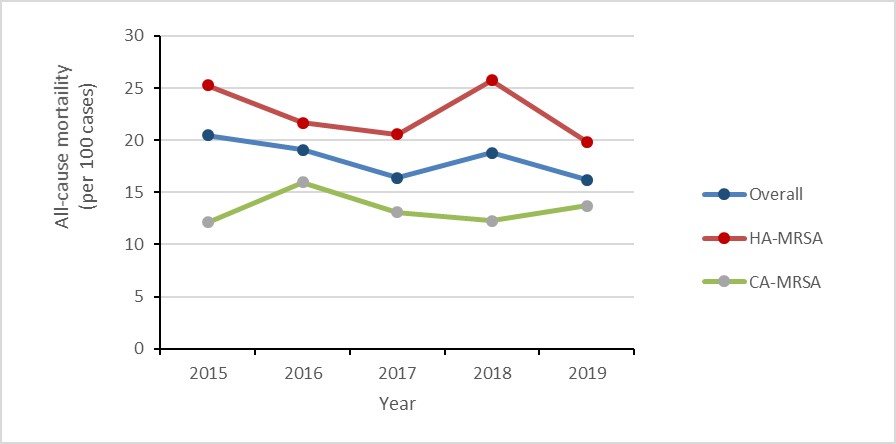
Figure 28: Text description
| Year | 2015 | 2016 | 2017 | 2018 | 2019 |
|---|---|---|---|---|---|
| Overall | 20.5 | 19.1 | 16.4 | 18.8 | 16.2 |
| HA-MRSA | 25.3 | 21.7 | 20.6 | 25.7 | 19.8 |
| CA-MRSA | 12.1 | 16.0 | 13.1 | 12.3 | 13.7 |
Figure 29: Text description
| Year | 2015 | 2016 | 2017 | 2018 | 2019 |
|---|---|---|---|---|---|
| All-cause mortality (n) | 34 | 36 | 7 | 66 | 74 |
| All-cause mortality (per 100 cases) | 41.5 | 31.9 | 32.2 | 29.9 | 36.5 |
Figure 30: Text description
| Year | 2015 | 2016 | 2017 | 2018 | 2019 |
|---|---|---|---|---|---|
| Overall Overall (all-cause) | 9.8 | 8.4 | 7.9 | 8.0 | 8.6 |
| Overall Overall (attributable) | 3.0 | 2.4 | 2.3 | 1.3 | 2.3 |
| HA-CDI HA-CDI (all-cause) | 11.4 | 9.1 | 9.0 | 9.2 | 8.2 |
| HA-CDI HA-CDI (attributable) | 3.4 | 2.5 | 2.8 | 1.1 | 2.1 |
| CA-CDI CA-CDI (all-cause) | 5.1 | 6.3 | 4.0 | 4.1 | 9.8 |
| CA-CDI CA-CDI (attributable) | 1.9 | 2.1 | 0.6 | 1.8 | 3.0 |
Appendix C: Participating CNISP hospitals
| Hospital name | City | Province |
|---|---|---|
| Alberta Children’s Hospital | Calgary | AB |
| BC Children’s Hospital | Vancouver | BC |
| BC Women’s Hospital | Vancouver | BC |
| Bridgepoint Active Healthcare | Toronto | ON |
| Burin Peninsula Health Care Centre | Burin | NL |
| Carbonear General Hospital | Carbonear | NL |
| Centre hospitalier de l'Université de Montréal (CHUM) | Montreal | QC |
| Children’s Hospital of Eastern Ontario (CHEO) | Ottawa | ON |
| Children’s Hospital of Western Ontario | London | ON |
| Centre hospitalier universitaire Sainte-Justine | Montreal | QC |
| Civic Campus, Ottawa Hospital | Ottawa | ON |
| Dartmouth General Hospital | Halifax | NS |
| Dr. G.B. Cross Memorial Hospital | Clarenville | NL |
| Foothills Medical Centre | Calgary | AB |
| General Campus, Ottawa Hospital | Ottawa | ON |
| General Hospital & Miller Centre | St. John’s | NL |
| General Hospital, Hamilton Health Sciences Centre | Hamilton | ON |
| Halifax Infirmary | Halifax | NS |
| Health Sciences Centre-Winnipeg | Winnipeg | MB |
| Hôpital Maisonneuve-Rosemont | Montréal | QC |
| Hospital for Sick Children | Toronto | ON |
| Hôtel-Dieu de Québec | Québec | QC |
| IWK Health Centre | Halifax | NS |
| Janeway Children’s Hospital and Rehabilitation Centre | St. John’s | NL |
| Jurvinski Hospital and Cancer Center, Hamilton Health Sciences Centre | Hamilton | ON |
| Kelowna General Hospital | Kelowna | BC |
| Kingston General Hospital | Kingston | ON |
| Lion’s Gate | North Vancouver | BC |
| McMaster Children’s Hospital, Hamilton Health Sciences Centre | Hamilton | ON |
| Montreal Children’s Hospital, McGill University Health Centre | Montréal | QC |
| Montreal General Hospital, McGill University Health Centre | Montréal | QC |
| Montreal Neurological Institute, McGill University Health Centre | Montréal | QC |
| Moose Jaw hospital | Moose Jaw | SK |
| Mount Sinai Hospital | Toronto | ON |
| Nanaimo Regional General Hospital | Nanaimo | BC |
| North York General Hospital | Toronto | ON |
| Pasqua Hospital | Regina | SK |
| Peter Lougheed Centre | Calgary | AB |
| Powell River General Hospital | Powell River | BC |
| Prince County Hospital | Summerside | PE |
| Princess Margaret | Toronto | ON |
| Qikiqtani General Hospital | Iqaluit | NU |
| Queen Elizabeth Hospital | Charlottetown | PE |
| Regina General Hospital | Regina | SK |
| Rehabilitation Centre | Halifax | NS |
| Richmond General Hospital | Richmond | BC |
| Rockyview General Hospital | Calgary | AB |
| Royal Jubilee | Victoria | BC |
| Royal University Hospital | Saskatoon | SK |
| Royal Victoria Hospital, McGill University Health Centre | Montréal | QC |
| Sechelt Hospital (formerly St. Mary’s) | Sechelt | BC |
| SMBD - Jewish General Hospital | Montréal | QC |
| South Health Campus | Calgary | AB |
| Squamish General Hospital | Squamish | BC |
| St Joseph’s Healthcare | Hamilton | ON |
| St. Clare’s Mercy Hospital | St. John’s | NL |
| St. Michael's Hospital | Toronto | ON |
| St. Paul’s Hospital | Saskatoon | SK |
| Stollery Children’s Hospital | Edmonton | AB |
| Sudbury Regional Hospital | Sudbury | ON |
| Sunnybrook Hospital | Toronto | ON |
| The Moncton Hospital | Moncton | NB |
| Toronto General Hospital | Toronto | ON |
| Toronto Western Hospital | Toronto | ON |
| UBC Hospital | Vancouver | BC |
| University Hospital | London | ON |
| University Hospital of Northern BC | Prince George | BC |
| University of Alberta Hospital | Edmonton | AB |
| University of Manitoba Children’s Hospital | Winnipeg | MB |
| University of Ottawa Heart Institute, Ottawa Hospital | Ottawa | ON |
| Vancouver General Hospital (VGH) | Vancouver | BC |
| Veterans Memorial Building | Halifax | NS |
| Victoria General | Halifax | NS |
| Victoria General Hospital | Victoria | BC |
| Victoria Hospital | London | ON |
| Western Memorial Regional Hospital | Corner Brook | NL |
Footnotes
- Footnote 1
-
As classified by the WHO's AWaRe program
- Footnote 2
-
Some of these trends may be the result of updated Food and Drug Regulations in Canada (refer to chapter 10 for more details)
- Footnote 3
-
Includes poly-resistant and extensively drug-resistant culture-positive TB isolates
References
- Murray CJ, Ikuta KS, Sharara F, et al. Global burden of bacterial antimicrobial resistance in 2019: A systematic analysis. The Lancet. 2022.
- Council of Canadian Academies (CAC) 2019, Forecasting the future of antimicrobial resistance (AMR) in Canada. Available: https://cca-reports.ca/forecasting-the-future-of-amr/.
- Avent, M., Cosgrove, S., Price-Haywood, E. & Van Driel, M. 2020, “Antimicrobial stewardship in the primary care setting: from dream to reality?”, BMC Family Practice, vol. 21, no. 1, pp. 1-9.
- Canadian Institute for Health Information (CIHI) 2021. Covid-19’s effect on health care services. Available: https://www.cihi.ca/en/covid-19-resources/impact-of-covid-19-on-canadas-health-care-systems/covid-19s-effect-on-hospital [2021,06/15].
- Chu, D.K., Akl, E.A., Duda, S., Solo, K., Yaacoub, S., Schünemann, H.J., El-harakeh, A., Bognanni, A., Lotfi, T. & Loeb, M. 2020, “Physical distancing, face masks, and eye protection to prevent person-to-person transmission of SARS-CoV-2 and COVID-19: a systematic review and meta-analysis”, The Lancet, vol. 395, no. 10242, pp. 1973-1987.
- Hansen, G.T. 2021, “Continuous evolution: perspective on the epidemiology of carbapenemase resistance among enterobacterales and other gram-negative bacteria”, Infectious Diseases and Therapy, pp. 1-18.
- Kwon, S., Joshi, A.D., Lo, C., Drew, D.A., Nguyen, L.H., Guo, C., Ma, W., Mehta, R.S., Warner, E.T. & Astley, C.M. 2020, “Association of social distancing and masking with risk of COVID-19”, medRxiv.
- Miranda, C., Silva, V., Capita, R., Alonso-Calleja, C., Igrejas, G. & Poeta, P. 2020, “Implications of antibiotics use during the COVID-19 pandemic: present and future”, Journal of Antimicrobial Chemotherapy, vol. 75, no. 12, pp. 3413-3416.
- Public health Agency of Canada (PHAC) 2020, Canadian Integrated Program for Antimicrobial Resistance Surveillance (CIPARS) 2018: Design and Methods. Available: https://www.canada.ca/en/public-health/services/surveillance/canadian-integrated-program-antimicrobial-resistance-surveillance-cipars/cipars-reports/2018-annual-report-design-methods.html.
- Public Health Agency of Canada (PHAC) 2020, “National laboratory Surveillance of Invasive Streptococcal Disease in Canada - Annual Summary 2018”.
- World Health Organization (WHO). Antimicrobial resistance. Available: https://www.who.int/news-room/fact-sheets/detail/antimicrobial-resistance.
- Health Canada 2021-08-13, Veterinary antimicrobial sales reporting. Available: https://www.canada.ca/en/public-health/ services/antibiotic-antimicrobial-resistance/animals/veterinary-antimicrobial-sales-reporting.html [2021, 11/04].