
Reductions in Antimicrobial Use and Resistance: Preliminary Evidence of the Effect of the Canadian Chicken Industry’s Elimination of Use of Antimicrobials of Very High Importance to Human Medicine

Download the PDF
(PDF format, 463 KB, 5 pages)
Organization: Public Health Agency of Canada
Published: August 2016
Reductions in Antimicrobial Use and Resistance: Preliminary Evidence of the Effect of the Canadian Chicken Industry’s Elimination of Use of Antimicrobials of Very High Importance to Human Medicine
Between 2013 and 2014, the Canadian Integrated Program for Antimicrobial Resistance Surveillance (CIPARS) observed decreasing resistance to third generation cephalosporins in Salmonella and Escherichia coli from chickens on farms, at slaughter (abattoir) and from the grocery store (retail).
This trend follows a May 2014 change made by the Canadian poultry industry that eliminated the preventive use of third generation cephalosporins, an antimicrobial class considered of very high importance to human medicine.
CIPARS will continue to monitor trends in antimicrobial use and resistance in the poultry industry for further evidence that the industry’s change has been effective. The 2015 data is being analyzed and an update will be provided once available.
Third generation cephalosporin-resistant Salmonella
What we know:
- Third generation cephalosporins have various uses in human medicine Footnote 1, including treatment of serious bacterial diseases in newborns, children and adult patients Footnote 2. In Canada, cephalosporins are the second most commonly purchased and dispensed antimicrobial class for use in people Footnote 3.
- Third generation cephalosporins are considered very important to human medicine by Health Canada Footnote 4 and the World Health Organization Footnote 5.
- In Canada, among Salmonella from human infections, resistance to third generation cephalosporins has been observed most frequently in Salmonella Heidelberg Footnote 6.
- In 2013 and 2014, Salmonella Heidelberg was among the three most frequently isolated Salmonella types in Canadians Footnote 7. A strong correlation between the number of cases of third generation cephalosporin-resistant Salmonella Heidelberg infection in people and the prevalence of third generation cephalosporin-resistant Salmonella Heidelberg in retail chicken was previously reported Footnote 8.
- Multidrug-resistant Salmonella Heidelberg from chicken was implicated in a large multi-state outbreak in people in the United States; 38% of cases were hospitalized and 15% had blood stream infections Footnote 9.
Third generation cephalosporin-resistant Escherichia coli
What we know:
- E. coli is currently not included in routine surveillance of antimicrobial resistance in humans in Canada, but is included in CIPARS surveillance of chickens from farms, at slaughter and at retail Footnote 10.
- E. coli from chicken is closely related to some E. coli causing extra-intestinal infections in people Footnote 11.
- There are no third generation cephalosporins registered for use in poultry in Canada; however, extra-label use in hatcheries has been a relatively common practice to prevent E. coli-associated omphalitis.
Impact of industry interventions on third generation cephalosporin use and resistance
What we know:
- In collaboration with the poultry industry, CIPARS began monitoring antimicrobial usage by poultry farms in 2013.
- Based on research and surveillance findings Footnote 8,Footnote 12, some hatcheries started reducing the use of ceftiofur as early as 2010. Although there is no data to characterize reductions prior to 2013, there is evidence of earlier change. For example: none of the CIPARS flocks in Ontario reported any ceftiofur use at the hatchery in 2013 (Table 1).
- In May 2014, the poultry industry formally eliminated the use of antimicrobials considered of very high importance to human medicine (including third generation cephalosporins) in broiler chickens and turkeys. This policy was extended to the broiler breeder sector in May 2015.
- The 2014 elimination of third generation cephalosporin use corresponds with a significant decrease in the proportion of CIPARS flocks reporting ceftiofur use at the hatcheries (Table 1) and with changes in resistance to third generation cephalosporins.
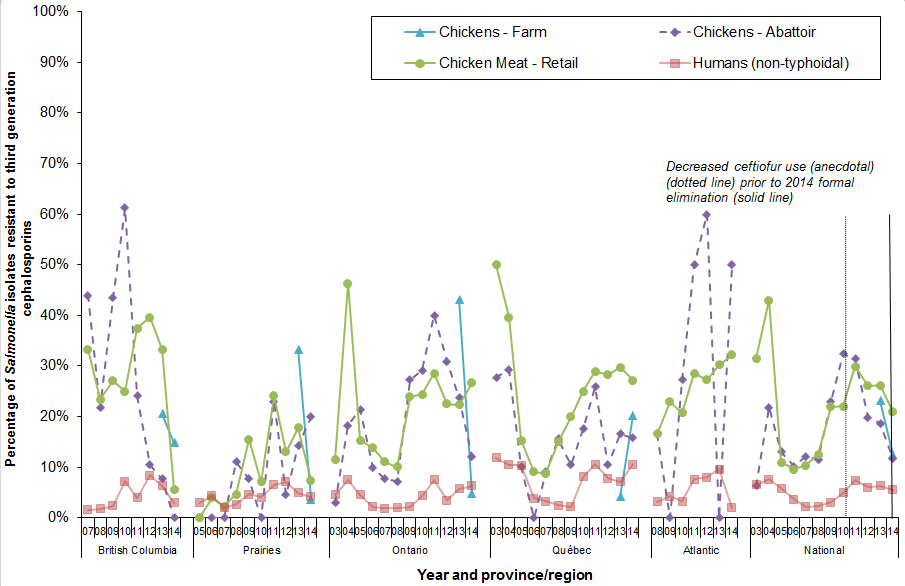
- For Salmonella, third generation cephalosporin resistance trends show different regional patterns, but overall, a decreasing trend is apparent (Figure 1).
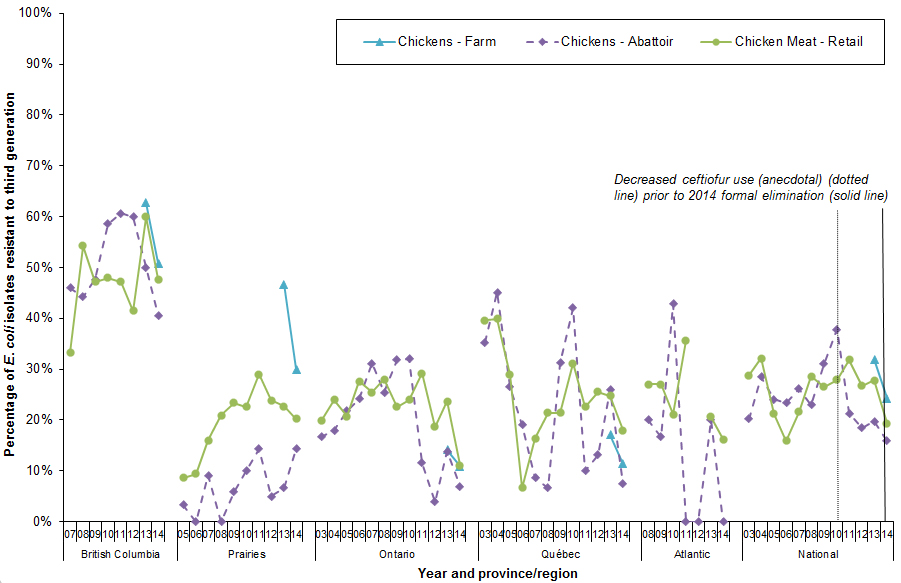
- For E. coli, overall less third generation cephalosporin resistance was observed in 2014 across the country (Figure 2).
- Similar changes were observed following a voluntary end of ceftiofur use in Québec during the period of 2005-2006. (Figures 1 and 2) Footnote 8,Footnote 12.
| Province/region | National | British Columbia | Prairies | Ontario | Québec | Atlantic | ||||||
|---|---|---|---|---|---|---|---|---|---|---|---|---|
| Highlighted cells indicate significant differences between 2013 (referent year) and 2014 (p ≤ 0.05) for a given province/region. N/A: not applicable, this region is not included in the CIPARS Farm Surveillance component. Note: ceftiofur usage is in ovo or in day-old chicks at the hatchery. |
||||||||||||
| Year | 2013 | 2014 | 2013 | 2014 | 2013 | 2014 | 2013 | 2014 | 2013 | 2014 | 2013 | 2014 |
| Number of flocks sampled | 99 | 143 | 26 | 30 | 15 | 37 | 30 | 42 | 28 | 34 | ||
| Ceftiofur | 31% | 6% | 58% | 7% | 53% | 11% | 0% | 0% | 29% | 9% | N/A | N/A |
Figure 1. Temporal variation in resistance to third generation cephalosporins among non-typhoidal Salmonella from chicken(s) and people
Text Equivalent
| Year | '07 | '08 | '09 | '10 | '11 | '12 | '13 | '14 |
|---|---|---|---|---|---|---|---|---|
| Sample source | ||||||||
| Chickens - Farm | 21% | 15% | ||||||
| Chickens - Abattoir | 44% | 22% | 43% | 61% | 24% | 11% | 8% | 0% |
| Chicken Meat - Retail | 33% | 23% | 27% | 25% | 38% | 40% | 33% | 6% |
| Humans (non-typhoidal) | 2% | 2% | 2% | 7% | 4% | 8% | 6% | 3% |
| Year | '05 | '06 | '07 | '08 | '09 | '10 | '11 | '12 | '13 | '14 |
|---|---|---|---|---|---|---|---|---|---|---|
| Sample source | ||||||||||
| Chickens - Farm | 33% | 4% | ||||||||
| Chickens - Abattoir | 0% | 0% | 0% | 11% | 8% | 0% | 23% | 5% | 14% | 20% |
| Chicken Meat - Retail | 0% | 4% | 2% | 5% | 15% | 7% | 24% | 13% | 18% | 7% |
| Humans (non-typhoidal) | 3% | 4% | 2% | 3% | 5% | 4% | 7% | 7% | 5% | 4% |
| Year | '03 | '04 | '05 | '06 | '07 | '08 | '09 | '10 | '11 | '12 | '13 | '14 |
|---|---|---|---|---|---|---|---|---|---|---|---|---|
| Sample source | ||||||||||||
| Chickens - Farm | 43% | 5% | ||||||||||
| Chickens - Abattoir | 3% | 18% | 21% | 10% | 8% | 7% | 27% | 29% | 40% | 31% | 24% | 12% |
| Chicken Meat - Retail | 12% | 46% | 15% | 14% | 11% | 10% | 24% | 24% | 29% | 23% | 22% | 27% |
| Humans (non-typhoidal) | 5% | 8% | 5% | 2% | 2% | 2% | 2% | 4% | 8% | 4% | 6% | 6% |
| Year | '03 | '04 | '05 | '06 | '07 | '08 | '09 | '10 | '11 | '12 | '13 | '14 |
|---|---|---|---|---|---|---|---|---|---|---|---|---|
| Sample source | ||||||||||||
| Chickens - Farm | 4% | 20% | ||||||||||
| Chickens - Abattoir | 28% | 29% | 10% | 0% | 9% | 16% | 11% | 18% | 26% | 11% | 17% | 16% |
| Chicken Meat - Retail | 50% | 40% | 15% | 9% | 9% | 15% | 20% | 25% | 29% | 28% | 30% | 27% |
| Humans (non-typhoidal) | 12% | 10% | 10% | 4% | 3% | 3% | 2% | 8% | 11% | 8% | 7% | 11% |
| Year | '08 | '09 | '10 | '11 | '12 | '13 | '14 |
|---|---|---|---|---|---|---|---|
| Sample source | |||||||
| Chickens - Farm | |||||||
| Chickens - Abattoir | 17% | 0% | 27% | 50% | 60% | 0% | 50% |
| Chicken Meat - Retail | 17% | 23% | 21% | 29% | 27% | 30% | 32% |
| Humans (non-typhoidal) | 3% | 4% | 3% | 8% | 8% | 10% | 2% |
| Year | '03 | '04 | '05 | '06 | '07 | '08 | '09 | '10 | '11 | '12 | '13 | '14 |
|---|---|---|---|---|---|---|---|---|---|---|---|---|
| Sample source | ||||||||||||
| Chickens - Farm | 23% | 12% | ||||||||||
| Chickens - Abattoir | 6% | 22% | 13% | 10% | 12% | 12% | 23% | 32% | 31% | 20% | 19% | 12% |
| Chicken Meat - Retail | 31% | 43% | 11% | 10% | 10% | 13% | 22% | 22% | 30% | 26% | 26% | 21% |
| Humans (non-typhoidal) | 7% | 8% | 6% | 4% | 2% | 2% | 3% | 5% | 7% | 6% | 6% | 6% |
Figure 2. Temporal variation in resistance to third generation cephalosporins among E. coli from chicken(s)
Text Equivalent
| Year | '07 | '08 | '09 | '10 | '11 | '12 | '13 | '14 |
|---|---|---|---|---|---|---|---|---|
| Sample source | ||||||||
| Chickens - Farm | 63% | 51% | ||||||
| Chickens - Abattoir | 46% | 44% | 48% | 59% | 61% | 60% | 50% | 41% |
| Chicken Meat - Retail | 33% | 54% | 47% | 48% | 47% | 41% | 60% | 48% |
| Year | '05 | '06 | '07 | '08 | '09 | '10 | '11 | '12 | '13 | '14 |
|---|---|---|---|---|---|---|---|---|---|---|
| Sample source | ||||||||||
| Chickens - Farm | 47% | 30% | ||||||||
| Chickens - Abattoir | 3% | 0% | 9% | 0% | 6% | 10% | 14% | 5% | 7% | 14% |
| Chicken Meat - Retail | 9% | 9% | 16% | 21% | 23% | 23% | 29% | 24% | 23% | 20% |
| Year | '03 | '04 | '05 | '06 | '07 | '08 | '09 | '10 | '11 | '12 | '13 | '14 |
|---|---|---|---|---|---|---|---|---|---|---|---|---|
| Sample source | ||||||||||||
| Chickens - Farm | 14% | 11% | ||||||||||
| Chickens - Abattoir | 17% | 18% | 22% | 24% | 31% | 25% | 32% | 32% | 12% | 4% | 14% | 7% |
| Chicken Meat - Retail | 20% | 24% | 21% | 28% | 25% | 28% | 23% | 24% | 29% | 19% | 24% | 11% |
| Year | '03 | '04 | '05 | '06 | '07 | '08 | '09 | '10 | '11 | '12 | '13 | '14 |
|---|---|---|---|---|---|---|---|---|---|---|---|---|
| Sample source | ||||||||||||
| Chickens - Farm | 17% | 11% | ||||||||||
| Chickens - Abattoir | 35% | 45% | 27% | 19% | 9% | 7% | 31% | 42% | 10% | 13% | 26% | 7% |
| Chicken Meat - Retail | 40% | 40% | 29% | 7% | 16% | 21% | 21% | 31% | 23% | 26% | 25% | 18% |
| Year | '08 | '09 | '10 | '11 | '12 | '13 | '14 |
|---|---|---|---|---|---|---|---|
| Sample source | |||||||
| Chickens - Farm | |||||||
| Chickens - Abattoir | 20% | 17% | 43% | 0% | 0% | 20% | 0% |
| Chicken Meat - Retail | 27% | 27% | 21% | 36% | 21% | 16% |
| Year | '03 | '04 | '05 | '06 | '07 | '08 | '09 | '10 | '11 | '12 | '13 | '14 |
|---|---|---|---|---|---|---|---|---|---|---|---|---|
| Sample source | ||||||||||||
| Chickens - Farm | 32% | 24% | ||||||||||
| Chickens - Abattoir | 20% | 28% | 24% | 23% | 26% | 23% | 31% | 38% | 21% | 18% | 20% | 16% |
| Chicken Meat - Retail | 29% | 32% | 21% | 16% | 22% | 29% | 27% | 28% | 32% | 27% | 28% | 19% |