
Transfusion Error Surveillance System (TESS) - 2012-2013 Report
Acknowledgments: The development of the Transfusion Error Surveillance System (TESS) would not have been possible without the collaborative support and continued commitment of the many transfusion safety officers, medical laboratory technologists and other healthcare professionals in hospitals and blood Transfusion Services. Their dedication to reducing errors and increasing patient safety has led to the collection and analysis of 2012-2013 TESS data.
N.B. This document must be cited as the source for any information extracted and used from it.
Suggested citation: Public Health Agency of Canada. Transfusion Error Surveillance System (TESS) - 2012-2013 Report. Centre for Communicable Diseases and Infection Control, Public Health Agency of Canada, 2015.
Information to the reader of the Transfusion Error Surveillance System (TESS) 2012-2013 Report
The Centre for Communicable Diseases and Infection Control (CCDIC) of the Public Health Agency of Canada (the Agency) is pleased to present the 2012-2013 Transfusion Error Surveillance System (TESS) Report. This report presents transfusion error surveillance data submitted during 2012 and 2013 by Canadian sentinel hospitals participating in the Transfusion Error Surveillance System (TESS).
The TESS is a voluntary surveillance system established by the Agency to capture non-nominal data on errors occurring at any point in the transfusion chain, including those detected before or after transfusion of blood and blood products to the patient, as well as those that may or may not have resulted in adverse transfusion reactions. The overall goal of the TESS is to identify potential areas for improvement in the transfusion chain and, ultimately, improve transfusion and transfusion safety in Canada.
CCDIC is responsible for the collection, management and analysis of the TESS data, as well as the production of reports summarizing key findings. CCDIC supports the use of these data to inform public health and policy action. In addition, CCDIC supports the Agency's ongoing commitment to improving data quality, and to defining and setting surveillance standards.

Download the alternative format
(PDF format, 1.98 MB, 42 pages)
Table of Contents
- Executive summary
- Introduction
- Methods
- Results
- Conclusion and future work
- References
- Appendix 1: Transfusion-related errors discovered through quality assurrance review and audits of the inventory and transfusion documentation more than 2 days after the event had occurred
- Appendix 2: Specific event codes & corresponding descriptions.
Executive summary
Blood transfusions are an important component of Canada's health care system. Although Canada has one of the safest blood systems in the world, transfusion-related errors can occur at various points in the transfusion chain, which encompasses any point in the collection, labelling, testing, storing, handling, transfusion, etc. of blood components and products and during the collection, labelling, testing, storing and handling of pre-transfusion patient samples. Transfusion-related errors may occur in either clinical or laboratory settings and may result in ABO incompatibilities, administrative delays, product wastage, inappropriate transfusions and the possible need for sample re-collection. Limiting opportunities for transfusion errors is therefore an important aspect of public health safety.
This report offers an analysis of the Transfusion Error Surveillance System (TESS) data reported from 2012 to 2013. Findings are presented for all transfusion-related errors, including errors that were detected prior to blood transfusion as well as errors detected during and after blood transfusion.
The TESS was initiated in 2005 by the Public Health Agency of Canada (the Agency) to monitor errors occurring at any point in the transfusion chain. Currently, 15 hospitals participate in the surveillance as sentinel sites and report all transfusion-related errors to the Agency on a quarterly basis. By tracking transfusion-related errors it is possible to identify not only the the policy and procedure in the transfusion chain where errors most commonly occur, but also the points where changes can be implemented in order to ensure mechanisms are in place to detect errors before transfusion as well as to limit the likelihood for transfusion errors.
Overall, a total number of 17,344 transfusion-related errors were reported from 2012 (n=8,698) to 2013 (n=8,646) and, sample collection (36.2%) and sample handling (14.4%) errors constituted the most frequently reported of all the errors. Highest occurrence rates were recorded by medical/surgical wards (22.1%), emergency rooms (20.9%), Transfusion Services (18.3%), outpatient clinics (11.0%) and intensive care units (11.4%).
The robustness of the detection processes in hospitals participating in the TESS was once again demonstrated through the capturing of over 93% (n=16,193) of the errors before they reached the patients. Detection by the Transfusion Service alone accounted for 93.5% (n=15,140) of these errors also sometimes referred to as "near-miss".
Of the 1,151 errors that reached the patient, approximately 97% (n=1,117) caused no harm. The majority of the remaining 3% (n=34) that caused some harm to the patients were errors related to product request (n=26) and unit transfusion (n=6). These two categories of errors were linked to 22 cases of transfusion-associated circulatory overload (TACO), 6 cases of febrile non-hemolytic reactions, 3 cases of minor allergic reactions and 1 case of IVIG headache. The remaining two errors that resulted in harm to the patients were sample testing and product selection errors which were respectively linked to the development of an acute hemolytic reaction (n=1) and a delayed serologic reaction (n=1).
The TESS data demonstrate that blood transfusions are both safe and efficient in Canadian hospitals participating in the surveillance coordinated by the Agency. Only 0.2% of all transfusion errors reported to the TESS network resulted in harm to patients and none of these cases resulted in death. While these findings may undoubtedly be suggestive of very efficient transfusion error detection processes/ procedures within participating hospitals, they also highlight potential areas for improvement which are the processes from which the errors that escaped detection were generated, most notably, the product request and unit transfusion processes. Similarly, hospitals should regularly revise/update safety and detection processes in place in each of its units/wards, with each unit/ward/service paying particular attention to processes related to errors for which they were the source, but not the detectors.
Data collected through the TESS facilitate the identification and evaluation of preventive measures designed to optimize system efficiency and, most importantly, patient safety. For example, in one participating hospital, the TESS data facilitated the adoption of prospective auditing of all blood requests to ensure compliance with hospital transfusion guidelines for both indication and dose. This demonstrates the importance of surveillance of transfusion-related errors in Canadian hospitals providing transfusion services.
Introduction
Blood transfusions are an important component of Canada's health care system. Each year in Canada, transfusion of blood and blood products, which may be used to treat blood loss following trauma or surgery or to treat people suffering from conditions such as anemia and cancer, result in improved patient health and saving lives. Although the risk of an adverse event following transfusion is low in Canada due to robust precautionary measures, transfusion-related errors can and do occur. These errors may occur at any step along the transfusion chain, from the collection of blood at donor clinics to the transfusion of blood and blood products to the patient in a hospital setting. Transfusion-related errors can therefore occur in either the laboratory or clinical settings and may arise during the collection, labelling, testing, storing, handling or transfusion of blood and blood products. These errors may result in ABO or other antigen incompatibilities, administrative delays in transfusion or procedures, product wastage, inappropriate transfusions and the possible need for sample re-collection. Ultimately, these errors have the potential to impact patient safety and to increase costs incurred by the health care system. Mitigating the risk of transfusion errors is therefore a leading priority for the government of Canada.
Recognizing the importance of transfusion safety in Canada, the Public Health Agency of Canada (the Agency) developed the Transfusion Error Surveillance System (TESS) in 2005. The TESS was designed to monitor the frequency of all types of errors that can occur at any step in the transfusion chain. Initially implemented as a pilot study encompassing 11 hospitals, the TESS has evolved into a voluntary sentinel surveillance system involving 15 hospitals across 4 Canadian provinces and territoriesFootnote 1. The TESS data serves as a complement to data collected through the Transfusion Transmitted Injuries Surveillance System (TTISS) which monitors the incidence of adverse reactions following blood transfusion in Canada (Transfusion Transmitted Injuries Surveillance System: 2006-2012 Report).
Participating hospitals provide data on a quarterly basis using a secure electronic web-based server maintained by the Agency; all data are captured anonymously to promote participation and complete reporting by all sites. In addition to data on transfusion errors, participating hospitals provide the number of blood components received, requested, prepared and issued, as well as the number of samples received and tests performed (by location of service whenever possible) for the purpose of calculating error rates.
The TESS is a unique blood safety surveillance system in terms of its comprehensiveness; at present, no other surveillance system in the world collects data on all errors occurring throughout the transfusion chain regardless of their potential outcome. However, by identifying the points in the transfusion chain where errors most commonly occur, including those that are detected prior to actual blood transfusion, it is possible to target these areas through corrective action and, ultimately, increase patient safety and reduce system inefficiencies. Following the implementation of measures to minimize opportunities for transfusion errors, the TESS data may be used to determine the efficacy of said measures. Findings may also provide comparable benchmarks for hospitals in Canada regardless of whether they participate or not in the TESS although those not participating will have to adhere to the TESS protocol to ensure validity of data comparisons. The same condition will apply if international comparisons are considered.
Methods
a) Definition
Transfusion errors reported through the TESS are defined as unexpected, unplanned deviations from standard operating procedures or applicable laws and regulations, usually attributable to a human or system problem, that could:
- adversely affect the safety, efficacy or quality of blood and blood products (plasma derivatives) as well as the safety of recipients, or/and
- result in inefficiencies or cost-ineffective care.
b) Data collection
From 2012 to 2013, data on transfusion-related errors were reported by a core group of 15 hospitals from 4 Canadian provinces/territories: six were of small transfusion capacity (less than 2,000 RBC units per year), five were of medium transfusion capacity (between 2,000 to 10,000 RBC units per year) and four were of large capacity as they transfused more than 10,000 RBC units per year.
Errors are detected within participating hospitals using various methods that include ongoing systematic quality control (chart audit, record review, real-time prospective transfusion audit), scheduled quality assurance, supervisory reports and reporting by any other individual. Since scheduled quality control or supervisory reports are not standardized across the participating hospitals and, their systematic implementation could not be ascertained, errors discovered through these processes were considered for the overall analysis only if they were detected within two days following their occurrence. Those that were discovered more than two days later were analysed separately and are presented in Appendix 1.
The reporting process begins with the individuals who discover the event, whether or not they were involved. Following detection of a transfusion related error at a hospital participating in the TESS, non-nominal data regarding the error are collected by the hospital site. Brief narrative of the error is used to determine the type and code to which the error correspond. This code, as well as other pieces of information such as the date, time and location of the error, the point in the transfusion chain at which the error occurred, the point in the transfusion chain at which the error was detected, and the potential/actual severity of the error and its consequences to the patient, are captured using an online reporting form. The data collected are validated and consolidated into a single file by the Provincial/Territorial Blood Coordinating Office (P/T BCO). The data elements required for the TESS are then extracted and exported to the Public Health Agency of Canada (the Agency) as per the agreement between the participating P/Ts and the Agency. Data exports occur every 3 months. A user's manual for the TESS web application was developed to assist the P/T BCO with the data transfer.
c) Error coding
Transfusion-related errors captured through the TESS are classified using a limited set of predefined, standardized alpha-numeric codes described in detail in the TESS User's manual. The letters in the codes indicate the category within which the error falls (Table 2) and the numeric value differentiates specific errors within each category. For instance all errors described with DC codes are errors that occurred at the level of the distributor/supplier of blood components or blood products; whereas those with UT codes occurred at the time of transfusion: for example, a wrong product/unit transfused to a patient or a wrong patient transfused (Table 2). An example of an error code would be: error coded as a DC 02 is a processing/testing error that occurred at the distributor level, a DC 03 would be a labelling error, etc. Complete listing of the error codes is provided in Appendix 1. Error coding was introduced to enhance the surveillance capabilities as the coding reduces dependence on unstructured narratives which are not made available to the Agency for confidentiality.
To ensure consistency of error coding across Provinces/Territories participating in the TESS, the Agency organises monthly error coding exercises where the P/T BCO staff and reporting sites are invited to discuss complex cases for which error coding may be difficult and may benefit from group discussions which promote standardized reporting. Also, baseline training for error coding is offered to sites aspiring to join the TESS.
The transfusion chain described in Figure 1 indicates where each category of errors occurs. There are errors that occur only in laboratory settings (Transfusion Services, blood suppliers, laboratory services and service providers) or clinical settings (i.e. hospital care units where patients receive transfusion care: operating rooms, emergency rooms, out-patient clinics, intensive care units, obstetrics clinics and units, etc.). Errors related to distributor codes (DC), product check-in (PC), inventory management (IM), unit storage (US), sample receipt (SR), sample testing (ST), product selection (PS), unit manipulation (UM) and unit issue (UI) occur only in laboratory setting while those related to product request (PR), sample collection (SC), request for pick-up (RP) and unit transfusion (UT) only occur in clinical setting (figure 1).
| Error | Description | Corresponding denominator | |
|---|---|---|---|
| Code | Type | ||
| DC | Distributor codes | Errors occurring at the supplier level (including blood manufacturers) | Units of product received |
| PC | Product check-in | Errors that relate to putting products into inventory from the Blood Centre, another site/campus or return from the ward. | |
| US | Unit storage | Errors related to incorrect storage of blood products/components within the Transfusion Services | |
| IM | Inventory Management | Errors related to inventory management | |
| PR | Product request | Errors related to placing an order/request for a product | Units of product requested |
| SC | Sample collection | Errors that relate to collecting or labelling specimen tubes | Samples received |
| SH | Sample handling | Events related to test ordering, sample collection and transportation that do not involve the sample itself.
|
|
| SR | Sample receipt | Errors related to receipt of samples in the laboratory | |
| ST | Sample testing | Testing errors | Tests performed |
| PS | Product selection | Production selection errors | Units of product prepared |
| UM | Unit manipulation | Processing errors (pooling, irradiation, …) | |
| RP | Request for pick-up | Errors related to picking up blood products/ components for transfusion | Units of product issued |
| UI | Unit issued | Events occurring during the issue of blood or blood product for transfusion.
|
|
| UT | Unit transfusion | Events occurring outside of the Transfusion Services involving the storage, selection and administration of a blood or blood product.
|
|
| MS | Miscellaneous | Errors not related to any of those listed above (e.g. incomplete/ incorrect patient registration, …) | - |
d) Potential severity of transfusion error
The potential severity is a measure of the harm that the error may cause to the patient if the error is not detected. High severity level is assigned to errors that have potential to cause serious injury (including fatal outcome), whereas low and medium severity levels are assigned to errors with potential to cause no or minor/transient injury, respectively. The national TESS working group identified errors that by definition are listed in Table 2 as errors of potential high severity.
| Type of error | Description | Error code |
|---|---|---|
| Product request | Order for wrong patient | PR 01 |
| Sample collection | Sample labelled with wrong patient identification | SC 01 |
| Not labelled | SC 02 | |
| Wrong patient collected (not from intended patient) | SC 03 | |
| Label incomplete/illegible for key patient identifiers (e.g., name, identification, birthdate) | SC 07 | |
| Armband incorrect/not available | SC 10 | |
| Sample handling | Paperwork and sample ID do not match | SH 02 |
| Sample receipt | Sample accepted in error | SR 01 |
| Sample testing | Sample labelled with incorrect accession label | ST 05 |
| Sample/test tubes mixed up/mislabelled | ST 09 | |
| Request for pick-up | Request for pick-up on wrong patient | RP 01 |
| Unit issue | Product issued to wrong patient | UI 04 |
| LIS warning overridden (in error or outside SOP) | UI 06 | |
| Wrong type/dose of product issued to right patient | UI 19 | |
| Unit transfusion | Administered product to wrong patient | UT 01 |
| Administered wrong type/dose of product to patient | UT 02 | |
| Miscellaneous | Patient registration incomplete/incorrect | MS 03 |
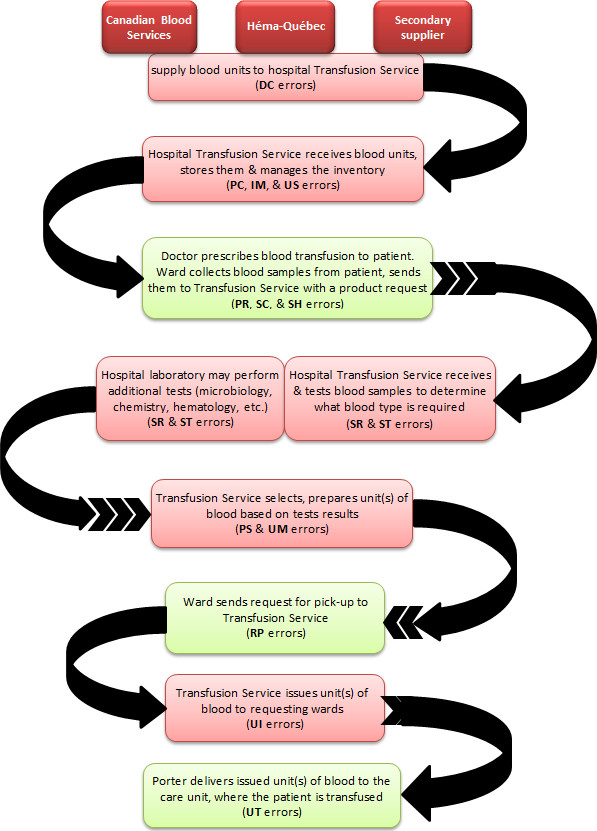
Figure 1 - Text description
e) Case validation
The P/Ts review all transfusion-related errors reported by participating hospitals from their respective jurisdictions before exporting the data to the Agency (via the TESS electronic web-based system), where a second round of review and validation for completeness and accuracy is conducted by an Agency epidemiologist and a clinical advisor.
f) Statistical analysis
For analytical purposes, data received from the P/Ts are extracted from the TESS electronic warehouse and consolidated into a single file in Microsoft Excel, then subjected to a pre-analytical review and validation. The file is once again transferred to another statistical software package (SAS or Stata) for final analysis, which is mainly focused on the:
- types of errors,
- occurrence and detection locations and,
- errors that caused harm to patient.
Rates of occurrence are calculated using corresponding denominator data (as defined in Table 1) and results given per 100,000 units of products received, requested, prepared and issued, or per 100,000 samples received depending on the error type. The number of samples received and tests performed, as well as the number of units of product received, requested, prepared and issued per one error are also calculated.
N.B.
For the calculation of the rate of unit transfusion errors, the denominator used was the total of units of products issued because of the non-availability of the total units of product transfused.
Results
a) Geographical coverage of the TESS
Transfusion Services of the 15 TESS hospitals issued a total of 424,714 units of blood and blood components to their corresponding clinical services (Table 3) in 2012 and 2013. There was a significant decrease in the number of units of products received (12.4%), requested (12.5%), prepared and issued from 2012 to 2013.
| Denominator data | 2012 | 2013 | Total |
|---|---|---|---|
| Total number of samples received | 144,414 | 136,435 | 280,849 |
| Total number of tests performed | 297,976 | 270,122 | 568,098 |
| Products received | |||
| a. Blood components | 114,636 | 98,096 | 212,732 |
| b. Fractionated products | 100,948 | 90,784 | 191,732 |
| c. Total number of units recieived | 215,584 | 188,880 | 404,464 |
| Products requested | |||
| a. Blood components | 125,499 | 107,582 | 233,081 |
| b. Fractionated products | 102,543 | 91,826 | 194,369 |
| c. Total number of units requested | 228,042 | 199,408 | 427,450 |
| Produit Prepared | |||
| a. Blood components | 133,729 | 117,455 | 251,184 |
| b. Fractionated products | 103,893 | 93,254 | 197,147 |
| c. Total number of units prepared | 237,622 | 210,709 | 448,331 |
| Products issued | |||
| a. Blood components | 122,934 | 107,548 | 230,482 |
| b. Fractionated products | 102,493 | 91,739 | 194,232 |
| c. Total number of units issued | 225,427 | 199,287 | 424,714 |
| Denominator data | Hospitals of small transfusion capacity (<2,000 RBC units /year) |
Hospitals of medium transfusion capacity (2000-10,000 RBC units /year) |
Hospitals of large transfusion capacity (>10,000 RBC units/year) |
Total | ||||
|---|---|---|---|---|---|---|---|---|
| 2012 | 2013 | 2012 | 2013 | 2012 | 2013 | 2012 | 2013 | |
| Total number of samples received | 7,513 | 6,607 | 35,673 | 35,960 | 101,228 | 93,868 | 144,414 | 136,435 |
| Total number of tests performed |
7,722 | 5,593 | 74,102 | 68,071 | 216,152 | 196,458 | 297,976 | 270,122 |
| Total units of products received |
5,623 | 5,002 | 69,669 | 56,512 | 140,292 | 127,366 | 215,584 | 188,880 |
| Total units of products requested |
4,790 | 3,880 | 70,945 | 57,195 | 152,307 | 138,333 | 228,042 | 199,408 |
| Total units of products prepared |
3,291 | 3,162 | 75,168 | 61,719 | 159,163 | 145,828 | 237,622 | 210,709 |
| Total units of products issued |
3,782 | 3,186 | 70,795 | 57,319 | 150,850 | 138,782 | 225,427 | 199,287 |
b) Reported transfusion-related errors
Overall, the TESS received reports on 17,344 transfusion-related errors that met the surveillance criteria in 2012 and 2013 from the 15 Canadian hospitals participating in the TESS and, over 80% (n=13,917) of these errors were reported from hospitals of large transfusion capacities (Tables 5 & 6).
| Type of error | nFootnote * | 2012 | 2013 | Total |
|---|---|---|---|---|
| Footnotes
|
||||
| Hospitals of small transfusion capacity (<2,000 RBC units /year) | 6 | 192 (2.2%) | 189 (2.2%) | 381 (2.2%) |
| Hospitals of medium transfusion capacity (2000 - 10,000 RBC units/year) | 5 | 1,653 (19.0%) | 1,393 (16.1%) | 3,046 (17.6%) |
| Hospitals of large transfusion capacity (>10,000 RBC units /year) | 4 | 6,853 (78.8%) | 7,064 (81.7%) | 13,917 (80.2%) |
| Total | 15 | 8,698 (100%) | 8,646 (100%) | 17,344 (100%) |
Clinical services in which highest proportions of errors occurred included medical/surgical wards 22.1% (n=3,842), emergency rooms 20.9% (n=3,617), intensive care units 11.4% (n=1,970) and outpatient clinics 11.0% (n=1,912). Transfusion Services accounted for 18.3% (n=3,172) of all the errors (Table 9). The most common were errors related to sample collection 36.2% (n=6,278), sample handling 14.4% (n=2,489), unit transfusion 12.7% (n=2,202) and product request 7.5% (n=1,298) regardless of the transfusion capacity of reporting hospitals (Tables 6, 7 & 8)). These errors collectively account for almost 71% of all reported transfusion-related errors (Table 7). Errors that occurred the least included errors related to inventory management (IM), storage (US), product selection (PS) and which occurred respectively at a rate of 1 error per 2,889; 3,111 and 7,231 units of product received or prepared (Table s 7 & 8).
| Type of error (code) | Hospitals of small transfusion capacity (<2,000 RBC units /year) |
Hospitals of medium transfusion capacity (2000-10,000 RBC units /year) |
Hospitals of large transfusion capacity (>10,000 RBC units/year) |
Overall | ||||
|---|---|---|---|---|---|---|---|---|
| 2012 | 2013 | 2012 | 2013 | 2012 | 2013 | 2012 | 2013 | |
| Distributor code (DC) | 16 (0.2%) | 6 (0.07%) | 153 (1.8%) | 135 (1.6%) | 264 (3.0%) | 177 (2.0%) | 433 (5.0%) | 318 (3.7%) |
| Product check-in (PC) | 4 (0.0%) | 8 (0.09%) | 52 (0.6%) | 35 (0.4%) | 190 (2.2%) | 114 (1.3%) | 246 (2.8%) | 157 (1.8%) |
| Unit storage (US) | 5 (0.1%) | 11 (0.1%) | 18 (0.2%) | 12 (0.1%) | 37 (0.4%) | 47 (0.5%) | 60 (0.7%) | 70 (0.8%) |
| Inventory management (IM) | 1 (0.0%) | 5 (0.06%) | 19 (0.2%) | 14 (0.2%) | 57 (0.7%) | 44 (0.5%) | 77 (0.9%) | 63 (0.7%) |
| Product request (PR) | 12 (0.1%) | 8 (0.09%) | 188 (2.2%) | 126 (1.5%) | 547 (6.3%) | 418 (4.8%) | 747 (8.6%) | 552 (6.4%) |
| Request for pick-up (RP) | 3 (0.0%) | 3 (0.03%) | 103 (1.2%) | 119 (1.4%) | 258 (3.0%) | 364 (4.2%) | 364 (4.2%) | 486 (5.6%) |
| Product selection (PS) | 1 (0.0%) | 0 (0.0%) | 14 (0.2%) | 10 (0.1%) | 23 (0.3%) | 14 (0.2%) | 38 (0.4%) | 24 (0.3%) |
| Unit manipulation (UM) | 2 (0.0%) | 0 (0.0%) | 41 (0.5%) | 45 (0.5%) | 96 (1.1%) | 72 (0.8%) | 139 (1.6%) | 117 (1.4%) |
| Unit issue (UI) | 2 (0.0%) | 5 (0.06%) | 51 (0.6%) | 47 (0.5%) | 71 (0.8%) | 171 (2.0%) | 124 (1.4%) | 223 (2.6%) |
| Unit transfusion (UT) | 17 (0.2%) | 10 (0.1%) | 343 (3.9%) | 324 (3.7%) | 805 (9.3%) | 703 (8.1%) | 1,165 (13.4%) | 1,037 (12.0%) |
| Sample collection (SC) | 24 (0.3%) | 35 (0.4%) | 332 (3.8%) | 231 (2.7%) | 2,738 (31.5%) | 2,918 (33.7%) | 3,094 (35.6%) | 3,184 (36.8%) |
| Sample handling (SH) | 42 (0.5%) | 47 (0.5%) | 105 (1.2%) | 105 (1.2%) | 969 (11.1%) | 1,221 (14.1%) | 1,116 (12.8%) | 1,373 (15.9%) |
| Sample receipt (SR) | 37 (0.4%) | 40 (0.5%) | 37 (0.4%) | 28 (0.3%) | 344 (4.0%) | 337 (3.9%) | 418 (4.8%) | 405 (4.7%) |
| Sample testing (ST) | 16 (0.2%) | 7 (0.08%) | 112 (1.3%) | 88 (1.0%) | 307 (3.5%) | 283 (3.3%) | 435 (5.0%) | 378 (4.4%) |
| Miscellaneous (MS) | 10 (0.1%) | 4 (0.05%) | 85 (1.0%) | 74 (0.9%) | 147 (1.7%) | 181 (2.1%) | 242 (2.8%) | 259 (3%) |
| Total | 192 (2.2%) | 189 (2.2%) | 1653 (19%) | 1,393 (16.1%) | 6,853 (78.8%) | 7,064 (81.7%) | 8,698 (100%) | 8,646 (100%) |
| Type of error (code) | 2012 | 2013 | Overall | |||||||||
|---|---|---|---|---|---|---|---|---|---|---|---|---|
| Freq. | % | RateFootnote 3 per 100,000 | Risk of one errorFootnote 4 | Freq. | % | Rate per 100,000 | Risk of one error | Freq. | % | Rate per 100,000 | Risk of one error | |
| Distribution code (DC) | 433 | 2.5% | 201 | 1 : 498 | 318 | 1.8% | 168 | 1 : 594 | 751 | 4.3% | 186 | 1 : 539 |
| Product check-in (PC) | 246 | 1.4% | 114 | 1 : 876 | 157 | 0.9% | 83 | 1 : 1,203 | 403 | 2.3% | 100 | 1 : 1,004 |
| Unit storage (US) | 60 | 0.3% | 28 | 1 : 3,593 | 70 | 0.4% | 37 | 1 : 2,698 | 130 | 0.7% | 32 | 1 : 3,111 |
| Inventory management (IM) | 77 | 0.4% | 36 | 1 : 2,800 | 63 | 0.4% | 33 | 1 : 2,998 | 140 | 0.8% | 35 | 1 : 2,889 |
| Product request (PR) | 747 | 4.3% | 328 | 1 : 305 | 552 | 3.2% | 277 | 1 : 361 | 1,299 | 7.5% | 304 | 1 : 329 |
| Product selection (PS) | 38 | 0.2% | 16 | 1 : 6,253 | 24 | 0.1% | 11 | 1 : 8,780 | 62 | 0.4% | 14 | 1 : 7,231 |
| Unit manipulation (UM) | 139 | 0.8% | 58 | 1 : 1,710 | 117 | 0.7% | 56 | 1 : 1,801 | 256 | 1.5% | 57 | 1 : 1,751 |
| Request for pick-up (RP) | 364 | 2.1% | 160 | 1 : 626 | 486 | 2.8% | 244 | 1 : 410 | 850 | 4.9% | 199 | 1 : 503 |
| Unit issue (UI) | 124 | 0.7% | 55 | 1 : 1,818 | 223 | 1.3% | 112 | 1 : 894 | 347 | 2.0% | 82 | 1 : 1,224 |
| Unit transfusion (UT) | 1,165 | 6.7% | 517 | 1 : 193 | 1,037 | 6.0% | 520 | 1 : 192 | 2,202 | 12.7% | 518 | 1 : 193 |
| Sample collection (SC) | 3,094 | 17.8% | 2,142 | 1 : 47 | 3,184 | 18.4% | 2,334 | 1 : 43 | 6,278 | 36.2% | 2,235 | 1 : 45 |
| Sample handling (SH) | 1,116 | 6.4% | 773 | 1 : 129 | 1,373 | 7.9% | 1,006 | 1 : 99 | 2,489 | 14.4% | 886 | 1 : 113 |
| Sample receipt (SR) | 418 | 2.4% | 289 | 1 : 345 | 405 | 2.3% | 297 | 1 : 337 | 823 | 4.7% | 293 | 1 : 341 |
| Sample Testing (ST) | 435 | 2.5% | 146 | 1 : 685 | 378 | 2.2% | 140 | 1 : 715 | 813 | 4.7% | 143 | 1 : 699 |
| Miscellaneous (MS) | 242 | 1.4% | - | - | 259 | 1.5% | - | - | 501 | 2.9% | - | - |
| Total | 8,698 | 50.1% | - | - | 8,646 | 49.9% | - | - | 17,344 | 100% | - | - |
| Type of error (code) | Hospitals of small transfusion capacity (<2,000 RBC units /year) |
Hospitals of medium transfusion capacity (2000-10,000 RBC units /year) |
Hospitals of large transfusion capacity (>10,000 RBC units/year) |
Overall | ||||||||
|---|---|---|---|---|---|---|---|---|---|---|---|---|
| Frequence (%) |
Rate per 100,000 | Risk of one error | Frequence (%) |
Rate per 100,000 | Risk of one error | Frequence (%) |
Rate per 100,000 | Risk of one error | Frequence (%) |
Rate per 100,000 | Risk of one error | |
| Distribution code (DC) | 22 (0.1%) | 207 | 1 : 483 | 288 (1.7%) | 228 | 1 : 438 | 441 (2.5%) | 165 | 1 : 607 | 751 (4.3%) | 186 | 1 : 539 |
| Product check-in (PC) | 12 (0.1%) | 113 | 1 : 885 | 87 (0.5%) | 69 | 1 : 1,450 | 304 (1.8%) | 114 | 1 : 880 | 403 (2.3%) | 100 | 1 : 1,004 |
| Unit storage (US) | 16 (0.1%) | 151 | 1 : 664 | 30 (0.2%) | 24 | 1 : 4,206 | 84 (0.5%) | 31 | 1 : 3,186 | 130 (0.7%) | 32 | 1 : 3,111 |
| Inventory management (IM) | 6 (0.0%) | 56 | 1 : 1,771 | 33 (0.2%) | 26 | 1 : 3,824 | 101 (0.6%) | 38 | 1 : 2,650 | 140 (0.8%) | 35 | 1 : 2,889 |
| Product request (PR) | 20 (0.1%) | 231 | 1 : 434 | 314 (1.8%) | 245 | 1 : 408 | 965 (5.6%) | 332 | 1 : 301 | 1,299 (7.5%) | 304 | 1 : 329 |
| Product selection (PS) | 1 (0.0%) | 15 | 1 : 6,453 | 24 (0.1%) | 18 | 1 : 5,704 | 37 (0.2%) | 12 | 1 : 8,243 | 62 (0.4%) | 14 | 1 : 7,231 |
| Unit manipulation (UM) | 2 (0.0%) | 31 | 1 : 3,227 | 86 (0.5%) | 63 | 1 : 1,592 | 168 (1.0%) | 55 | 1 : 1,815 | 256 (1.5%) | 57 | 1 : 1,751 |
| Request for pick-up (RP) | 6 (0.0%) | 86 | 1 : 1,161 | 222 (1.3%) | 173 | 1 : 577 | 622 (3.6%) | 215 | 1 : 466 | 850 (4.9%) | 200 | 1 : 500 |
| Unit issue (UI) | 7 (0.0%) | 100 | 1 : 995 | 98 (0.6%) | 76 | 1 : 1,307 | 242 (1.4%) | 84 | 1 : 1,197 | 347 (2.0%) | 82 | 1 : 1,224 |
| Unit transfusion (UT) | 27 (0.2%) | 387 | 1 : 258 | 667 (3.8%) | 521 | 1 : 192 | 1,508 (8.7%) | 521 | 1 : 192 | 2,202 (12.7%) | 518 | 1 : 193 |
| Sample collection (SC) | 59 (0.3%) | 418 | 1 : 239 | 563 (3.2%) | 786 | 1 : 127 | 5,656 (32.6%) | 2,899 | 1 : 34 | 6,278 (36.2%) | 2,235 | 1 : 45 |
| Sample handling (SH) | 89 (0.5%) | 630 | 1 : 159 | 210 (1.2%) | 293 | 1 : 341 | 2,190 (12.6%) | 1,123 | 1 : 89 | 2,489 (14.1%) | 886 | 1 : 113 |
| Sample receipt (SR) | 77 (0.4%) | 545 | 1 : 183 | 65 (0.4%) | 91 | 1 : 1,102 | 681 (3.9%) | 349 | 1 : 286 | 823 (4.7%) | 293 | 1 : 341 |
| Sample Testing (ST) | 23 (0.1%) | 173 | 1 : 579 | 200 (1.2%) | 141 | 1 : 711 | 590 (3.4%) | 143 | 1 : 699 | 813 (4.7%) | 143 | 1 : 699 |
| Miscellaneous (MS) | 14 (0.1%) | - | - | 159 (0.9%) | - | - | 328 (1.9%) | - | - | 501 (2.9%) | - | - |
| Total | 381 (2.2%) | - | - | 3,046 (17.6%) | - | - | 13,917 (80.2%) | - | - | 17,344 (100%) | - | - |
| Type of error (code) | Blood Supplier | Emergency room | Intensive care unit | Laboratory service | Medical/ Surgical ward | Obstetrics unit | Operating room | Outpatient clinics | Supplier/ Service provider | Transfusion Service | Total |
|---|---|---|---|---|---|---|---|---|---|---|---|
| Table 9 footnotes
|
|||||||||||
| Distribution code (DC) | 751 (99.7 %) | 0 (0.0 %) | 0 (0.0 %) | 0 (0.0 %) | 0 (0.0 %) | 0 (0.0 %) | 0 (0.0 %) | 0 (0.0 %) | 0 (0.0 %) | 0 (0.0 %) | 751 (4.3 %) |
| Product check-in (PC) | 0 (0.0 %) | 0 (0.0 %) | 0 (0.0 %) | 0 (0.0 %) | 0 (0.0 %) | 0 (0.0 %) | 0 (0.0 %) | 0 (0.0 %) | 0 (0.0 %) | 403 (12.7 %) | 403 (2.3 %) |
| Unit storage (US) | 0 | 0 (0.0 %) | 0 (0.0 %) | 0 (0.0 %) | 0 (0.0 %) | 0 (0.0 %) | 0 (0.0 %) | 0 (0.0 %) | 0 (0.0 %) | 130 (4.1 %) | 130 (0.7 %) |
| Inventory management (IM) | 0 | 0 (0.0 %) | 0 (0.0 %) | 0 (0.0 %) | 0 (0.0 %) | 0 (0.0 %) | 0 (0.0 %) | 0 (0.0 %) | 0 (0.0 %) | 140 (4.4 %) | 140 (0.8 %) |
| Product request (PR)Footnote * | 0 | 205 (5.7 %) | 230 (11.7 %) | 0 (0.0 %) | 431 (11.2 %) | 134 (16.5 %) | 89 (8.2 %) | 207 (10.8 %) | 2 (2.2 %) | 0 (0.0 %) | 1,298 (7.5%) |
| Product selection (PS) | 0 | 0 (0.0 %) | 0 (0.0 %) | 0 (0.0 %) | 0 (0.0 %) | 0 (0.0 %) | 0 (0.0 %) | 0 (0.0 %) | 0 (0.0 %) | 62 (2,0 %) | 62 (0.4 %) |
| Unit manipulation (UM) | 0 | 0 (0.0 %) | 0 (0.0 %) | 0 (0.0 %) | 0 (0.0 %) | 0 (0.0 %) | 0 (0.0 %) | 0 (0.0 %) | 0 (0.0 %) | 256 (8.1 %) | 256 (1.5 %) |
| Request for pick-up (RP) | 0 | 125 (3.5 %) | 279 (14.2 %) | 0 (0.0 %) | 286 (7.4) | 45 (5.6 %) | 42 (3.9 %) | 55 (2.9 %) | 18 (19.4 %) | 0 (0.0 %) | 850 (4.9 %) |
| Unit issue (UI) | 0 | 0 (0.0 %) | 0 (0.0 %) | 4 (4.6 %) | 0 (0.0 %) | 0 (0.0 %) | 0 (0.0 %) | 0 (0.0 %) | 0 (0.0 %) | 347 (10.9 %) | 347 (2.0 %) |
| Unit transfusion (UT) | 0 | 283 (7.8 %) | 600 (30.5 %) | 0 (0.0 %) | 536 (14.0%) | 25 (3.1 %) | 563 (51.7 %) | 191 (10.0 %) | 4 (4.3 %) | 0,0 % | 2,202 (12.7 %) |
| Sample collection (SC) | 0 | 2406 (66.5 % | 549 (27.9 %) | 0 (0.0 %) | 1 919 (50.0 %) | 379 (46.8 %) | 245 (22.5 %) | 777 (40.6 %) | 3 (3.2 %) | 0,0 % | 6,278 (36.2 %) |
| Sample handling (SH) | 0 | 570 (15.8 %) | 304 (15.4 %) | 0 (0.0 %) | 639 (16.6 %) | 212 (26,2 %) | 126 (11.6 %) | 628 (32.8 %) | 10 (10.,8 %) | 0,0 % | 2,489 (14.4 %) |
| Sample receipt (SR) | 0 | 0 (0.0 %) | 0 (0.0 %) | 24 (27.6 %) | 0 (0.0 %) | 0 (0.0 %) | 0 (0.0 %) | 0 (0.0 %) | 0 (0.0 %) | 799 (25.2 %) | 823 (4.7 %) |
| Sample Testing (ST) | 0 | 0 (0.0 %) | 0 (0.0 %) | 5 (5.7 %) | 0 (0.0 %) | 0 (0.0 %) | 0 (0.0 %) | 0 (0.0 %) | 0 (0.0 %) | 808 (25.5 %) | 813 (4.7 %) |
| Miscellaneous (MS) | 2 (0.3 %) | 0.8 % | 8 (0.4 %) | 58 (66.7 %) | 30 (0.8 %) | 15 (1.9 %) | 23 (2.1 %) | 54 (2.8 %) | 56 (60.2 %) | 227 (7.2 %) | 501 (2.9 %) |
| Total | 753 (100 %) | 3,617 (100 %) | 1,970 (100 %) | 87 (100 %) | 3,841 (100 %) | 810 (100 %) | 1,088 (100 %) | 1,912 (100 %) | 93 (100 %) | 3,172(100 %) | 17,343 (100 %) |
Table 10 highlights the effectiveness of error detection processes in place within each clinical and Transfusion Service. Transfusion Services demonstrated highest efficiency as they were able to detect the vast majority of errors that originated from within (94.4%) and from other services (92.3%).
| Discovery | Occurrence | |||||||||||
|---|---|---|---|---|---|---|---|---|---|---|---|---|
| Where error occurred | ||||||||||||
| Blood supplier | Emergency | Intensive care unit | Lab. service | Medical/ Surgical ward | Obstetrics | Operating room | Outpatient clincs | Supplier/ Service provider | Transfusion Service | Total | ||
| Table 10 footnotes
|
||||||||||||
| Where error discovered | Blood supplier | 4 (0.5%) | 0 (0.0%) | 0 (0.0%) | 0 (0.0%) | 0 (0.0%) | 0 (0.0%) | 0 (0.0%) | 0 (0.0%) | 0 (0.0%) | 10 (0.3%) | 14 (0.1%) |
| Emergency | 4 (0.5%) | 108 (3.0%) | 1 (0.1%) | 0 (0.0%) | 0 (0.0%) | 0 (0.0%) | 0 (0.0%) | 1 (0.1%) | 1 (1.1%) | 10 (0.3%) | 125 (0.7%) | |
| Intensive care unit | 7 (0.9%) | 1 (0.0%) | 300 (15.2%) | 0 (0.0%) | 4 (0.1%) | 1 (0.1%) | 5 (0.5%) | 2 (0.1%) | 3 (3.2%) | 43 (1.4%) | 366 (2.1%) | |
| Laboratory service | 2 (0.3%) | 4 (0.1%) | 3 (0.2%) | 4 (4.6%) | 4 (0.1%) | 0 (0.0%) | 0 (0.0%) | 4 (0.2%) | 0 (0.0%) | 0 (0.0%) | 21 (0.1%) | |
| Medical/Surgical wardTable 10 footnote * | 12 (1.6%) | 7 (0.2%) | 2 (0.1%) | 0 (0.0%) | 251 (6.5%) | 0 (0.0%) | 0 (0.0%) | 1 (0.1%) | 2 (2.2%) | 36 (1.1%) | 311 (1.8%) | |
| Obstetrics | 0 (0.0%) | 0 (0.0%) | 1 (0.1%) | 0 (0.0%) | 0 (0.0%) | 12 (1.5%) | 0 (0.0%) | 0 (0.0%) | 0 (0.0%) | 3 (0.1%) | 16 (0.1%) | |
| Operating room | 4 (0.5%) | 1 (0.0%) | 0 (0.0%) | 0 (0.0%) | 5 (0.1%) | 0 (0.0%) | 169 (15.1%) | 6 (0.3%) | 2 (2.2%) | 17 0.5%) | 204 (1.2%) | |
| Outpatient clinics | 3 (0.4%) | 5 (0.1%) | 0 (0.0%) | 1 (1.1%) | 1 (0.0%) | 0 (0.0%) | 0 (0.0%) | 125 (6.5%) | 1 (1.1%) | 57 (1.8%) | 193 (1.1%) | |
| Supplier/Service provider | 3 (0.4%) | 0 (0.0%) | 0 (0.0%) | 0 (0.0%) | 4 (0.1%) | 0 (0.0%) | 0 (0.0%) | 1 (0.1%) | 0 (0.0%) | 1 (0.0%) | 9 (0.1%) | |
| Transfusion Service | 714 (94.8%) | 3,491 (96.5%) | 1,663 (84.4%) | 82 (94.3%) | 3,572 (93.0%) | 797 (98.4%) | 914 (84.0%) | 1,772 (92.7%) | 84 (90.3%) | 2,995 (94.4%) | 16,084 (92.7%) | |
| Total | 753 (100%) | 3,617 (100%) | 1,970 (100%) | 87 (100%) | 3,841 (100%) | 810 (100%) | 1,088 (100%) | 1,912 (100%) | 93 (100% ) | 3,172 (100%) | 17,343 (100%) | |
c) Potential severity of reported transfusion-related errors
Transfusion-related errors most commonly reported in 2012 and 2013 were of low (n=12,845; 74.1%) potential severity (Tables 11 & 12). Those of medium and high potential severity represented 8.9% (n=1,536) and 17.1% (n=2,963), respectively (Table 12).
| Type of error (code) | Low potential severity | Medium potential severity | High potential severity | Total | ||||
|---|---|---|---|---|---|---|---|---|
| Freq. | % | Freq. | % | Freq. | % | Freq. | % | |
| Distribution code (DC) | 641 | 3.7% | 38 | 0.2% | 72 | 0.4% | 751 | 4.3% |
| Product check-in (PC) | 376 | 2.2% | 21 | 0.1% | 6 | 0.0% | 403 | 2.3% |
| Unit storage (US) | 116 | 0.7% | 12 | 0.1% | 2 | 0.0% | 130 | 0.8% |
| Inventory management (IM) | 124 | 0.7% | 14 | 0.1% | 2 | 0.0% | 140 | 0.8% |
| Product request (PR) | 452 | 2.6% | 420 | 2.4% | 427 | 2.5% | 1,299 | 7.5% |
| Product selection (PS) | 17 | 0.1% | 35 | 0.2% | 10 | 0.1% | 62 | 0.4% |
| Unit manipulation (UM) | 178 | 1.0% | 58 | 0.3% | 20 | 0.1% | 256 | 1.5% |
| Request for pick-up (RP) | 627 | 3.6% | 73 | 0.4% | 150 | 0.9% | 850 | 4.9% |
| Unit issue (UI) | 204 | 1.2% | 61 | 0.4% | 82 | 0.5% | 347 | 2.0% |
| Unit transfusion (UT) | 1,923 | 11.1% | 222 | 1.3% | 57 | 0.3% | 2,202 | 12.7% |
| Sample collection (SC) | 5,091 | 29.4% | 70 | 0.4% | 1,117 | 6.4% | 6,278 | 36.2% |
| Sample handling (SH) | 1,625 | 9.4% | 134 | 0.8% | 730 | 4.2% | 2,489 | 14.4% |
| Sample receipt (SR) | 630 | 3.6% | 110 | 0.6% | 83 | 0.5% | 823 | 4.8% |
| Sample Testing (ST) | 511 | 2.9% | 216 | 1.2% | 86 | 0.5% | 813 | 4.7% |
| Miscellaneous (MS) | 330 | 1.9% | 52 | 0.3% | 119 | 0.7% | 501 | 2.9% |
| Total | 12,845 | 74.1% | 1,536 | 8.9% | 2,963 | 17.1% | 17,344 | 100% |
| Type of error (code) | Small transfusion capacity hospitals | Medium transfusion capacity hospitals | Large transfusion capacity hospitals | Total | ||||
|---|---|---|---|---|---|---|---|---|
| Freq. | % | Freq. | % | Freq. | % | Freq. | % | |
| Low potential severity | 294 | 77.2% | 2,011 | 66.0% | 10,540 | 75.7% | 12,845 | 74.1% |
| Medium potential severity | 34 | 8.9% | 369 | 12.1% | 1,133 | 8.1% | 1,536 | 8.9% |
| High potential severity | 53 | 13.9% | 666 | 21.9% | 2,244 | 16.1% | 2,963 | 17.1% |
| Total | 381 | 100% | 3,046 | 100% | 13,917 | 100% | 17,344 | 100% |
d) Transfusion-related errors that did not reach the patients
Approximately 93.4% (n=16,193) of the transfusion-related errors reported in 2012 and 2013 were detected before they reached the patients (Table 13). Planned detection procedures in place in hopitals participating in the TESS were credited with the detection of 97.7% (n=15,817) of these errors (Table 14a). The remaining 2.3% (n=376) were detected through unplanned procedures i.e. by chance.
Discovery |
Occurrence | ||||||||||
|---|---|---|---|---|---|---|---|---|---|---|---|
| Blood supplier | Emergency Room | Intensive care unit | Lab. Service | Medical/ Surgical Unit | Obstetrics | Operating Room | Outpatient clinics | Supplier/ Service provider | Transfusion Service | Total | |
| Blood supplier | 4 (0.6%) | 0 (0.0%) | 0 (0.0%) | 0 (0.0%) | 0 (0.0%) | 0 (0.0%) | 0 (0.0%) | 0 (0.0%) | 0 (0.0%) | 10 (0.3%) | 14 (0.1%) |
| Emergency Room | 4 (0.6%) | 93 (2.7%) | 1 (0.1%) | 0 (0.0%) | 0 (0.0%) | 0 (0.0%) | 0 (0.0%) | 0 (0.0%) | 1 (1.3%) | 8 (0.3%) | 107 (0.7%) |
| Intensive care unit | 6 (0.8%) | 1 (0.0%) | 274 (16.5%) | 0 (0.0%) | 3 (0.1%) | 1 (0.1%) | 4 (0.4%) | 2 (0.1%) | 2 (2.6%) | 25 (0.9%) | 318 (2.0%) |
| Laboratory service | 2 (0.3%) | 4 (0.1%) | 3 (0.2%) | 3 (3.5%) | 4 (0.1%) | 0 (0.0%) | 0 (0.0%) | 4 (0.2%) | 0 (0.0%) | 0 (0.0%) | 20 (0.1%) |
| Medical/Surgical Unit | 10 (1.4%) | 5 (0.1%) | 1 (0.1%) | 0 (0.0%) | 181 (5.1%) | 0 (0.0%) | 0 (0.0%) | 0 (0.0%) | 1 (1.3%) | 24 (0.8%) | 222 (1.4%) |
| Obstetrics | 0 (0.0%) | 0 (0.0%) | 1 (0.1%) | 0 (0.0%) | 0 (0.0%) | 9 (1.2%) | 0 (0.0%) | 0 (0.0%) | 0 (0.0%) | 3 (0.1%) | 13 (0.1%) |
| Operating room | 4 (0.6%) | 1 (0.0%) | 0 (0.0%) | 0 (0.0%) | 2 (0.1%) | 0 (0.0%) | 167 (15.8%) | 5 (0.3%) | 2 (2.6%) | 10 (0.3%) | 191 (1.2%) |
| Outpatient clinics | 2 (0.3%) | 2 (0.1%) | 0 (0.0%) | 0 (0.0%) | 1 (0.0%) | 0 (0.0%) | 0 (0.0%) | 110 (5.9%) | 0 (0.0%) | 44 (1.5%) | 159 (1.0%) |
| Supplier/Service provider | 3 (0.4%) | 0 (0.0%) | 0 (0.0%) | 0 (0.0%) | 4 (0.1%) | 0 (0.0%) | 0 (0.0%) | 1 (0.1%) | 0 (0.0%) | 1 (0.0%) | 9 (0.1%) |
| Transfusion Service | 681 (95.1%) | 3,384 (97%) | 1,377 83.1%) | 82 (96.6%) | 3,357 (94.5%) | 762 (98.7%) | 884 (83.8%) | 1,728 (93.4%) | 71 (92.2%) | 2,814 (95.7%) | 15,140 (93.5%) |
| Total | 716 (100%) | 3,490 (100%) | 1,657 (100%) | 85 (100%) | 3,552 (100%) | 772 (100%) | 1,055 (100%) | 1,850 (100%) | 77 (100%) | 2,939 (100%) | 16,193 (100%) |
Transfusion Services demonstrated highest efficiency for detecting not only from within the blood bank, but also from clinical areas. Transfusion Services detected 93.5% (n=15,140) of the transfusion-related errors that did not reach the patients; this included 95.7% (n=2,939) of their of their own errors (Table 13).
The overwhelming majority (97.7%; n=15,817) of transfusion-related errors that did not reach the patients was detected through planned detection procedures(Table 14a). of those that were discovered though uplanned procedures (n=376), the most commonly reported (Table 14b) were related to product request (10.9%; n=41), sample testing (16.8%; n=63) and unit transfusion (19.9%; n=75). Also, Transfusion Services accounted for 43.4% (n=163) of all these errors, followed by medical/surgical wards (n=67) and emergency rooms (n=45) which posted 17.8% and 12.0%, respectively (Table 14b).
| Type of error (code) | Blood Supplier | Emergency room | Intensive care unit | Laboratory service | Medical/ Surgical ward |
Obstetrics unit | Operating room | Outpatient clinics | Supplier/ Service provider | Transfusion Service | Total |
|---|---|---|---|---|---|---|---|---|---|---|---|
| Distribution code (DC) | 701 (4.4 %) | 0 (0.0 %) | 0 (0.0 %) | 0 (0.0 %) | 0 (0.0 %) | 0 (0.0 %) | 0 (0.0 %) | 0 (0.0 %) | 0 (0.0 %) | 0 (0.0 %) | 701 (4.4 %) |
| Product check-in (PC) | 0 (0.0 %) | 0 (0.0 %) | 0 (0.0 %) | 0 (0.0 %) | 0 (0.0 %) | 0 (0.0 %) | 0 (0.0 %) | 0 (0.0 %) | 0 (0.0 %) | 387 (2.4 %) | 387 (2.4 %) |
| Unit storage (US) | 0 (0.0 %) | 0 (0.0 %) | 0 (0.0 %) | 0 (0.0 %) | 0 (0.0 %) | 0 (0.0 %) | 0 (0.0 %) | 0 (0.0 %) | 0 (0.0 %) | 121 (0.8 %) | 121 (0.8 %) |
| Inventory management (IM) | 0 (0.0 %) | 0 (0.0 %) | 0 (0.0 %) | 0 (0.0 %) | 0 (0.0 %) | 0 (0.0 %) | 0 (0.0 %) | 0 (0.0 %) | 0 (0.0 %) | 124 (0.8 %) | 124 (0.8 %) |
| Product request (PR) | 0 (0.0 %) | 137 (0.9 %) | 148 (0.9 %) | 0 (0.0 %) | 320 (2.0 %) | 131 (0.8 %) | 79 (0.5 %) | 188 (1.2 %) | 2 (0.0 %) | 0 (0.0 %) | 1,005 (6.4%) |
| Request for pick-up (RP) | 0 (0.0 %) | 83 (0.5 %) | 94 (0.6 %) | 0 (0.0 %) | 171 (1.1 %) | 16 (0.1 %) | 35 (0.2 %) | 40 (0.3 %) | 6 (0.0 %) | 0 (0.0 %) | 445 (2.8 %) |
| Product selection (PS) | 0 (0.0 %) | 0 (0.0 %) | 0 (0.0 %) | 0 (0.0 %) | 0 (0.0 %) | 0 (0.0 %) | 0 (0.0 %) | 0 (0.0 %) | 0 (0.0 %) | 29 (0.2 %) | 29 (0.2 %) |
| Unit manipulation (UM) | 0 (0.0 %) | 0 (0.0 %) | 0 (0.0 %) | 0 (0.0 %) | 0 (0.0 %) | 0 (0.0 %) | 0 (0.0 %) | 0 (0.0 %) | 0 (0.0 %) | 223 (1.4 %) | 223 (1.4 %) |
| Unit issue (UI) | 0 (0.0 %) | 0 (0.0 %) | 0 (0.0 %) | 0 (0.0 %) | 0 (0.0 %) | 0 (0.0 %) | 0 (0.0 %) | 0 (0.0 %) | 0 (0.0 %) | 259 (1.6 %) | 259 (1.6 %) |
| Unit transfusion (UT) | 0 (0.0 %) | 254 (1.6 %) | 571 (3.6 %) | 0 (0.0 %) | 455 (2.9 %) | 23 (0.1 %) | 535 (3.4 %) | 172 (1.1 %) | 4 (0.0 %) | 0 (0.0 %) | 2,014 (12.7 %) |
| Sample collection (SC) | 0 (0.0 %) | 2,392 (15.1 % | 542 (3.4 %) | 0 (0.0 %) | 1,909 (12.1 %) | 372 (2.4 %) | 241 (1.5 %) | 768 (4.9 %) | 3 (0.0 %) | 0 (0.0 %) | 6,227 (39.4 %) |
| Sample handling (SH) | 0 (0.0 %) | 560 (3.5 %) | 277 (1.8 %) | 0 (0.0 %) | 612 (3.9 %) | 209 (1.3 %) | 122 (0.8 %) | 67 (3.8 %) | 6 (0.0 %) | 0 (0.0 %) | 2,393 (15.1 %) |
| Sample receipt (SR) | 0 (0.0 %) | 0 (0.0 %) | 0 (0.0 %) | 20 (0.1 %) | 0 (0.0 %) | 0 (0.0 %) | 0 (0.0 %) | 0 (0.0 %) | 0 (0.0 %) | 734 (4.6 %) | 754 (4.8 %) |
| Sample Testing (ST) | 0 (0.0 %) | 0 (0.0 %) | 0 (0.0 %) | 4 (0.0 %) | 0 (0.0 %) | 0 (0.0 %) | 0 (0.0 %) | 0 (0.0 %) | 0 (0.0 %) | 691 (4.4 %) | 695 (4.4 %) |
| Miscellaneous (MS) | 2 (0.0 %) | 19 (0.1 %) | 7 (0.0 %) | 57 (0.4 %) | 18 (0.1 %) | 12 (0.1 %) | 19 (0.1 %) | 46 (0.3 %) | 52 (0.3 %) | 208 (1.3 %) | 440 (2.8 %) |
| Total | 703 (4.4%) | 3,445 (21.8 %) | 1,639 (10.4%) | 81 (0.5 %) | 3,485 (22.0%) | 763 (4.8 %) | 1,031 (6.5%) | 1,821 (11.5 %) | 73 (0.5%) | 2,776 (17.6 %) | 15,817 (100%) |
| Type of error (code) | Blood Supplier | Emergency room | Intensive care unit | Laboratory service | Medical/ Surgical ward | Obstetrics unit | Operating room | Outpatient clinics | Supplier/ Service provider | Transfusion Service | Total |
|---|---|---|---|---|---|---|---|---|---|---|---|
| Distribution code (DC) | 13 (3.5 %) | 0 (0.0 %) | 0 (0.0 %) | 0 (0.0 %) | 0 (0.0 %) | 0 (0.0 %) | 0 (0.0 %) | 0 (0.0 %) | 0 (0.0 %) | 0 (0.0 %) | 13 (3.5 %) |
| Product check-in (PC) | 0 (0.0 %) | 0 (0.0 %) | 0 (0.0 %) | 0 (0.0 %) | 0 (0.0 %) | 0 (0.0 %) | 0 (0.0 %) | 0 (0.0 %) | 0 (0.0 %) | 11 (2.9 %) | 11 (2.9 %) |
| Unit storage (US) | 0 (0.0 %) | 0 (0.0 %) | 0 (0.0 %) | 0 (0.0 %) | 0 (0.0 %) | 0 (0.0 %) | 0 (0.0 %) | 0 (0.0 %) | 0 (0.0 %) | 7 (0.8 %) | 7 (1.9 %) |
| Inventory management (IM) | 0 (0.0 %) | 0 (0.0 %) | 0 (0.0 %) | 0 (0.0 %) | 0 (0.0 %) | 0 (0.0 %) | 0 (0.0 %) | 0 (0.0 %) | 0 (0.0 %) | 6 (1.6 %) | 6 (1.6 %) |
| Product request (PR) | 0 (0.0 %) | 12 (3.2 %) | 3 (0.8 %) | 0 (0.0 %) | 17 (4.5 %) | 0 (0,0 %) | 3 (0.8 %) | 6 (1.6 %) | 0 (0.0 %) | 0 (0.0 %) | 41 (10.9 %) |
| Request for pick-up (RP) | 0 (0.0 %) | 0 (0.0 %) | 2 (0.5 %) | 0 (0.0 %) | 9 (2.4 %) | 0 (0,0 %) | 2 (0.5 %) | 2 (0.5 %) | 2 (0.5 %) | 0 (0.0 %) | 17 (4.5 %) |
| Product selection (PS) | 0 (0.0 %) | 0 (0.0 %) | 0 (0.0 %) | 0 (0.0 %) | 0 (0.0 %) | 0 (0.0 %) | 0 (0.0 %) | 0 (0.0 %) | 0 (0.0 %) | 6 (1.6 %) | 6 (1.6 %) |
| Unit manipulation (UM) | 0 (0.0 %) | 0 (0.0 %) | 0 (0.0 %) | 0 (0.0 %) | 0 (0.0 %) | 0 (0.0 %) | 0 (0.0 %) | 0 (0.0 %) | 0 (0.0 %) | 9 (2.4 %) | 9 (2.4 %) |
| Unit issue (UI) | 0 (0.0 %) | 0 (0.0 %) | 0 (0.0 %) | 0 (0.0 %) | 0 (0.0 %) | 0 (0.0 %) | 0 (0.0 %) | 0 (0.0 %) | 0 (0.0 %) | 28 (7.4 %) | 28 (7.4 %) |
| Unit transfusion (UT) | 0 (0.0 %) | 15 (4.0 %) | 9 (2.4 %) | 0 (0.0 %) | 30 (8.0 %) | 1 (0.3 %) | 14 (3.7 %) | 6 (1.6 %) | 0 (0.0 %) | 0 (0.0 %) | 75 (19.9 %) |
| Sample collection (SC) | 0 (0.0 %) | 10 (2.7%) | 3 (0.8 %) | 0 (0.0 %) | 6 (1.6 %) | 4 (1.1 %) | 2 (0.5 %) | 4 (1.1 %) | 0 (0.0 %) | 0 (0.0 %) | 29 (7.7 %) |
| Sample handling (SH) | 0 (0.0 %) | 3 (0.8 % | 1 (0.3 %) | 0 (0.0 %) | 1 (0.3 %) | 1 (0.3 %) | 0 (0.0 %) | 8 (2.1 %) | 1 (0.3 %) | 0 (0.0 %) | 15 (4.0 %) |
| Sample receipt (SR) | 0 (0.0 %) | 0 (0.0 %) | 0 (0.0 %) | 3 (0.8 %) | 0 (0.0 %) | 0 (0.0 %) | 0 (0.0 %) | 0 (0.0 %) | 0 (0.0 %) | 21 (5.6 %) | 24 (6.4 %) |
| Sample Testing (ST) | 0 (0.0 %) | 0 (0.0 %) | 0 (0.0 %) | 0 (0.0 %) | 0 (0.0 %) | 0 (0.0 %) | 0 (0.0 %) | 0 (0.0 %) | 0 (0.0 %) | 63 (16.8 %) | 63 (16.8 %) |
| Miscellaneous (MS) | 0 (0.0 %) | 5 (1.3 %) | 0 (0.0 %) | 1 (0.3 %) | 4 (1.1 %) | 3 (0.8 %) | 3 (0.8 %) | 3 (0.8 %) | 1 (0.3 %) | 12 (3.2 %) | 32 (8.5 %) |
| Total | 13 (3.5%) | 45 (12.0 %) | 18 (4.8%) | 4 (1.1 %) | 67 (17.8%) | 9 (2.4 %) | 24 (6.4%) | 29 (7.7 %) | 4 (1.1 %) | 163 (17.6 %) | 376 (100%) |
Transfusion Services also showed high efficiency in detecting errors through unplanned procedures as they accounted for the detection of 79.8% (n=300) of all the errors that did not reach the patients including 95.1% (n=155) of theirs (Table 15).
Discovery |
Occurrence | ||||||||||
|---|---|---|---|---|---|---|---|---|---|---|---|
| Blood supplier | Emergency Room | Intensive care unit | Lab. Service | Medical/ Surgical Unit | Obstetrics | Operating Room | Outpatient clinics | Supplier/ Service provider | Transfusion Service | Total | |
| Blood supplier | 3 (23.1 %) | 0 (0.0 %) | 0 (0.0 %) | 0 (0.0 %) | 0 (0.0 %) | 0 (0.0 %) | 0 (0.0 %) | 0 (0.0 %) | 0 (0.0 %) | 1 (0.6 %) | 4 (1.1 %) |
| Emergency Room | 0 (0.0 %) | 7 (15.6 %) | 0 (0.0 %) | 0 (0.0 %) | 0 (0.0 %) | 0 (0.0 %) | 0 (0.0 %) | 0 (0.0 %) | 0 (0.0 %) | 0 (0.0 %) | 7 (1.9 %) |
| Intensive care unit | 0 (0.0 %) | 0 (0.0 %) | 2 (11.1 %) | 0 (0.0 %) | 0 (0.0 %) | 0 (0.0 %) | 2 (8.3 %) | 1 (3.4 %) | 1 (25.0 %) | 2 (1.2 %) | 8 (2.1 %) |
| Laboratory service | 0 (0.0 %) | 1 (2.2 %) | 0 (0.0 %) | 1 (25.0 %) | 2 (3.0 %) | 0 (0.0 %) | 0 (0.0 %) | 2 (6.9 %) | 0 (0,0 %) | 0 (0.0 %) | 6 (1.6 %) |
| Medical/Surgical Unit | 0 (0.0 %) | 4 (8.9 %) | 0 (0.0 %) | 0 (0.0 %) | 15 (22.4 %) | 0 (0.0 %) | 0 (0.0 %) | 0 (0.0 %) | 0 (0.0 %) | 2 (1.2 %) | 21 (5.6 %) |
| Obstetrics | 0 (0.0 %) | 0 (0.0 %) | 1 (5.6 %) | 0 (0.0 %) | 0 (0,0 %) | 2 (22.2 %) | 0 (0,0 %) | 0 (0.0 %) | 0 (0.0 %) | 2 (1.2 %) | 5 (1.3 %) |
| Operating room | 0 (0.0 %) | 0 (0.0 %) | 0 (0.0 %) | 0 (0.0 %) | 1 (1.5 %) | 0 (0.0 %) | 8 (33.3 %) | 2 (6.9 %) | 1 (25.0 %) | 2 (1.2 %) | 14 (3.7 %) |
| Outpatient clinics | 0 (0.0 %) | 2 (4.4 %) | 0 (0.0 %) | 0 (0.0 %) | 1 (1.5 %) | 0 (0.0 %) | 0 (0.0 %) | 6 (20.7 %) | 0 (0.0 %) | 2 (1.2 %) | 11 (2.9 %) |
| Supplier/Service provider | 0 (0.0 %) | 0 (0.0 %) | 0 (0.0 %) | 0 (0.0 %) | 0 (0.0 %) | 0 (0.0 %) | 0 (0.0 %) | 0 (0.0 %) | 0 (0.0 %) | 0 (0.0 %) | 0 (0.0 %) |
| Transfusion Service | 10 (76.9 %) | 31 (68.9 %) | 15 (83.3 %) | 3 (75.0 %) | 48 (71.6 %) | 7 (77.8 %) | 14 (58.3 %) | 18 (62.1 %) | 2 (50.0 %) | 155 (95.1%) | 300 (79.8 %) |
| Total | 13 (100 %) | 45 (100 %) | 18 (100 %) | 4 (100 %) | 67 (100%) | 9 (100 %) | 24 (6.5 100 %) | 29 (100 %) | 4 (100 %) | 163 (100 %) | 376 (100 %) |
e) Transfusion-related errors that reached the patients (i.e. detected post transfusion)
Of all the 17,344 transfusion-related errors reported in 2012 and 2013, only 6.6% (n=1,151) reached the patients (Tables 16 & 17). Of these, those related to product request (n=253), request for pick-up (n=388) and unit transfusions (n=113) were the most common as they accounted for about 22.0%, 33.7% and 9.8%, respectively (Tables 16 & 17).
| Type of error (code) | 2012 | 2013 | Overall | ||||||
|---|---|---|---|---|---|---|---|---|---|
| Freq. (%) | RateFootnote 5 | Risk of 1 errorFootnote 6 | Freq. (%) | Rate | Risk of 1 error | Freq. (%) | Rate | Risk of 1 error | |
| Distribution code (DC) | 16 (1.4%) | 7 | 1 : 13,474 | 21 (1.8%) | 11 | 1 : 8,994 | 37 (3.2%) | 9 | 1 : 10,931 |
| Product check-in (PC) | 3 (0.3%) | 1 | 1 : 71,861 | 2 (0.2%) | 1 | 1 : 94,440 | 5 (0.4%) | 1 | 1 : 80,893 |
| Unit storage (US) | 2 (0.2%) | 1 | 1 : 107,792 | 0 (0.0%) | 0 | - | 2 (0.2%) | 0 | 1 : 202,232 |
| Inventory management (IM) | 7 (0.6%) | 3 | 1 : 30,798 | 3 (0.3%) | 2 | 1 : 62,960 | 10 (0.9%) | 2 | 1 : 40,446 |
| Product request (PR) | 128 (11.1%) | 56 | 1 : 1,782 | 125 (10.9%) | 63 | 1 : 1,595 | 253 (22.0%) | 59 | 1 : 1,690 |
| Product selection (PS) | 14 (1.2%) | 6 | 1 : 16,973 | 13 (1.1%) | 6 | 1 : 16,208 | 27 (2.3%) | 6 | 1 : 16,605 |
| Unit manipulation (UM) | 11 (1.0%) | 5 | 1 : 21,602 | 13 (1.1%) | 6 | 1 : 16,208 | 24 (2.1%) | 5 | 1 : 18,680 |
| Request for pick-up (RP) | 141 (12.3%) | 63 | 1 : 1,599 | 247 (21.5%) | 124 | 1 : 807 | 388 (33.7%) | 91 | 1 : 1,095 |
| Unit issue (UI) | 23 (2.0%) | 10 | 1 : 9,801 | 37 (3.2%) | 19 | 1 : 5,386 | 60 (5.2%) | 14 | 1 : 7,079 |
| Unit transfusion (UT) | 58 (5.0%) | 26 | 1 : 3,887 | 55 (4.8%) | 28 | 1 : 3,623 | 113 (9.8%) | 27 | 1 : 3,759 |
| Sample collection (SC) | 15 (1.3%) | 10 | 1 : 9,801 | 7 (0.6%) | 5 | 1 : 19,491 | 22 (1.9%) | 8 | 1 : 12,766 |
| Sample handling (SH) | 49 (4.3%) | 34 | 1 : 2,947 | 32 (2.8%) | 23 | 1 : 4,264 | 81 (7.0%) | 29 | 1 : 3,467 |
| Sample receipt (SR) | 26 (2.3%) | 18 | 1 : 5,554 | 19 (1.7%) | 14 | 1 : 7,181 | 45 (3.9%) | 16 | 1 : 6,241 |
| Sample Testing (ST) | 34 (3.0%) | 11 | 1 : 8,764 | 21 (1.8%) | 8 | 1 : 12,863 | 55 (4.8%) | 10 | 1 : 10,329 |
| Miscellaneous (MS) | 17 (1.5%) | - | - | 12 (1.0%) | - | - | 29 (2.5%) | - | - |
| Total | 544 (47.3%) | - | - | 607 (52.7%) | - | - | 1,151 (100%) | - | - |
| Type of error (code) | Small transfusion Capacity | Medium transfusion Capacity | Large transfusion capacity |
Overall | ||||||||
|---|---|---|---|---|---|---|---|---|---|---|---|---|
| Freq. (%) | RateFootnote 7 | Risk of 1 errorFootnote 8 | Freq. (%) | Rate | Risk of 1 error | Freq. (%) | Rate | Risk of 1 error | Freq. (%) | Rate | Risk of 1 error | |
| Distribution code (DC) | 3 (0.3%) | 28 | 1 : 3,542 | 24 (2.1%) | 19 | 1 : 5,258 | 10 (0.9%) | 4 | 1 : 26,766 | 37 (3.2%) | 9 | 1 : 10,931 |
| Product check-in (PC) | 1 (0.1%) | 9 | 1 : 10,625 | 2 (0.2%) | 2 | 1 : 63,091 | 2 (0.2%) | 1 | 1 : 133,829 | 5 (0.4%) | 1 | 1 : 80,893 |
| Unit storage (US) | 0 (0.0%) | n/a | - | 1 (0.1%) | 1 | 1 : 126,181 | 1 (0.1%) | 0 | 1 : 267,658 | 2 (0.2%) | 0 | 1 : 202,232 |
| Inventory management (IM) | 2 (0.2%) | 19 | 1 : 5,313 | 3 (0.3%) | 2 | 1 : 42,060 | 5 (0.4%) | 2 | 1 : 53,532 | 10 (0.9%) | 2 | 1 : 40,446 |
| Product request (PR) | 6 (0.5%) | 69 | 1 : 1,445 | 18 (1.6%) | 14 | 1 : 7,119 | 229 19.9%) | 79 | 1 : 1,269 | 253 (22.0%) | 59 | 1 : 1,690 |
| Product selection (PS) | 0 (0.0%) | 0 | - | 8 (0.7%) | 6 | 1 : 17,111 | 19 (1.7%) | 6 | 1 : 16,052 | 27 (2.3%) | 6 | 1 : 16,605 |
| Unit manipulation (UM) | 0 (0.0%) | 0 | - | 9 (0.8%) | 7 | 1 : 15,210 | 15 (1.3%) | 5 | 1 : 20,333 | 24 (2.1%)) | 5 | 1 : 18,680 |
| Request for pick-up (RP) | 2 (0.2%) | 29 | 1 : 3,484 | 21 (1.8%) | 16 | 1 : 6,101 | 365 (31.7%) | 126 | 1 : 794 | 388 (33.7%) | 91 | 1 : 1,095 |
| Unit issue (UI) | 0 (0.0%) | 0 | - | 25 (2.2%) | 20 | 1 : 5,125 | 35 (3.0%) | 12 | 1 : 8,275 | 60 (5.2%) | 14 | 1 : 7,079 |
| Unit transfusion (UT) | 3 (0.3%) | 43 | 1 : 2,323 | 65 (5.6%) | 51 | 1 : 1,971 | 45 (3.9%) | 16 | 1 : 6,436 | 113 ()9.8%) | 27 | 1 : 3,759 |
| Sample collection(SC) | 0 (0.0%) | 0 | - | 11 (1.0%) | 15 | 1 : 6,512 | 11 (1.0%) | 6 | 1 : 17,736 | 22 (1.9%) | 8 | 1 : 12,766 |
| Sample handling (SH) | 3 (0.3%) | 21 | 1 : 4,707 | 4 (0.3%) | 6 | 1 : 17,908 | 74 (6.4%) | 38 | 1 : 2,636 | 81 (7.0%) | 29 | 1 : 3,467 |
| Sample receipt (SR) | 3 (0.3%) | 21 | 1 : 4,707 | 11 (1.0%) | 15 | 1 : 6,512 | 31 (2.7%) | 16 | 1 : 6,293 | 45 (3.9%) | 16 | 1 : 6,241 |
| Sample Testing (ST) | 1 (0.1%) | 8 | 1 : 13,315 | 22 (1.9%) | 15 | 1 : 6,462 | 32 (2.8%) | 8 | 1 : 12,894 | 55 (4.8%) | 10 | 1 : 10,329 |
| Miscellaneous (MS) | 1 (0.1%) | - | - | 22 (1.9%) | - | - | 6 (0.5%) | - | - | 29 (2.5%) | - | - |
| Total | 25 (2.2%) | - | - | 246 (21.4%) | - | - | 880 (76.5%) | - | - | 1,151 (100%) | - | - |
Cases that originated from large capacity hospitals (i.e. transfusing more than 10,000 units of red blood cells annually) were about 3.6 times that from hospitals transfusing between 2,000 and 10,000 units per year, and over 35 times that reported by hospitals transfusing less than 2,000 units per year (Table 17).
Not all the errors that reached the patients resulted in harm to the patient. In 73.8% (n=850) of the cases, transfusion procedure was delayed (Table 18) without impact to the patients and, in an additional 19.1% (n=220), though the errors were discovered after the product had been transfused, there was no negative impact to the the patient. Only 3.0% (n=34) of the errors that reached the patients resulted in adverse transfusion reactions (Table 19). The most common of these reactions was transfusion-associated circulatory overload (TACO) with 22 cases (64.7%) followed by febrile non-hemolytic and minor allergic reactions. Errors that led to TACO were related to product request (PR 04, PR 06, and PR 99) and not following guidelines for infusion time (UT 25) as detailed in Table 19; whereas those that resulted in febrile non-hemolytic and minor allergic reactions included inappropriate order of blood product (PR 06), and not following guidelines for infusion time (UT 25) or transfusion reaction protocol (UT 26). Other adverse reactions that resulted from transfusion-related errors included two cases of acute hemolytic & delayed serologic transfusion reactions (Table 19) respectively from incorrect selection of product/unit (PS 01) and sample testing error (ST 99), as well as a case of IVIG-related headache from not following transfusion reaction protocol (UT 26).
| Type of error (code) | CQ 01 (Procedure delayed/cancelled) |
CQ 02 (Transfusion delayed) |
CQ 03 (Adverse reactions) |
CQ 04 (Product transfused, but no adverse reaction) |
CQ 05 (Incorrect dose admistered, but no adverse reaction) |
CQ 06 (Loss traceability) |
Total | |||||||
|---|---|---|---|---|---|---|---|---|---|---|---|---|---|---|
| Freq. (%) | Freq. (%) | Freq. (%) | Freq. (%) | Freq. (%) | Freq. (%) | Freq. (%) | ||||||||
| Distribution code (DC) | 0 | (0.0%) | 34 | (3.0%) | 0 | (0.0%) | 2 | (0.2%) | 0 | (0.0%) | 0 | (0.0%) | 36 | (3.1%) |
| Product check-in (PC) | 0 | (0.0%) | 5 | (0.4%) | 0 | (0.0%) | 0 | (0.0%) | 0 | (0.0%) | 0 | (0.0%) | 5 | (0.4%) |
| Unit storage (US) | 0 | (0.0%) | 1 | (0.1%) | 0 | (0.0%) | 1 | (0.1%) | 0 | (0.0%) | 0 | (0.0%) | 2 | (0.2%) |
| Inventory management (IM) | 0 | (0.0%) | 5 | (0.4%) | 0 | (0.0%) | 3 | (0.3%) | 0 | (0.0%) | 2 | 0.2% | 10 | (0.9%) |
| Product request (PR) | 4 | (0.3%) | 186 | (16.2%) | 26 | (2.3%) | 37 | (3.2%) | 0 | (0.0%) | 0 | (0.0%) | 253 | (22.0%) |
| Request for pick-up (RP) | 0 | (0.0%) | 383 | (33.3%) | 0 | (0.0%) | 4 | (0.3%) | 1 | (0.1%) | 0 | (0.0%) | 388 | (33.7%) |
| Product selection (PS) | 0 | (0.0%) | 11 | (1.0%) | 1 | (0.1%) | 13 | (1.1%) | 2 | (0.2%) | 0 | (0.0%) | 27 | (2.3%) |
| Unit manipulation (UM) | 1 | (0.1%) | 16 | (1.4%) | 0 | (0.0%) | 5 | (0.4%) | 2 | (0.2%) | 0 | (0.0%) | 24 | (2.1%) |
| Unit issue (UI) | 0 | (0.0%) | 30 | (2.6%) | 0 | (0.0%) | 27 | (2.3%) | 3 | (0.3%) | 0 | (0.0%) | 60 | (5.2%) |
| Unit transfusion (UT) | 0 | (0.0%) | 21 | (1.8%) | 6 | (0.5%) | 64 | (5.6%) | 11 | (1.0%) | 11 | (1.0%) | 113 | (9.8%) |
| Sample collection (SC) | 1 | (0.1%) | 20 | (1.7%) | 0 | (0.0%) | 2 | (0.2%) | 0 | (0.0%) | 0 | (0.0%) | 23 | (2.0%) |
| Sample handling (SH) | 1 | (0.1%) | 64 | (5.6%) | 0 | (0.0%) | 16 | (1.4%) | 0 | (0.0%) | 0 | (0.0%) | 81 | (7.0%) |
| Sample receipt (SR) | 1 | (0.1%) | 19 | (1.7%) | 0 | (0.0%) | 24 | (2.1%) | 1 | (0.1%) | 0 | (0.0%) | 45 | (3.9%) |
| Sample Testing (ST) | 4 | (0.3%) | 30 | (2.6%) | 1 | (0.1%) | 20 | (1.7%) | 0 | (0.0%) | 0 | (0.0%) | 55 | (4.8%) |
| Miscellaneous (MS) | 2 | (0.2%) | 25 | (2.2%) | 0 | (0.0%) | 2 | (0.2%) | 0 | (0.0%) | 0 | (0.0%) | 29 | (2.5%) |
| Total | 14 | (1.2%) | 850 | (73.8%) | 34 | (3.0%) | 220 | (19.1%) | (20) | (1.7%) | 13 | (1.1%) | 1,151 | (100%) |
| Type of error (code) | Acute hemolytic transfusion reaction | Delayed serologic transfusion reaction | Febrile non-hemolytic reaction | IVIG Headache | Minor Allergic Reaction | Transfusion-associated circulatory overload (TACO) | Total |
|---|---|---|---|---|---|---|---|
| Hospitals of large transfusion capacity (i.e. transfusing more than 10,000 RBC per year) | |||||||
| Order not done or incorrect (PR 04) | 0 (0.0%) | 0 (0.0%) | 0 (0.0%) | 0 (0.0%) | 0 (0.0%) | 3 (8.8%) | 3 (8.8%) |
| Inappropriate order of blood product (PR 06) | 0 (0.0%) | 0 (0.0%) | 4 (11.8%) | 0 (0.0%) | 2 (5.9%) | 3 (8.8%) | 9 (26.5%) |
| Product request error of unspecified nature (PR 99) | 0 (0.0%) | 0 (0.0%) | 0 (0.0%) | 0 (0.0%) | 0 (0.0%) | 14 (41.2%) | 14 (41.2%) |
| Incorrect product/unit selected (PS 01) | 1 (2.9%) | 0 (0.0%) | 0 (0.0%) | 0 (0.0%) | 0 (0.0%) | 0 (0.0%) | 1 (2.9%) |
| Guidelines for infusion time not followed (UT 25) | 0 (0.0%) | 0 (0.0%) | 0 (0.0%) | 0 (0.0%) | 0 (0.0%) | 1 (2.9%) | 1 (2.9%) |
| Subtotal | 1 (2.9%) | 0 (0.0%) | 4 (11.8%) | 0 (0.0%) | 2 (5.9%) | 21 (61.8%) | 28 (82.4%) |
| Hospitals of medium transfusion capacity (i.e. transfusing 2,000-10,000 RBC per year) | |||||||
| Sample testing error of unspecified nature (ST 99) | 0 (0.0%) | 1 (2.9%) | 0 (0.0%) | 0 (0.0%) | 0 (0.0%) | 0 (0.0%) | 1 (2.9%) |
| Guidelines for infusion time not followed (UT 25) | 0 (0.0%) | 0 (0.0%) | 0 (0.0%) | 0 (0.0%) | 1 (2.9%) | 1 (2.9%) | 2 (5.9%) |
| Transfusion reaction protocol not followed (UT 26) | 0 (0.0%) | 0 (0.0%) | 1 (2.9%) | 1 (2.9%) | 0 (0.0%) | 0 (0.0%) | 2 (5.9%) |
| Subtotal | 0 (0.0%) | 1 (2.9%) | 1 (2.9%) | 1 (2.9%) | 1 (2.9%) | 1 (2.9%) | 5 (14.7%) |
| Hospitals of small transfusion capacity (i.e. transfusing less than 2,000 RBC per year) | |||||||
| Transfusion reaction protocol not followed (UT 26) | 0 (0.0%) | 0 (0.0%) | 1 (2.9%) | 0 (0.0%) | 0 (0.0%) | 0 (0.0%) | 1 (2.9%) |
| Subtotal | 0 (0.0%) | 0 (0.0%) | 1 (2.9%) | 0 (0.0%) | 0 (0.0%) | 0 (0.0%) | 1 (2.9%) |
| Total | 1 (2.9%) | 1 (2.9%) | 6 (17.6%) | 1 (2.9%) | 3 (8.8%) | 22 (64.7%) | 34 (100%) |
In comparison, harmful errors from large (i.e. transfusing more than 10,000 RBC units per year) transfusion capacity hospitals (Tables 19 & 20) were related to product requests (n=26; 92.9%), product selection (n=1; 3.6%) and unit transfusion (n=1; 3.6%). These errors were determined to be associated with 21 cases of TACO, 4 cases of febrile non-hemolytic reactions (n=4), 2 cases of minor allergic reactions and one case of acute hemolytic reaction (Tables 19 & 20). The only harmful error detected in hospitals of small (i.e. transfusing less than 2,000 RBC units per year) transfusion capacity was non-adherence to transfusion reaction protocol (UT 26) which led to a case of febrile non-hemolytic reaction in an emergency room (Table 20).
| Type of error (code) | Emergency Room | Intensive care unit | Medical/ surgical ward | Operating room | Outpatient clinic | Transfusion Service | Total |
|---|---|---|---|---|---|---|---|
| Hospitals of large transfusion capacity (i.e. transfusing more than 10,000 RBC per year) | |||||||
| Order not done or incorrect (PR 04) | 1 (2.9%) | 2 (5.9%) | 0 (0.0%) | 0 (0.0%) | 0 (0.0%) | 0 (0.0%) | 3 (8.8%) |
| Inappropriate order of blood product (PR 06) | 1 (2.9%) | 3 (8.8%) | 3 (8.8%) | 1 (2.9%) | 1 (2.9%) | 0 (0.0%) | 9 (26.5%) |
| Product request error of unspecified nature (PR 99) | 2 (5.9%) | 1 (2.9%) | 11 (32.4%) | 0 (0.0%) | 0 (0.0%) | 0 (0.0%) | 14 (41.2%) |
| Incorrect product/unit selected (PS 01) | 0 (0.0%) | 0 (0.0%) | 0 (0.0%) | 0 (0.0%) | 0 (0.0%) | 1 (2.9%) | 1 (2.9%) |
| Guidelines for infusion time not followed (UT 25) | 0 (0.0%) | 0 (0.0%) | 1 (2.9%) | 0 (0.0%) | 0 (0.0%) | 0 (0.0%) | 1 (2.9%) |
| Subtotal | 4 (11.8%) | 6 (17.6%) | 14 (41.2%) | 1 (2.9%) | 1 (2.9%) | 1 (2.9%) | 28 (82.4%) |
| Hospitals of medium transfusion capacity (i.e. transfusing 2,000-10,000 RBC per year) | |||||||
| Sample testing error of unspecified nature (ST 99) | 0 (0.0%) | 0 (0.0%) | 0 (0.0%) | 0 (0.0%) | 0 (0.0%) | 1 (2.9%) | 1 (2.9%) |
| Guidelines for infusion time not followed (UT 25) | 1 (2.9%) | 0 (0.0%) | 0 (0.0%) | 0 (0.0%) | 1 (2.9%) | 0 (0.0%) | 2 (5.9%) |
| Transfusion reaction protocol not followed (UT 26) | 0 (0.0%) | 0 (0.0%) | 0 (0.0%) | 0 (0.0%) | 2 (5.9%) | 0 (0.0%) | 2 (5.9%) |
| Subtotal | 1 (2.9%) | 0 (0.0%) | 0 (0.0%) | 0 (0.0%) | 3 (8.8%) | 1 (2.9%) | 5 (14.7%) |
| Hospitals of small transfusion capacity (i.e. transfusing less than 2,000 RBC per year) | |||||||
| Transfusion reaction protocol not followed (UT 26) | 1 (2.9%) | 0 (0.0%) | 0 (0.0%) | 0 (0.0%) | 0 (0.0%) | 0 (0.0%) | 1 (2.9%) |
| Subtotal | 1 (2.9%) | 0 (0.0%) | 0 (0.0%) | 0 (0.0%) | 0 (0.0%) | 0 (0.0%) | 1 (2.9%) |
| Total | 6 (17.6%) | 6 (17.6%) | 14 (41.2%) | 1 (2.9%) | 4 (11.8%) | 2 (5.9%) | 34 (100%) |
About 91.2% (n=31) of the transfusion-related errors found to be associated with adverse transfusion reactions were of high potential severity (Table 21). Product request errors coded as PR 04, PR 06 and PR 99 were determined to be associated with 19 cases of TACO, 4 cases of febrile non-hemolytic transfusion reactions and 2 cases of minor allergic reactions. Additional cases of TACO and febrile non-hemolytic transfusion reactions (Table 21) were linked to not following either the guidelines for infusion time (UT 25) or the transfusion reaction protocol (UT 26). The other two errors deemed to be of high potential severity were related to product/unit selection (PS 01) and sample testing (ST 99) and were respectively determined to be linked to an acute hemolytic and a delayed serologic transfusion reactions. The remaining 8.2% (n=3) of the errors found to be associated with adverse transfusion reactions were of medium potential severity and were also related to incorrect /no ordering of blood or blood product (PR 04), not following the guidelines for infusion time (UT 25) and the transfusion reaction protocol (UT 26).
| Type of error (code) | Acute hemolytic transfusion reaction | Delayed serologic transfusion reaction | Febrile non-hemolytic reaction | Minor Allergic Reaction | Transfusion-associated circulatory overload (TACO) | Total |
|---|---|---|---|---|---|---|
| Order not done or incorrect (PR 04) | 0 (0.0%) | 0 (0.0%) | 0 (0.0%) | 0 (0.0%) | 2 (6.5%) | 2 (6.5%) |
| Inappropriate order of blood product (PR 06) | 0 (0.0%) | 0 (0.0%) | 4 (11.8%) | 2 (6.5%) | 3 (8.8%) | 9 (29.0%) |
| Product request error of unspecified nature (PR 99) | 0 (0.0%) | 0 (0.0%) | 0 (0.0%) | 0 (0.0%) | 14 (45.2%) | 14 (45.2%) |
| Sampling testing error of unspecified nature (ST 99) | 0 (0.0%) | 1 (3.2%) | 0 (0.0%) | 0 (0.0%) | 0 (0.0%) | 1 (3.2%) |
| Incorrect product/unit selected (PS 01) | 1 (3.2%) | 0 (0.0%) | 0 (0.0%) | 0 (0.0%) | 0 (0.0%) | 1 (3.2%) |
| Guidelines for infusion time not followed (UT 25) | 0 (0.0%) | 0 (0.0%) | 0 (0.0%) | 0 (0.0%) | 2 (6.5%) | 2 (6.5%) |
| Transfusion reaction protocol not followed (UT 26) | 0 (0.0%) | 0 (0.0%) | 2 (6.5%) | 0 (0.0%) | 0 (0.0%) | 2 (6.5%) |
| Total | 1 (3.2%) | 1 (3.2%) | 6 (19.4%) | 2 (6.5%) | 21 (67.7%) | 31 (100%) |
Conclusion and future work
Overall, sample collection (SC) and sample handling (SH) errors remain the most frequent transfusion-related errors. Transfusion Services, as well as Medical/Surgical Wards and Emergency Rooms continue to be the locations where most of the transfusion-related errors occur. However, unlike Medical/Surgical Wards and Emergency Rooms that have been able to detect only less than 10% of errors that occurred in their units, Transfusion Services' error detection processes captured the vast majority (over 94%) of these errors.
Although the total number of errors recorded remains substantially high (n=17,344), the proportion that reaches the patients undetected represents just 6.6% (n=1,151). Of the errors that reach the patients, only about 3% actually resulted in an adverse reaction. Nevertheless, continued monitoring and improvements of the transfusion safety processes are recommended as the potential for harm resulting from transfusion errors can be considerable not only for the patients, but for the hospitals as well. Clinical settings demonstrated inefficacy in capturing their own errors; therefore, it is recommended to audit/review and potentially update the transfusion error detection procedures currently in place. Particular attention should be given to procedures targeting errors related to product requests, requests for pick-up and unit transfusion since these errors collectively represented the bulk of the errors that reached the patients.
The TESS working group has shown that it is possible to improve error tracking within the clinical and transfusion areas even when there are existing SOPs, etc. Future work will target interventions to increase timely error tracking outside the Transfusion Services, particularly those related to sample collection and transfusion documentation (such as product requests and requests for pick-up). The Agency through the TESS working group will also assess the feasibility of partnering with the Canadian Patient Safety Institute (CPSI) in order to address the issues related to patient identification.
References
- Public Health Agency of Canada. Transfusion Transmitted Injuries Surveillance System (TTISS): 2006-2012 Report. Centre for Communicable Diseases and Infection Control, Public Health Agency of Canada, 2014.
Appendix 1: Transfusion-related errors discovered through quality assurrance review and audits of the inventory and transfusion documentation more than 2 days after the event had occurred
Approximately 63.0% (n=3,777) of transfusion-related errors detected through quality assurance review and inventory audit and review of transfusion documentation more than two days after the events had occurred (Table 22) were discovered more than 30 days (41.3%; n=2,476) or between 15 to 30 days (21.7%; n=1,301) later. Errors related to sample collection, product storage, unit transfusion and unit issue account for 27.3% (n=1,636), 24.9% (n=1,494), 20.4% (n=1,221) and 14.3% (n=859), respectively (Table 22). The breakdown of the specific errors under these categories is summarized in Table 23 and the description of specific event codes provided in Appendix 2.
| Discovered 2-7 days after occurrence | Discovered 8-14 days after occurrence | Discovered 15-30 days after occurrence | Discovered more than 30 days after occurrence | Total | ||||||
|---|---|---|---|---|---|---|---|---|---|---|
| Freq | % | Freq | % | Freq | % | Freq | % | Freq | % | |
| Distribution code (DC) | 7 | 0.1% | 2 | 0.0% | 0 | 0.0% | 3 | 0.1% | 12 | 0.2% |
| Product check-in (PC) | 38 | 0.6% | 13 | 0.2% | 30 | 0.5% | 22 | 0.4% | 103 | 1.7% |
| Unit storage (US) | 189 | 3.2% | 294 | 4.9% | 556 | 9.3% | 455 | 7.6% | 1,494 | 24.9% |
| Inventory management (IM) | 19 | 0.3% | 12 | 0.2% | 14 | 0.2% | 15 | 0.3% | 60 | 1.0% |
| Product request (PR) | 16 | 0.3% | 2 | 0.0% | 0 | 0.0% | 2 | 0.0% | 20 | 0.3% |
| Request for pick-up (RP) | 0 | 0.0% | 0 | 0.0% | 0 | 0.0% | 0 | 0.0% | 0 | 0.0% |
| Product selection (PS) | 6 | 0.1% | 0 | 0.0% | 1 | 0.0% | 0 | 0.0% | 7 | 0.1% |
| Unit manipulation (UM) | 14 | 0.2% | 6 | 0.1% | 26 | 0.4% | 48 | 0.8% | 94 | 1.6% |
| Unit issue (UI) | 147 | 2.5% | 175 | 2.9% | 347 | 5.8% | 190 | 3.2% | 859 | 14.3% |
| Unit transfusion (UT) | 794 | 13.2% | 230 | 3.8% | 144 | 2.4% | 53 | 0.9% | 1,221 | 20.4% |
| Sample collection (SC) | 1 | 0.0% | 9 | 0.2% | 31 | 0.5% | 1,595 | 26.6% | 1,636 | 27.3% |
| Sample handling (SH) | 4 | 0.1% | 0 | 0.0% | 0 | 0.0% | 0 | 0.0% | 4 | 0.1% |
| Sample receipt (SR) | 38 | 0.6% | 7 | 0.1% | 1 | 0.0% | 4 | 0.1% | 50 | 0.8% |
| Sample Testing (ST) | 78 | 1.3% | 70 | 1.2% | 120 | 2.0% | 70 | 1.2% | 338 | 5.6% |
| Miscellaneous (MS) | 30 | 0.5% | 21 | 0.4% | 31 | 0.5% | 19 | 0.3% | 101 | 1.7% |
| n/a | n/a | n/a | n/a | n/a | n/a | n/a | n/a | n/a | n/a | n/a |
| Total | 1,381 | 23.0% | 841 | 14.0% | 1,301 | 21.7% | 2,476 | 41.3% | 5,999 | 100% |
| Specific error code (Dscription provided in Appendix 2) |
2012 | 2013 | Total | |||
|---|---|---|---|---|---|---|
| Frequency | Percentage | Frequency | Percentage | Frequency | Percentage | |
| DC 02 | 1 | 0.0% | 1 | 0.0% | 2 | 0.1% |
| DC 04 | 1 | 0.0% | 2 | 0.1% | 3 | 0.1% |
| DC 05 | 1 | 0.0% | 0 | 0.0% | 1 | 0.0% |
| DC 08 | 2 | 0.0% | 2 | 0.1% | 4 | 0.1% |
| DC 99 | 1 | 0.0% | 1 | 0.0% | 2 | 0.1% |
| All DC errors | 6 | 0.1% | 6 | 0.2% | 12 | 0.4% |
| PC 01 | 28 | 0.5% | 67 | 2.2% | 95 | 3.1% |
| PC 05 | 4 | 0.1% | 1 | 0.0% | 5 | 0.2% |
| PC 06 | 0 | 0.0% | 1 | 0.0% | 1 | 0.0% |
| PC 99 | 0 | 0.0% | 2 | 0.1% | 2 | 0.1% |
| All PC errors | 32 | 0.5% | 71 | 2.4% | 103 | 3.4% |
| IM 01 | 4 | 0.1% | 2 | 0.1% | 6 | 0.2% |
| IM 02 | 19 | 0.3% | 29 | 1.0% | 48 | 1.6% |
| IM 03 | 0 | 0.0% | 1 | 0.0% | 1 | 0.0% |
| IM 04 | 1 | 0.0% | 2 | 0.1% | 3 | 0.1% |
| IM 99 | 2 | 0.0% | 0 | 0.0% | 2 | 0.1% |
| All IM errors | 26 | 0.4% | 34 | 1.1% | 60 | 2.0% |
| US 01 | 1 | 0.0% | 0 | 0.0% | 1 | 0.0% |
| US 02 | 1 | 0.0% | 0 | 0.0% | 1 | 0.0% |
| US 03 | 654 | 10.9% | 796 | 26.4% | 1,450 | 48.1% |
| US 04 | 1 | 0.0% | 3 | 0.1% | 4 | 0.1% |
| US 99 | 1 | 0.0% | 37 | 1.2% | 38 | 1.3% |
| All US errors | 658 | 11.0% | 836 | 27.7% | 1,494 | 49.5% |
| PR 04 | 1 | 0.0% | 3 | 0.1% | 4 | 0.1% |
| PR 06 | 3 | 0.1% | 1 | 0.0% | 4 | 0.1% |
| PR 07 | 0 | 0.0% | 1 | 0.0% | 1 | 0.0% |
| PR 99 | 6 | 0.1% | 5 | 0.2% | 11 | 0.4% |
| All PR errors | 10 | 0.2% | 10 | 0.3% | 20 | 0.7% |
| PS 01 | 1 | 0.0% | 4 | 0.1% | 5 | 0.2% |
| PS 09 | 1 | 0.0% | 0 | 0.0% | 1 | 0.0% |
| PS 99 | 0 | 0.0% | 1 | 0.0% | 1 | 0.0% |
| All PS errors | 2 | 0.0% | 5 | 0.2% | 7 | 0.2% |
| UM 01 | 32 | 0.5% | 23 | 0.8% | 55 | 1.8% |
| UM 05 | 1 | 0.0% | 2 | 0.1% | 3 | 0.1% |
| UM 09 | 0 | 0.0% | 3 | 0.1% | 3 | 0.1% |
| UM 99 | 33 | 0.6% | 0 | 0.0% | 33 | 1.1% |
| All UM errors | 66 | 1.1% | 28 | 0.9% | 94 | 3.1% |
| UI 01 | 67 | 1.1% | 39 | 1.3% | 106 | 3.5% |
| UI 04 | 1 | 0.0% | 0 | 0.0% | 1 | 0.0% |
| UI 06 | 0 | 0.0% | 1 | 0.0% | 1 | 0.0% |
| UI 09 | 2 | 0.0% | 5 | 0.2% | 7 | 0.2% |
| UI 19 | 0 | 0.0% | 2 | 0.1% | 2 | 0.1% |
| UI 21 | 348 | 5.8% | 387 | 12.8% | 735 | 24.4% |
| UI 99 | 5 | 0.1% | 2 | 0.1% | 7 | 0.2% |
| All UI errors | 423 | 7.1% | 436 | 14.5% | 859 | 28.5% |
| UT 04 | 3 | 0.1% | 4 | 0.1% | 7 | 0.2% |
| UT 23 | 533 | 8.9% | 313 | 10.5% | 846 | 28.4% |
| UT 24 | 90 | 1.5% | 37 | 1.2% | 127 | 4.3% |
| UT 25 | 53 | 0.9% | 73 | 2.4% | 126 | 4.2% |
| UT 26 | 1 | 0.0% | 3 | 0.1% | 4 | 0.1% |
| UT 27 | 29 | 0.5% | 60 | 2.0% | 89 | 3.0% |
| UT 28 | 1 | 0.0% | 4 | 0.1% | 5 | 0.2% |
| UT 29 | 1 | 0.0% | 1 | 0.0% | 2 | 0.1% |
| UT 99 | 10 | 0.2% | 5 | 0.2% | 15 | 0.5% |
| All UT errors | 721 | 12.0% | 500 | 16.8% | 1,221 | 40.9% |
| SC 06 | 0 | 0.0% | 1 | 0.0% | 1 | 0.0% |
| SC 08 | 5 | 0.1% | 1,629 | 54.6% | 1,634 | 54.8% |
| SC 99 | 1 | 0.0% | 0 | 0.0% | 1 | 0.0% |
| All SC errors | 6 | 0.1% | 1,630 | 54.7% | 1,636 | 54.9% |
| SH 03 | 1 | 0.0% | 0 | 0.0% | 1 | 0.0% |
| SH 07 | 1 | 0.0% | 0 | 0.0% | 1 | 0.0% |
| SH 12 | 0 | 0.0% | 1 | 0.0% | 1 | 0.0% |
| SH 99 | 0 | 0.0% | 1 | 0.0% | 1 | 0.0% |
| All SH errors | 2 | 0.0% | 2 | 0.1% | 4 | 0.1% |
| SR 02 | 1 | 0.0% | 4 | 0.1% | 5 | 0.1% |
| SR 03 | 18 | 0.3% | 0 | 0.0% | 18 | 0.3% |
| SR 04 | 5 | 0.1% | 20 | 0.3% | 25 | 0.4% |
| SR 99 | 2 | 0.0% | 0 | 0.0% | 2 | 0.0% |
| All SR errors | 26 | 0.4% | 24 | 0.4% | 50 | 0.8% |
| ST 04 | 100 | 1.7% | 108 | 1.8% | 208 | 3.5% |
| ST 06 | 27 | 0.5% | 60 | 1.0% | 87 | 1.5% |
| ST 09 | 0 | 0.0% | 1 | 0.0% | 1 | 0.0% |
| ST 12 | 12 | 0.2% | 1 | 0.0% | 13 | 0.2% |
| ST 13 | 1 | 0.0% | 0 | 0.0% | 1 | 0.0% |
| ST 14 | 2 | 0.0% | 3 | 0.1% | 5 | 0.1% |
| ST 15 | 2 | 0.0% | 0 | 0.0% | 2 | 0.0% |
| ST 16 | 1 | 0.0% | 0 | 0.0% | 1 | 0.0% |
| ST 19 | 5 | 0.1% | 2 | 0.0% | 7 | 0.1% |
| ST 21 | 0 | 0.0% | 1 | 0.0% | 1 | 0.0% |
| ST 22 | 0 | 0.0% | 1 | 0.0% | 1 | 0.0% |
| ST 99 | 3 | 0.1% | 8 | 0.1% | 11 | 0.2% |
| All ST errors | 153 | 2.6% | 185 | 3.1% | 338 | 5.6% |
| MS 03 | 0 | 0.0% | 4 | 0.1% | 4 | 0.1% |
| MS 04 | 5 | 0.1% | 5 | 0.1% | 10 | 0.2% |
| MS 05 | 3 | 0.1% | 60 | 1.0% | 63 | 1.1% |
| MS 06 | 4 | 0.1% | 7 | 0.1% | 11 | 0.2% |
| MS 99 | 9 | 0.2% | 4 | 0.1% | 13 | 0.2% |
| All MS errors | 21 | 0.4% | 80 | 1.3% | 101 | 1.7% |
| Total | 1,392 | 23.2% | 1,625 | 53.9% | 5,999 | 100% |
Specific transfusion-related errors most frequently discovered through quality assurance review and audits of inventories and transfusion documentations more than two days after occurrence included (Table 23) unnecessary sample collection (SC 08) which accounted for 54.8% (n=1,634), followed by inappropriate monitoring of storage devices (US 03), incomplete documentation (UT 23) and non-verification of receipts (UI 21) representing respectively 48.1% (n=1,450), 28.4% (n=846) and 24.4% (n=735). The overall predominant error types discovered through the above-mentioned procedures differed from one province to another (Table 24), but was consistent from one year to another with the exception of province "D" which posted a very high proportion of sample collection (SC) errors in 2013. Unit transfusion (UT) errors were the most commonly reported from province "B", compared to unit storage (US), unit issue (UI) and sample testing (ST) errors which accounted for the majority (89.4%) of province "C" reports (Table 24).
| Error code | Province A |
Province B |
Province C |
Province D |
Total | |||||
|---|---|---|---|---|---|---|---|---|---|---|
| 2012 | 2013 | 2012 | 2013 | 2012 | 2013 | 2012 | 2013 | 2012 | 2013 | |
| DC | 4 (0.2%) | 4 (0.1%) | 0 (0.0%) | 0 (0.0%) | 1 (0.0%) | 1 (0.0%) | 1 (0.0%) | 1 (0.0%) | 6 (0.3%) | 6 (0.2%) |
| PC | 6 (0.3%) | 9 (0.2%) | 2 (0.1%) | 3 (0.1%) | 21 (1.0%) | 54 (1.4%) | 3 (0.1%) | 5 (0.2%) | 32 (1.5%) | 71 (1.8%) |
| US | 2 (0.1%) | 0 (0.0%) | 15 (0.7%) | 15 (0.4%) | 640 (29.7%) | 820 (21.3%) | 1 (0.0%) | 1 (0.0%) | 658 (30.6%) | 836 (21.7%) |
| IM | 2 (0.1%) | 3 (0.1%) | 4 (0.2%) | 0 (0.0%) | 2 (0.1%) | 4 (0.1%) | 18 (0.8%) | 27 (0.7%) | 26 (1.2%) | 34 (0.9%) |
| PR | 7 (0.3%) | 6 (0.2%) | 3 (0.1%) | 0 (0.0%) | 0 (0.0%) | 0 (0.0%) | 0 (0.0%) | 4 (0.2%) | 10 (0.5%) | 10 (0.3%) |
| PS | 0 (0.0%) | 1 (0.0%) | 1 (0.0%) | 0 (0.0%) | 0 (0.0%) | 0 (0.0%) | 1 (0.0%) | 4 (0.2%) | 2 (0.1%) | 5 (0.1%) |
| UM | 0 (0.0%) | 1 (0.0%) | 1 (0.0%) | 0 (0.0%) | 61 (2.8%) | 22 (0.6%) | 4 (0.2%) | 5 (0.2%) | 66 (3.1%) | 28 (0.7%) |
| UI | 4 (0.2%) | 5 (0.1%) | 5 (0.2%) | 0 (0.0%) | 409 (19.0%) | 422 (11.0%) | 5 (0.2%) | 9 (0.2%) | 423 (19.7%) | 436 (11.3%) |
| UT | 0 (0.0%) | 1 (0.0%) | 683 (31.7%) | 438 (11.4%) | 18 (0.8%) | 42 (1.1%) | 20 (0.9%) | 19 (0.5%) | 721 (33.5%) | 500 (13.0%) |
| SC | 1 (0.0%) | 0 (0.0%) | 0 (0.0%) | 0 (0.0%) | 0 (0.0%) | 0 (0.0%) | 5 (0.2%) | 1,630 (42.3%) | 6 (0.3%) | 1,630 (42.2%) |
| SH | 0 (0.0%) | 1 (0.0%) | 0 (0.0%) | 0 (0.0%) | 0 (0.0%) | 0 (0.0%) | 2 (0.1%) | 1 (0.0%) | 2 (0.1%) | 2 (0.1%) |
| SR | 1 (0.0%) | 0 (0.0%) | 1 (0.0%) | 1 (0.0%) | 18 (0.8%) | 16 (0.4%) | 6 (0.3%) | 7 (0.2%) | 26 (1.2%) | 24 (0.6%) |
| ST | 10 (0.5%) | 8 (0.2%) | 8 (0.4%) | 6 (0.2%) | 122 (5.7%) | 158 (4.1%) | 13 (0.6%) | 13 (0.3%) | 153 (7.1%) | 185 (4.8%) |
| MS | 2 (0.1%) | 0 (0.0%) | 5 (0.2%) | 7 (0.2%) | 6 (0.3%) | 40 (1.0%) | 8 (0.4%) | 33 (0.9%) | 21(1.0%) | 80 (2.1%) |
| Total | 39 (1.8%) | 39 (1.8%) | 728 (33.8%) | 470 (12.2%) | 1,298 (60.3%) | 1,579 (41.0%) | 87 (4.0%) | 1,759 (45.6%) | 2,152 (100%) | 3,847 (100%) |
Appendix 2: Specific event codes & corresponding descriptions
- Event code
- Description of event
Errors related to Distributors (DC)
- DC 00
- Not specified
- DC 01
- Collection
- DC 02
- Processing/testing
- DC 03
- Labelling
- DC 04
- Packaging
- DC 05
- Transport
- DC 06
- Look-back traceback
- DC 07
- Recall Process
- DC 08
- Order incompletely / incorrectly filled
- DC 99
- Other
Errors related to Product Check-in (PC)
- PC 00
- Not specified
- PC 01
- Data entry incomplete/not performed/incorrect
- PC 05
- Inappropriate return to inventory
- PC 06
- Unit confirmation not done / incorrect
- PC 07
- Administrative check not done / incorrect
- PC 99
- Other
Errors related to Inventory Management (IM)
- IM 00
- Not specified
- IM 01
- Inventory audit not done / incorrect
- IM 02
- Product status not / incorrectly updated in computer-internal only (available / discard)
- IM 03
- Supplier recall / look back / trace back not addressed appropriately
- IM 04
- Product ordered incorrectly / not submitted to supplier
- IM 99
- Other
Errors related to Unit Storage (US)
- US 00
- Not specified
- US 01
- Incorrect storage of product in transfusion service
- US 02
- Expired product in stock
- US 03
- Inappropriate monitoring of storage device
- US 04
- Unit stored on incorrect shelf (Group / Autologous / Reserved)
- US 99
- Other
Errors related to Product Request (PR)
- PR 00
- Not specified
- PR 01
- Order for wrong patient
- PR 02
- Order incorrectly entered (online order entry)
- PR 03
- Special needs not indicated (e.g. Auto, CMV negative)
- PR 04
- Order not done / incorrect / incomplete
- PR 06
- Inappropriate order of a blood product
- PR 07
- Wrong product ordered (type)
- PR 99
- Other
Errors related to Sample Collection (SC)
- SC 00
- Not specified
- SC 01
- Sample labelled with wrong patient identification
- SC 02
- Not Labelled
- SC 03
- Wrong patient collected (not from intended patient)
- SC 04
- Collected in wrong tube type
- SC 05
- Sample NSQ (Non-Sufficient Quantity)
- SC 06
- Sample hemolysed
- SC 07
- Label incomplete /illegible for key patient identifiers (name, identification, birthdate)
- SC 08
- Sample collected unnecessarily
- SC 09
- Requisition arrives without samples
- SC 10
- Armband incorrect / not available
- SC 12
- Label incomplete / illegible for non-key patient identifiers
- SC 99
- Other
Errors related to Sample Handling (SH)
- SH 00
- Not specified
- SH 01
- Sample arrives without requisition
- SH 02
- Paperwork and sample ID do not match
- SH 03
- Patient ID incomplete/illegible on requisition
- SH 04
- No patient ID on requisition
- SH 05
- No phlebotomist / witness identification
- SH 06
- Sample arrives with incorrect type of requisition
- SH 07
- Patient information (other than ID) missing / incorrect on requisition
- SH 10
- Sample transport issues
- SH 11
- Incorrect test ordered / requested
- SH 12
- Test not ordered / requested
- SH 99
- Other
Errors related to Sample Receipt (SR)
- SR 00
- Not specified
- SR 01
- Sample accepted in error
- SR 02
- Historical review incorrect / not done
- SR 03
- Demographic review / entry incorrect / not done
- SR 04
- Sample incorrectly accessioned (test / product)
- SR 99
- Other
Errors related to Sample Testing (ST)
- ST 00
- Not Specified
- ST 02
- Appropriate sample check(s) not done / incorrect
- ST 03
- Computer warning overridden
- ST 04
- Data entry incomplete / not done
- ST 05
- Sample labelled with incorrect accession label
- ST 06
- Data entry incorrect
- ST 09
- Sample / test tubes mixed up / mislabelled
- ST 12
- Testing not done (ordered / confirmatory)
- ST 13
- Incorrect testing method chosen
- ST 14
- Testing performed incorrectly (did not follow SOP)
- ST 15
- Test result misinterpreted
- ST 16
- Inappropriate reagents used for testing
- ST 19
- Additional testing not performed
- ST 20
- Final check not done / incorrect
- ST 21
- Administrative check not done / incorrect (after the fact, record review, audit)
- ST 22
- Sample storage incorrect / inappropriate
- ST 98
- Quality control related (only to be used as 2nd event code)
- ST 99
- Other
Errors related to Request for Pick-up (RP)
- RP 00
- Not specified
- RP 01
- Request for pick-up on wrong patient
- RP 02
- Incorrect type / dose of product requested for pick-up
- RP 03
- Product requested prior to obtaining consent
- RP 04
- Product requested for pick-up, patient not ready / unavailable
- RP 05
- Product requested for pick-up IV not ready
- RP 06
- Request for pick-up incomplete (no Pt. Id, MRN / or product indicated)
- RP 10
- Product transport issues (internal)
- RP 99
- Other
Errors related to Product Selection (PS)
- PS 00
- Not specified
- PS 01
- Incorrect type / product / unit / dose selected
- PS 07
- Special needs not checked
- PS 09
- Special needs misinterpreted
- PS 99
- Other
Errors related to Unit Manipulation (UM)
- UM 00
- Not specified
- UM 01
- Data entry incomplete / incorrect
- UM 04
- Final check not done / incorrect
- UM 05
- Labelling incorrect
- UM 09
- Special processing not done / incorrectly done
- UM 10
- Administrative check not done / incorrect
- UM 99
- Other
Errors related to Unit Issue (UI)
- UI 00
- Not specified
- UI 01
- Data entry incomplete / incorrect
- UI 04
- Product issued to wrong patient
- UI 06
- LIS warning overridden (in error or outside SOP)
- UI 09
- Not checking/incorrect checking of unit and/or patient information)
- UI 11
- Product delivered to the incorrect location by the Transfusion Service (physical delivery)
- UI 19
- Wrong type / dose of product issued to right patient
- UI 21
- Receipt verification not done (pneumatic tube issue)
- UI 22
- Issue approval not obtained / documented
- UI 99
- Other
Errors related to Unit Transfusion (UT)
- UT 00
- Not specified
- UT 01
- Administered product to wrong patient
- UT 02
- Administered wrong type / dose of product to patient
- UT 04
- Incorrect storage of product on floor
- UT 05
- Bedside check not done / incorrect (unit/patient info)
- UT 06
- Administered product with incompatible IV fluid
- UT 08
- Wrong unit / product chosen from satellite refrigerator
- UT 11
- Appropriate monitoring of patient not done
- UT 12
- Floor/clinic did not check for existing units in their area
- UT 13
- Labelling incorrect
- UT 22
- Order / consent check not done / incorrect
- UT 23
- Documentation not complete / incorrect
- UT 24
- Documentation not returned
- UT 25
- Guidelines for infusion time not followed
- UT 26
- Transfusion reaction protocol not followed
- UT 27
- Monitoring of satellite fridge not done / incorrect
- UT 28
- Inappropriate preparation of product
- UT 29
- Product storage tracking incorrect / not done
- UT 99
- Other
Miscellaneous errors (MS)
- MS 00
- Not specified
- MS 03
- Patient registration incomplete/incorrect
- MS 04
- Equipment / computer failure
- MS 05
- Equipment QC not done/documented
- MS 06
- Reagent/material event
- MS 07
- Patient incurred event
- MS 99
- Other