The Centre for Communicable Diseases and Infection Control (CCDIC) of the Public Health Agency of Canada (PHAC) is pleased to release the Transfusion-Transmitted Injuries Surveillance System (TTISS) Summary Report, 2016-2020. This summary report presents transfusion-transmitted injury surveillance data submitted by Canadian hospitals participating in the TTISS network.
PHAC established TTISS to collect non-nominal data on adverse reactions to blood transfusions. Canadian hospitals across the country that provide transfusion services participate in this surveillance system.
CCDIC, in partnership with participating provinces and territories, is responsible for the collection, management, and analysis of the data as well as the production of reports to support evidence-based public health decisions. The overarching goal of TTISS is to improve blood transfusion safety and patient safety in Canadian hospitals.
Transfusion-Transmitted Injuries Surveillance System
Types of blood products
BCs
Blood components
PDs
Plasma derivatives
Executive summary
Since 2001, the Transfusion-Transmitted Injuries Surveillance System (TTISS) has been collecting data on reported adverse transfusion reactions (ATRs) in Canada that are due to the transfusion of blood components and plasma derivatives. As of 2007, all provinces and territories, with the exception of Nunavut, provide data to TTISS. Currently, the TTISS network covers over 95% of total blood transfusion activities in Canada.
This report presents the number of ATRs related to the transfusion of blood components and plasma derivatives. In addition, ATR rates are reported for the transfusion of blood components (BCs) only. Rates for the transfusion of plasma derivatives (PDs) are not shown due to the non-availability of denominator data.
The range of ATRs reported include transfusion-associated circulatory overload (TACO), severe anaphylactic or anaphylactoid reaction (SAAR), hypotensive reaction (HYPT), acute and delayed haemolytic reaction (AHR and DHR), transfusion-related acute lung injury (TRALI), transfusion-associated dyspnea (TAD), intravenous immune globulin headache or hemolysis (IVIG-HD), aseptic meningitis (ASPT), bacterial infections (BACT), incompatible transfusion (INCMP), and unusual reactions of clinical significance (Others).
Sites reported a total of 4,334 ATRs to TTISS during the five-year period of 2016 to 2020. 61.3% (2,658) of cases were due to transfusion of blood components and 38.7% (1,676) were due to transfusion of plasma derivatives. TACO, among transfusion of blood components, and IVIG-HD, among transfusion of plasma derivatives, were the most commonly reported ATRs, representing 43.7% (1,161) and 40.9% (685), respectively.
In terms of imputability (definite, probably, possible), 11.2% of ATRs were definitely imputable to transfusion. 88.8% of ATRs were probably or possibly imputable to transfusion.
The severity of an ATR is defined by the level of medical care or intervention that the patient required. 68.8% of ATRS were non-severe, 25.2% were severe, and 5.0% that resulted in life-threatening injuries, including four deaths.
Of the total ATRs (n=4,334) with reported outcomes, 84.0% resulted in minimal or no harm to recipients, whereas major or long-term sequelae and deaths accounted for 2.7% and 1.4% respectively. TACO and TRALI were the leading causes of transfusion-related deaths.
Most deaths occurred in older patients (median age=72 years), so they may also be attributable to other causes. This suggests that the actual number of ATR-related deaths may be lower than the number of reported deaths. Further research is required to clarify the relationship between transfusion and death.
Introduction
Established as a pilot system in 2001, the Transfusion-Transmitted Injuries Surveillance System (TTISS) has since been reporting adverse transfusion reactions (ATRs), which are defined as undesirable and unintentional incidents that occur during or after the administration of blood, blood components, or plasma derivatives. TTISS collects non-nominal data on ATRs after the transfusion of blood components (such as red blood cells, granulocytes, platelets, plasma, and cryoprecipitate) and plasma derivatives (such as albumin, immune globulin, and coagulation factors). ATRs are voluntarily reportable to TTISS by a national network of hospitals providing transfusion services across all provinces and territories except Nunavut.
The TTISS National Working Group (NWG-TTISS) is comprised of representatives from each province and territory, two blood manufacturers (Canadian Blood Services and Héma-Québec), and ex-officio representation from Health Canada's Marketed Health Products Directorate (MHPD) and Biologics and Genetic Therapies Directorate (BGTD). The NWG-TTISS advises TTISS on its operation and direction as a national surveillance system. The objective of TTISS is to identify and estimate risks and trends of ATRs in order to improve patient safety in Canadian hospitals. This report summarizes the findings of TTISS' 2016-2020 national data.
Methods
a) Data collection and processing
All participating hospitals in the TTISS network are providing data to the Public Health Agency of Canada (PHAC), covering more than 95% of transfusions in Canadian hospitals.
A set of standardized case definitions and a standardized reporting formFootnote 1 are used to record data and are transferred electronically to the Canadian Network for Public Health Intelligence (CNPHI), which is a centralized web-based systemFootnote 2. Currently, ten of the eleven participating sites enter their data into CNPHI, and one site electronically submits their data directly to PHAC. Generally, PHAC receives annual data with a time lag of six months (for example, 2020 data are received the following year by July). Data is reviewed for quality assurance and requests for verifications of any discrepancies are addressed with each site separately. After validations, some ATRs may be reclassified or excluded to comply with standardized case definitions. All data are then combined to form a national TTISS database for analysis.
ATRs are categorised based on imputability (the likelihood of being related to transfusion) and whether this relationship is definite, probable, or possible. The relationship could also be ruled out, doubtful, or undetermined, in which case the ATR is referred to as "non-transfusion-related'. Only transfusion-related ATRs are considered for analysis. The severity (the level of intervention required to respond to the adverse event or the disability sustained) and outcome (whether the recipient sustained any physiological or physical consequence, such as damage or impairment of a bodily function) are also recorded. The outcome varies from minor to major or long-term sequelae, including death. In cases of death, further investigation is conducted to determine the ATR's imputability and to establish whether the event is definitely, probably, possibly, or doubtfully related to the transfusion, or whether imputability is undetermined or to be ruled out (Annex A).
ATRs collected in TTISS include severe anaphylactic or anaphylactoid reaction (SAAR), transfusion-associated circulatory overload (TACO), transfusion-related acute lung injury (TRALI) and possible TRALI, transfusion-associated dyspnea (TAD), hypotensive reaction (HYPT), intravenous immune globulin headache (IVIG-HD), acute and delayed haemolytic reaction (AHR and DHR), aseptic meningitis (ASPT), bacterial infection (BACT), and incompatible transfusion (INCMP). In addition to the above ATRs, when the recipient experiences any other type of adverse reaction, e.g., severe electrolyte imbalance, atypical pain syndrome, etc., these are classified as "Other". Minor allergic reactions, febrile non-haemolytic reactions (FNHR), and delayed serological reactions (DSR) are not considered in the TTISS analysis. When adverse reactions are associated with both blood components and plasma derivatives, only data from the first transfusion is included in the analysis.
b) Denominator data
The number of units of blood components transfused annually in hospitals within the TTISS network is used as the denominator to calculate rates per 100,000 units of blood components transfused.
c) Statistical analysis
Descriptive analyses were performed using the SAS EG 5.1 software. Counts and proportions of specific ATRs are calculated for all transfusions, transfusions of blood components, and transfusions of plasma derivatives that occurred during 2016-2020. Rates of specific ATRs and death are calculated per 100,000 units of blood components transfused.
Results
The TTISS results are presented in five sections, each including the overall results, and where feasible, separate results for blood components and plasma derivatives:
Counts and proportions of ATRs, excluding those with doubtful, ruled out, or undetermined imputability, or where this information is missing
ATR rates associated with the transfusion of blood components
Counts and proportions of ATRs based on the imputability of the adverse reaction
Counts and proportions of ATRs by severity
Counts and proportions of ATRs by outcome
1. Adverse transfusion reactions (ATRs)
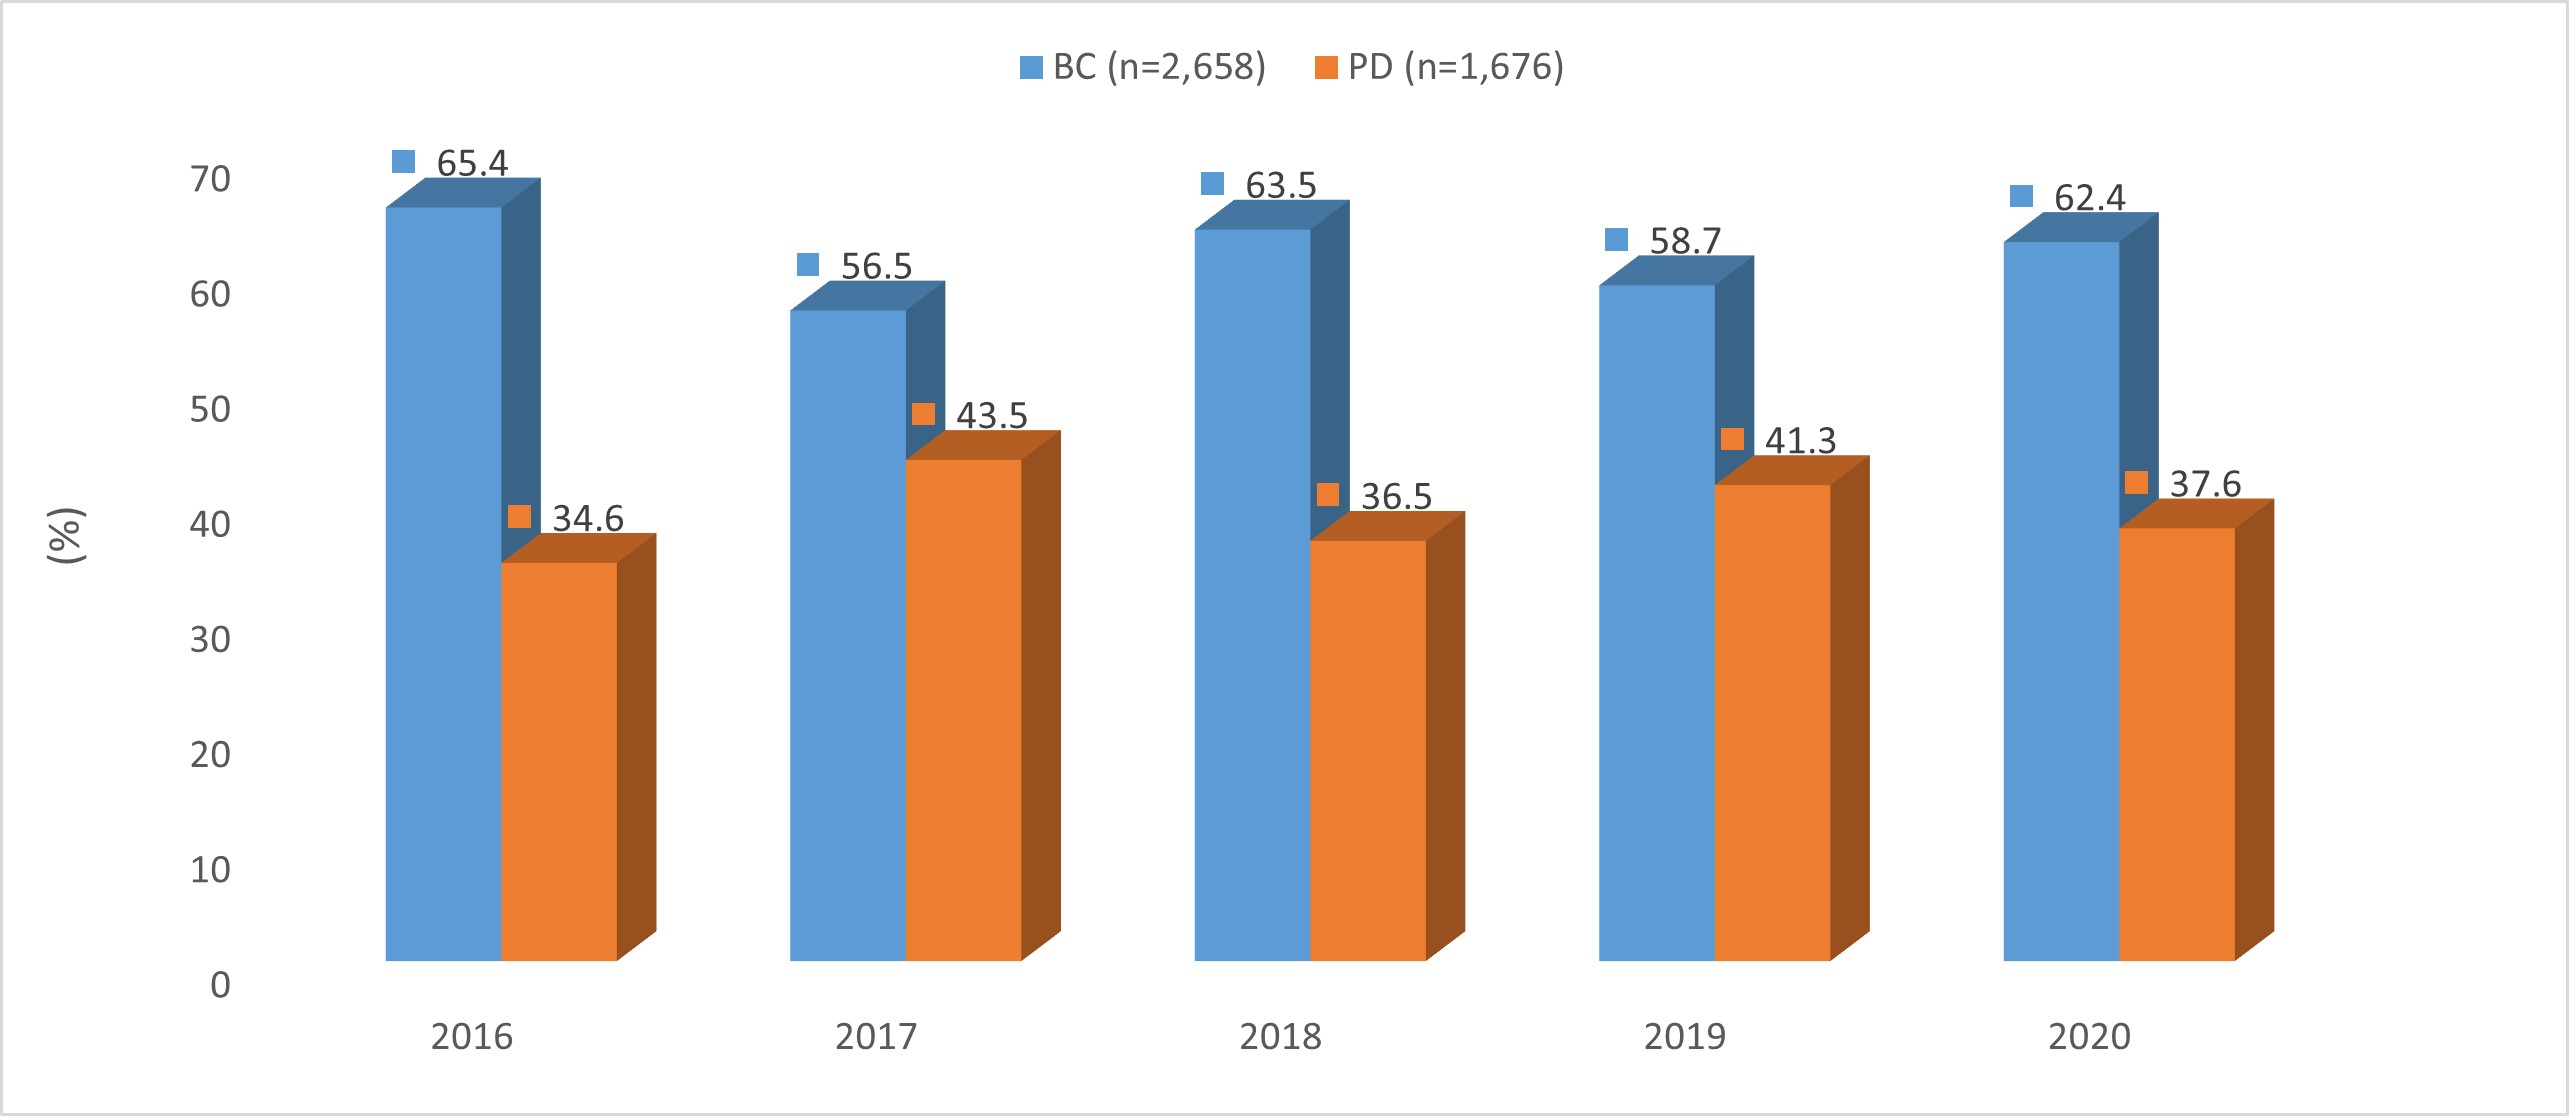
Annex B provides the annual numbers of ATRs for the five-year period. Figure A presents the annual percentages of ATRs arising from the transfusion of blood components compared to from that of plasma derivatives. Of the total ATRs reported (n=4,334), nearly two-thirds (61.3%, n=2,658/4,334) are due to transfusion of blood components and a little more than one-third (38.7%, n=1,676/4,334) are due to transfusion of plasma derivatives. The annual proportions of ATRs remained consistent, with small variations in the range of 61.3 (± 4.8%) when due to transfusion of blood components and 38.7 (± 4.8%) when due to transfusion of plasma derivatives.
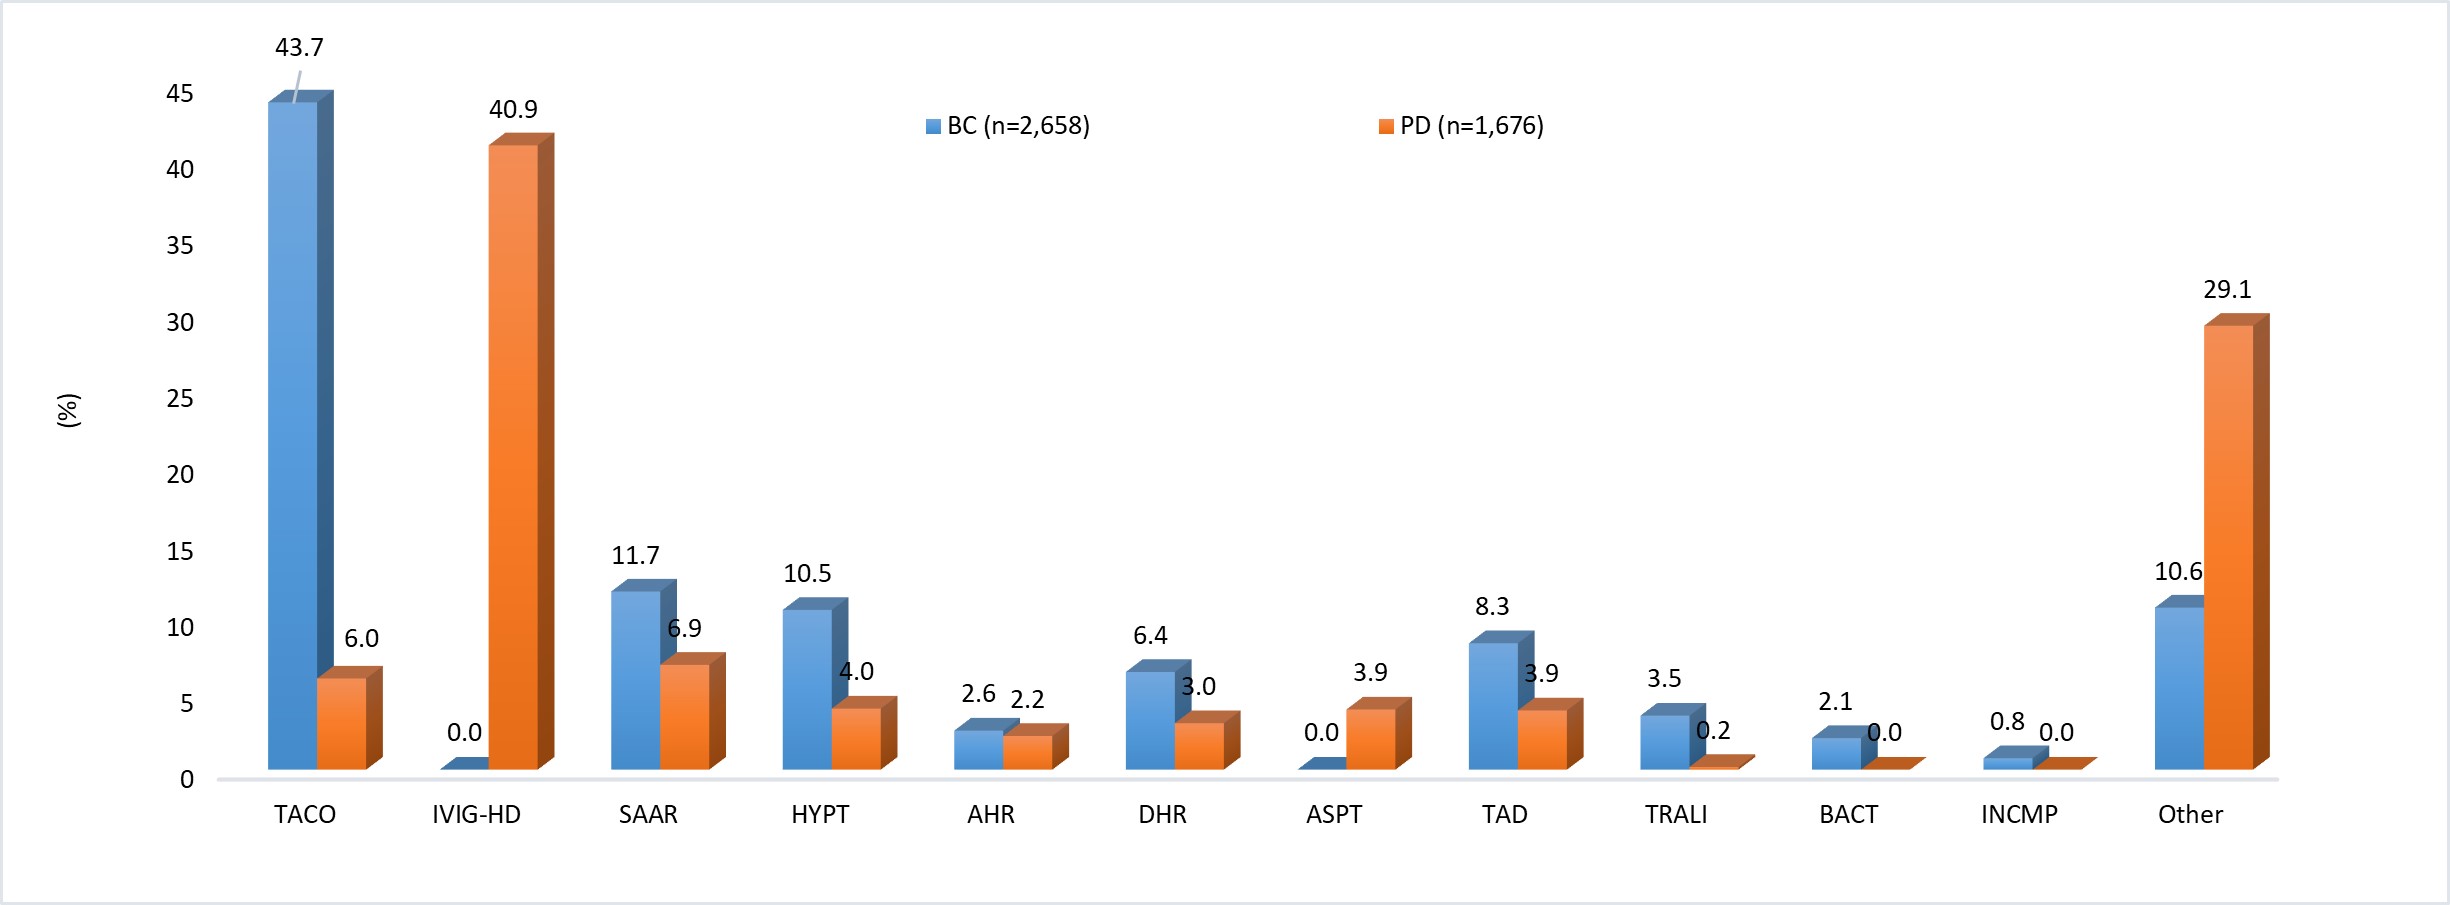
Figure 1B presents the distribution of types of ATRs from transfusion of blood components and transfusion of plasma derivatives. Among ATRs due to transfusion of blood components, TACO is the most reported ATR (43.7%, n=1,161/2,658), followed by SAAR (11.7%, n=293/2,658) and HYPT (10.5%, n=278/2,658). Among ATRs due to transfusion of plasma derivatives, IVIG headache is the most reported (40.9%, n=685/1,676), followed by SAAR (6.9%, 115/1,676).
Figure 1A: ATRs (%) from transfusion of blood components and of plasma derivatives by yearFigure 1A - Text description
Line chart depicting data below.
Transfusion of blood components (%)
Transfusion of plasma derivatives (%)
2016
65.4
34.6
2017
56.5
43.5
2018
63.5
36.5
2019
58.7
41.3
2020
62.4
37.6
Figure 1B: ATRs (%) from transfusion of blood components and of plasma derivatives by typeFigure 1B - Text description
Line chart depicting data below.
Transfusion of blood components (%)
Transfusion of plasma derivatives (%)
TACO
43.7
6.0
IVIG-HD
n/a
40.9
SAAR
11.7
6.9
HYPT
10.5
4.0
AHR
2.6
2.2
DHR
6.4
3.0
ASPT
n/a
3.9
TAD
8.3
3.9
TRALI
3.5
0.2
BACT
2.1
n/a
INCMP
0.8
n/a
Other
10.6
29.1
2. ATR rates
ATR rates are calculated by considering the number of reported ATRs that are due to transfusion of blood components as the numerator (Annex B) and the number of units of blood components transfused as denominator (Annex C), represented per 100,000 units of blood components transfused. TACO consistently had the highest rates with some annual variation. ATRs including SAAR, HYPT, TAD, and TRALI had much lower rates with annual rates under 6% each. The ATR rates for BACT and INCMP are very low.
Table 2: ATR rates by type per year/100,000 units of blood components transfused
ATRs
2016
2017
2018
2019
2020
Total
TACO
19.0
21.1
19.0
13.6
22.8
19.1
SAAR
5.9
4.4
4.6
5.3
5.3
5.1
HYPT
4.8
4.0
5.4
2.6
6.1
4.6
AHR
1.9
1.0
1.2
0.6
0.9
1.1
DHR
3.0
1.9
3.1
2.2
3.8
2.8
TAD
4.0
2.9
3.9
3.5
3.7
3.6
TRALI
1.5
1.5
1.6
1.1
2.0
1.5
BACT
1.1
0.5
0.9
1.2
0.9
0.9
INCMP
0.4
0.9
0.2
0.1
0.0
0.3
Other
5.7
5.5
3.9
4.2
3.9
4.6
Total
47.3
43.9
43.8
34.3
49.3
43.7
3. ATRs by imputability
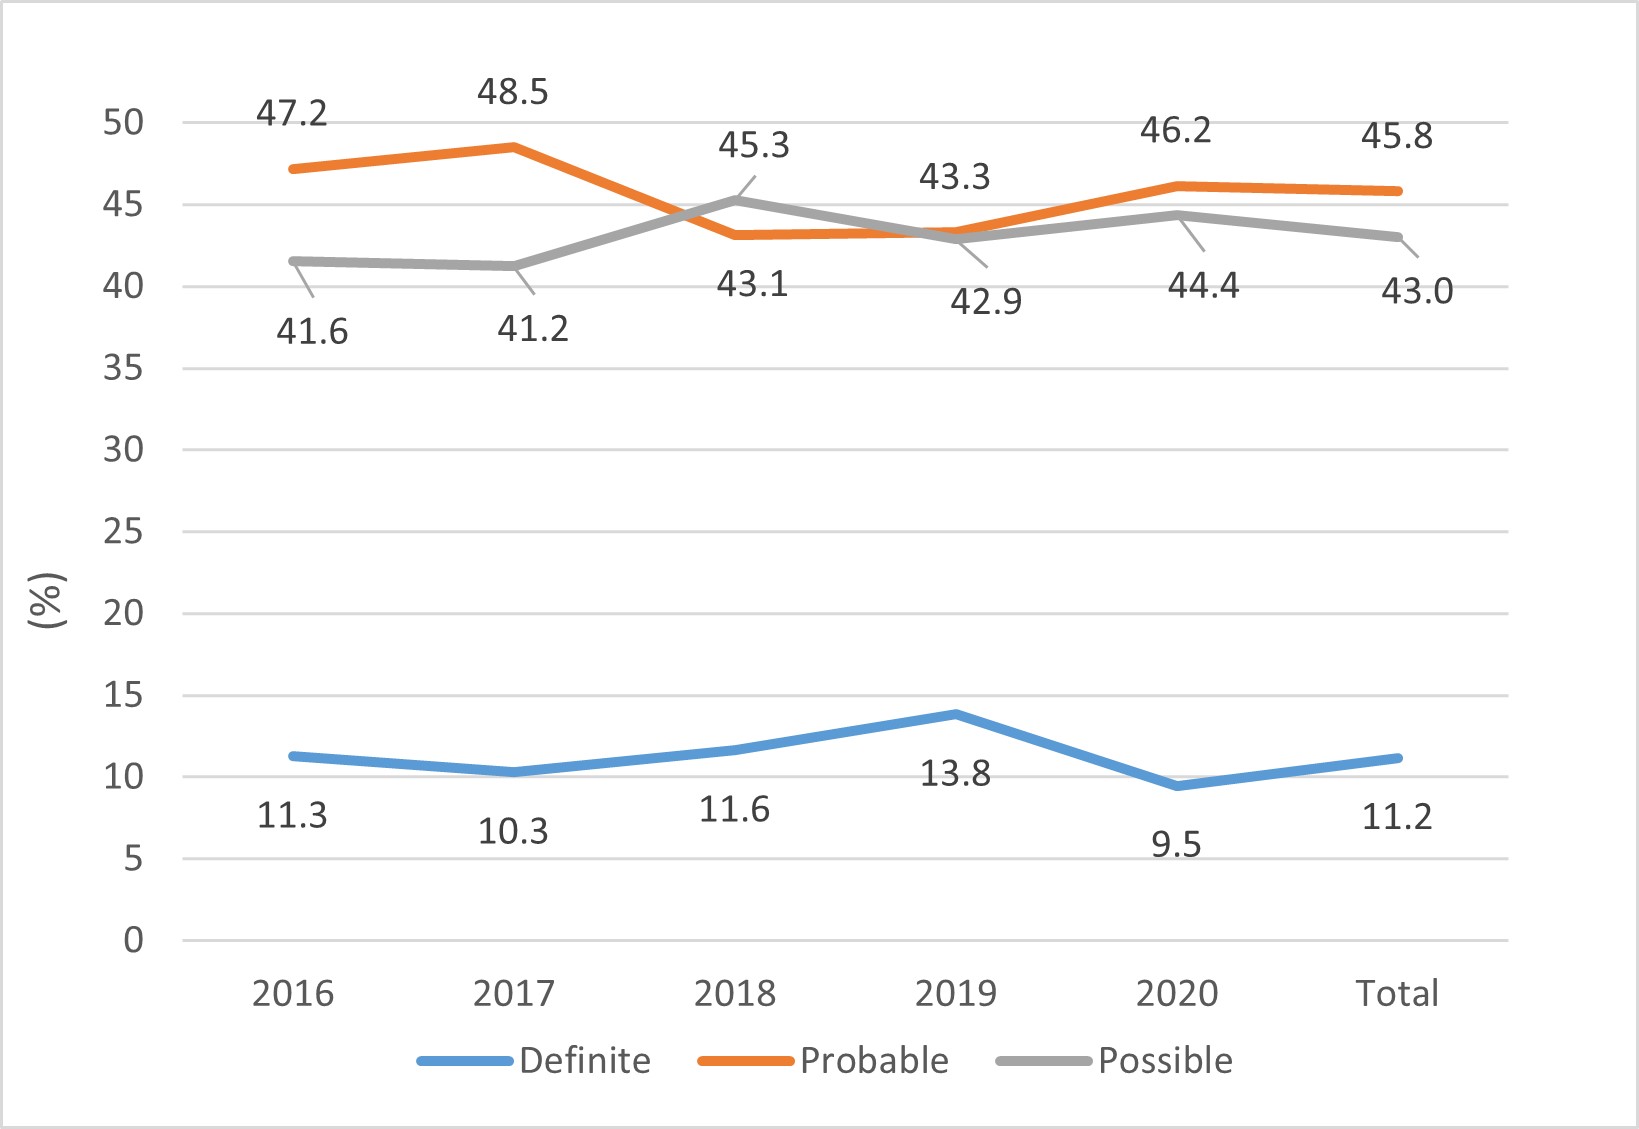
Annex A provides the definition for each imputability level and Annex D provides the numbers of ATRs in each of these levels. Table 3A to 3C displays, sorted by imputability levels, the number of ATR cases due to all transfusions, the transfusion of blood components, and the transfusion of plasma derivatives. Figure 3A exhibits the data concerning all transfusions and Figure 3B exhibits the data for transfusion of blood components and of plasma derivatives separately. Overall, one in ten (11.2%, n=484/4,334) ATRs was definitely linked to transfusions, and nine in ten (88.8%, n=3,850/4,334) were probably or possibly linked to transfusions. Whether in terms of all transfusions, just transfusions of blood components, or just transfusions of plasma derivatives, the number of ATR cases of in each imputability level remained consistent over time with small annual variations (Figure 3A, Figure 3B).
Table 3A: ATRs (%) from all transfusions by year and imputability
Year
Definite
Probable
Possible
(n)
2016
11.3
47.2
41.6
888
2017
10.3
48.5
41.2
963
2018
11.6
43.1
45.3
877
2019
13.8
43.3
42.9
709
2020
9.5
46.2
44.4
897
Total
11.2
45.8
43.0
4,334
Table 3B: ATRs (%) from transfusions of blood components by year and imputability
Year
Definite
Probable
Possible
(n)
2016
12.2
42.7
45.1
581
2017
9.6
43.4
47.1
544
2018
11.5
38.8
49.7
557
2019
14.6
38.8
46.6
416
2020
10.9
40.4
48.8
560
Total
11.6
40.9
47.5
2,658
Table 3C: ATRs (%) from transfusions of plasma derivatives by year and imputability
Year
Definite
Probable
Possible
(n)
2016
9.4
55.7
34.9
307
2017
11.2
55.1
33.7
419
2018
11.9
50.6
37.5
320
2019
13.3
49.0
37.8
293
2020
7.1
55.8
37.1
337
Total
10.5
53.4
36.0
1,676
Figure 3A: ATRs (%) from all transfusions by year and imputabilityFigure 3A - Text description
Tables 3D to 3F present the imputability data of ATRs for all transfusions, transfusions of blood components, and transfusions of plasma derivatives for the five-year period combined. In terms of all transfusions, TACO and IVIG-HD are the most reported ATRs, representing 29.1% (n=1,261/4,334) and 15.8% (n=685/4,334) of the total. However, they have the smallest number of definitely imputable cases: 8.2% (n=104/1,261) and 9.5% (n=65/685). On the other hand, among the least reported ATRs, INCMP, AHR, and DHR represent 0.5% (n=20/4,334), 2.4% (n=105/4,334), and 5.1% (n=221/4,334) of total cases, respectively. However, a majority of these cases are definitely related to transfusion: 65.0% (n=13/20), 39.0% (n=41/105), and 46.6% (n=103/221), respectively. The ASPT and SAAR cases show almost the same relationships with definite cases making up 16.7% (n=11/66) and 18.4% (n=78/425) of their totals. The ratio between case numbers and imputability in ATR cases due to transfusions of only blood components show a similar pattern with small variations over time.
Among the ATRs associated with the transfusion of plasma derivatives, nearly half of the DHR cases (47.1%, n=24/51), about one-third of the AHR cases (35.1%, n=13/37), and nearly one-fourth of the SAAR cases (23.5%, n=27/115) were considered definitely related to transfusions. TACO and IVIG-HD cases that are definitely linked to transfusions are at, respectively, 3.0% (n=3/100) and 9.5% (n=65/685) of their totals. One TRALI case is definitely associated with the transfusion and the other two cases are probably and possibly linked to the transfusions.
Table 3D: ATRs (%) from all transfusions by imputability
ATRs
Definite
Probable
Possible
(n)
TACO
8.2
46.2
45.5
1,261
IVIG-HD
9.5
64.2
26.3
685
SAAR
18.4
53.6
28.0
425
HYPT
3.8
34.8
61.4
345
AHR
39.0
37.1
23.8
105
DHR
46.6
27.6
25.8
221
ASPT
16.7
51.5
31.8
66
TAD
1.1
31.2
67.7
285
TRALI
9.3
29.9
60.8
97
BACT
10.9
14.5
74.5
55
INCMP
65.0
25.0
10.0
20
Other
4.9
45.4
49.7
769
Total
11.2
45.8
43.0
4,334
Table 3E: ATRs (%) from transfusions of blood components by imputability
ATRs
Definite
Probable
Possible
(n)
TACO
8.7
46.1
45.2
1,161
SAAR
16.5
55.8
27.7
310
HYPT
3.6
32.7
63.7
278
AHR
41.2
30.9
27.9
68
DHR
46.5
28.8
24.7
170
TAD
1.4
32.3
66.4
220
TRALI
8.5
29.8
61.7
94
BACT
10.9
14.5
74.5
55
INCMP
65.0
25.0
10.0
20
Other
3.2
37.6
59.2
282
Total
11.6
40.9
47.5
2,658
Table 3F: ATRs (%) from transfusions of plasma derivatives by imputability
ATRs
Definite
Probable
Possible
(n)
TACO
3.0
48.0
49.0
100
IVIG-HD
9.5
64.2
26.3
685
SAAR
23.5
47.8
28.7
115
HYPT
4.5
43.3
52.2
67
AHR
35.1
48.6
16.2
37
DHR
47.1
23.5
29.4
51
ASPT
16.7
51.5
31.8
66
TAD
0.0
27.7
72.3
65
TRALI
33.3
33.3
33.3
3
Other
6.0
49.9
44.1
487
Total
10.5
53.6
35.9
1,676
4. Severity of ATRs
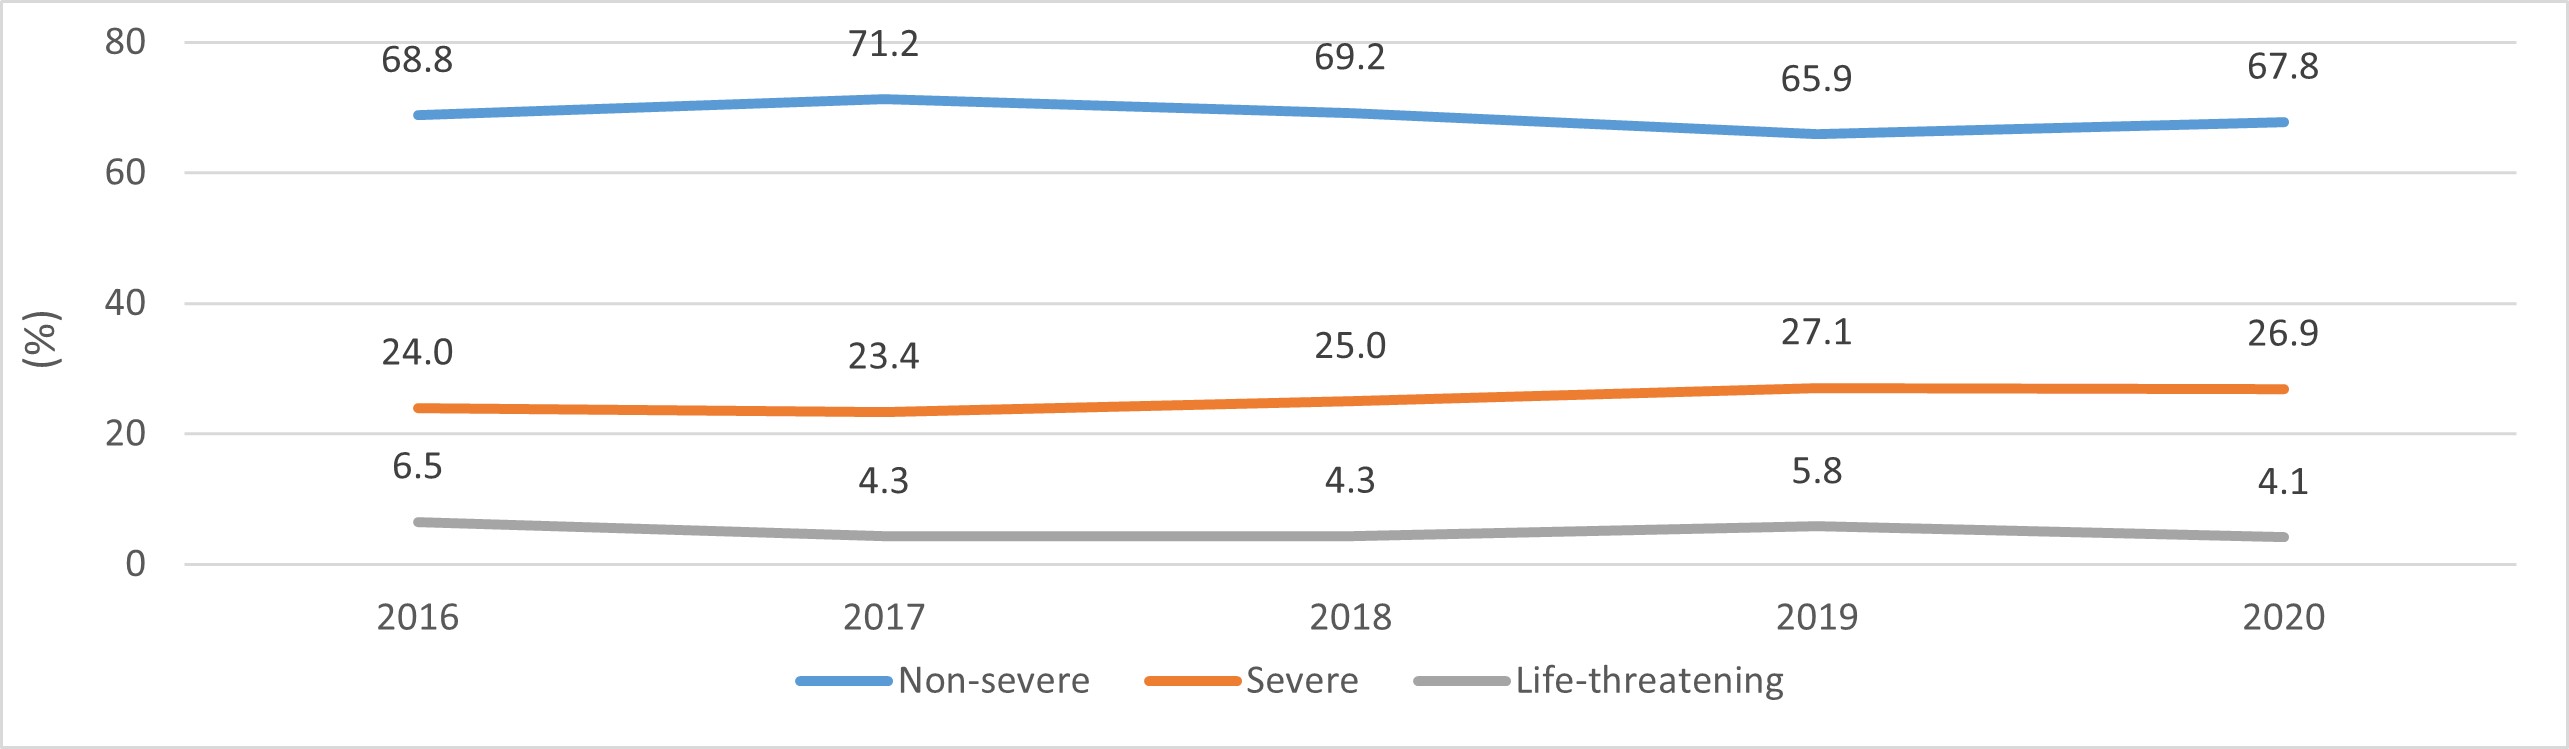
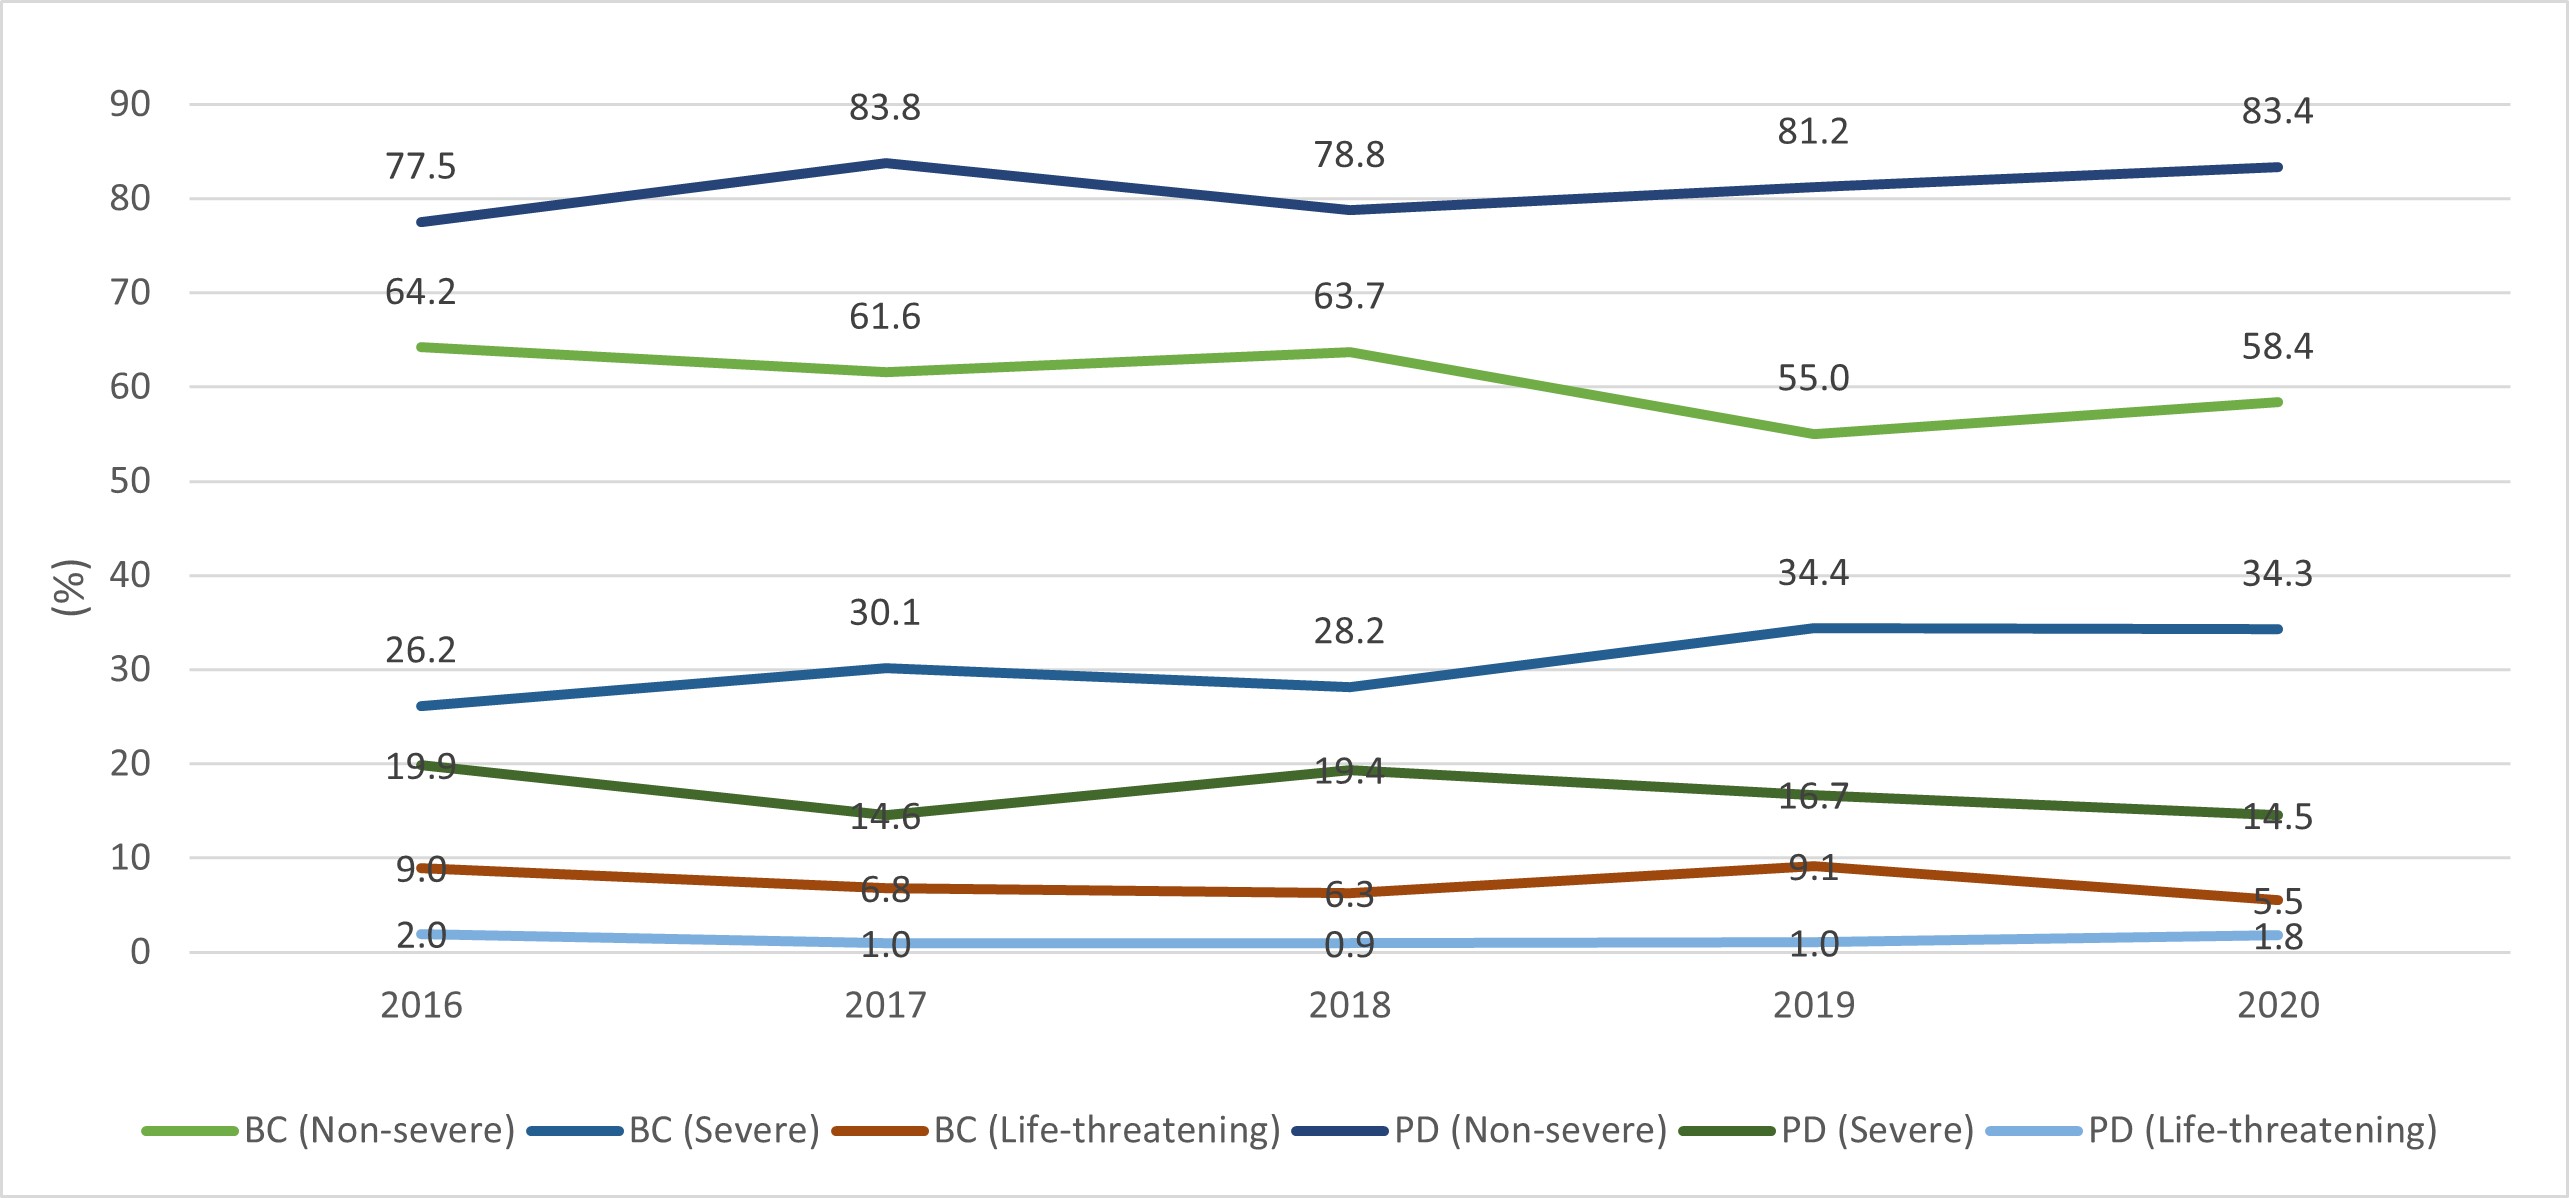
Annex A provides the definitions of each severity level and Annex E provides the number of yearly reported ATRs sorted by severity level. Tables 4A to 4C list the annual proportions of ATRs by severity levels. Figure 4A exhibits this data for all transfusions, and Figure 4B exhibits the data for transfusions of blood components and of plasma derivatives separately. Overall, out of the ATRs reported during 2016-2020, two-thirds (68.7%, n=2979/4,334) were non-severe, one-quarter (25.1%, n=1,090/4334) was severe, and 5.0% (n=215/4,334) were recorded as having induced life-threatening injuries. When sorted by severity levels, the ATR cases exhibit a uniform trend with small annual variations (Figure 4A).
Similarly, the distribution of cases according to severity levels in Figure 4B is also constant with small annual variations. The number of ATRs deemed to be non-severe are consistently lower for transfusion of blood components than for that of plasma derivatives, whereas the number of ATRs deemed to be severe and life-threatening injuries are consistently higher for transfusion of blood components than for that of plasma derivatives.
Table 4A: ATRs (%) from all transfusions by severity and year
Year
Non-severe
Severe
Life-threatening
Undetermined
(n)
2016
68.8
24.0
6.5
0.7
888
2017
71.2
23.4
4.3
1.1
963
2018
69.2
25.0
4.3
1.5
877
2019
65.9
27.1
5.8
1.3
709
2020
67.8
26.9
4.1
1.2
897
Total
68.7
25.1
5.0
1.2
4,334
Table 4B: ATRs (%) from transfusions of blood components by severity and year
Year
Non-severe
Severe
Life-threatening
Undetermined
(n)
2016
64.2
26.2
9.0
0.7
581
2017
61.6
30.1
6.8
1.5
544
2018
63.7
28.2
6.3
1.8
557
2019
55.0
34.4
9.1
1.4
416
2020
58.4
34.3
5.5
1.8
560
Total
60.9
30.4
7.4
1.4
2,658
Table 4C: ATRs (%) from transfusions of plasma derivatives by severity and year
Year
Non-severe
Severe
Life-threatening
Undetermined
(n)
2016
77.5
19.9
2.0
0.7
307
2017
83.8
14.6
1.0
0.7
419
2018
78.8
19.4
0.9
0.9
320
2019
81.2
16.7
1.0
1.0
293
2020
83.4
14.5
1.8
0.3
337
Total
81.1
16.8
1.3
0.7
1,676
Figure 4A: ATRs (%) from all transfusions by severity and yearFigure 4A - Text description
Tables 4D to 4F details the percentages of cases sorted by types of ATR and by severity level for the five-year combined period. Among the ATRs related to the transfusion of blood components, TACO, SAAR, and HYPT make up a large portion of total cases. However, few cases of these ATR types were of grade 3 severity and accounted for 5.6%, 15.2%, and 5.0% of each of their totals, respectively. On the other hand, TRALI, BACT, and INCMP make up a smaller portion of the total ATRs but have higher proportions of grade 3 severity cases (35.1%, 18.2%, and 10.0% of each of their total case numbers, respectively).
Table 4D: ATR types (%) from all transfusions by severity
ATRs
Non-severe
Severe
Life-threatening
Undetermined
(n)
TACO
62.3
30.9
5.4
1.4
1,261
IVIG-HD
94.0
6.0
0.0
0.0.
685
SAAR
33.4
52.2
13.6
0.7
425
HYPT
77.4
17.4
4.1
1.2
345
AHR
45.7
50.5
2.9
1.0
105
DHR
64.3
29.4
3.2
3.2
221
ASPT
63.6
34.8
1.5
0.0
66
TAD
78.9
17.9
1.8
1.4
28
TRALI
13.4
50.5
34.0
2.1
97
BACT
38.2
40.0
18.2
3.6
55
INCMP
50.0
35.0
10.0
5.0
20
Other
83.2
13.9
1.8
1.0
769
Total
68.7
25.1
5.0
1.2
4,334
Table 4E: ATR types (%) from transfusions of blood components by severity
ATRs
Non-severe
Severe
Life-threatening
Undetermined
(n)
TACO
61.8
31.3
5.6
1.4
1,161
SAAR
35.5
48.7
15.2
0.6
310
HYPT
75.5
18.0
5.0
1.4
278
AHR
47.1
48.5
4.4
0.0
68
DHR
65.9
27.6
4.1
2.4
170
TAD
79.5
17.3
1.8
1.4
220
TRALI
12.8
50.0
35.1
2.1
94
BACT
38.2
40.0
18.2
3.6
55
INCMP
50.0
35.0
10.0
5.0
20
Other
78.0
17.7
2.8
1.4
282
Total
60.9
30.4
7.3
1.4
2,658
Table 4F: ATR types (%) from transfusions of plasma derivatives by severity
ATRs
Non-severe
Severe
Life-threatening
Undetermined
(n)
TACO
68.0
27.0
3.0
2.0
100
IVIG-HD
94.0
6.0
0.0
0.0
685
SAAR
27.8
61.7
9.6
0.9
115
HYPT
85.1
14.9
0.0
0.0
67
AHR
43.2
54.1
0.0.
2.7
37
DHR
58.8
35.3
0.0
5.9
51
ASPT
63.6
34.8
1.5
0.0
66
TAD
76.9
20.0
1.5
1.5
65
TRALI
33.3
66.7
0.0
0.0
3
Other
86.2
11.7
1.2
0.8
487
Total
81.1
16.8
1.3
0.7
1,676
4.1 Grade 2 (severe) ATRs
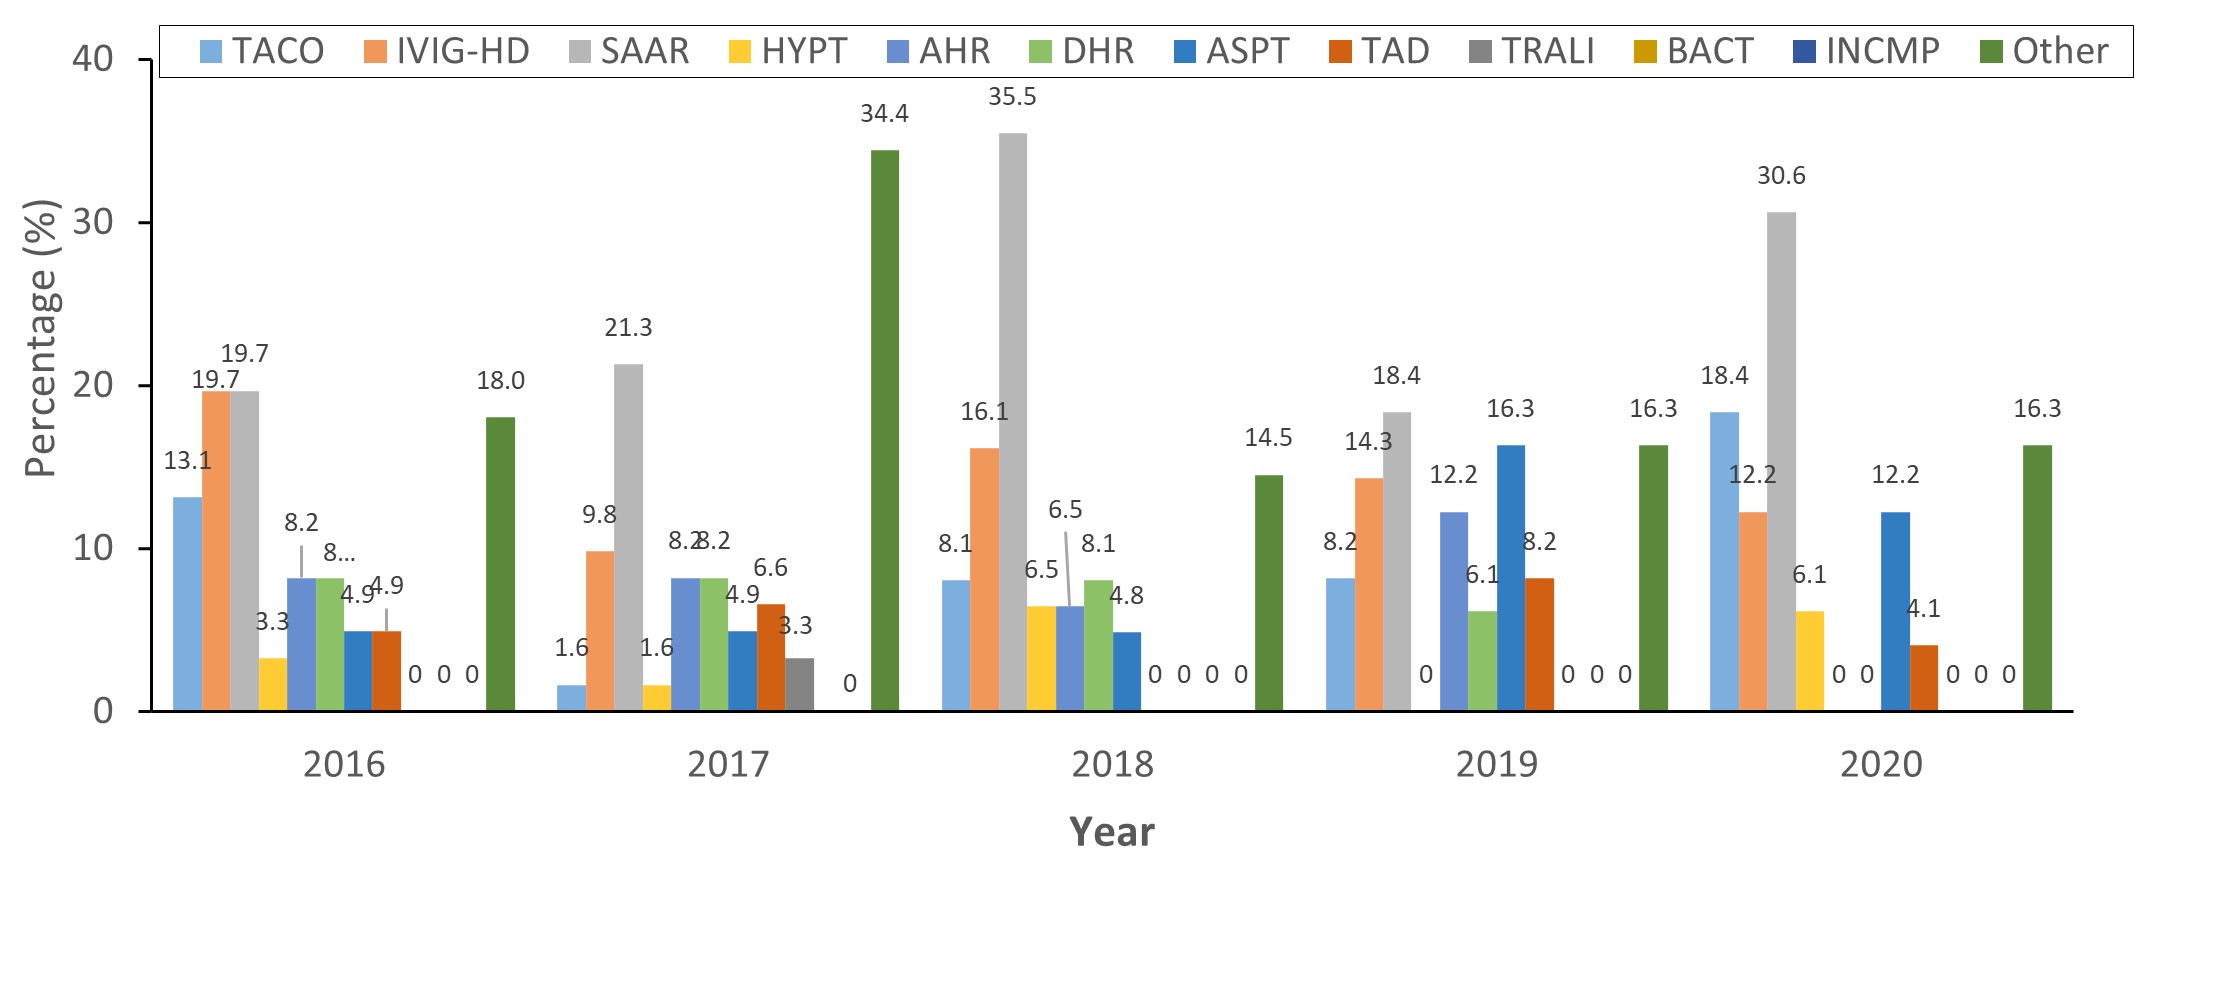
Tables 4.1A and B provide the annual numbers of grade 2 ATRs, sorted by ATR and transfusion types. Figure 4.1A and Figure 4.1B exhibits, respectively, the annual trends of grade 2 ATRs caused by transfusions of blood components and by transfusions of plasma derivatives. Of the total number of grade 2 ATR cases (n=1,090), approximately three-quarters (74.1%, n=808/1,090) were due to transfusion of blood components and one-fourth (25.9%, n=282/1,090) was due to transfusion of plasma derivatives. In terms of those resulting from transfusions of blood components, the total numbers of grade 2 ATR cases trended upwards for the first two years (152 in 2016 to 164 in 2017), then downwards for the next two years (157 in 2018 to 143 in 2019), followed by another upward trend to 192 cases in 2020. These numbers are relatively consistent and have small deviations within each ATR type. TACO, followed by SAAR, consistently make up most of the total number regarding the transfusion of blood components (Figure 4.1A). In terms of grade 2 ATRs that are due to the transfusion of plasma derivatives, the numbers were stable for the first three years (61 in 2016 to 62 in 2018) and then declined to 49 cases in 2019 and 2020 (Table 4.1). SAAR and IVIG headache caused grade 2 ATRs more frequently compared to other reaction types (Figure 4.1B).
Table 4.1A: ATR types (%) of grade 2 severity from transfusions of blood components
ATRs
2016
2017
2018
2019
2020
Total
TACO
44.7
50.0
40.1
39.9
48.4
44.9
SAAR
15.8
17.7
16.6
25.9
18.2
18.7
HYPT
7.9
4.9
10.8
2.8
4.7
6.2
AHR
6.6
3.0
5.1
2.8
3.1
4.1
DHR
7.9
2.4
4.5
8.4
6.3
5.8
TAD
2.6
1.8
6.4
8.4
4.7
4.7
TRALI
3.9
5.5
7.0
3.5
8.3
5.8
BACT
2.6
1.2
2.5
4.2
3.1
2.7
INCMP
2.0
2.4
0.0
0.0
0.0
0.9
Other
5.9
11.0
7.0
4.2
3.1
6.2
(n)
152
164
157
143
192
808
Table 4.1B: ATR types (%) of grade 2 severity from transfusions of plasma derivatives
ATRs
2016
2017
2018
2019
2020
Total
TACO
13.1
1.6
8.1
8.2
18.4
9.6
IVIG-HD
19.7
9.8
16.1
14.3
12.2
14.5
SAAR
19.7
21.3
35.5
18.4
30.6
25.2
HYPT
3.3
1.6
6.5
0.0
6.1
3.5
AHR
8.2
8.2
6.5
6.1
0.0
7.1
DHR
8.2
8.2
8.1
6.1
0.0
6.4
ASPT
4.9
4.9
4.8
16.3
12.2
8.2
TAD
4.9
6.6
0.0
8.2
4.1
4.6
TRALI
0.0
3.3
0.0
0.0
0.0
0.7
Other
18.0
34.4
14.5
16.3
16.3
20.2
(n)
61
61
62
49
49
282
Figure 4.1A: ATR types (%) of grade 2 severity from transfusions of blood componentsFigure 4.1A - Text description
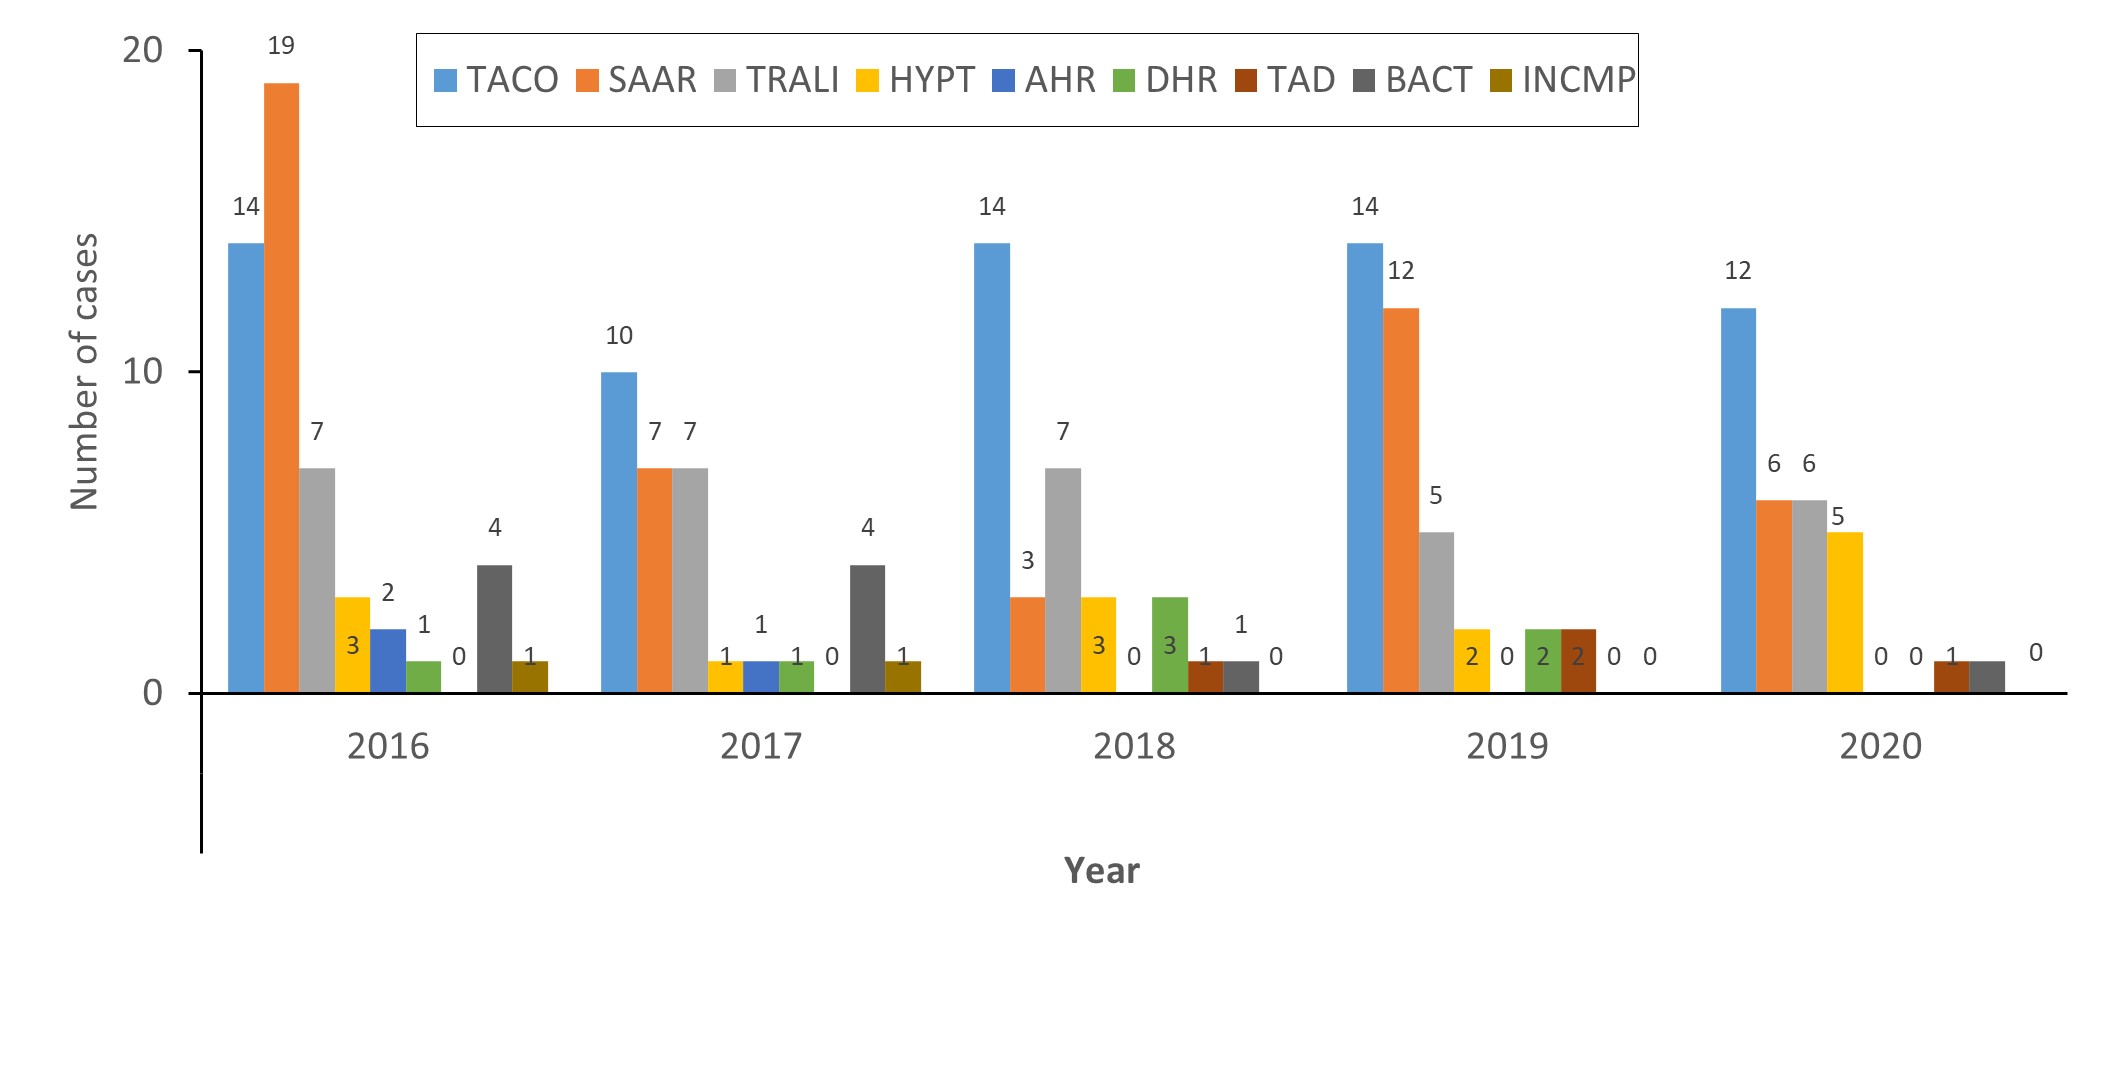
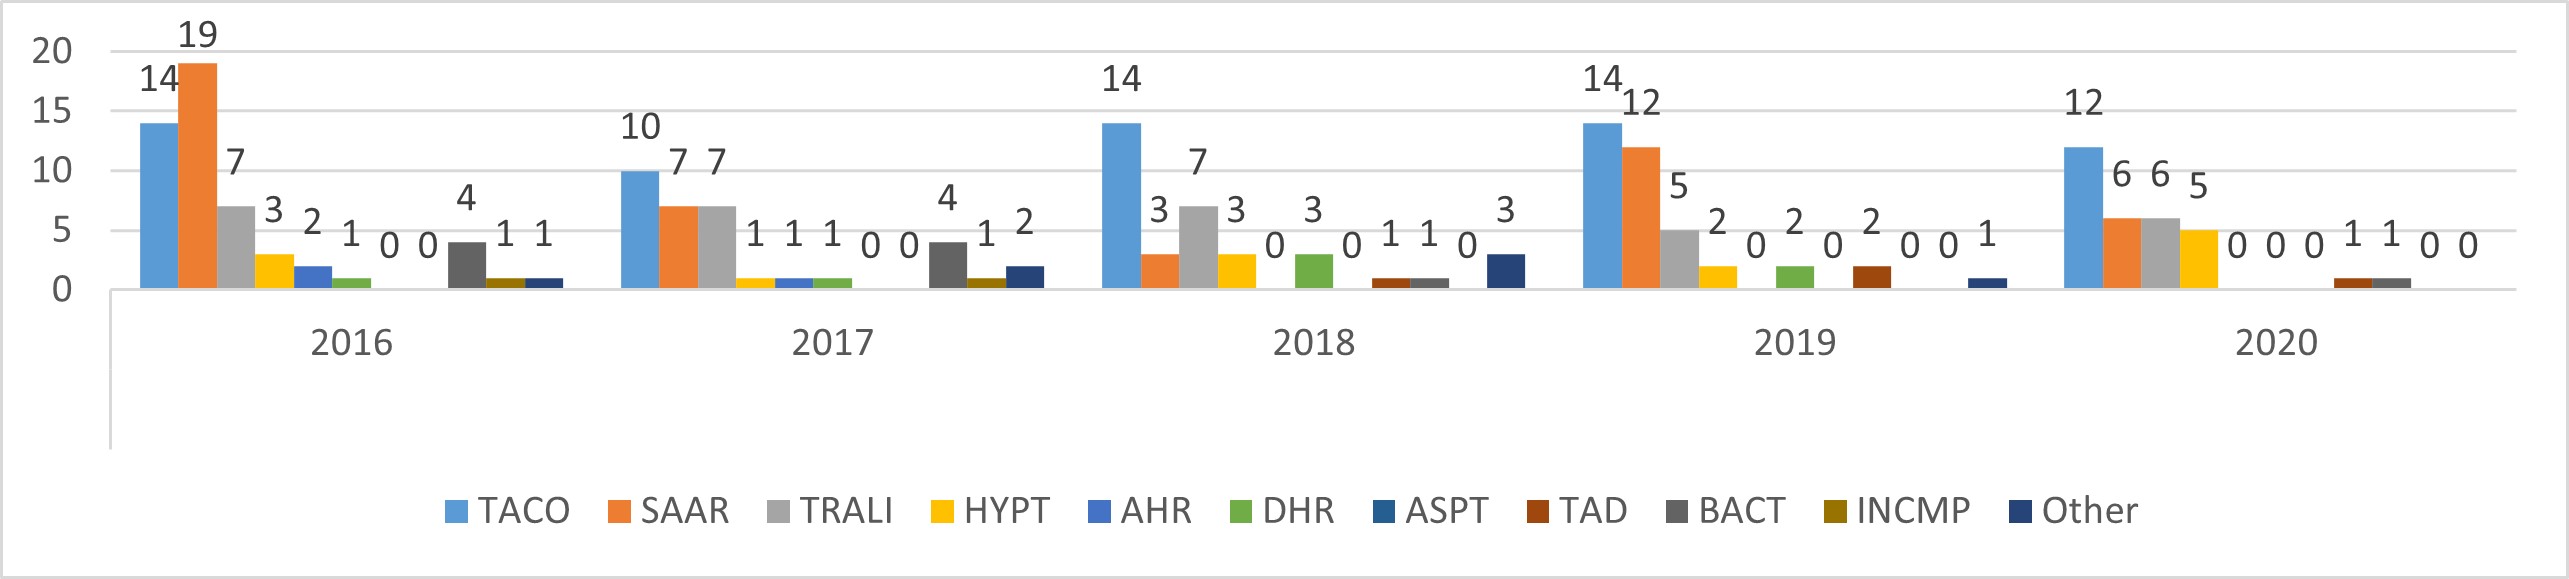
Out of the 211 grade 3 ATRs from 2016 to 2020, the vast majority (90.0%, n=190/211) were due to transfusion of blood components, while 10.0% (n=21/211) were due to transfusion of plasma derivatives (Table 4.2). In terms of reactions to transfusion of blood components, TACO was the most common ATR type to induce grade 3 reactions (33.7%, n=64/190), followed by SAAR (24.7%, n=47/190), TRALI (16.8%, n=32/190), and HYPT (7.4%, 14/190). Each of the remaining ATR types represents 5% or less of the total number of grade 3 ATRs. The annual numbers all have similar ratios with small variations (Figure 4.2A).
Of the grade 3 ATR cases that are due to the transfusion of plasma derivatives, SAAR accounted for more than half of the cases (52.4%, n=11/21), TACO accounted for three cases, and one case each was due to ASPT and TAD (Table 4.2). The annual numbers of grade 3 ATRs that are caused by transfusion of plasma derivatives are too small for the analysis of trends.
Table 4.2A: ATRs of life-threatening severity by year from transfusions of blood components
ATRs
2016
2017
2018
2019
2020
Total
TACO
14
10
14
14
12
64
SAAR
19
7
3
12
6
47
HYPT
3
1
3
2
5
14
AHR
2
1
0
0
0
3
DHR
1
1
3
2
0
7
TAD
0
0
1
2
1
4
TRALI
7
7
7
5
6
32
BACT
4
4
1
0
1
10
INCMP
1
1
0
0
0
2
Other
1
2
3
1
0
7
Total
52
34
35
38
31
190
Table 4.2B: ATRs of life-threatening severity by year from transfusions of plasma derivatives
ATRs
2016
2017
2018
2019
2020
Total
TACO
0
1
1
0
1
3
SAAR
3
2
1
2
3
11
ASPT
0
0
1
0
0
1
TAD
1
0
0
0
0
1
Other
1
1
0
1
2
5
Total
5
4
3
3
6
21
Figure 4.2A: ATRs of life-threatening severity by year from transfusions of blood componentsFigure 4.2A - Text description
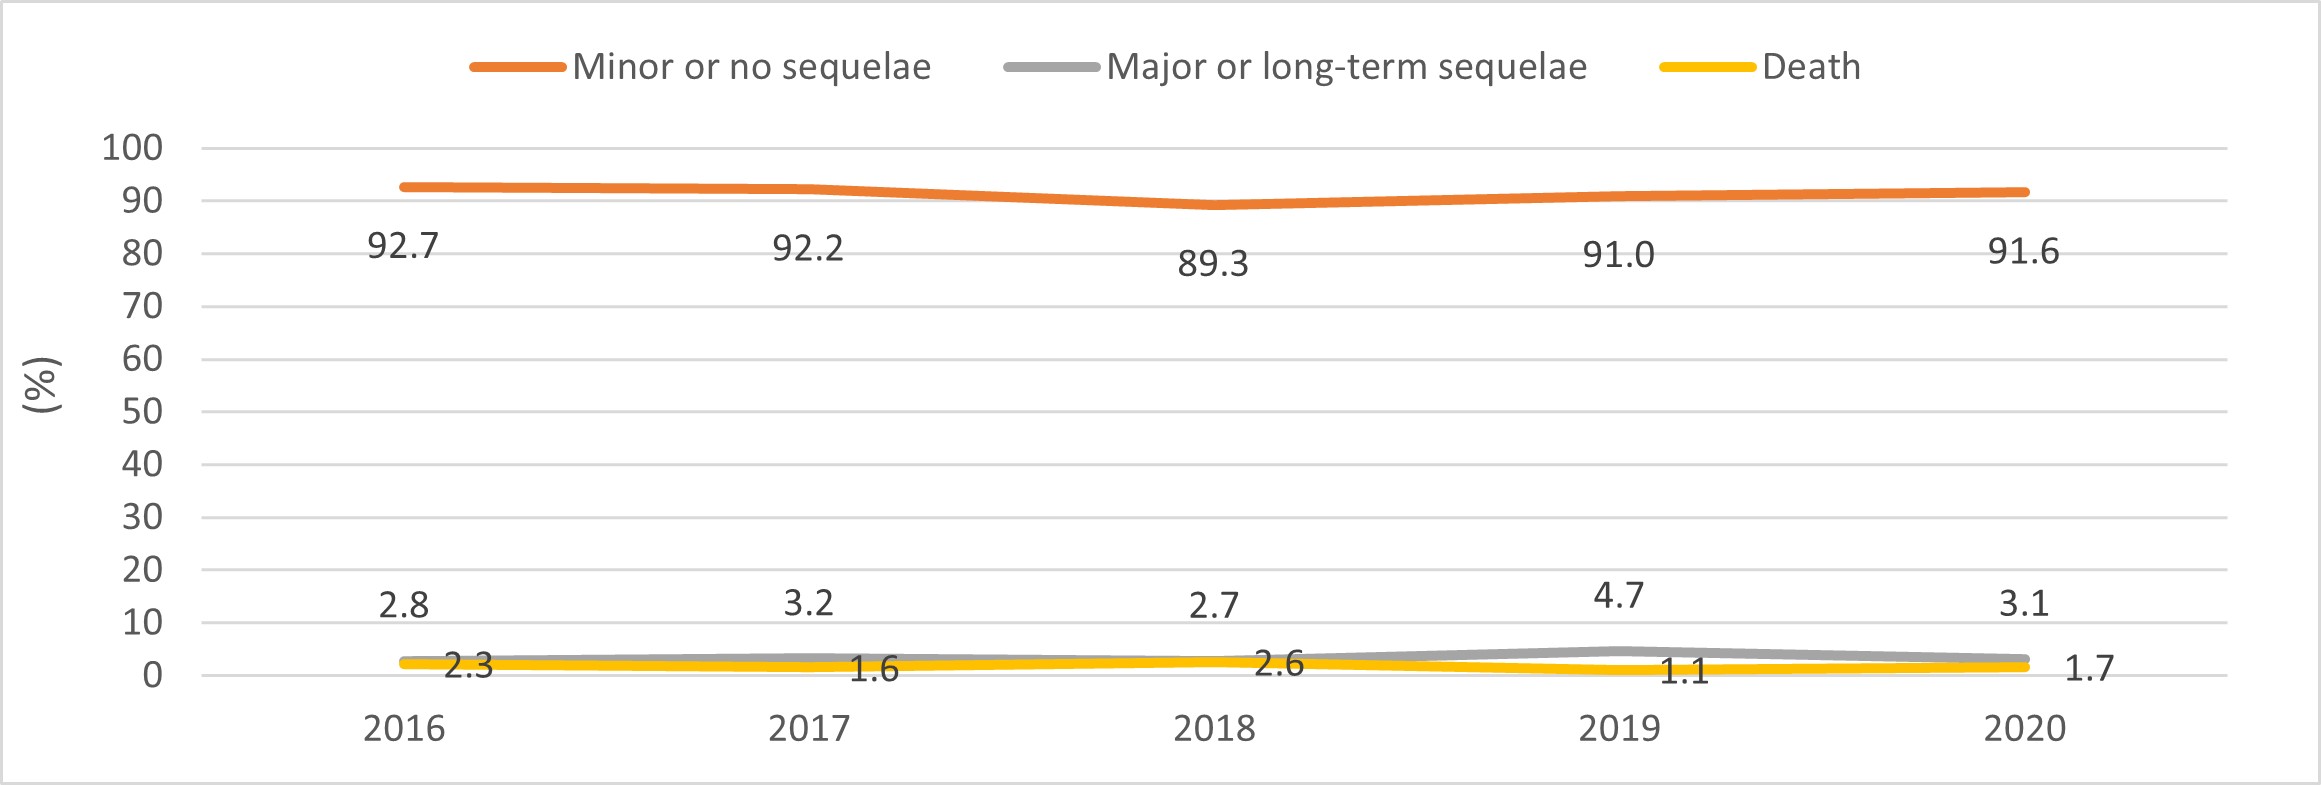
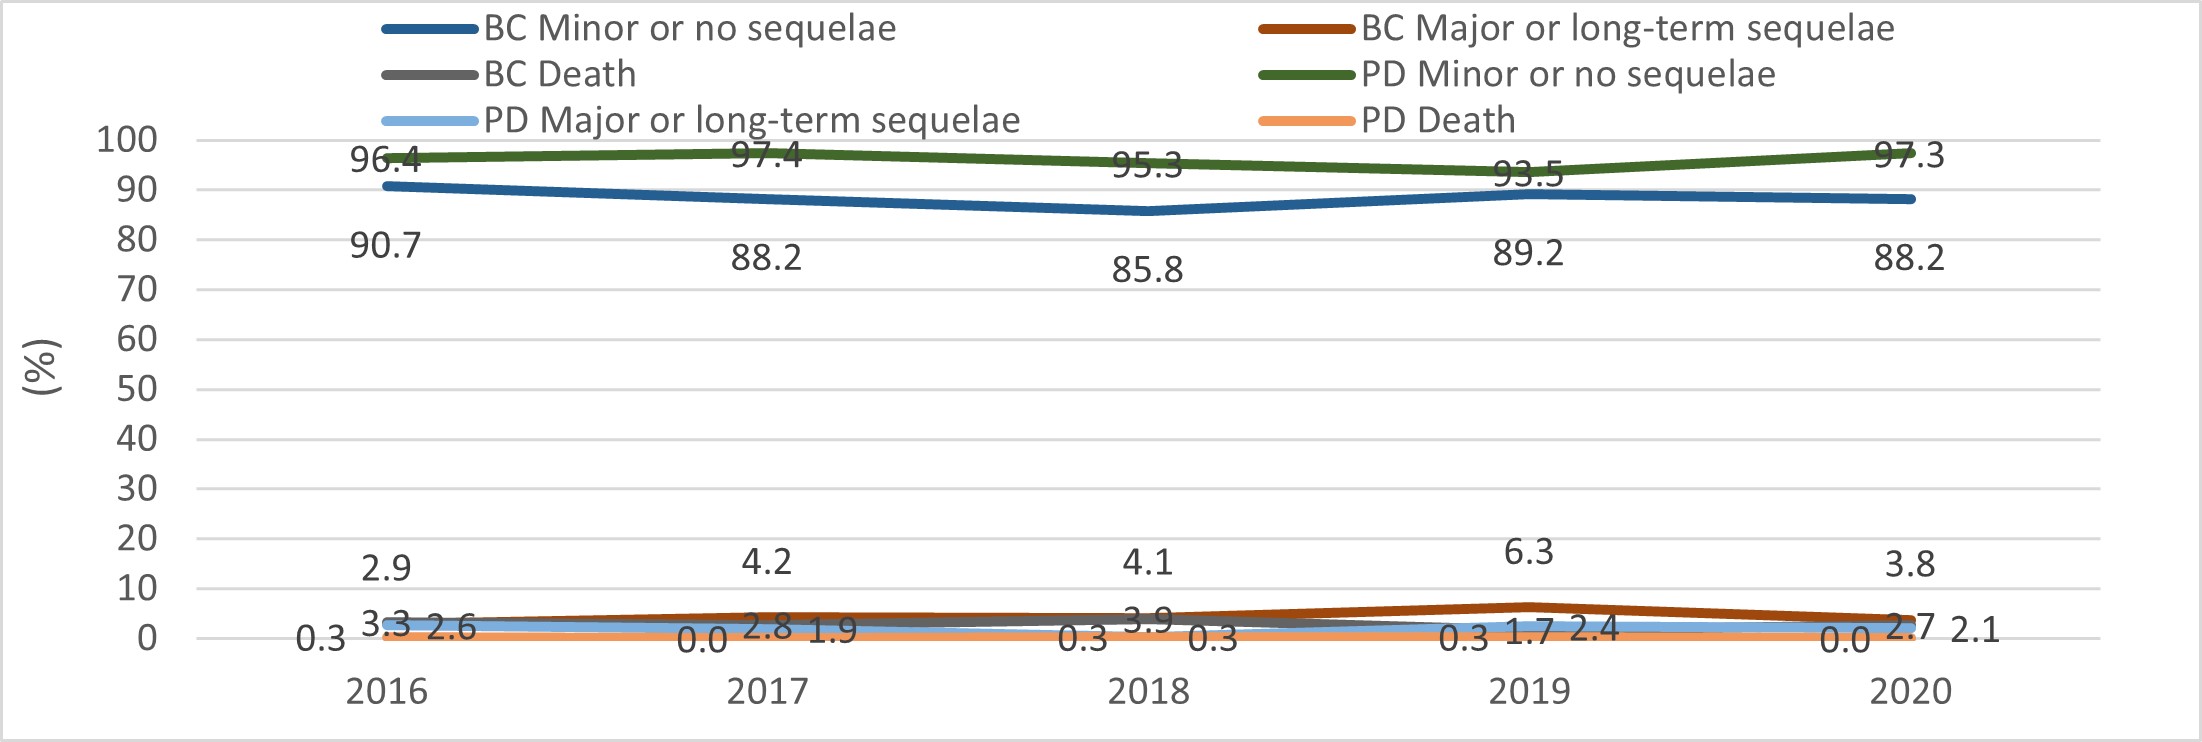
Annex A provides the detailed definitions of different outcome levels; Annex F lists the number of ATR cases throughout 2016-2020 according to their outcomes. Table 5A to 5C present the percentages of ATR cases that resulted in each outcome category. The figures demonstrate this data in graph-form, with 5A displaying the annual trends of ATR outcomes of all transfusions, and 5B displaying the trends of ATR outcomes of transfusions of blood components and of plasma derivatives separately. The vast majority of ATRs resulted in minor or no sequelae (91.4%, n=3,961/4,334), 3.3% (n=141/4,334) resulted in major or long-term sequelae, and 1.9% (n=81/4,334) resulted in death. The outcome patterns are consistent with small annual variations (Figure 5A). Outcomes associated with only transfusions of blood components or with only that of plasma derivatives demonstrate a similar pattern (Figure 5B). Compared to ATRs resulting from transfusion of plasma derivatives, ATRs resulting from transfusion of blood components have fewer cases with "minor or no-sequelae" and more cases with "major or long-term sequelae" (Table 5, Figure 5B). Of the ATRs resulting in death, the vast majority (96.3%, 78/81) were due to transfusions of blood components and only three deaths (3.7%, 3/81) were due to transfusions of plasma derivatives.
Table 5A: ATRs (%) from all transfusions by outcome and year
Outcome levels
2016
2017
2018
2019
2020
Total
Minor or no sequelae
92.7
92.2
89.3
91.0
91.6
91.4
Major or long-term sequelae
2.8
3.2
2.7
4.7
3.1
3.3
Death
2.3
1.6
2.6
1.1
1.7
1.9
Undetermined
2.3
3.0
5.4
3.2
3.6
3.5
Total (n)
888
963
877
709
897
4,334
Median age (years) of recipients who reported ATRs
65
64
65
62
66
65
Median age (years) of male recipients who reported ATRs
66
65
67
62.5
66
66
Median age (years) of female recipients who reported ATRs
67
63
62
61
66
63
Table 5B: ATRs (%) from transfusions of blood components by outcome and year
Outcome levels
2016
2017
2018
2019
2020
Total
Minor or no sequelae
90.7
88.2
85.8
89.2
88.2
88.4
Major or long-term sequelae
2.9
4.2
4.1
6.3
3.8
4.1
Death
3.3
2.8
3.9
1.7
2.7
2.9
Undetermined
3.1
4.8
6.1
2.9
5.4
4.5
Total (n)
581
544
557
416
560
2,658
Median age (years) of recipients who reported ATRs
70
68
70
67
69
69
Median age (years) of male recipients who reported ATRs
69
68
79
67
68
68
Median age (years) of female recipients who reported ATRs
70
68
67
67.5
71
69
Table 5C: ATRs (%) from transfusions of plasma derivatives by outcome and year
Outcome levels
2016
2017
2018
2019
2020
Total
Minor or no sequelae
96.4
97.4
95.3
93.5
97.3
96.1
Major or long-term sequelae
2.6
1.9
0.3
2.4
2.1
1.8
Death
0.3
0.0
0.3
0.3
0.0
0.2
Undetermined
0.7
0.7
4.1
3.8
0.6
1.8
Total (n)
307
319
320
293
337
1,676
Median age (years) of recipients who reported ATRs
53
58
57
55
62
57
Median age (years) of male recipients who reported ATRs
55
58
56
58
63
59
Median age (years) of female recipients who reported ATRs
52
59
57
52.5
59
57
Figure 5A: ATRs (%) from all transfusions by outcome and yearFigure 5A - Text description
Of the ATRs that resulted in major or long-term sequelae, the majority (78.0%, n=110/141) were related to transfusions of blood components and 22.0% (n=31/141) were related to transfusions of plasma derivatives (Table 5.1). In terms of all transfusions, one-quarter of the ATRs that resulted in major or long-term sequelae was due to TACO (28.4%, n=40/141). Other ATR types that often caused major or long-term sequelae are TRALI (11.3%, n=16/141), SAAR (9.9%, n=14/141), DHR (9.9%, n=14/141), and AHR (9.2%, n=13/141). ATRs due to transfusions of blood components have similar ratios, with TACO representing one-third of the cases (35.5%, n=39/110), followed by TRALI (13.6%, n=15/110), DHR (12.7%, n=14/11), and SAAR (10.0%, n=11/110).
In terms of transfusions of plasma derivatives, ATRs resulting in major or long-term sequelae were rare and sparsely distributed during the five-year reporting period. AHR and IVIG-HD accounted for 22.6% (n=7/31) and 12.9% (n=4/31), respectively, whereas only one case each of TACO and TRALI were reported for this category (Table 5.1).
Table 5.1A: ATRs from all transfusions resulting in major or long-term sequelae
ATRs
2016
2017
2018
2019
2020
Total
TACO
5
6
8
12
9
40
IVIG-HD
1
0
0
1
2
4
SAAR
3
3
3
2
3
14
HYPT
0
1
1
0
0
2
AHR
5
1
1
4
2
13
DHR
5
1
5
2
1
14
TAD
0
0
3
2
1
6
TRALI
2
4
1
3
6
16
BACT
0
4
1
4
0
9
INCMP
0
1
0
0
0
1
Other
4
10
1
3
4
22
Total
25
31
24
33
28
141
Table 5.1B: ATRs from transfusions of blood components resulting in major or long-term sequelae
ATRs
2016
2017
2018
2019
2020
Total
TACO
5
5
8
12
9
39
SAAR
3
3
2
2
1
11
HYPT
0
1
1
0
0
2
AHR
1
1
1
1
2
6
DHR
5
1
5
2
1
14
TAD
0
0
3
1
1
5
TRALI
2
3
1
3
6
15
BACT
0
4
1
4
0
9
INCMP
0
1
0
0
0
1
Other
1
4
1
1
1
8
Total
17
23
23
26
21
110
Table 5.1C: ATRs from transfusions of plasma derivatives resulting in major or long-term sequelae
ATRs
2016
2017
2018
2019
2020
Total
TACO
0
1
0
0
0
1
IVIG-HD
1
0
0
1
2
4
SAAR
0
0
1
0
2
3
HYPT
0
0
0
0
0
0
AHR
4
0
0
3
0
7
DHR
0
0
0
0
0
0
TAD
0
0
0
1
0
1
TRALI
0
1
0
0
0
1
Other
3
6
0
2
3
14
Total
8
8
1
7
7
31
5.2 ATRs leading to death
Among the total number of reported deaths, half (49.4%, 40/81) were deemed to have "definite, probable, or possible" relationships to transfusion, while the other half (50.6%, n=41/81) were deemed to be "doubtful, ruled out, or not determined" in relationship to transfusions (Table 5.2A). This latter group of non-transfusion-related deaths were not considered further.
Table 5.2A: ATRs resulting in transfusion-related deaths by imputability
ATRs
Definite
Probable
Possible
n (%)
TACO
1
6
8
15 (37.5)
SAAR
1
1
0
2 (5.0)
HYPT
0
0
0
0
AHR
0
0
0
0
DHR
0
1
1
2 (5.0)
TAD
0
0
2
3 (5.0)
TRALI
0
6
6
12 (30.0)
BACT
1
0
2
3 (7.5)
Other
0
0
4
4 (10.0)
Total
3
14
23
40 (100)
Table 5.2B: ATRs resulting in non-transfusion-related deaths by imputability
ATRs
Doubtful
Ruled out
Undetermined
n (%)
TACO
7
8
4
19 (46.3)
SAAR
0
2
0
2 (4.9)
HYPT
0
3
0
3 (7.3)
AHR
3
0
0
3 (7.3)
DHR
0
0
0
0
TAD
1
1
0
2 (4.9)
TRALI
4
0
2
6 (14.6)
BACT
2
0
0
2 (4.9)
Other
2
2
0
4 (9.8)
Total
19
16
6
41 (100)
Of the transfusion-related deaths, 95.0% (n=38/40) were due to transfusion of blood components while 5.0% (n=2/40) were due to that of plasma derivatives (Table 5.2B). Three deaths were deemed definitely related to transfusions (two due to that of blood components and one due to that of plasma derivatives), and the remaining 37 deaths were deemed probably or possibly related to transfusions (36 due to that of blood components, 1 due to that of plasma derivatives). Among transfusions of blood components, TACO and TRALI were the leading causes of death, the exact numbers being 39.5% (n=15/38) and 31.6% (n=12/38), respectively. In terms of other ATR types, BACT caused three deaths, DHR and TAD caused two deaths each, SAAR caused two deaths (1 due to transfusion of blood components and 1 due to that of plasma derivatives). Four more deaths are categorized as "Other" since the causes are not classifiable among the listed ATRs (Table 5.2B).
Table 5.2C: ATRs resulting in transfusion-related deaths by imputability (transfusions of blood components)
ATRs
Definite
Probable
Possible
Total
TACO
1
6
8
15
SAAR
0
1
0
1
DHR
0
1
1
2
TAD
0
0
2
2
TRALI
0
6
6
12
BACT
1
0
2
3
Other
0
0
3
3
Total
2
14
22
38
Table 5.2D: ATRs resulting in transfusion-related deaths by imputability (transfusions of plasma derivatives)
ATRs
Definite
Probable
Possible
Total
SAAR
1
0
0
1
Other
0
0
1
1
Total
1
0
1
2
The number of deaths by ATR type and year are detailed in Table 5.2E and F. The average number of deaths was 7.6 per year, varying from nine deaths in 2016 to seven deaths in 2020. TACO and TRALI were the leading causes of death with, respectively, an average of three deaths per year (Range: 1 to 5 deaths) and 2.4 deaths per year (Range: 1 to 4 deaths). Of the two deaths due to transfusions of plasma derivatives, one reported in 2016 was due to "Other causes" and one reported in 2019 was due to SAAR (Table 5.2D). The changes over time in the number of deaths should be interpreted with caution given the small number of cases reported and inherent variations in annual reporting.
In order to consider the relationship between age and transfusion-related deaths, the median age was calculated by sex for patients who experienced ATRs (Table 5) and death (Table 5.2E and F). The overall median age of patients with ATRs was 65 years. The male and female median ages were 66 and 63 years, respectively (Table 5). The overall median age of patients who passed away was 73 years. The male and female median ages at the time of death were, respectively, 73 and 72 years (Table 5.2E). Of the two deaths due to plasma derivatives, one involved a female infant in 2016 and the other was a 72-year-old male in 2019. These findings suggest that ATR-related deaths generally occur at much older ages where other underlying morbidities may play a role.
Table 5.2E: Annual number of deaths, median age (years) at death, and death rates (transfusions of blood components)
ATRs
2016
2017
2018
2019
2020
Total
TACO
2
3
5
1
4
15
SAAR
0
1
0
0
0
1
DHR
0
1
1
0
0
2
TAD
1
0
1
0
0
2
TRALI
4
2
3
1
2
12
BACT
2
0
0
0
1
3
Other
0
1
1
1
0
3
All deaths (med. age)
9 (73.0)
8 (73.0)
11 (73.0)
3 (42.0)
7 (74.0)
38 (73.0)
Male deaths (med. age.)
5 (73.0)
4 (69.0)
7 (73.0)
0
5 (74.0)
21 (73.0)
Female deaths (med. age.)
4 (71.0)
4 (79.0)
4 (74.5)
3 (42.0)
2 (77.0)
17 (73.0)
BC units transfused
1,227,593
1,240,531
1,272,609
1,210,631
1,133,937
6,086,778
Death rate per million units transfused
7.3
6.4
8.6
2.5
6.2
6.2
Table 5.2F: Annual number of deaths and median age (years) at death (transfusions of plasma derivatives)
ATRs
2016
2017
2018
2019
2020
Total
SAAR
0
0
0
1
0
1
Other
1
0
0
0
0
1
All deaths
1
0
0
1
0
2
Male deaths (med. age.)
n/a
n/a
n/a
1 (72)
n/a
1 (72)
Female deaths (med. age.)
1 (0)
n/a
n/a
n/a
n/a
1 (0)
Summary
Among the ATRs reported during the five-year period of 2016-2020:
In total, 60% of ATRs were related to the transfusion of blood components and forty percent were related to that of plasma derivatives.
TACO and IVIG-HD were, respectively, the most reported ATRs among recipients of blood components and of plasma derivatives.
One in ten ATRs was definitely related to transfusion; nine in ten were probably or possibly related to transfusion.
Of the reported deaths, one-half was transfusion-related and the other half were non-transfusion-related.
Among the transfusion-related deaths, 95.0% were due to transfusion of blood components and 5.0% were due to transfusion of plasma derivatives.
TACO and TRALI were the leading causes of deaths.
TTISS findings demonstrate trends and outcomes similar to that of other industrialized countries.
References
Footnote 1
Transfusion Transmitted Injuries Surveillance System, User's Manual, ver. 3.0, 2007. Public Health Agency of Canada.
Annex A: Definitions of severity, imputability, and outcome levels
Severity levels of ATRs
Severity level
Definition
Grade 1: non-severe
No permanent damage or impairment of a bodily function.
Grade 2: severe
Patient required in-patient hospitalization or prolongation of hospitalization directly attributable to the reaction; or the adverse reaction resulted in persistent or significant disability or incapacity; or it necessitated medical or surgical intervention to preclude permanent or significant damage or impairment of a bodily function.
Grade 3: life-threatening
Patient required major intervention following the transfusion (vasopressors, intubation, transferred to intensive care).
Grade 4: death
Patient's death was suspected to be the consequence of the transfusion reaction.
Not determined
Consequences of the transfusions reaction were not certain.
Imputability levels of ATRs
Imputabiltiy level
Definition
Definite
Clinical or laboratory event occurred within a time frame consistent with the administration of the blood, blood component, or plasma derivatives and was proven by investigation to have been caused by transfusion.
Probable
Clinical or laboratory event occurred within a time frame consistent with the administration of the blood, blood component, or plasma derivatives and did not seem to be explainable by any other cause.
Possible
Clinical or laboratory event occurred within a time frame consistent with the administration of the blood, blood component, or plasma derivatives but could be explained by concurrent disease(s) or by the administration of a drug or other agent.
Doubtful
Clinical or laboratory event occurred within a reasonable time frame in relation to the transfusion but the preponderance of data supports an alternative explanation.
Ruled out
Clinical or laboratory event occurred within a time frame inconsistent with the administration of the blood, blood component, or plasma derivatives or, if it occurred within a consistent time period but it was proven to have no relationship to the transfusion.
Not determined
It remains to be determined whether the event was related to the administration of the blood, blood component or plasma derivatives. Further information is forthcoming however was not available at time of data provision.
Outcome levels of ATRs
Outcome level
Definition
Minor sequelae
Patient had no sequelae or permanent disability from the reaction or developed antibodies to low or medium frequency antigens (< 95%).
Major sequelae
Patient developed either an infection with a persistent infectious agent (HIV, HBV or HCV), or a transfusion reaction with major or long-term sequelae; or the anticipation of difficulties with future transfusions (for example, development of antibodies to antigens present in more than 95% of donations).
Death
n/a
Not determined
The outcome of the adverse event was deemed uncertain.
Imputability levels of transfusion-related deaths
Imputability level
Definition
Definite
Death occurred within a time frame consistent with the administration of the blood, blood component, or plasma derivatives and was proven by investigation to have been caused by transfusion.
Probable
Death occurred within a time frame consistent with the administration of the blood, blood component, or plasma derivatives and did not seem to be explainable by any other cause.
Possible
Death occurred within a time frame consistent with the administration of the blood, blood component, or plasma derivatives but could be explained by concurrent disease(s) or by the administration of a drug or other agent.
Doubtful
Death occurred within a reasonable time frame in relation to the transfusion, but the preponderance of data supports an alternative explanation.
Ruled out
Death occurred within a time frame inconsistent with the administration of the blood, blood component, or plasma derivatives, if it occurred within a consistent time period but it was proven to have no relationship to the transfusion.
Not determined
It could not be determined if the death was related to transfusion.
Annex B: Annual numbers of ATRs according to kind of transfusion
Table 6A: Annual numbers of ATRS from all transfusions
ATRs
2016
2017
2018
2019
2020
Total
TACO
251
284
260
186
280
1,261
IVIG-HD
95
207
141
128
114
685
SAAR
94
72
89
82
88
425
HYPT
67
67
90
34
87
345
AHR
35
22
20
18
10
105
DHR
59
37
46
35
44
221
TAD
63
53
66
54
49
285
TRALI
19
21
20
14
23
97
ASPT
29
9
7
11
10
66
BACT
13
6
12
14
10
55
INCMP
5
11
3
1
0
20
Other
158
174
123
132
182
769
Total
888
963
877
709
897
4,334
Table 6B: Annual numbers of ATRs from transfusions of blood components
ATRs
2016
2017
2018
2019
2020
Total
TACO
233
262
242
165
259
1,161
SAAR
73
55
58
64
60
310
HYPT
59
50
69
31
69
278
AHR
23
13
15
7
10
68
DHR
37
24
39
27
43
170
TAD
49
36
50
43
42
220
TRALI
19
19
20
13
23
94
BACT
13
6
12
14
10
55
INCMP
5
11
3
1
0
20
Other
70
68
49
51
44
282
Total
581
544
557
416
560
2,658
Table 6C: Annual number of ATRs from transfusions of plasma derivatives
ATRs
2016
2017
2018
2019
2020
Total
TACO
18
22
18
21
21
100
IVIG-HD
95
207
141
128
114
685
SAAR
21
17
31
18
28
115
HYPT
8
17
21
3
18
67
AHR
12
9
5
11
0
37
DHR
22
13
7
8
1
51
TAD
14
17
16
11
7
65
TRALI
0
2
0
1
0
3
ASPT
29
9
7
11
10
66
Other
88
106
74
81
138
487
Total
307
419
320
293
337
1,676
Annex C: Annual numbers of units of blood components transfused
Table 7: Annual numbers of units of blood components transfused
Province / Territory
2016
2017
2018
2019
2020
British Columbia
176,681
172,513
170,373
161,296
159,779
Yukon Territory
535
636
579
733
884
Alberta
131,755
121905
118,626
111,431
104,762
Saskatchewan
42,575
37,000
50,379
48,197
40,882
Manitoba
52,181
50,364
35,979
31,603
30,460
Ontario
427,494
473,810
513,301
475,493
438,286
Québec
303,262
295452
297,780
299,880
280,487
New Brunswick
28,021
27,320
26,812
27,674
26,442
Nova Scotia
38,614
35,473
20,288
17,426
15,680
Prince Edward Island
4,220
3,911
34,213
34,213
33,087
Newfoundland & Labrador
21,809
21,546
3,791
3,824
3,502
Northwest Territories
446
421
488
518
635
Total
1,227,593
1,240,351
1,272,609
1,212,288
1,134,886
Annex D: Annual numbers of ATRs by imputability levels
Table 8A: ATRs from all transfusions (definite imputability)
ATRs
2016
2017
2018
2019
2020
Total
TACO
16
15
22
30
21
104
IVIG-HD
4
19
13
18
11
65
SAAR
15
15
15
22
11
78
HYPT
1
0
6
2
4
13
AHR
16
8
10
3
4
41
DHR
33
12
22
14
22
103
TAD
1
0
0
1
1
3
TRALI
0
4
0
2
3
9
ASPT
6
1
1
2
1
11
BACT
2
3
0
0
1
6
INCMP
3
8
2
0
0
13
Other
3
14
11
4
6
38
Total
100
99
102
98
85
484
Table 8B: ATRs from all transfusions (probable imputability)
ATRs
2016
2017
2018
2019
2020
Total
TACO
124
134
116
78
131
583
IVIG-HD
67
140
87
78
68
440
SAAR
44
39
52
43
50
228
HYPT
24
27
28
11
30
120
AHR
9
9
9
8
4
39
DHR
18
12
12
11
8
61
TAD
21
17
18
15
18
89
TRALI
9
7
5
1
7
29
ASPT
16
4
1
7
6
34
BACT
3
1
1
1
2
8
INCMP
2
2
1
0
0
5
Other
82
75
48
54
90
349
Total
419
467
378
307
414
1,985
Table 8C: ATRs from all transfusions (possible imputability)
ATRs
2016
2017
2018
2019
2020
Total
TACO
111
135
122
78
128
574
IVIG-HD
24
48
41
32
35
180
SAAR
35
18
22
17
27
119
HYPT
42
40
56
21
53
212
AHR
10
5
1
7
2
25
DHR
8
13
12
10
14
57
TAD
41
36
48
38
30
193
TRALI
10
10
15
11
13
59
ASPT
7
4
5
2
3
21
BACT
8
2
11
13
7
41
INCMP
0
1
0
1
0
2
Other
73
85
64
74
86
382
Total
369
397
397
304
398
1,865
Table 8D: ATRs from transfusions of blood components (definite imputability)
ATRs
2016
2017
2018
2019
2020
Total
TACO
16
14
22
28
21
101
SAAR
13
9
9
16
4
51
HYPT
1
0
5
2
2
10
AHR
12
3
8
1
4
28
DHR
21
8
18
10
22
79
TAD
1
0
0
1
1
3
TRALI
0
4
0
1
3
8
BACT
2
3
0
0
1
6
INCMP
3
8
2
0
0
13
Other
2
3
0
1
3
9
Total
71
52
64
60
61
308
Table 8E: ATRs from transfusions of blood components (probable imputability)
ATRs
2016
2017
2018
2019
2020
Total
TACO
115
123
108
70
119
535
SAAR
35
32
34
34
38
173
HYPT
20
19
18
11
23
91
AHR
4
6
6
1
4
21
DHR
14
8
11
8
8
49
TAD
18
12
13
14
14
71
TRALI
9
6
5
1
7
28
BACT
3
1
1
1
2
8
INCMP
2
2
1
0
0
5
Other
28
27
19
21
11
106
Total
248
236
216
161
226
1,087
Table 8F: ATRs from transfusions of blood components (possible imputability)
ATRs
2016
2017
2018
2019
2020
Total
TACO
102
125
112
67
119
525
SAAR
25
14
15
14
18
86
HYPT
38
31
46
18
44
177
AHR
7
4
1
5
2
19
DHR
2
8
10
9
13
42
TAD
30
24
37
28
27
146
TRALI
10
9
15
11
13
58
BACT
8
2
11
13
7
41
INCMP
0
1
0
1
0
2
Other
40
38
30
29
30
167
Total
262
256
277
195
273
1,263
Table 8G: ATRs from transfusions of plasma derivatives (definite imputability)
ATRs
2016
2017
2018
2019
2020
Total
TACO
0
1
0
2
0
3
IVIG-HD
4
19
13
18
11
65
SAAR
2
6
6
6
7
27
HYPT
0
0
1
0
2
3
AHR
4
5
2
2
0
13
DHR
12
4
4
4
0
24
TRALI
0
0
0
1
0
1
ASPT
6
1
1
2
1
11
Other
1
11
11
3
3
29
Total
29
47
38
38
24
176
Table 8H: ATRs from transfusions of plasma derivatives (probable imputability)
ATRs
2016
2017
2018
2019
2020
Total
TACO
9
11
8
8
12
48
IVIG-HD
67
140
87
78
68
440
SAAR
9
7
18
9
12
55
HYPT
4
8
10
0
7
29
AHR
5
3
3
7
0
18
DHR
4
4
1
3
0
12
TAD
3
5
5
1
4
18
TRALI
0
1
0
0
0
1
ASPT
16
4
1
7
6
34
Other
54
48
29
33
79
243
Total
171
231
162
146
188
898
Table 8I: ATRs from transfusions of plasma derivatives (possible imputability)
ATRs
2016
2017
2018
2019
2020
Total
TACO
9
10
10
11
9
49
IVIG-HD
24
48
41
32
35
180
SAAR
10
4
7
3
9
33
HYPT
4
9
10
3
9
35
AHR
3
1
0
2
0
6
DHR
6
5
2
1
1
15
TAD
11
12
11
10
3
47
TRALI
0
1
0
0
0
1
ASPT
7
4
5
2
3
21
Other
33
47
34
45
56
215
Total
107
141
120
109
125
602
Annex E: Annual numbers of ATRs by severity levels
Table 9A: Non-severe ATRs from all transfusions
ATRs
2016
2017
2018
2019
2020
Total
TACO
160
185
172
110
158
785
IVIG-HD
83
201
131
121
108
644
SAAR
35
21
37
20
29
142
HYPT
48
56
65
28
70
267
AHR
18
11
8
7
4
48
DHR
41
25
29
18
29
142
TAD
55
46
54
33
37
225
TRALI
5
2
2
4
0
13
ASPT
26
6
3
3
4
42
BACT
4
0
6
8
3
21
INCMP
1
5
3
1
0
10
Other
135
128
97
114
166
640
Total
611
686
607
467
608
2,979
Table 9B: Severe ATRs from all transfusions
ATRs
2016
2017
2018
2019
2020
Total
TACO
76
83
68
61
102
390
IVIG-HD
12
6
10
7
6
41
SAAR
36
42
48
46
50
222
HYPT
14
9
21
4
12
60
AHR
15
10
12
10
6
53
DHR
17
9
12
15
12
65
TAD
7
7
10
16
11
51
TRALI
6
11
11
5
16
49
ASPT
3
3
3
8
6
23
BACT
4
2
4
6
6
22
INCMP
3
4
0
0
0
7
Other
20
39
20
14
14
107
Total
213
225
219
192
241
1,090
Table 9C: Life-threatening ATRs from all transfusions
ATRs
2016
2017
2018
2019
2020
Total
TACO
14
12
15
14
13
68
SAAR
22
9
4
14
9
58
HYPT
3
1
3
2
5
14
AHR
2
1
0
0
0
3
DHR
1
1
3
2
0
7
TAD
1
0
1
2
1
5
TRALI
7
8
7
5
6
33
ASPT
0
0
1
0
0
1
BACT
4
4
1
0
1
10
INCMP
1
1
0
0
0
2
Other
3
4
3
2
2
14
Total
58
41
38
41
37
215
Table 9D: ATRs from all transfusions with undetermined severity
ATRs
2016
2017
2018
2019
2020
Total
TACO
1
4
5
1
7
18
SAAR
1
0
0
2
0
3
HYPT
2
1
1
0
0
4
AHR
0
0
0
1
0
1
DHR
0
2
2
0
3
7
TAD
0
0
1
3
0
4
TRALI
1
0
0
0
1
2
BACT
1
0
1
0
0
2
INCMP
0
1
0
0
0
1
Other
0
3
3
2
0
8
Total
6
11
13
9
11
50
Table 9E: Non-severe ATRs from transfusions of blood components
ATRs
2016
2017
2018
2019
2020
Total
TACO
151
165
160
93
148
717
SAAR
30
19
29
13
19
110
HYPT
42
40
48
25
55
210
AHR
11
7
7
3
4
32
DHR
24
19
28
13
28
112
TAD
45
33
38
27
32
175
TRALI
5
2
2
3
0
12
BACT
4
0
6
8
3
21
INCMP
1
5
3
1
0
10
Other
60
45
34
43
38
220
Total
373
335
355
229
327
1,619
Table 9F: Severe ATRs from transfusions of blood components
ATRs
2016
2017
2018
2019
2020
Total
TACO
68
82
63
57
93
363
SAAR
24
29
26
37
35
151
HYPT
12
8
17
4
9
50
AHR
10
5
8
4
6
33
DHR
12
4
7
12
12
47
TAD
4
3
10
12
9
38
TRALI
6
9
11
5
16
47
BACT
4
2
4
6
6
22
INCMP
3
4
0
0
0
7
Other
9
18
11
6
6
50
Total
152
164
157
143
192
808
Table 9G: Life-threatening ATRs from transfusions of blood components
ATRs
2016
2017
2018
2019
2020
Total
TACO
14
11
14
14
12
65
SAAR
19
7
3
12
6
47
HYPT
3
1
3
2
5
14
AHR
2
1
0
0
0
3
DHR
1
1
3
2
0
7
TAD
0
0
1
2
1
4
TRALI
7
8
7
5
6
33
BACT
4
4
1
0
1
10
INCMP
1
1
0
0
0
2
Other
1
3
3
1
0
8
Total
52
37
35
38
31
193
Table 9H: ATRs from transfusions of blood components with undetermined severity
ATRs
2016
2017
2018
2019
2020
Total
TACO
0
4
5
1
6
16
SAAR
0
0
0
2
0
2
HYPT
2
1
1
0
0
4
DHR
0
0
1
0
3
4
TAD
0
0
1
2
0
3
TRALI
1
0
0
0
1
2
BACT
1
0
1
0
0
2
INCMP
0
1
0
0
0
1
Other
0
2
1
1
0
4
Total
4
8
10
6
10
38
Table 9I: Non-severe ATRs from transfusions of plasma derivatives
ATRs
2016
2017
2018
2019
2020
Total
TACO
9
20
12
17
10
68
IVIG-HD
83
201
131
121
108
644
SAAR
5
2
8
7
10
32
HYPT
6
16
17
3
15
57
AHR
7
4
1
4
0
16
DHR
17
6
1
5
1
30
TAD
10
13
16
6
5
50
TRALI
0
0
0
1
0
1
ASPT
26
6
3
3
4
42
Other
75
83
63
71
128
420
Total
238
351
252
236
281
1,360
Table 9J: ATRs from transfusions of plasma derivatives
ATRs
2016
2017
2018
2019
2020
Total
TACO
8
1
5
4
9
27
IVIG-HD
12
6
10
7
6
41
SAAR
12
13
22
9
15
71
HYPT
2
1
4
0
3
10
AHR
5
5
4
6
0
20
DHR
5
5
5
3
0
18
TAD
3
4
0
4
2
13
TRALI
0
2
0
0
0
2
ASPT
3
3
3
8
6
23
Other
11
21
9
8
8
57
Total
61
61
62
49
49
282
Table 9K: Life-threatening ATRs from transfusions of plasma derivatives
ATRs
2016
2017
2018
2019
2020
Total
TACO
0
1
1
0
1
3
SAAR
3
2
1
2
3
11
TAD
1
0
0
0
0
1
ASPT
0
0
1
0
0
1
Other
2
1
0
1
2
6
Total
6
4
3
3
6
22
Table 9L: ATRs from transfusions of plasma derivatives of undetermined severity
ATRs
2016
2017
2018
2019
2020
Total
TACO
1
0
0
0
1
2
SAAR
1
0
0
0
0
1
DHR
0
2
1
0
0
3
TAD
0
0
0
1
0
1
Other
0
1
2
1
0
4
Total
2
3
3
2
1
11
Annex F: Annual numbers of ATRs by outcome levels
Table 10A: ATRs from all transfusions resulting in minor or no sequelae
ATRs
2016
2017
2018
2019
2020
Total
TACO
233
260
151
126
249
1,019
IVIG-HD
94
207
121
117
112
651
SAAR
90
67
58
51
85
351
HYPT
63
66
63
26
83
301
AHR
27
17
12
9
6
71
DHR
53
33
28
18
39
171
TAD
61
52
42
41
46
242
TRALI
8
10
8
3
9
38
ASPT
29
8
5
9
10
61
BACT
10
2
3
4
8
27
INCMP
5
7
3
1
0
16
Other
150
159
107
103
175
694
Total
823
888
601
508
822
3,642
Table 10B: ATRs from all transfusions resulting in major or long-term sequelae
ATRs
2016
2017
2018
2019
2020
Total
TACO
5
6
6
7
9
33
IVIG-HD
1
0
0
1
2
4
SAAR
3
3
1
2
3
12
HYPT
0
1
0
0
0
1
AHR
5
1
1
2
2
11
DHR
5
1
1
2
1
10
TAD
0
0
1
2
1
4
TRALI
2
4
1
2
6
15
BACT
0
4
0
2
0
6
INCMP
0
1
0
0
0
1
Other
4
10
0
1
4
19
Total
25
31
11
21
28
116
Total
823
888
601
508
822
3,642
Table 10C: ATRs from all transfusions resulting in death
ATRs
2016
2017
2018
2019
2020
Total
TACO
4
7
3
2
10
26
IVIG-HD
0
0
0
0
0
0
SAAR
1
1
0
0
0
2
HYPT
1
0
0
0
1
2
AHR
1
1
0
0
0
2
DHR
0
1
1
0
0
2
TAD
1
0
1
0
0
2
TRALI
6
3
1
1
3
14
BACT
3
0
1
0
1
5
Other
3
2
0
1
0
6
Total
20
15
7
4
15
61
Total
823
888
601
508
822
3,642
Table 10D: ATRs from all transfusions with an undetermined outcome level
ATRs
2016
2017
2018
2019
2020
Total
TACO
9
11
100
51
12
183
IVIG-HD
0
0
20
10
0
30
SAAR
0
1
30
29
0
60
HYPT
3
0
27
8
3
41
AHR
2
3
7
7
2
21
DHR
1
2
16
15
4
38
TAD
1
1
22
11
2
37
TRALI
3
4
10
8
5
30
ASPT
0
1
2
2
0
5
BACT
0
0
8
8
1
17
INCMP
0
3
0
0
0
3
Other
1
3
16
27
3
50
Total
20
29
258
176
32
515
Total
823
888
601
508
822
3,642
Table 10E: ATRs from transfusions of blood components resulting in minor or no sequelae
ATRs
2016
2017
2018
2019
2020
Total
TACO
215
239
141
114
228
937
SAAR
69
50
36
45
59
259
HYPT
55
49
46
23
65
238
AHR
19
9
7
5
6
46
DHR
32
20
25
14
38
129
TAD
47
35
29
37
39
187
TRALI
8
9
8
3
9
37
BACT
10
2
3
4
8
27
INCMP
5
7
3
1
0
16
Other
67
60
40
45
42
254
Total
527
480
338
291
494
2,130
Total
823
888
601
508
822
3,642
Table 10F: ATRs from transfusions of blood components resulting in major or long-term sequelae
ATRs
2016
2017
2018
2019
2020
Total
TACO
5
5
6
7
9
32
SAAR
3
3
1
2
1
10
HYPT
0
1
0
0
0
1
AHR
1
1
1
1
2
6
DHR
5
1
1
2
1
10
TAD
0
0
1
1
1
3
TRALI
2
3
1
2
6
14
BACT
0
4
0
2
0
6
INCMP
0
1
0
0
0
1
Other
1
4
0
1
1
7
Total
17
23
11
18
21
90
Total
823
888
601
508
822
3,642
Table 10G: ATRs from transfusions of blood components resulting in death
ATRs
2016
2017
2018
2019
2020
Total
TACO
4
7
3
2
10
26
SAAR
1
1
0
0
0
2
HYPT
1
0
0
0
1
2
AHR
1
1
0
0
0
2
DHR
0
1
1
0
0
2
TAD
1
0
1
0
0
2
TRALI
6
3
1
1
3
14
BACT
3
0
1
0
1
5
Other
2
2
0
1
0
5
Total
19
15
7
4
15
60
Total
823
888
601
508
822
3,642
Table 10H: ATRs from transfusions of blood components with an undetermined outcome level
ATRs
2016
2017
2018
2019
2020
Total
TACO
9
11
92
42
12
166
SAAR
0
1
21
17
0
39
HYPT
3
0
23
8
3
37
AHR
2
2
7
1
2
14
DHR
0
2
12
11
4
29
TAD
1
1
19
5
2
28
TRALI
3
4
10
7
5
29
BACT
0
0
8
8
1
17
INCMP
0
3
0
0
0
3
Other
0
2
9
4
1
16
Total
18
26
201
103
30
378
Total
823
888
601
508
822
3,642
Table 10I: ATRs from transfusions of plasma derivatives resulting in minor or no sequelae
ATRs
2016
2017
2018
2019
2020
Total
TACO
18
21
10
12
21
82
IVIG-HD
94
207
121
117
112
651
SAAR
21
17
22
6
26
92
HYPT
8
17
17
3
18
63
AHR
8
8
5
4
0
25
DHR
21
13
3
4
1
42
TAD
14
17
13
4
7
55
TRALI
0
1
0
0
0
1
ASPT
29
8
5
9
10
61
Other
83
99
67
58
133
440
Total
296
408
263
217
328
1,512
Total
823
888
601
508
822
3,642
Table 10J: ATRs from transfusions of plasma derivatives resulting in major or long-term sequelae
ATRs
2016
2017
2018
2019
2020
Total
TACO
0
1
0
0
0
1
IVIG-HD
1
0
0
1
2
4
SAAR
0
0
0
0
2
2
AHR
4
0
0
1
0
5
TAD
0
0
0
1
0
1
TRALI
0
1
0
0
0
1
Other
3
6
0
0
3
12
Total
8
8
0
3
7
26
Total
823
888
601
508
822
3,642
Table 10K: ATRs from transfusions of plasma derivatives resulting in death
ATRs
2016
2017
2018
2019
2020
Total
Other
1
0
0
0
0
1
Total
1
0
0
0
0
1
Total
823
888
601
508
822
3,642
Table 10L: ATRs from transfusions of plasma derivatives with an undetermined outcome level