
Transfusion Transmitted Injuries Surveillance System 2011 - 2015 Summary Report
Download the alternative format
(PDF format, 573 KB, 35 pages)
Organization: Public Health Agency of Canada
Published: 2019-01-12
Cat.:HP40-247/2019E
ISBN:978-0-660-29101-7
Pub.: 180705
Forward
The Centre for Communicable Diseases and Infection Control (CCDIC) of the Public Health Agency of Canada (PHAC) is pleased to present Transfusion Transmitted Injuries Surveillance System (TTISS) Summary Report, 2011-2015. This summary report presents transfusion transmitted injuries surveillance data submitted by Canadian hospitals participating in the TTISS network.
TTISS is a pan-Canadian surveillance system established by PHAC to capture non-nominal data on adverse transfusion reactions in Canadian hospitals providing transfusion services. The overarching goal of TTISS is to improve patient safety in Canadian hospitals.
CCDIC, in partnership with participating provinces and territories, is responsible for the collection, management, and analysis of data, and the production of reports to support evidence-based public health decisions.
Abbreviations
- AHR
- Acute Haemolytic Reaction
- ATR
- Adverse Transfusion Reaction
- DHR
- Delayed hemolytic reaction
- HR
- Hypotensive Reaction
- IVIG
- Intravenous Immunoglobulin
- SAAR
- Severe Anaphylactic/Anaphylactoid Reaction
- TACO
- Transfusion Associated Circulatory Overload
- TAD
- Transfusion Associated Dyspnea
- TRALI
- Transfusion Related Acute Lung Injury
- TTISS
- Transfusion Transmitted Injuries Surveillance System
Table of Contents
- Executive Summary
- Introduction
- Methods
- Case Definitions
- Results
- 1. Overall adverse transfusion reactions
- 2. Rate of occurrence of adverse transfusion reactions
- 3. Imputability of adverse transfusion reactions (i.e., relation to transfusion)
- 4. Severity of adverse transfusion reactions
- 5. Outcome of adverse transfusion reactions
- 6. Adverse transfusion reactions that resulted in death
- Summary
Executive Summary
The Transfusion Transmitted Injuries Surveillance System (TTISS) has been monitoring adverse reactions related to the transfusion of blood components and blood products (plasma derivatives) in Canada since 2001. Throughout the report, blood products refer as plasma derivatives. As of 2007, all provinces and territories, with the exception of Nunavut, provide data to the Transfusion Transmitted Injuries Surveillance System. In 2015, the hospitals participating in TTISS accounted for over 90% of all blood components transfused in Canada.
In addition to presenting the number of adverse reactions related to the transfusion of blood components and blood products, this report also presents the rate of occurrence of adverse reactions from blood components during the period of 2011-2015. However, due to the lack of denominator data, the rate of occurrence of adverse reactions from blood products will not be presented. Minor allergic reactions, febrile non-haemolytic reactions, and delayed serological reactions are also excluded due to inconsistent reporting of these events.
A total of 3,610 cases of transfusion-related adverse reactions were reported to TTISS from 2011-2015. The range of adverse reactions reported includes transfusion-associated circulatory overload (TACO), severe anaphylactic/anaphylactoid reactions (SAARs), hypotensive reaction, acute and delayed haemolytic reactions, transfusion-related acute lung injury (TRALI), transfusion-associated dyspnea (TAD), IVIG headache, aseptic meningitis, bacterial infections, and unusual reactions of clinical significance. For blood components, the most common adverse reaction was TACO (43.6%), followed by SAARs (12.6%), and hypotensive reaction (9.2%). For blood products, the most common adverse reaction was IVIG headache (35.3%), followed by delayed haemolytic reaction (13.9%), and SAARs (8.1%).
Each reported adverse reaction is categorized by its severity, which is measured by the level of medical care/intervention required, and also by the outcome, such as long-term physiological or physical impairment or death. The majority of the adverse reactions from 2011-2015 caused minimal or no harm to the recipients. Only 3.9% (n=138) resulted in major or long-term sequelae, including 68 deaths of which 47.1% (n=32) were transfusion-related. TACO and TRALI were the most frequent adverse reactions associated with death. Since most of the deaths occurred in persons of older age (> 70 yrs.) who had other comorbidities, these deaths may be attributed to another cause and thus, may not be directly related to the transfusions. Further research is required to clarify the relationship between transfusions and serious adverse reactions such as death.
Introduction
Established as a pilot system in 2001, the Transfusion Transmitted Injuries Surveillance System (TTISS) has since been monitoring adverse reactions related to transfusion. Adverse transfusion reactions are defined as undesirable and unintentional incidents that occur during and after the administration of blood, blood components or blood products. TTISS collects non-nominal data on adverse reactions after the transfusion of blood components (e.g., red blood cells, granulocytes, platelets, plasma, and cryoprecipitate) and blood products (e.g., albumin, immune globulin, coagulation factors, etc.). Adverse reactions are voluntarily reported by an extensive network of hospitals providing transfusion services across all provinces and territories, excluding Nunavut.
The TTISS National Working Group (TTISS-NWG) is comprised of representatives from each province and territory participating in TTISS, two blood manufacturers (Canadian Blood Services and Héma-Québec), and ex-officio representation from Health Canada’s Marketed Health Products Directorate and Biologics and Genetic Therapies Directorate. The National Working Group advises the project on the direction and quality, and its effectiveness as a national surveillance system.
The objective of TTISS is to identify and estimate the burden and trends of adverse reactions following transfusion of blood components and blood products to help improve patient safety in Canadian hospitals. This report summarizes the 2011-2015 national TTISS data.
Methods
Data Collection and Processing
Since 2007, all participating sites have provided data to Public Health Agency of Canada (PHAC). The coverage of transfused blood components in Canada was over 90% for 2015. The eventual goal is to have 100% coverage by 2020.
TTISS uses standardized case definitions and a standardized reporting form for recording adverse transfusion reactions, outlined in the TTISS User’s Manual.Footnote 1 Despite receiving data on all adverse transfusion reactions, TTISS reports only those reactions that are considered to be definitely, probably or possibly related to transfusion.
Information included in the reporting form is electronically transferred to PHAC in non-nominal format. This information includes categorization of events in terms of whether they can be imputed to transfusion (i.e., imputability), the level of intervention required and/or disability sustained (i.e., severity), and the measure of the extent of the adverse reaction (i.e., outcome). If the outcome of the event is death, further investigation is conducted to determine to what extent the death was attributed to the transfusion (e.g., definite, probable, possible, doubtful or ruled out). Case definitions below outline the levels of imputability, severity, and outcome of the adverse reactions.
Since 2014, the PHAC centralized web-based system, Canadian Network for Public Health Intelligence (CNPHI), has been used by the P/Ts representatives for data entry. The CNPHI platform has radial buttons and hard-coded drop-down lists to prevent data entry errors. The platform also has a systematic check feature to ensure completion of essential fields, resulting in full reporting. Currently, nine of the eleven participating sites enter data in CNPHI. It is anticipated that by 2020, all the P/Ts will be using the CNPHI platform for data entry. PHAC generally receives the previous year’s data in the fall of the current year to be reviewed for data quality assurance. Requests for clarifications are sent to each of the P/Ts separately. Events may be reclassified to comply with the standardized case definitions or excluded from national data analysis. The P/Ts data files are then combined to form a national TTISS database.
Adverse reactions deemed doubtfully or definitely not related to transfusion are removed from further analysis, as are those for which imputability was not determined or missing at the time of data provision. Adverse reactions in TTISS include severe anaphylactic/anaphylactoid reactions (SAARs), transfusion-associated circulatory overload (TACO), transfusion-related acute lung injury (TRALI) and possible TRALI, transfusion-associated dyspnea (TAD), hypotensive reactions (HR), intravenous immunoglobulin (IVIG) headache, acute and delayed haemolytic reactions, aseptic meningitis, incompatible transfusion and bacterial infections. Minor allergic reactions, febrile non-haemolytic reactions and delayed serological reactions are removed from the analysis because of inconsistency in reporting of these events. Adverse reactions associated with both blood components and blood products are attributed to the type of product first received.
Denominator Data
The annual total number of units of blood components transfused in hospitals within the TTISS network as reported by participating P/Ts is used as the denominator for rates and risks of adverse reactions to the transfusion of blood components. The rates of adverse reactions due to the transfusion of blood products are not calculated because appropriate denominator data are not currently available at the national level.
Statistical Analysis
Descriptive analyses are performed using the computer software SAS EG 5.1. Counts and proportions of specific adverse reactions are calculated for transfusions overall, and for transfusions of blood components and blood products separately, for each of the five reporting years and for the combined reporting period. Similarly, rates of specific adverse reactions per 100,000 transfusions of blood components are calculated by year and for the combined period. Counts and proportions of specific adverse reactions are also calculated by imputability, severity, and outcome of the reaction, for all transfusions as well as the transfusions related to blood components and blood products, separately.
Case Definitions
| Severity of Adverse Event | Definition |
|---|---|
| Grade 1 (Non-severe) | No permanent damage or impairment of a bodily function. |
| Grade 2 (Severe) | Patient required in-patient hospitalization or prolongation of hospitalization directly attributable to the reaction; or the adverse reaction resulted in persistent/ significant disability or incapacity; or it necessitated medical/surgical intervention to preclude permanent/significant damage or impairment of a bodily function. |
| Grade 3 (Life-threatening) | Patient required major intervention following the transfusion (vasopressors, intubation, transfer to intensive care). |
| Grade 4 (Death) | Patient’s death was suspected to be the consequence of the transfusion reaction. |
| Not determined | Consequences of the transfusion reaction were not certain. |
| Imputability (Relationship to Adverse Event) | Definition |
|---|---|
| Definite | Clinical and/or laboratory event occurred within a time frame consistent with the administration of the blood, blood component, or blood product and was proven by investigation to have been caused by transfusion. |
| Probable | Clinical and/or laboratory event occurred within a time frame consistent with the administration of the blood, blood component, or blood product and did not seem to be explainable by any other cause. |
| Possible | Clinical and/or laboratory event occurred within a time frame consistent with the administration of the blood, blood component, or blood product but could be explained by concurrent disease(s) or by the administration of a drug or other agent. |
| Doubtful | Clinical and/or laboratory event occurred within a reasonable time period in relation to the transfusion but the preponderance of data supports an alternative explanation. |
| Ruled out | Clinical and/or laboratory event occurred within a time period inconsistent with the administration of the blood, blood component, or blood product or, if it occurred within a consistent time period but it was proven to have no relationship to the transfusion. |
| Not determined | It remains to be determined whether the event was related to the administration of the blood, blood component or blood product. Further information is forthcoming however was not available at time of data provision. |
| Outcome of Adverse Event | Definition |
|---|---|
| Minor sequelae | Patient had no sequelae or permanent disability from the reaction or developed antibodies to low/medium frequency antigens (<95%). |
| Major sequelae | Patient developed either an infection with persistent infectious agent (HIV, HBV or HCV), or a transfusion reaction with major or long-term sequelae; or the anticipation of difficulties with future transfusions (e.g., development of antibodies to antigens present in more than 95% of donations). |
| Death | |
Not determined |
The outcome of the adverse event was deemed uncertain. |
| Relationship ofTransfusion to Recipient’s Death | Definition |
|---|---|
| Definite | Death occurred within a time period consistent with the administration of the blood, blood component, or blood product and was proven by investigation to have been caused by transfusion. |
| Probable | Death occurred within a time frame consistent with the administration of the blood, blood component, or blood product and did not seem to be explainable by any other cause. |
| Possible | Death occurred within a time frame consistent with the administration of the blood, blood component, or blood product but could be explained by concurrent disease(s) or by the administration of a drug or other agent. |
| Doubtful | Death occurred within a reasonable time period in relation to the transfusion but the preponderance of data supports an alternative explanation. |
| Ruled out | Death occurred within a time period inconsistent with the administration of the blood, blood component, or blood product or, if it occurred within a consistent time period but it was proven to have no relationship to the transfusion. |
| Not determined | It could not be determined if the death was related to transfusion. |
Results
The results are organized into six sections, each including the overall results, and the separate results for blood components and blood products, where feasible:
- Section 1 presents counts and proportions of adverse reactions, excluding those adverse reactions that were deemed doubtfully or definitely not associated with transfusion or that were missing this information.
- Section 2 presents rates of adverse reactions associated with the transfusion of blood components. As mentioned previously, analogous rates are not available for the transfusion of blood products because appropriate denominator data are not currently available at the national level.
- Section 3 presents counts and proportions of adverse reactions by imputability (i.e., the relationship to the transfusion) for the combined reporting period.
- Section 4 presents the counts and proportions of adverse reactions by the severity of the reaction (i.e., the degree of intervention required and/or disability sustained).
- Section 5 presents the counts and proportions of adverse reactions by the outcome of the reaction (i.e., the nature of the sequelae of the reaction).
- Section 6 presents further information on the adverse reactions associated with death, including its attribution to transfusion and the specific circumstances surrounding the deaths occurring in 2015.
1. Overall adverse transfusion reactions
Presented in Table 1A, the most commonly reported adverse transfusion reactions from 2011-2015 were TACO (31.5%), followed by SAARs (11.2%), and IVIG headache (11.1%)
| Transfusion-related adverse reaction | 2011 | 2012 | 2013 | 2014 | 2015 | Total | ||||||
|---|---|---|---|---|---|---|---|---|---|---|---|---|
| Freq. | % | Freq. | % | Freq. | % | Freq. | % | Freq. | % | Freq. | % | |
| Transfusion-associated circulatory overload (TACO) | 223 | 34.7% | 220 | 28.7% | 254 | 29.4% | 212 | 32.4% | 228 | 33.4% | 1137 | 31.5% |
| Acute haemolytic reaction (AHR) | 24 | 3.7% | 31 | 4.0% | 51 | 5.9% | 13 | 2.0% | 16 | 2.3% | 135 | 3.7% |
| Severe anaphylactic/ anaphylactoid reactions (SAARs) | 61 | 9.5% | 87 | 11.4% | 118 | 13.7% | 71 | 10.8% | 67 | 9.8% | 404 | 11.2% |
| Hypotensive reaction (HR) | 37 | 5.8% | 66 | 8.6% | 56 | 6.5% | 35 | 5.3% | 72 | 10.5% | 266 | 7.4% |
| Delayed haemolytic reaction (DHR) | 71 | 11.1% | 84 | 11.0% | 80 | 9.3% | 43 | 6.6% | 39 | 5.7% | 317 | 8.8% |
| Transfusion-related acute lung injury (TRALI) | 13 | 2.0% | 8 | 1.0% | 3 | 0.3% | 5 | 0.8% | 5 | 0.7% | 34 | 0.9% |
| Possible TRALI | 9 | 1.4% | 13 | 1.7% | 8 | 0.9% | 8 | 1.2% | 5 | 0.7% | 43 | 1.2% |
| Transfusion-associated dyspnea (TAD) | 19 | 3.0% | 24 | 3.1% | 62 | 7.2% | 33 | 5.0% | 56 | 8.2% | 194 | 5.4% |
| IVIG headache | 54 | 8.4% | 105 | 13.7% | 146 | 16.9% | 40 | 6.1% | 54 | 7.9% | 399 | 11.1% |
| Aseptic meningitis | 3 | 0.5% | 13 | 1.7% | 15 | 1.7% | 2 | 0.3% | 6 | 0.9% | 39 | 1.1% |
| Incompatible transfusion | 10 | 1.6% | 10 | 1.3% | 3 | 0.3% | 0 | 0.0% | 2 | 0.3% | 25 | 0.7% |
| Bacterial infection | 9 | 1.4% | 2 | 0.3% | 0 | 0.0% | 6 | 0.9% | 4 | 0.6% | 21 | 0.6% |
| Footnote 1Other | 98 | 15.3% | 76 | 9.9% | 68 | 7.9% | 187 | 28.5% | 129 | 18.9% | 558 | 15.5% |
| Footnote 2Unusual reaction | 11 | 1.7% | 27 | 3.5% | 0 | 0.0% | 0 | 0.0% | 0 | 0.0% | 38 | 1.1% |
| Total | 642 | 100.0% | 766 | 100.0% | 864 | 100.0% | 655 | 100.0% | 683 | 100.0% | 3610 | 100.0% |
|
||||||||||||
2. Rates of occurrence of adverse transfusion reactions
Rates of occurrence of adverse reactions could only be calculated for cases associated with the transfusion of blood components. Rates of cases from the transfusion of blood products could not be calculated because appropriate denominator data are not currently available. Table 2A summarizes the number of units of blood components transfused from 2011 to 2015 by jurisdiction.
| Province / Territory | 2011 | 2012 | 2013 | 2014 | 2015 | Total |
|---|---|---|---|---|---|---|
| British Columbia | 177,387 | 177,299 | 180,184 | 174,755 | 176,655 | 886,280 |
| Yukon Territory | 499 | 422 | 809 | 733 | 597 | 3,060 |
| Alberta | 114,734 | 155,120 | 140,153 | 104,689 | 138,532 | 653,228 |
| Manitoba | 54,819 | 59,893 | 56,501 | 52,913 | 53,659 | 277,785 |
| Saskatchewan | 48,182 | 46,707 | 42,450 | 42,450 | 40,436 | 220,225 |
| Ontario | 378,422 | 365,591 | 357,568 | 396,285 | 352,613 | 1,850,479 |
| Québec | 310,047 | 346,565 | 325,995 | 316,994 | 299,217 | 1,598,818 |
| New Brunswick | 29,276 | 32,597 | 30,057 | 30,644 | 28,281 | 150,855 |
| Nova Scotia | 42,893 | 43,205 | 37,685 | 38,972 | 35,468 | 198,223 |
| Prince Edward Island | 4,607 | 4,400 | 4,378 | 3,995 | 3,553 | 20,933 |
| Newfoundland & Labrador | 23,464 | 23,856 | 22,254 | 22,005 | 20,827 | 112,406 |
| Northwest Territories | 348 | 505 | 125 | 110 | 447 | 1,535 |
| Total | 1,184,678 | 1,256,160 | 1,198,159 | 1,184,545 | 1,150,285 | 5,973,827 |
As can be seen in Table 2B and Figure 1, TACO remained the most common adverse reaction in the TTISS network. In 2015, its occurrence rate was one case for every 5,229 units of blood components transfused. Incompatible transfusion was the least common with a rate of one occurrence per every 575,143 units of the blood components transfused.
| Transfusion-related adverse reactions | 2011 | 2012 | 2013 | 2014 | 2015 | Total | ||||||||||||
|---|---|---|---|---|---|---|---|---|---|---|---|---|---|---|---|---|---|---|
| Freq. | Footnote 1Rate | Footnote 2Risk | Freq. | Rate | Risk | Freq. | Rate | Risk | Freq. | Rate | Risk | Freq. | Rate | Risk | Freq. | Rate | Risk | |
| TACO | 216 | 18.2 | 1:5,485 | 209 | 16.6 | 1:6,010 | 242 | 20.2 | 1:4,951 | 197 | 16.6 | 1:6,013 | 220 | 19.1 | 1:5,229 | 1084 | 18.1 | 1:5,501 |
| AHR | 15 | 1.3 | 1:78,979 | 14 | 1.1 | 1:89,726 | 17 | 1.4 | 1:70480 | 7 | 0.6 | 1:169,221 | 10 | 0.9 | 1:115,029 | 63 | 1.1 | 1:94,656 |
| SAARs | 46 | 3.9 | 1:25,754 | 65 | 5.2 | 1:19,326 | 103 | 8.6 | 1:11,633 | 49 | 4.1 | 1:24,174 | 49 | 4.3 | 1:23,475 | 312 | 5.2 | 1:19,113 |
| HR | 30 | 2.5 | 1:39,489 | 63 | 5.0 | 1:19,939 | 48 | 4.0 | 1:24,962 | 30 | 2.5 | 1:39,485 | 59 | 5.1 | 1:19,496 | 230 | 3.9 | 1:25,9278 |
| DHR | 37 | 3.1 | 1:32,018 | 38 | 3.0 | 1:33,057 | 40 | 3.3 | 1:29,954 | 25 | 2.1 | 1:47,382 | 20 | 1.7 | 1:57,514 | 160 | 2.7 | 1:3,7270 |
| TRALI | 12 | 1.0 | 1:98,723 | 8 | 0.6 | 1:157,020 | 3 | 0.3 | 1:399,386 | 5 | 0.4 | 1:236,909 | 5 | 0.4 | 1:230,057 | 33 | 0.6 | 1:180707 |
| Possible TRALI | 8 | 0.7 | 1:148,085 | 13 | 1.0 | 1:96,628 | 8 | 0.7 | 1:149,770 | 7 | 0.6 | 1:169,221 | 5 | 0.4 | 1:230,057 | 41 | 0.7 | 1:145,447 |
| TAD | 18 | 1.5 | 1:65,815 | 20 | 1.6 | 1:62,808 | 46 | 3.8 | 1:26,047 | 30 | 2.5 | 1:39,485 | 47 | 4.1 | 1:24,474 | 161 | 2.7 | 1:37,039 |
| Incompatible transfusion | 8 | 0.7 | 1:148,085 | 10 | 0.8 | 1:125,616 | 3 | 0.3 | 1:399,386 | 0 | 0.0 | N/A | 2 | 0.2 | 1:575,143 | 23 | 0.4 | 1:259,275 |
| Bacterial infection | 9 | 0.8 | 1:131,631 | 2 | 0.2 | 1:628,080 | 0 | 0.0 | N/A | 6 | 0.5 | 1:197,424 | 3 | 0.3 | 1:383,428 | 20 | 0.3 | 1:298,166 |
| Other | 39 | 3.3 | 1:30,376 | 36 | 2.9 | 1:34,893 | 51 | 4.3 | 1:23,493 | 117 | 9.9 | 1:10,124 | 77 | 6.7 | 1:14,939 | 320 | 5.4 | 1:18635 |
| Unusual reaction | 8 | 0.7 | 1:148,085 | 24 | 1.9 | 1:52,340 | 0 | 0.0 | N/A | 0 | 0.0 | N/A | 0 | 0.0 | N/A | 32 | 0.5 | 1:186354 |
| Total | 446 | 37.6 | 1:2,656 | 502 | 40.0 | 1:2,502 | 561 | 46.8 | 1:2,136 | 473 | 39.9 | 1:2,504 | 497 | 43.2 | 1:2,314 | 2479 | 41.5 | 1:2,405 |
|
||||||||||||||||||
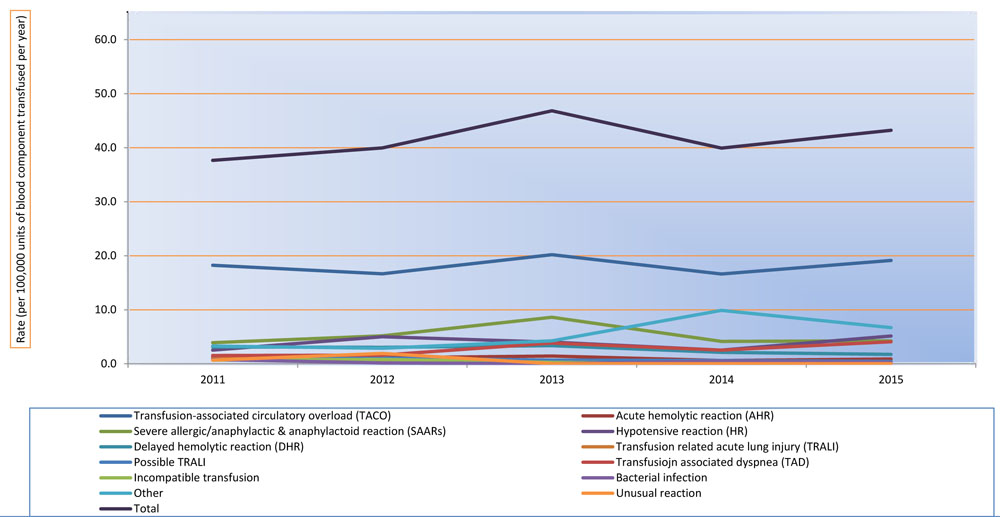
Description
The rate was calculated by using the total number of units of blood components transfused in TTISS jurisdictions (Table 2A) as the denominator and results were given in (i) number of adverse reactions per 100,000 units of blood components transfused and (ii) number of units transfused for the occurrence of one adverse reaction (Table 2B).
3. Imputability of adverse transfusion reactions (i.e., relation to transfusion)
Among the adverse transfusion reactions reported to TTISS (n=3,610) between 2011 and 2015, 12.6% (n=456) were deemed to have a definite link to transfusion, while 49.3% (n=1,780) and 38.1% (n=1,374) were deemed to be probably and possibly linked to transfusion, respectively (Table 3A). A definite link between transfusion and reported adverse reactions was established in 10.5% (n=260) of the recipients of blood components and 17.3% (n=196) of the recipients of blood products (Table 3B & Table 3C, respectively).
| Transfusion-related adverse reaction | Definite | Probable | Possible | Total | ||||
|---|---|---|---|---|---|---|---|---|
| Freq. | % | Freq. | % | Freq. | % | Freq. | % | |
| Transfusion-associated circulatory overload (TACO) | 68 | 6.0% | 548 | 48.2% | 521 | 45.8% | 1137 | 100% |
| Acute haemolytic reaction (AHR) | 53 | 39.3% | 55 | 40.7% | 27 | 20.0% | 135 | 100% |
| Severe anaphylactic/anaphylactoid reactions (SAARs) | 53 | 13.1% | 273 | 67.6% | 78 | 19.3% | 404 | 100% |
| Hypotensive reaction (HR) | 8 | 3.0% | 82 | 30.8% | 176 | 66.2% | 266 | 100% |
| Delayed haemolytic reaction (DHR) | 166 | 52.4% | 107 | 33.8% | 44 | 13.9% | 317 | 100% |
| Transfusion-related acute lung injury (TRALI) | 7 | 20.6% | 16 | 47.1% | 11 | 32.4% | 34 | 100% |
| Possible TRALI | 1 | 2.3% | 13 | 30.2% | 29 | 67.4% | 43 | 100% |
| Transfusion-associated dyspnea (TAD) | 3 | 1.5% | 87 | 44.8% | 104 | 53.6% | 194 | 100% |
| IVIG headache | 38 | 9.5% | 268 | 67.2% | 93 | 23.3% | 399 | 100% |
| Aseptic meningitis | 3 | 7.7% | 30 | 76.9% | 6 | 15.4% | 39 | 100% |
| Incompatible transfusion | 20 | 80.0% | 3 | 12.0% | 2 | 8.0% | 25 | 100% |
| Bacterial infection | 2 | 9.5% | 5 | 23.8% | 14 | 66.7% | 21 | 100% |
| Other | 33 | 5.9% | 285 | 51.1% | 240 | 43.0% | 558 | 100% |
| Unusual reaction | 1 | 2.6% | 8 | 21.1% | 29 | 76.3% | 38 | 100% |
| Total | 456 | 12.6% | 1780 | 49.3% | 1374 | 38.1% | 3610 | 100% |
| Transfusion-related adverse reaction | Definite | Probable | Possible | Total | ||||
|---|---|---|---|---|---|---|---|---|
| Freq. | % | Freq. | % | Freq. | % | Freq. | % | |
| Transfusion-associated circulatory overload (TACO) | 67 | 6.2% | 534 | 49.3% | 483 | 44.6% | 1084 | 100% |
| Acute haemolytic reaction (AHR) | 27 | 42.9% | 24 | 38.1% | 12 | 19.0% | 63 | 100% |
| Severe anaphylactic/anaphylactoid reactions (SAARs) | 28 | 9.0% | 222 | 71.2% | 62 | 19.9% | 312 | 100% |
| Hypotensive reaction (HR) | 4 | 1.7% | 74 | 32.2% | 152 | 66.1% | 230 | 100% |
| Delayed haemolytic reaction (DHR) | 91 | 56.9% | 48 | 30.0% | 21 | 13.1% | 160 | 100% |
| Transfusion-related acute lung injury (TRALI) | 7 | 21.2% | 15 | 45.5% | 11 | 33.3% | 33 | 100% |
| Possible TRALI | 1 | 2.4% | 11 | 26.8% | 29 | 70.7% | 41 | 100% |
| Transfusion-associated dyspnea (TAD) | 3 | 1.9% | 72 | 44.7% | 86 | 53.4% | 161 | 100% |
| Incompatible transfusion | 20 | 87.0% | 1 | 4.3% | 2 | 8.7% | 23 | 100% |
| Bacterial infection | 2 | 10.0% | 5 | 25.0% | 13 | 65.0% | 20 | 100% |
| Other | 10 | 3.1% | 145 | 45.3% | 165 | 51.6% | 320 | 100% |
| Unusual reaction | 0 | 0.0% | 7 | 21.9% | 25 | 78.1% | 32 | 100% |
| Total | 260 | 10.5% | 1158 | 46.7% | 1061 | 42.8% | 2479 | 100% |
| Transfusion-related adverse reaction | Definite | Probable | Possible | Total | ||||
|---|---|---|---|---|---|---|---|---|
| Freq. | % | Freq. | % | Freq. | % | Freq. | % | |
| Transfusion-associated circulatory overload (TACO) | 1 | 1.9% | 14 | 26.4% | 38 | 71.7% | 53 | 100% |
| Acute haemolytic reaction (AHR) | 26 | 36.1% | 31 | 43.1% | 15 | 20.8% | 72 | 100% |
| Severe anaphylactic/ anaphylactoid reactions (SAARs) | 25 | 27.2% | 51 | 55.4% | 16 | 17.4% | 92 | 100% |
| Hypotensive reaction (HR) | 4 | 11.1% | 8 | 22.2% | 24 | 66.7% | 36 | 100% |
| Delayed haemolytic reaction (DHR) | 75 | 47.8% | 59 | 37.6% | 23 | 14.6% | 157 | 100% |
| Transfusion-related acute lung injury (TRALI) | 0 | 0.0% | 1 | 100.0% | 0 | 0.0% | 1 | 100% |
| Possible TRALI | 0 | 0.0% | 2 | 100.0% | 0 | 0.0% | 2 | 100% |
| Transfusion-associated dyspnea (TAD) | 0 | 0.0% | 15 | 45.5% | 18 | 54.5% | 33 | 100% |
| IVIG headache | 38 | 9.5% | 268 | 67.2% | 93 | 23.3% | 399 | 100% |
| Aseptic meningitis | 3 | 7.7% | 30 | 76.9% | 6 | 15.4% | 39 | 100% |
| Incompatible transfusion | 0 | 0.0% | 2 | 100.0% | 0 | 0.0% | 2 | 100% |
| Bacterial infection | 0 | 0.0% | 0 | 0.0% | 1 | 100.0% | 1 | 100% |
| Other | 23 | 9.7% | 140 | 58.8% | 75 | 31.5% | 238 | 100% |
| Unusual reaction | 1 | 16.7% | 1 | 16.7% | 4 | 66.7% | 6 | 100% |
| Total | 196 | 17.3% | 622 | 55.0% | 313 | 27.7% | 1131 | 100% |
4. Severity of adverse transfusion reactions
The severity of the adverse transfusion reactions is an indication of the degree of intervention required and/or disability sustained, including death. Reported adverse transfusion reactions deemed to be of grade 1 severity (i.e.,no permanent damage or impairment of a bodily function) accounted for about 62.7% (n=2,253) of all reported adverse transfusion reactions (Table 4A). Reactions of grade 2 severity (severe) and grade 3 severity (life-threatening, including death) represented 31.5% (n=1,130) and 4.8% (n=171) of reactions, respectively, and are described in more detail below.
| Severity of adverse reaction | 2011 | 2012 | 2013 | 2014 | 2015 | Total | ||||||
|---|---|---|---|---|---|---|---|---|---|---|---|---|
| Freq. | % | Freq. | % | Freq. | % | Freq. | % | Freq. | % | Freq. | % | |
| Grade 1 (Non-severe) | 332 | 53.1% | 437 | 57.0% | 596 | 69.0% | 450 | 68.7% | 438 | 64.1% | 2,253 | 62.7% |
| Grade 2 (Severe) | 247 | 38.5% | 280 | 36.6% | 234 | 27.1% | 176 | 26.9% | 193 | 28.3% | 1,130 | 31.5% |
| Footnote 1Grade 3 (Life-threatening) | 40 | 6.2% | 44 | 5.7% | 23 | 2.7% | 23 | 3.5% | 41 | 6.0% | 171 | 4.8% |
| Not determined | 6 | 1.1% | 5 | 0.7% | 11 | 1.3% | 6 | 0.9% | 11 | 1.6% | 39 | 1.1% |
| Total | 625 | 100% | 766 | 100% | 864 | 100% | 655 | 100% | 683 | 100% | 3,593 | 100% |
N.B. The information on the severity level of reported adverse transfusion reactions was not available for 17 cases. |
||||||||||||
A. Severe adverse reactions (grade 2 Footnote 2 severity)
| Transfusion-related adverse reaction | 2011 | 2012 | 2013 | 2014 | 2015 | Total | ||||||
|---|---|---|---|---|---|---|---|---|---|---|---|---|
| Freq. | % | Freq. | % | Freq. | % | Freq. | % | Freq. | % | Freq. | % | |
| Transfusion-associated circulatory overload (TACO) | 93 | 50.3% | 95 | 44.0% | 75 | 44.9% | 56 | 44.4% | 60 | 40.3% | 379 | 45.0% |
| Acute haemolytic reaction (AHR) | 8 | 4.3% | 6 | 2.8% | 7 | 4.2% | 2 | 1.6% | 3 | 2.0% | 26 | 3.1% |
| Severe anaphylactic/anaphylactoid reactions (SAARs) | 35 | 18.9% | 47 | 21.8% | 47 | 28.1% | 34 | 27.0% | 30 | 20.1% | 193 | 22.9% |
| Hypotensive reaction (HR) | 8 | 4.3% | 18 | 8.3% | 7 | 4.2% | 7 | 5.6% | 9 | 6.0% | 49 | 5.8% |
| Delayed haemolytic reaction (DHR) | 8 | 4.3% | 14 | 6.5% | 11 | 6.6% | 8 | 6.3% | 7 | 4.7% | 48 | 5.7% |
| Transfusion-related acute lung injury (TRALI) | 6 | 3.2% | 3 | 1.4% | 0 | 0.0% | 2 | 1.6% | 3 | 2.0% | 14 | 1.7% |
| Possible TRALI | 4 | 2.2% | 10 | 4.6% | 3 | 1.8% | 2 | 1.6% | 2 | 1.3% | 21 | 2.5% |
| Transfusion-associated dyspnea (TAD) | 8 | 4.3% | 6 | 2.8% | 11 | 6.6% | 3 | 2.4% | 14 | 9.4% | 42 | 5.0% |
| Incompatible transfusion | 3 | 1.6% | 4 | 1.9% | 1 | 0.6% | 0 | 0.0% | 1 | 0.7% | 9 | 1.1% |
| Bacterial infection | 4 | 2.2% | 2 | 0.9% | 0 | 0.0% | 1 | 0.8% | 1 | 0.7% | 8 | 0.9% |
| Other | 7 | 3.8% | 8 | 3.7% | 5 | 3.0% | 11 | 8.7% | 19 | 12.8% | 50 | 5.9% |
| Unusual reaction | 1 | 0.5% | 3 | 1.4% | 0 | 0.0% | 0 | 0.0% | 0 | 0.0% | 4 | 0.5% |
| Total | 185 | 100% | 216 | 100% | 167 | 100% | 126 | 100% | 151 | 100% | 843 | 100% |
Grade 2 severity cases resulting from the transfusion of blood products were predominantly severe anaphylactic/anaphylactoid reactions (23.7%, n=68) and haemolytic reactions acute (13.2%, n=36) and delayed (21.6%, n=62), accounting for approximately 58.5% of the reported cases (Table 4.1B).
| Transfusion-related adverse reaction | 2011 | 2012 | 2013 | 2014 | 2015 | Total | ||||||
|---|---|---|---|---|---|---|---|---|---|---|---|---|
| Freq. | % | Freq. | % | Freq. | % | Freq. | % | Freq. | % | Freq. | % | |
| Transfusion-associated circulatory overload (TACO) | 3 | 4.8% | 6 | 9.4% | 3 | 4.5% | 4 | 8.0% | 3 | 6.8% | 19 | 6.6% |
| Acute haemolytic reaction (AHR) | 7 | 11.3% | 7 | 10.9% | 18 | 26.9% | 2 | 4.0% | 2 | 4.5% | 36 | 13.2% |
| Severe anaphylactic/anaphylactoid reactions (SAARs) | 12 | 19.4% | 19 | 29.7% | 7 | 10.4% | 17 | 34.0% | 13 | 29.5% | 68 | 23.7 % |
| Hypotensive reaction (HR) | 0 | 0.0% | 0 | 0.0% | 1 | 1.5% | 1 | 2.0% | 2 | 4.5% | 4 | 1.4% |
| Delayed haemolytic reaction (DHR) | 22 | 35.5% | 9 | 14.1% | 14 | 20.9% | 10 | 20.0% | 7 | 15.9% | 62 | 21.6% |
| Transfusion-associated dyspnea (TAD) | 1 | 1.6% | 1 | 1.6% | 1 | 1.5% | 0 | 0.0% | 1 | 2.3% | 4 | 1.4% |
| IVIG headache | 3 | 4.8% | 7 | 10.9% | 7 | 10.4% | 4 | 8.0% | 2 | 4.5 % | 23 | 8.0% |
| Aseptic meningitis | 3 | 4.8% | 9 | 14.1% | 11 | 16.4% | 1 | 2.0% | 3 | 6.8% | 27 | 9.4% |
| Incompatible transfusion | 1 | 1.6% | 0 | 0.0% | 0 | 0.0% | 0 | 0.0% | 0 | 0.0% | 1 | 0.3% |
| Other | 10 | 16.1% | 6 | 9.4% | 5 | 7.5% | 11 | 22.0% | 11 | 25.0% | 43 | 15.0% |
| Total | 62 | 100% | 64 | 100% | 67 | 100% | 50 | 100% | 44 | 100% | 287 | 100% |
B. Life-threatening adverse reactions (grade 3Footnote 3 severity)
A total of 171 (Table 4A) cases reported between 2011 and 2015 were of grade 3 severity (i.e., deemed to be life-threatening) after blood transfusion. About 87.1% (n=149) of these 171 cases were the recipients of blood components (Table 4.2A), and those who received blood products (Table 4.2B) amounted to be 12.8% (n=22). Among the transfusions of blood components, TACO was the most common grade 3 severity reaction and constituted over 38.2% (n=57) of the reported cases, followed by TRALI/possible TRALI 19.4% (n=29) and SAARs 14.8% (n=22).
| Transfusion-related adverse reaction | 2011 | 2012 | 2013 | 2014 | 2015 | Total | ||||||
|---|---|---|---|---|---|---|---|---|---|---|---|---|
| Freq. | % | Freq. | % | Freq. | % | Freq. | % | Freq. | % | Freq. | % | |
| Transfusion-associated circulatory overload (TACO) | 16 | 45.7% | 15 | 37.5% | 6 | 27.3% | 8 | 40.0% | 12 | 37.5% | 57 | 38.2% |
| Acute haemolytic reaction (AHR) | 0 | 0.0% | 0 | 0.0% | 4 | 18.2% | 1 | 5.0% | 1 | 3.1% | 6 | 4.0% |
| Severe anaphylactic/anaphylactoid reactions (SAARs) | 4 | 11.4% | 10 | 25.0% | 1 | 4.5% | 2 | 10.0% | 5 | 15.6% | 22 | 14.8% |
| Hypotensive reaction (HR) | 2 | 5.7% | 3 | 7.5% | 1 | 4.5% | 0 | 0.0% | 1 | 3.1% | 7 | 4.7% |
| Delayed haemolytic reaction (DHR) | 0 | 0.0% | 0 | 0.0% | 1 | 4.5% | 0 | 0.0% | 0 | 0.0% | 1 | 0.7% |
| Transfusion-related acute lung injury (TRALI) | 6 | 17.1% | 3 | 7.5% | 0 | 0.0% | 1 | 5.0% | 0 | 0.0% | 10 | 6.7% |
| Possible TRALI | 3 | 8.6% | 3 | 7.5% | 5 | 22.7% | 5 | 25.0% | 3 | 9.4% | 19 | 12.7% |
| Transfusion-associated Dyspnea (TAD) | 0 | 0.0% | 1 | 2.5% | 1 | 4.5% | 0 | 0.0% | 0 | 0.0% | 2 | 1.3% |
| Incompatible transfusion | 0 | 0.0% | 0 | 0.0% | 0 | 0.0% | 0 | 0.0% | 1 | 3.1% | 1 | 0.7% |
| Bacterial infection | 2 | 5.7% | 0 | 0.0% | 0 | 0.0% | 2 | 10.0% | 0 | 0.0% | 4 | 2.7% |
| Other | 1 | 2.9% | 1 | 2.5% | 3 | 13.6% | 1 | 5.0% | 9 | 28.1% | 15 | 10.1% |
| Unusual reaction | 1 | 2.9% | 4 | 10.0% | 0 | 0.0% | 0 | 0.0% | 0 | 0.0% | 5 | 3.4% |
| Total | 35 | 100% | 40 | 100% | 22 | 100% | 20 | 100% | 32 | 100% | 149 | 100% |
Of the 22 cases among recipients of blood products, 27.3% (n=6) were due to SAARs, 13.6% (n=3) to TACO, 13.6% (n=3) to haemolytic reaction, and 9.0% (n=2) to TRALI/possible TRALI (Table 4.2B).
| Transfusion-related adverse reaction | 2011 | 2012 | 2013 | 2014 | 2015 | Total | ||||||
|---|---|---|---|---|---|---|---|---|---|---|---|---|
| Freq. | % | Freq. | % | Freq. | % | Freq. | % | Freq. | % | Freq. | % | |
| Transfusion-associated circulatory overload (TACO) | 1 | 20.0% | 1 | 25.0% | 0 | 0.0% | 1 | 33.3% | 0 | 0.0% | 3 | 13.6% |
| Acute haemolytic reaction (AHR) | 0 | 0.0% | 1 | 25.0% | 0 | 0.0% | 0 | 0.0% | 2 | 22.2% | 3 | 13.6% |
| Severe anaphylactic/anaphylactoid reactions (SAARs) | 1 | 20.0% | 0 | 0.0% | 0 | 0.0% | 1 | 33.3% | 4 | 44.4% | 6 | 27.3% |
| Delayed haemolytic reaction (DHR) | 0 | 0.0% | 0 | 0.0% | 0 | 0.0% | 1 | 33.3% | 0 | 0.0% | 1 | 4.5% |
| Transfusion-related acute lung injury (TRALI) | 1 | 20.0% | 0 | 0.0% | 0 | 0.0% | 0 | 0.0% | 0 | 0.0% | 1 | 4.5% |
| Possible TRALI | 1 | 20.0% | 0 | 0.0% | 0 | 0.0% | 0 | 0.0% | 0 | 0.0% | 1 | 4.5% |
| Transfusion-associated dyspnea (TAD) | 0 | 0.0% | 1 | 25.0% | 0 | 0.0% | 0 | 0.0% | 0 | 0.0% | 1 | 4.5% |
| Other | 1 | 20.0% | 1 | 25.0% | 1 | 100% | 0 | 0.0% | 3 | 33.3% | 6 | 27.3% |
| Total | 5 | 100% | 4 | 100% | 1 | 100% | 3 | 100% | 9 | 100% | 22 | 100% |
5. Outcome of adverse transfusion reactions
The outcome of the adverse transfusion reactions is a measure of the extent of the sequelae of the reaction. Approximately 91.7% (n=3,278) of adverse transfusion reactions reported between 2011 and 2015 resulted in minor or no sequelae (Table 5A). Those that resulted in major or long-term sequelae accounted for 2.0% (n=70) and the proportion of fatalities was 1.9% (n=68).
| Transfusion-related adverse reaction | 2011 | 2012 | 2013 | 2014 | 2015 | Total | ||||||
|---|---|---|---|---|---|---|---|---|---|---|---|---|
| Freq. | % | Freq. | % | Freq. | % | Freq. | % | Freq. | % | Freq. | % | |
| Minor or no sequelae | 577 | 90.7% | 715 | 93.3% | 793 | 92.5% | 600 | 92.9% | 593 | 88.4% | 3278 | 91.7% |
| Major or long-term sequelae | 14 | 2.2% | 12 | 1.6% | 17 | 2.0% | 6 | 0.9% | 21 | 3.1% | 70 | 2.0% |
| Death | 10 | 1.6% | 10 | 1.3% | 7 | 0.8% | 16 | 2.5% | 25 | 3.7% | 68 | 1.9% |
| Not determined | 35 | 5.5% | 29 | 3.8% | 40 | 4.7% | 24 | 3.7% | 32 | 4.8% | 160 | 4.5% |
| Total | 636 | 100% | 766 | 100% | 857 | 100% | 646 | 100% | 671 | 100% | 3,576 | 100% |
N.B. Information on the outcome of reported adverse reactions was not available for 34 cases. |
||||||||||||
Approximately 4.7% (n=115) of the reported adverse reactions following the transfusion of blood components resulted in a serious outcome (e.g., major or long-term sequelae or death) (Table 5B). Among the adverse reactions reported following the transfusion of blood products approximately 2.0% (n=23) resulted in a serious outcome (Table 5C).
| Transfusion-related adverse reaction | 2011 | 2012 | 2013 | 2014 | 2015 | Total | ||||||
|---|---|---|---|---|---|---|---|---|---|---|---|---|
| Freq. | % | Freq. | % | Freq. | % | Freq. | % | Freq. | % | Freq. | % | |
| Minor or no sequelae | 392 | 88.5% | 460 | 91.6% | 507 | 90.9% | 426 | 91.6% | 425 | 86.9% | 2,210 | 89.9% |
| Major or long-term sequelae | 14 | 3.2% | 8 | 1.6% | 13 | 2.3% | 4 | 0.9% | 15 | 3.1% | 54 | 2.2% |
| Death | 10 | 2.3% | 8 | 1.6% | 7 | 1.3% | 15 | 3.2% | 21 | 4.3% | 61 | 2.5% |
| Not determined | 27 | 6.1% | 26 | 5.2% | 31 | 5.6% | 20 | 4.3% | 28 | 5.7% | 132 | 5.4% |
| Total | 443 | 100% | 502 | 100% | 558 | 100% | 465 | 100% | 489 | 100% | 2,457 | 100% |
N.B. Information on the outcome of reported adverse reactions was not available for 22 cases. |
||||||||||||
| Transfusion-related adverse reaction | 2011 | 2012 | 2013 | 2014 | 2015 | Total | ||||||
|---|---|---|---|---|---|---|---|---|---|---|---|---|
| Freq. | % | Freq. | % | Freq. | % | Freq. | % | Freq. | % | Freq. | % | |
| Minor or no sequelae | 185 | 95.9% | 255 | 96.6% | 286 | 95.7% | 174 | 96.1% | 168 | 92.3% | 1,068 | 95.4% |
| Major or long-term sequelae | 0 | 0.0% | 4 | 1.5% | 4 | 1.3% | 2 | 1.1% | 6 | 3.3% | 16 | 1.4% |
| Death | 0 | 0.0% | 2 | 0.8% | 0 | 0.0% | 1 | 0.6% | 4 | 2.2% | 7 | 0.6% |
| Not determined | 8 | 4.1% | 3 | 1.1% | 9 | 3.0% | 4 | 2.2% | 4 | 2.2% | 28 | 2.5% |
| Total | 193 | 100% | 264 | 100% | 299 | 100% | 181 | 100% | 182 | 100% | 1,119 | 100% |
N.B. Information on the outcome of reported adverse reactions was not available for 12 cases. |
||||||||||||
Among the adverse reactions that resulted in major or long-term sequelae following the transfusion of blood components, the most commonly reported were delayed haemolytic reactions 27.8% (n=15) and TACO 16.7% (n=9). (Table 5D). Available data indicate that the number of cases among recipients of blood products who developed major or long-term sequelae continue to be sparsely distributed across different types of reactions, not exceeding 5 cases per year from 2011 to 2015 (Table 5E).
| Transfusion-related adverse reaction | 2011 | 2012 | 2013 | 2014 | 2015 | Total | ||||||
|---|---|---|---|---|---|---|---|---|---|---|---|---|
| Freq. | % | Freq. | % | Freq. | % | Freq. | % | Freq. | % | Freq. | % | |
| Transfusion-associated circulatory overload (TACO) | 1 | 7.1% | 2 | 25.0% | 2 | 15.4% | 2 | 50.0% | 2 | 13.3% | 9 | 16.7% |
| Acute haemolytic reaction (AHR) | 3 | 21.4% | 0 | 0.0% | 2 | 15.4% | 0 | 0.0% | 1 | 6.7% | 6 | 11.1% |
| Severe anaphylactic/anaphylactoid reactions (SAARs) | 1 | 7.1% | 0 | 0.0% | 2 | 15.4% | 0 | 0.0% | 2 | 13.3% | 5 | 9.2% |
| Delayed haemolytic reaction (DHR) | 7 | 50.0% | 2 | 25.0% | 5 | 38.5% | 0 | 0.0% | 1 | 6.7% | 15 | 27.8% |
| Possible TRALI | 1 | 7.1% | 0 | 0.0% | 1 | 7.7% | 1 | 25.0% | 1 | 6.7% | 4 | 7.4% |
| Transfusion-associated dyspnea (TAD) | 1 | 7.1% | 0 | 0.0% | 1 | 7.7% | 0 | 0.0% | 1 | 6.7% | 3 | 5.6% |
| Other | 0 | 0.0% | 0 | 0.0% | 0 | 0.0% | 1 | 25.0% | 7 | 46.6% | 8 | 14.8% |
| Unusual reaction | 0 | 0.0% | 4 | 50.0% | 0 | 0.0% | 0 | 0.0% | 0 | 0.0% | 4 | 7.4% |
| Total | 14 | 100% | 8 | 100% | 13 | 100% | 4 | 100% | 15 | 100% | 54 | 100% |
| Transfusion-related adverse reaction | 2011 | 2012 | 2013 | 2014 | 2015 | Total | ||||||
|---|---|---|---|---|---|---|---|---|---|---|---|---|
| Freq. | % | Freq. | % | Freq. | % | Freq. | % | Freq. | % | Freq. | % | |
| Acute haemolytic reaction (AHR) | 0 | 0.0% | 0 | 0.0% | 0 | 0.0% | 0 | 0.0% | 1 | 16.7% | 1 | 6.2% |
| Severe anaphylactic/anaphylactoid reactions (SAARs) | 0 | 0.0% | 1 | 25.0% | 0 | 0.0% | 1 | 50.0% | 0 | 0.0% | 2 | 12.5% |
| Delayed haemolytic reaction (DHR) | 0 | 0.0% | 0 | 0.0% | 2 | 50.0% | 1 | 50.0% | 1 | 16.7% | 4 | 25.0% |
| Transfusion-associated dyspnea (TAD) | 0 | 0.0% | 1 | 25.0% | 0 | 0.0% | 0 | 0.0% | 0 | 0.0% | 1 | 6.2% |
| IVIG headache | 0 | 0.0% | 0 | 0.0% | 1 | 25.0% | 0 | 0.0% | 0 | 0.0% | 1 | 6.2% |
| Aseptic meningitis | 0 | 0.0% | 1 | 25.0% | 0 | 0.0% | 0 | 0.0% | 0 | 0.0% | 1 | 6.2% |
| Other | 0 | 0.0% | 1 | 25.0% | 1 | 25.0% | 0 | 0.0% | 4 | 66.6% | 6 | 37.5% |
| Total | 0 | 0.0% | 4 | 100% | 4 | 100% | 2 | 100% | 6 | 100% | 16 | 100% |
6. Adverse transfusion reactions that resulted in death
From 2011 to 2015, a total of 68 fatal cases were reported among patients who developed an adverse reaction following blood transfusion (Table 6A). Of these, five deaths (7.4%) were reported to be definitely related to transfusion and 15 (22.1%) were definitely not related (ruled out). Those deemed to be probably or possibly related to transfusion accounted for 10.3 % (n=7) and 29.4% (n=20), respectively. The relationship to transfusion for the remaining 30.9% (n=21) was either doubtful (n=11) or could not be determined (n=10).
| Transfusion-related death | Definite | Probable | Possible | Doubtful | Ruled out | Not determined | Total |
|---|---|---|---|---|---|---|---|
| Transfusion-associated circulatory overload (TACO) | 0 | 1 | 8 | 5 | 8 | 7 | 29 (42.6%) |
| Acute haemolytic reaction (AHR) | 1 | 0 | 3 | 0 | 0 | 1 | 5 (7.4%) |
| Severe anaphylactic/anaphylactoid reactions (SAARs) | 1 | 0 | 0 | 0 | 0 | 0 | 1 (1.5%) |
| Delayed haemolytic reaction (DHR) | 0 | 0 | 1 | 0 | 1 | 0 | 2 (2.9%) |
| Transfusion-related acute lung injury (TRALI) | 0 | 1 | 1 | 0 | 0 | 0 | 2 (2.9%) |
| Possible TRALI | 0 | 3 | 4 | 3 | 2 | 1 | 13 (19.1%) |
| Transfusion-associated dyspnea (TAD) | 0 | 0 | 0 | 1 | 0 | 0 | 1 (1.5%) |
| Incompatible transfusion | 0 | 0 | 0 | 0 | 1 | 0 | 1 (1.5%) |
| Bacterial infection | 0 | 1 | 1 | 1 | 0 | 0 | 3 (4.4%) |
| Other | 3 | 1 | 2 | 1 | 3 | 1 | 11 (16.2%) |
| Total | 5 (7.4%) | 7 (10.3%) | 20 (29.4%) | 11 (16.2%) | 15 (22.1%) | 10 (14.7%) | 68 (100%) |
Overall, there were a total of 32 deaths deemed to be either definitely, probably or possibly linked to transfusion recorded for the period 2011 - 2015 (Table 6B). Twenty-six deaths were associated to blood components and 6 were associated to blood products. The majority of these deaths were associated with TRALI (n=2), possible TRALI (n=7) or TACO (n=9). While the number of deaths in 2015 is higher than in previous years, it is too early to determine a trend. However, this will be monitored in the coming years.
| Transfusion-related death | 2011 | 2012 | 2013 | 2014 | 2015 | Total |
|---|---|---|---|---|---|---|
| Transfusion-associated circulatory overload (TACO) | 2 | 2 | 1 | 1 | 3 | 9 (28.1%) |
| Acute haemolytic Reaction (AHR) | 0 | 0 | 1 | 1 | 2 | 4 (12.5%) |
| Severe anaphylactic/anaphylactoid reactions (SAARs) | 0 | 0 | 0 | 0 | 1 | 1 (3.1%) |
| Delayed haemolytic reaction (DHR) | 0 | 0 | 1 | 0 | 0 | 1 (3.1%) |
| Transfusion-related acute lung injury (TRALI) | 1 | 1 | 0 | 0 | 0 | 2 (6.3%) |
| Possible TRALI | 2 | 2 | 2 | 1 | 0 | 7 (21.9%) |
| Bacterial infection | 1 | 0 | 0 | 1 | 0 | 2 (6.3%) |
| Other | 0 | 1 | 1 | 0 | 4 | 6 (18.8%) |
| Total | 6 (18.8%) | 6 (18.8%) | 6 (18.8%) | 4 (12.5%) | 10 (31.3%) | 32 (100%) |
The ten deaths noted in Table 6B for 2015 had the following characteristics:
- A 56 year old male with upper gastrointestinal bleeding received a stem cell transplant in the surgical ward developed a probable acute haemolytic reaction of grade 3 severity following an IVIG transfusion;
- An 86 year old male who received a red blood cell transfusion developed a probable TACO in an ICU;
- An 80 year old female who was admitted into chronic care received a red blood cell transfusion and developed a probable TACO;
- A 74 year old female who was admitted to the surgical ward with acute renal failure, pulmonary edema, transient hypotension/syncopal episodes, oliguria, atrial fibrillation, gastrointestinal bleeding, and pneumonia developed a possible TACO following a red blood cell transfusion;
- A one month old premature female newborn who presented a distended and rigid abdomen and bile aspirates in the ICU received a red blood cell transfusion and developed a possible other reaction of grade 3 severity;
- An 85 year old male who presented with aspiration pneumonia, chronic heart disease, congestive heart failure, mitral valve replacement, and hypertension was admitted to the surgical ward, and following a red blood cell transfusion developed a possible other reaction;
- A 71 year old female who presented with idiopathic thrombocytopenic purpura and haemolytic anemia in the surgical ward developed a possible acute haemolytic reaction following an IVIG transfusion;
- An 89 year old female who presented progressive weakness and tachycardia in the surgical ward developed a definite other reaction following an IVIG transfusion;
- An 87 year old male who presented with a myocardial infarct with acquired factor VIII deficiency in the surgical ward developed a definite other reaction following a coagulation factor transfusion;
- A 71 year old female reported a case of grade 4 severity (death) that was definitely linked with anaphylactic shock (severe anaphylactic/anaphylactoid reaction) following a red blood transfusion.
Summary
A total of 3,610 cases of transfusion-related adverse reactions were reported to TTISS from 2011-2015, and there was no clear trend in the number reported per year over this time period. The findings in this report demonstrate that for blood components, the most common adverse reactions were TACO, SAARs, and hypotensive reaction while for blood products, the most common adverse reactions were IVIG headache, delayed haemolytic reaction, and SAARs. Overall, approximately one in ten adverse reactions was definitely related to transfusion and the remaining nine were probably or possibly related to transfusion. About five percent of adverse reactions required major intervention and of these, about seventy percent were related to three types of adverse reactions: TACO (35.1%), TRALI/possible TRALI (18.1%), and SAARs (16.4%).
Of the 68 deaths reported during 2011-15, thirty-two were judged to be transfusion-related (26 associated with blood components and 6 associated with blood products). The majority of transfusion-related deaths were associated with TACO (n=9) or
TRALI /possible TRALI (n=9), however since most deaths occurred in older persons (60% over 73 years old),there may be some other underlying causes (comorbidities) of these deaths which may not directly related to transfusions. Note that the changes over time in the number of reported deaths should be interpreted with caution given the small number of reports and inherent variations in annual reporting. Further research is required to clarify the relationship between transfusions and serious adverse reactions such as death.
Footnotes
- 1st Footnote *
-
Transfusion Transmitted Injuries Surveillance System, User's Manual, ver. 3.0, 2007. Public Health Agency of Canada.
- 2nd Footnote *
-
Grade 2 (severe): Patient required in-patient hospitalization or prolongation of hospitalization directly attributable to the reaction; or the adverse reaction resulted in persistent/ significant disability or incapacity; or it necessitated medical/surgical intervention to preclude permanent/significant damage or impairment of a bodily function
- 3rd Footnote *
-
Grade 3 (life-threatening): Patient required major intervention following the transfusion (vasopressors, intubation, transfer to intensive care).