
FoodNet Canada 2019 integrated findings report
Download in PDF format
(3,219 KB, 39 pages)
Organization: Public Health Agency of Canada
Published: 2024-07-26
Table of contents
- Foreword and acknowledgements
- Executive summary
- Information to the reader
- Definitions
- Abbreviations
- Chapter 1: Introduction to the Quebec sentinel site
- Chapter 2: Listeria monocytogenes
- Chapter 3: Salmonella Enteritidis (SE)
- Chapter 4: Poultry
- Chapter 5: Shigatoxigenic Escherichia coli
- Chapter 6: Parasites
- Chapter 7: Travel
- Chapter 8: Farmers' markets
- Chapter 9: Targeted seafood study
- Appendix A: Data collection and reporting
- Appendix B: Data considerations
- Appendix C: Sampling table by component
- References
Foreword and acknowledgements
The Public Health Agency of Canada's (PHAC) FoodNet Canada surveillance system is pleased to present the 2019 Integrated Findings Report. The report highlights FoodNet Canada findings from its sentinel sites in British Columbia, Alberta, Ontario and Quebec. The Integrated Findings Report focuses on the integration of trends in enteric pathogen disease rates and in potential disease sources throughout the farm-to-fork continuum (i.e., retail food, manure from food producing animals on farms, and water).
The report is a unique compilation of cohesive chapters, which highlights the results of surveillance activities conducted in 2019 as well as surveillance trends from 2015 to 2019 with focus on the impact of enteric pathogen trends on public health. It is our hope that this report will be used to inform and shape discussions on food safety issues regarding enteric diseases and their sources.
Acknowledgements
PHAC acknowledges the significant investments made by FoodNet Canada partners in the four sentinel sites, our provincial and federal government agency colleagues, and academic and industry collaborators who help to make this program a continued success.
Executive summary
FoodNet Canada (FNC), the integrated sentinel site surveillance network for enteric disease in Canada, conducts continuous and episodic surveillance activities in four sentinel sites by collecting information on human cases of enteric disease and levels of pathogen exposure from food, animal, and water sources. This report summarizes 2019 data, as well as integrated surveillance findings from 2015 to 2019, with a focus on how enteric pathogen trends impact public health. It also expands on surveillance trends in enteric disease rates, as well as trends in the prevalence of these pathogens found on potential food, animal, and water sources as reported in the FoodNet Canada Tables and Figures 2019 Report.
In 2019, FNC implemented a fourth sentinel site in Quebec located in the Région sociosanitaire de la Montérégie, where activities included enhanced human disease surveillance, as well as active surveillance of enteric pathogens in retail meat and farm manure. Ongoing surveillance in this site will help inform trends over time and permit integrated analyses with the other sentinel sites, allowing for a more nationally representative surveillance system.
Key findings
Enteritidis was the most common Salmonella serovar causing endemic human infection in 2019 and was also frequently found in broiler chicken manure, retail chicken breast, and retail frozen breaded chicken product (FBCP) samples. The majority (87%) of 2019 retail, farm, and water Salmonella Enteritidis (SE) isolates sequenced were found to fall within human whole genome sequencing (WGS) clusters defined by PulseNet Canada, reflecting the continued importance of poultry and the environment as a potential risk factor for SE infection.
Although Enteritidis was the most common serovar identified, the incidence rate of endemic human SE cases decreased in 2019. A significant decrease was also observed in the percent of FBCP and broiler chicken manure samples positive for SE in 2019 compared to 2018. The significant decrease in SE observed on FBCP is associated with the Canadian Food Inspection Agency directive to industry to reduce Salmonella to below detectable limits in FBCP that are packaged for retail sale by April 1, 2019. This directive increased the availability of cooked products sold at retail.
S. Reading was the top Salmonella serovar among FNC outbreak-related cases and among the top five Salmonella serovars for all reported FNC cases in 2019. In addition, the prevalence of S. Reading in retail turkey and farm turkey manure samples increased in 2019 compared to previous years, with the majority of these S. Reading positive samples falling within a human WGS cluster defined by PulseNet Canada, including a national outbreak of S. Reading.
The incidence rate of invasive listeriosis in 2019 remained relatively low for all FNC sites combined; however, Listeria remains a risk for severe illness, with 80% of endemic cases being hospitalized. Raw or undercooked ground beef is a potential source for Listeria infection as the prevalence continued to be high in 2019 (25%), with a higher prevalence found on samples from small stores (e.g., butcher shops) compared to large stores. Targeted consumer education efforts, particularly towards high-risk populations (i.e., pregnant people, the elderly, and those who are immunocompromised) to increase awareness of raw or undercooked ground beef as a potential source of listeriosis, are warranted.
The incidence rate of non-O157 shigatoxigenic Escherichia coli (STEC) increased in 2018 and 2019 and reflects an increase in testing of non-O157, suggesting that, previously, non-O157 had been underdiagnosed. Analysis comparing indicators of severity (e.g., bloody diarrhea, vomiting, emergency room visits, hospitalizations, virulence genes) suggests that E. coli O157 is more severe than non-O157.
Increased non-O157 STEC testing has improved the ability to identify common serogroups across FNC components and, therefore, improved the ability to identify exposure sources. Exposure to irrigation water, beef manure, and pork meat products sold at the retail level present a risk to public health for the top seven priority serogroups of clinically significant concern through environmental exposure and food consumption.
Among reported cases of parasites, Giardia and Cryptosporidium cases increased in 2019 compared to previous years, while cases of Cyclospora decreased. The introduction of polymerase chain reaction (PCR) laboratory testing methods for the detection of Giardia and Cryptosporidium may have contributed to the changing incidence rates. Drinking untreated or raw water, canoeing, kayaking, hiking, or camping, and swimming in natural waters were found to be potential risk factors for Giardia infection from the exposure data collected by FNC.
International travel continues to be a risk for gastrointestinal illness in Canadians, with 25% of FNC cases between 2015-2019 classified as international travel-related. Among these international travel-related cases, the majority were infected with Campylobacter, Salmonella, or Giardia. Among SE cases in 2019, approximately 30% were classified as international travel-related, with most of these cases reporting travel to the Americas (Central, South, and Caribbean). Whole Genome Sequencing analysis of international travel-related SE cases from 2017-2019 showed that the majority of SE sequences clustered by country for the three most reported travel destinations: Mexico, Cuba, and Dominican Republic. The use of WGS has helped to better inform our understanding of travel-related cases clustering by country, and also within a country. For example, within Mexico, the majority of isolates from cases that reported travel to the west coast of the country clustered separately from cases that reported travel to the east coast.
FoodNet Canada's targeted sampling activities in 2019 included sampling of raw ground beef, raw chicken breast, and raw pork sausage sold at farmers' markets in the Alberta and Ontario sentinel sites, and domestic seafood (i.e., raw mussels and oysters) in the British Columbia, Alberta, and Ontario sentinel sites. A higher prevalence of Campylobacter, Listeria, and STEC was found among certain retail meats collected from farmers' markets, compared with those collected from chain or independent grocery stores, representing a potential emerging source of enteric illness. Retail store samples of raw mussels and oysters tested positive for bacteria, parasites, and viruses, with Vibrio representing the most frequently isolated bacterium from these foods. Since oysters are commonly eaten raw, ongoing monitoring and testing of shellfish products by federal food safety partners is important to understand the risk for human infection and implications for the health of Canadians.
Information to the reader
FoodNet Canada is a multi-partner sentinel site surveillance system led by the Public Health Agency of Canada (PHAC) that monitors trends in enteric pathogens in Canada.
In collaboration with public health jurisdictions and provincial public health laboratories, FoodNet Canada conducts continuous and episodic surveillance activities in four sentinel sites collecting information across four components: human, retail (meat and produce), on-farm (farm animals), and water. Continuous surveillance occurs throughout the year to identify trends in human disease occurrence, exposure sources, and attributes illnesses to sources and settings for targeted enteric pathogens. Information on the potential sources of risk to human health helps direct food and water safety actions and programming as well as public health interventions, and to evaluate their effectiveness.
Specifically, FoodNet Canada's core objectives are to:
- determine what food and other sources are making Canadians ill;
- determine significant risk factors for enteric illness;
- accurately track enteric disease rates and risks over time; and
- provide practical prevention information to assist local and provincial public health officials to:
- prioritize risks;
- compare interventions, direct actions and advance policy; and
- assess effectiveness of food safety activities / public health interventions and measure performance.
This report draws on knowledge from a variety of sources to present a comprehensive and meaningful interpretation of trends and issues identified through FoodNet Canada data, as well as from collaborating programs within PHAC. Examples include:
- Centre for Foodborne, Environmental and Zoonotic Infectious Diseases (CFEZID)
- Foodborne Disease and Antimicrobial Resistance Surveillance Division (FDASD)
- Canadian Integrated Program for Antimicrobial Resistance Surveillance (CIPARS)
- National Enteric Surveillance Program (NESP)
- Enhanced National Listeriosis Surveillance Program
- Outbreak Management Division (OMD)
- Foodborne Disease and Antimicrobial Resistance Surveillance Division (FDASD)
- National Microbiology Laboratory (NML)
Information from these programs is used to support and enhance findings through the integration and assessment of relationships observed over time between human illness, contamination levels in retail foods, food-animal farm manure and water. Known interventions implemented within the food industry were also considered when interpreting surveillance trends.
For information on data collection and reporting and surveillance strategy please see Appendix A.
For further information on trends in enteric pathogen disease rates, as well as trends in the prevalence of these pathogens found on potential disease sources (retail meats, manure from food producing animals and water), please refer to the FoodNet Canada Tables and Figures 2019 Report.
Definitions
Cluster: A group of genetically similar isolates. Based on common-pattern combination studies and well-characterized outbreak investigations, most events show that isolates within a 10 allele range may be epidemiologically linked.
Endemic: Endemic cases of disease are affected individuals who had an infection that was considered sporadic and domestically acquired (i.e. within Canada).
Exposure: Point along the water-borne, food-borne, animal-to-person, or person-to-person transmission route at which people were suspected to have been exposed to a given pathogen.
Lost to follow-up: Includes cases that could not be followed up with an interview by public health.
Minimum Spanning Tree (MST): Graph constructed to connect isolates based on a mathematical algorithm that connects the most similar isolates to each other using the minimum allele span possible. Epidemiological data can easily be overlaid to enhance a MST if desired.
Non-endemic: Includes immigration-related cases where illness was acquired outside of Canada.
Outbreak: Outbreak-related cases of disease are one of a number of affected individuals associated with an increased occurrence of the same infectious disease, whose illness is confirmed through a public health partner (ON, AB, BC and QC sentinel sites) on the basis of laboratory and/or epidemiological evidence.
Shigatoxigenic Escherichia coli (STEC): Escherichia coli are normal intestinal inhabitants in humans and animals, and most strains do not cause enteric disease. However, the group of shigatoxigenic E. coli includes certain toxin-producing strains that can cause severe diarrhea and, in some people (particularly young children), a form of acute kidney failure called hemolytic uremic syndrome.
Significant: The term "significant" in this report has been reserved for statistically significant findings (i.e. p < 0.05).
Travel: Travel-related cases of disease (excludes non-endemic cases) are individuals who travelled outside of Canada, and where the travel dates overlap with the expected disease incubation period (varies depending on the pathogen).
Whole genome multilocus sequence typing (wgMLST) analysis methodFootnote 1 : Allele information from coding regions of new sequences are compared with an existing allele database that contains all genes used to create the scheme. Whole genome MLST schemes contain the whole or pan genome, which includes all core genes in addition to any accessory genes.
Abbreviations
- AB:
- Alberta
- BC:
- British Columbia
- CFIA:
- Canadian Food Inspection Agency
- CIPARS:
- Canadian Integrated Program for Antimicrobial Resistance Surveillance
- CNDSS:
- Canadian Notifiable Disease Surveillance System
- FBCP:
- Frozen Breaded Chicken Products
- FNC:
- FoodNet Canada
- MST:
- Minimum Spanning Tree
- NESP:
- National Enteric Surveillance Program
- NML:
- National Microbiology Laboratory
- NT:
- Not Tested
- ON:
- Ontario
- PCR:
- Polymerase chain reaction
- PHAC:
- Public Health Agency of Canada
- QC:
- Quebec
- RLS:
- Réseau local de services
- SE:
- Salmonella Enteritidis
- STEC:
- Shigatoxigenic Escherichia coli
- WGS:
- Whole Genome Sequencing
Chapter 1: An introduction to the Quebec sentinel site
Chapter highlights
- The FoodNet Canada sentinel site in Quebec was officially established in July 2019.
- From July to December 2019, the top three pathogens among reported cases were Campylobacter (53%), Salmonella (18%) and Giardia (15%).
- Retail and farm manure sampling were implemented throughout 2019 in collaboration with CIPARS.
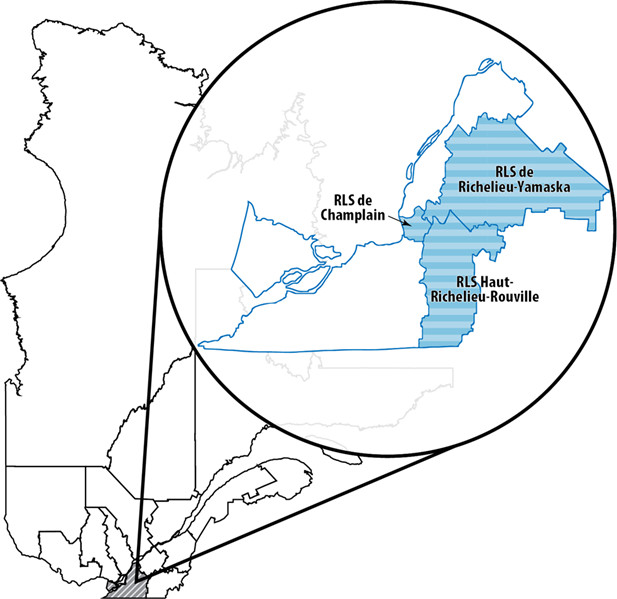
The fourth FoodNet Canada sentinel site was officially established in July 2019, in the Région sociosanitarie de la Montérégie, in Quebec.
The QC site includes the territories of three RLS regions including Richelieu-Yamaska, Haut-Richelieu-Rouville and Champlain-Charles LeMoyne, and has approximately 640,000 residents.
Ongoing surveillance in the Quebec site will help inform trends over time and allow for integrated analyses with the other sentinel sites.
Cases of reported human illness
Two hundred and ninety-five cases of enteric illness were reported from July to December in 2019 in the QC sentinel site.
All cases reported in the QC site by pathogen from July to December 2019:
- Campylobacter (n=156): 53%
- Salmonella (n=53): 18%
- Giardia (n=43): 15%
- Cryptosporidium (n=12): 4%
- STEC (n=11): 4%
- Yersinia (n=9): 3%
- Shigella (n=6): 2%
- Listeria (n=5): 2%
Sixty percent of reported cases were classified as endemic (177 cases).
Indicators of severity for endemic cases
- 9% of cases were hospitalized
- 44% of cases visited an emergency room
- 53% of cases were prescribed antibiotics
Listeria cases (n=5) are not included in the calculations for the cases who visited an emergency room or were prescribed antibiotics as this information is not collected.
Retail and farm sampling
Retail and farm manure sampling were implemented throughout 2019 in collaboration with CIPARS.
Retail sampling
In QC, the prevalence of Salmonella in retail chicken breast was higher than Campylobacter. QC had the highest prevalence of Salmonella in chicken breast across all the sentinel sites in 2019 (46%) compared to 23% for BC, 15% for ON and 12% for AB.
The prevalence of Listeria monocytogenes was highest in frozen breaded chicken products and pork sausage, but Listeria was also found in chicken breast and ground beef.
STEC was not commonly recovered from retail samples, with no ground beef and only one pork sausage with a positive identification (O187:NM).
Retail sampling occurred from March-June and September-December 2019 in the QC site.
| Sample type | Salmonella | Campylobacter | Listeria | STEC |
|---|---|---|---|---|
| Chicken breast | 46% (22/48) |
29% (14/48) |
10% (5/48) |
NT |
| Frozen breaded chicken products | 14% (4/29) |
NT | 13% (6/46) |
NT |
| Ground beef | NT | NT | 8% (4/48) |
0% (0/45) |
| Pork sausage | 3% (1/30) |
NT | 13% (6/48) |
2% (1/45) |
| NT indicates the samples were not tested. | ||||
Farm sampling
Similar to retail chicken breast, there was a higher prevalence of Salmonella in broiler chicken manure and turkey manure than Campylobacter in QC. However, the prevalence of Campylobacter was higher than Salmonella in swine manure.
When comparing QC to the other sentinel sites, there were multiple differences identified (see Table 1.2).
Regarding contact with poultry, 17.6% of endemic Campylobacter and Salmonella human cases had contact with poultry in the QC sentinel site, the highest of all FoodNet Canada sites. The next highest was in ON with 14.3% of cases, followed by 10.6% in AB and 7.2% in BC, for the same time period (July to December 2019).
Farm broiler chicken and swine manure sampling occurred January to December 2019 and turkey manure sampling occurred February to December 2019 in the QC site.
| Sample type | Pathogen | Quebec sentinel site | Other sentinel sites |
|---|---|---|---|
Turkey Manure |
Campylobacter | 46% | 70% (BC) |
| Salmonella | 72% | 83% (ON) | |
Swine Manure |
Campylobacter | 62% | 73% (ON) |
| Salmonella | 35% | 3% (AB) | |
Broiler Chicken Manure |
Campylobacter | 17% | 33% (AB), 35% (BC) |
| Salmonella | 78% | 14% (AB), 37% (ON) |
Chapter 2: Listeria monocytogenes
Chapter highlights
- The rate of invasive listeriosis remains relatively low but Listeria still remains a risk for severe illness.
- The elderly are at higher risk for invasive listeriosis with 71 being the median age of FNC cases.
- Raw or undercooked ground beef is a potential source for Listeria infection.
While invasive listeriosis is an uncommon disease in Canada, pregnant people, the elderly, and those who are immunocompromised, are populations considered to be at higher risk for severe complications and illness.Footnote 2 Footnote 3
The incidence rate for invasive listeriosis in 2019, for all FNC sites overall, was 0.45 per 100,000 population, which is comparable to the nationally reported rate of 0.47 per 100,000 population.Footnote 4 Footnote 5
Reported cases of invasive listeriosis to FNC in 2019
- 11 cases were reported (10 endemic cases, 1 case was lost to follow-up).
- 55% of cases were female.
- 71 was the median age of cases.
- 80% of endemic cases were hospitalized.
- 30% of endemic cases deceased; however, it is unknown if Listeria contributed (and to what extent) to the cause of death.
Small stores (e.g., butcher shops) have a higher prevalence of Listeria on meat products sampled (with the exception of frozen uncooked breaded chicken products) versus large grocery store chains.
The prevalence of Listeria on ground beef continues to be high in 2019 (25%):
- 22% (large stores)
- 35% (small stores)
According to the Canadian Food Inspection Agency, in 2019, various foods were recalled due to possible Listeria contamination. Foods recalled were: Footnote 6
- various vegetables
- certain cheeses
- deli meats/trays
- processed chicken and salmon products
- pâté
- cured meat
- sausages/wieners
- sandwiches
Consumer awareness of foods as potential sources for Listeria continues to be important. Targeted consumer education efforts, particularly towards high risk populations continue to be of value in reducing the rate of listeriosis.
The chapters in the remainder of the report include data from the BC, AB and ON sentinel sites only.
Chapter 3: Salmonella Enteritidis (SE)
Chapter highlights
- Significant decrease in the annual incidence rate for endemic SE infections since 2017.
- Significant decrease in the percent of samples positive for SE for FBCP and broiler chicken farms since 2018.
- Majority (87%) of 2019 retail, farm and water SE isolates sequenced fell within a human WGS cluster.
Integrated trends across components (human, retail, farm)
The incidence rate for endemic SE was 3.0 cases per 100,000 population across all sites in 2019 (Figure 3.1). This is the lowest rate reported between 2015 and 2019.
The % of samples positive for SE decreased for retail chicken breast, FBCP and on broiler farms (Figure 3.1).
- Significant decrease for FBCP and broiler chicken farms compared to 2018.
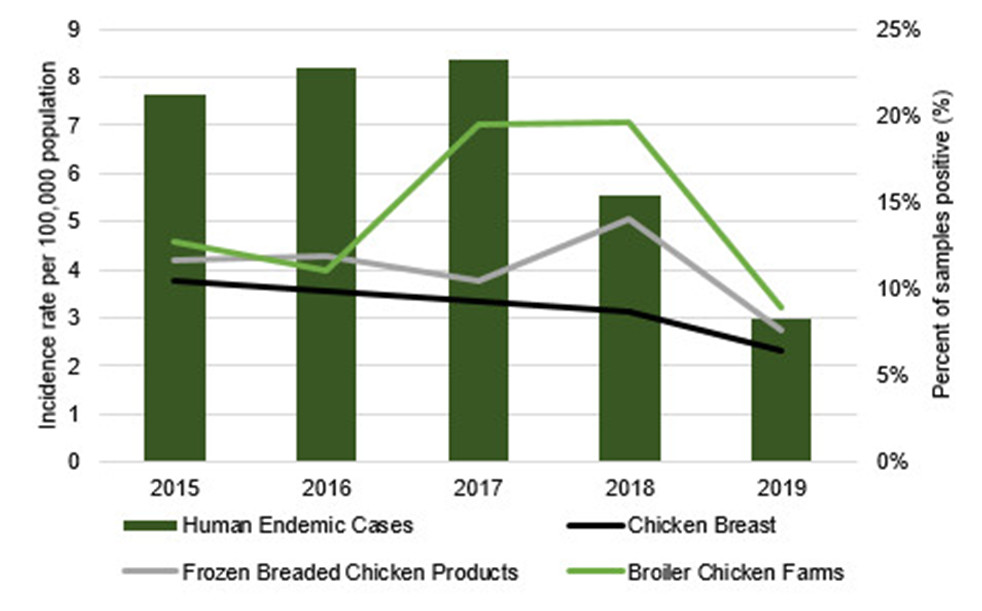
Figure 3.1 - Text description
Figure 3.1 shows a bar chart that depicts the annual human incidence rate per 100,000 population for endemic Salmonella Enteritidis (SE) cases and line graphs that depict the annual percentage of retail chicken breast samples, frozen breaded chicken products (FBCP) samples and broiler chicken manure samples positive for SE for the combined FoodNet Canada sentinel sites (Ontario, Alberta, British Columbia), 2015-2019. The left y-axis (vertical) presents the incidence rate per 100,000 population while the right y-axis (vertical) presents the percentage of samples positive. The x-axis (horizontal) presents the year. 2019 includes cooked and uncooked FBCP.
| Measure | Human cases and sample type | 2015 | 2016 | 2017 | 2018 | 2019 |
|---|---|---|---|---|---|---|
| Incidence rate per 100,000 population | Human endemic cases | 7.62 | 8.19 | 8.34 | 5.56 | 3.00 |
| Percent of samples positive (%) | Chicken breast | 10.45 | 9.87 | 9.23 | 8.70 | 6.39 |
| Frozen breaded chicken products | 11.69 | 11.90 | 10.49 | 14.05 | 7.67 | |
| Broiler chicken farms | 12.66 | 11.01 | 19.48 | 19.62 | 8.91 |
Reduction in SE
In the AB site, the prevalence of SE has significantly decreased in chicken breast and broiler manure since 2018. Similarly, the incidence rate of endemic SE cases in the AB site has been decreasing since 2017.
Intervention programs applied at the breeder flock level in AB in mid-2018 (i.e., vaccination of broilers at day old) may explain some of the reduction in SE prevalence. Footnote 7
The significant decrease of SE observed on FBCP is associated with the CFIA directive to industry.
This directive required the mandatory implementation of measures at the manufacturing level to reduce Salmonella to below detectable amounts in FBCP that are packaged for retail sale by April 1, 2019. Footnote 8
Salmonella serovar trends
Top serovars
SE was the most common serovar identified in 2019 among:
- FNC human endemic cases
- Retail poultry products (chicken breast and FBCP)
S. Kentucky was the top serovar identified among broiler chicken farms in 2019.
- In 2019, a higher proportion of endemic Salmonella cases in the BC site were Enteritidis compared with the AB and ON sites.
- The proportion of endemic Salmonella cases that were Enteritidis decreased in all sites in 2019 compared to 2018.
| Sentinel site | ON | BC | AB | All sites | |
|---|---|---|---|---|---|
2019 |
Enteritidis | 81% | 49% | 70% | 66% |
| Other | 19% | 51% | 30% | 34% | |
SE compared to 2018 |
↓13.7% | ↓10.2% | ↓25.6% | ↓18.9% | |
Incidence rates for human endemic SE cases by site
| Sentinel site | 2015-2018 | 2019 |
|---|---|---|
| BC | 10.7 | 5.3 |
| AB | 8.1 | 2.7 |
| ON | 2.6 | 1.2 |
The overall incidence rate for endemic SE cases decreased in 2019 compared to previous years (Figure 3.1).
When looking at the sentinel site level, notable decreases were observed in each of the sites in 2019 compared to 2015-2018.
- Significant decrease for BC and AB
Non-human SE trends
Proportion of Salmonella positive isolates that were SE decreased in broiler chicken farms and on retail chicken breast in 2019 (Figure 3.2).
- No SE identified in broiler chicken farms and chicken breast in ON in 2019.
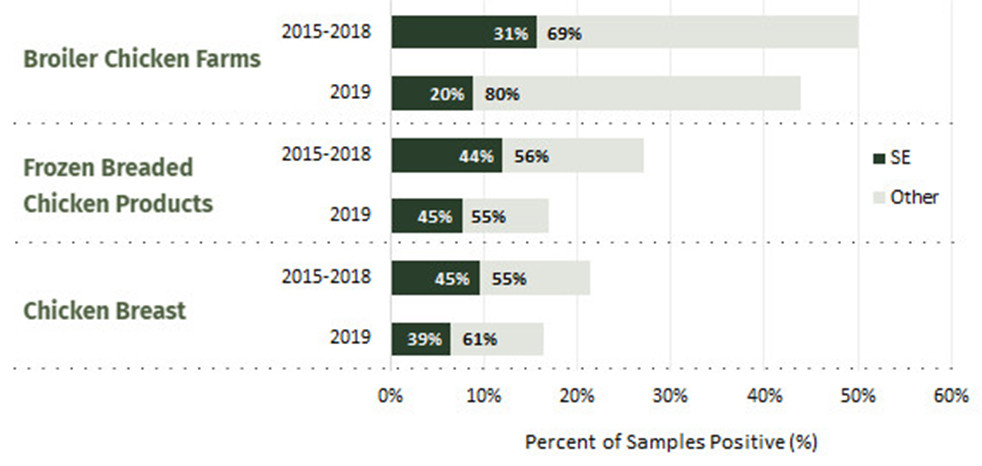
Figure 3.2 - Text description
Figure 3.2 shows a bar chart that depicts the percentage of retail chicken breast samples, frozen breaded chicken products (FBCP) samples and broiler manure samples positive for Salmonella (shown with proportion of Salmonella Enteritidis (SE)) for the combined FoodNet Canada sentinel sites (Ontario, Alberta, British Columbia) in 2019 compared with 2015-2018. The x-axis (horizontal) presents the percent of samples positive and the y-axis (vertical) presents the sample type.
| Sample type | Year(s) | Percentage positive for Salmonella | Proportion SE | Proportion other serovars |
|---|---|---|---|---|
| Broiler chicken farms | 2015-2018 | 50% | 31% | 69% |
| 2019 | 44% | 20% | 80% | |
| Frozen breaded chicken products | 2015-2018 | 27% | 44% | 56% |
| 2019Footnote * | 17% | 45% | 55% | |
| Chicken breast | 2015-2018 | 21% | 45% | 55% |
| 2019 | 16% | 39% | 61% | |
|
||||
FBCP samples
CFIA's directiveFootnote 8 increased availability of cooked products.
FNC began sampling cooked FBCP in 2019 (28% of products).
Only uncooked FBCP were found to be positive for SE
- Majority collected/produced prior to the CFIA directive
- Also included products not part of the directive (e.g. made with whole muscle cuts), which remain a risk for SE infection
Regional differences of Salmonella serovars among broiler chicken farms, 2019
| ON | BC | AB |
|---|---|---|
Kentucky (59%) Liverpool (24%) Other (18%) |
Kentucky (52%) Enteritidis (27%) Other (21%) |
Schwarzengrund (24%) Enteritidis (18%) Other (59%) |
S. Enteritidis was not identified in broiler chicken farms in 2019 in ON.
Large increase in the proportion of Salmonella positive samples identified as S. Kentucky in ON between 2018 and 2019 (0% vs 59%, respectively).
The proportion of Salmonella positive samples identified as SE decreased between 2018 and 2019 in both AB (44% vs 18%, respectively) and BC (38% vs 27%, respectively).
The majority of the 'Other' category was comprised of S. Johannesburg for BC. This is considered a rare serovar reported among human clinical isolates, with two cases of S. Johannesburg reported to NESP in 2019. Footnote 9 There was a large diversity of serovars in the 'Other' category for AB.
SE is the most common cause of human salmonellosis and is the serovar most frequently isolated from retail poultry products. While other serovars (e.g., Kentucky) are prominent among the food and animal samples collected, they do not appear to cause a high burden of human disease.
SE trends with frozen breaded chicken products
Consumption of FBCP by endemic SE cases in the combined FNC sites decreased in 2019: 27% in 2018 vs 19% in 2019. A larger decrease was seen in cases 0-17 years old compared to cases 18+ years old.
| Age Group | 2018 (%) | 2019 (%) |
|---|---|---|
| 0-17 | 42% | 29% |
| 18+ | 19% | 17% |
| Total | 27% | 19% |
In addition to the decrease in endemic SE cases reporting consumption of FBCP, there was also a significant decrease in the percent of FBCP samples that tested positive for SE in 2019 compared to 2018.
These decreases seem to be driven in part by the CFIA directive that went into effect on April 1, 2019.Footnote 8
Product recalls, increased risk communications and media coverage warning the public about the risk of Salmonella infection associated with eating uncooked FBCP may also explain the lower prevalence of consumption of FBCP among SE endemic cases. Footnote 10
Cooking practices
An increase was observed in microwave use for cooking FBCP (3% in 2018 vs 33% in 2019) among SE cases.
However, the oven continued to be the most popular method of cooking in 2019 (58%).
CFIA's directive led to increased availability of 'fully cooked' products on the market. Cooking instructions for these products include the option for microwave cooking. Footnote 11 This could explain the observed increase in microwave cooking practices among SE cases reporting consumption of FBCP.
Whole genome sequencing (WGS) trends
Ongoing WGS of Salmonella isolates, including S. Enteritidis isolates, has contributed to the integrated and timely analysis of human, retail, farm, and water data. This has enhanced the detection of emerging issues and our understanding of pathogen transmission pathways.
Salmonella Enteritidis isolates recovered from FoodNet Canada retail, farm and water 2019 samples were sequenced and analyzed to assess their inclusion in human WGS clusters defined by PulseNet Canada: Footnote 12
- Eighty-five isolates were sequenced
- 74 isolates (87%) fell within a human WGS cluster.
| Sample type | Number of isolates sequenced |
Number (and percent) of isolates that fell within a human WGS cluster |
|---|---|---|
| Broiler chicken manure | 31 | 30 (97%) |
| Frozen breaded chicken products | 28 | 19 (68%) |
| Chicken breast | 25 | 24 (96%) |
| Irrigation water | 1 | 1 (100%) |
Farm-level: The 31 broiler chicken manure isolates were from 14 farms. Of these farms, 93% (13/14) had a SE isolate that fell within a human WGS cluster (30 isolates).
These 74 FoodNet Canada farm, retail and water isolates fell within 17 human WGS clusters:
- Of these 17 human WGS clusters, 4 included multiple sample types.
- 94% of clusters included FBCP isolates (16/17). Eighty-four percent of FBCP isolates were from January to June 2019 (16/19).
| Sample type(s) (number of isolates) | Number of clusters |
|---|---|
| FBCP (16) | 13 |
| Chicken breast (1), FBCP (1) | 1 |
| Chicken breast (1), broiler chicken manure (1) | 1 |
| Chicken breast (4), FBCP (1), irrigation water (1) | 1 |
| Chicken breast (18), FBCP (1), broiler chicken manure (29) | 1 |
| Total | 17 |
Frozen breaded chicken products
While the prevalence of SE decreased in FBCP, we continued to see a large proportion of SE clusters containing these samples in 2019. However, 84% of these samples were from January to June 2019, reflecting product that may have been on the shelf before and shortly after the CFIA directive.
Whole genome sequencing patterns 2017 to 2019
Salmonella Enteritidis FoodNet Canada human, retail, farm and water isolates from 2017 to 2019 were sequenced and analyzed together. Minimum spanning trees were used to look at the data.
Minimum spanning tree (MST) analyses found six distinct groupings among the 2017-2019 SE FNC isolates.
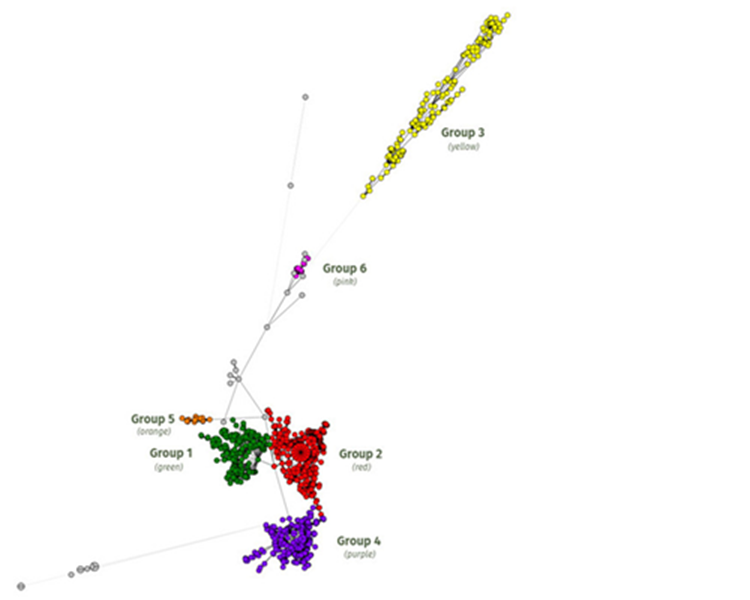
Figure 3.3 - Text description
Figure 3.3 shows a minimum spanning tree (MST) of FoodNet Canada (FNC) human, retail, farm and water Salmonella Enteritidis isolates from 2017 to 2019. Minimum spanning tree (MST) analyses found six distinct groupings among the isolates. Groups 1 (green), 2 (red) and 4 (purple) contain the majority of FNC endemic cases, along with retail (poultry, pork), farm (poultry, swine) and water (irrigation) isolates. Group 3 (yellow) contains the majority of human cases classified as international travel-related. Group 5 (orange) contains only human cases from the Alberta site (11 endemic, 3 lost to follow-up). This group emerged in 2017 and expanded in 2018; however, only two isolates were added in 2019. Group 6 (pink) is a new group identified in 2019. It contains human and retail poultry isolates. Grey circles indicate isolates that are not clustering as part of a group (ungrouped).
Groups
Groups 1, 2 and 4:
Contain the majority of FNC endemic cases, along with retail (poultry, pork), farm (poultry, swine) and water (irrigation) isolates.
Group 3:
Contains the majority of human cases classified as international travel-related.
Group 5:
Contains only human cases from the AB site (11 endemic, 3 lost to follow-up). This group emerged in 2017 and expanded in 2018; however, only two isolates were added in 2019.
Group 6:
New group identified in 2019. Contains human and retail poultry isolates.
Ungrouped: (grey circles)
Isolates not clustering as part of a group.
WGS integrated analysis has demonstrated that predominant strains of SE differ by region. Endemic SE lineages within each region persist across the farm-to-fork continuum.
Continued analysis of WGS data in conjunction with other FNC data sources, such as human case questionnaire and animal health data, will provide further evidence to help inform action among regulators and industry groups.
International travel-related SE cases
For more information on international travel and enteric infections, see Chapter 7.
Thirty-one percent (40/129) of all SE cases were related to international travel in 2019.
The incidence rate of travel-related infections of SE for all sites combined remained stable between 2018 and 2019.
The rate decreased in the AB and ON sites, but slightly increased in the BC site.
Of these 2019 travel-related SE cases, the majority (34/40) travelled to the Americas (Central, South and the Caribbean).
- Mexico (62%)
- Cuba (26%)
- Jamaica (9%)
- Dominican Republic (3%)
Region of travel reported in 2019 among Salmonella Enteriditis cases classified as international travel-related:
- Americas (Central, South and Caribbean) (85.0%; n=34)
- Asia (12.5%; n=5)
- Europe (2.5%; n=1)
WGS of international travel-related SE cases
International travel-related cases from 2017 to 2019 were analyzed. Within group 3 (see above) there were 110 international travel-related cases. The majority (83.6%) of these cases travelled to Mexico (44.5%), Cuba (29.1%) and the Dominican Republic (10.0%).
A closer look at Mexico….
Of the cases that reported travel to Mexico:
- 38.8% travelled to the East coast
- 59.2% travelled to the West coast
- Travel location was unknown for one case (2.0%)
Regional differences
WGS analysis of isolates from these top 3 travel destinations showed that the majority of SE sequences clustered by country (Figure 3.4).
The majority of isolates from cases that reported travel to the west coast of Mexico clustered separately from cases that reported travel to the east coast of Mexico (Figure 3.5).
- West Coast: Travel to Mexican states that connect to the Pacific Ocean/Gulf of California
- East Coast: Travel to Mexican states that connect to the Gulf of Mexico/Caribbean Sea
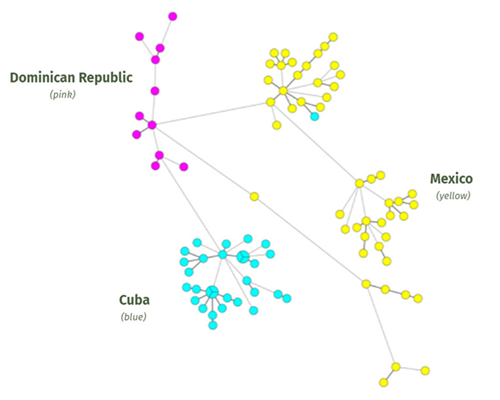
Figure 3.4 - Text description
Figure 3.4 shows the minimum spanning tree of Salmonella Enteritidis (SE) cases for the top three travel destinations, 2017-2019. Whole genome sequencing analysis of isolates from these top 3 travel destinations showed that the majority of SE sequences clustered by country (Mexico shown in yellow, Cuba shown in blue and Dominican Republic shown in pink).
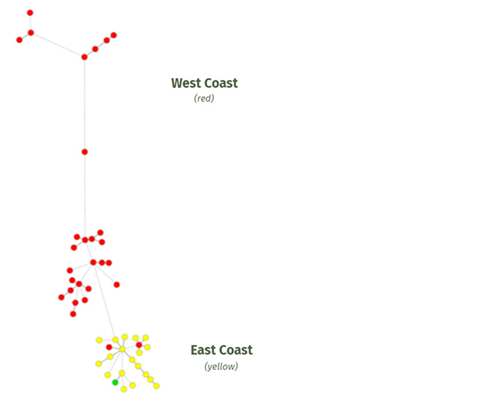
Figure 3.5 - Text description
Figure 3.5 shows the minimum spanning tree of Salmonella Enteritidis cases for the top travel destination (Mexico), 2017-2019. The majority of isolates from cases that reported travel to the west coast of Mexico (shown in red) clustered separately from cases that reported travel to the east coast of Mexico (shown in yellow).
- Footnote *
-
One case had an unknown coast (green)
The use of WGS for enteric disease surveillance is helping to better inform our understanding of incubation periods for target pathogens and more accurately assign case classifications. For example, we are able to identify cases that travelled outside of their incubation periods who closely cluster with other travel-acquired isolates. Therefore, analyzing WGS results may help us refine our case classification categories.
Chapter 4: Poultry
Chapter highlights
- As poultry products can be contaminated with Salmonella and Campylobacter, proper food handling of these products is important to reduce illness.
- In addition to proper food handling, contact with poultry may also be an important source of illness. In 2019, contact with poultry was found to be a significant risk factor for Campylobacter.
Poultry contact and meat products are key sources of infection for Campylobacter and Salmonella.
- Campylobacteriosis was the most common enteric illness reported in 2019 in all FNC sites, with an endemic incidence rate of 20 cases per 100,000 population.
- Salmonellosis was the second most common enteric illness reported in 2019 in all FNC sites, with an endemic incidence rate of 9 cases per 100,000 population.
Exposures to poultry among human endemic cases in 2019
| Exposure | Salmonella | Campylobacter |
|---|---|---|
| Farm | 4% of cases had contact with poultry | 14% of cases had contact with poultry |
Handling |
31% of cases handled raw chicken | 32% of cases handled raw chicken |
| 44% of cases handled or prepared any eggs or foods containing raw egg | 42% of cases handled or prepared any eggs or foods containing raw egg | |
Consumption |
75% of cases ate chicken | 81% of cases ate chicken |
| 31% of the cases that ate eggs consumed them raw or undercooked | 37% of the cases that ate eggs consumed them raw or undercooked |
Poultry-related risk factors
Poultry-related risk factors were examined through a case-control analysis, comparing FNC 2019 endemic Campylobacter and Salmonella cases to Foodbook controls. Footnote 13
Campylobacter:
- Odds of poultry contact was 5.7x higher among cases (statistically significant)
- Odds of eating undercooked or raw eggs was 3.6x higher among cases (statistically significant)
SalmonellaFootnote i:
- Odds of eating undercooked or raw eggs was 2.8x higher among cases (statistically significant)
Visit these links for more information on poultry and egg food safety:
Farm-to-fork Salmonella serovars in 2019
Human endemic cases
The top three serovars found in endemic human cases were found in some poultry farm and retail samples, with Enteritidis more commonly found in these isolates compared to Typhimurium and Heidelberg.
- Enteritidis: 34%
- Typhimurium: 10%
- Heidelberg: 8%
- Other: 48%
Reading was the top serovar among outbreak-related cases in 2019 and was also one of the top serovars identified in turkey manure samples.
| FNC non-human samples | Broiler chicken manure | Turkey manure | Chicken breast | Frozen breaded chicken products |
|---|---|---|---|---|
| Overall prevalence | 44% | 77% | 16% | 17% |
Proportion by serovar among positive samples |
Kentucky 49.0% | Uganda 32.6% | Enteritidis 39.1% | Enteritidis 45.2% |
| Enteritidis 20.3% | Reading 30.7% | Kentucky 34.4% | Kentucky 19.4% | |
| Johannesburg 11.8% | Hadar 7.3% | Oranienburg 6.3% | Infantis 11.3% | |
| Other 19.0% | Other 29.4% | Other 20.3% | Other 24.2% |
Salmonella serovar trends across FNC components
- SE was the top serovar reported among all endemic human cases. Non-human samples positive for SE were found in broiler chicken manure, chicken breasts and FBCP.
- Many serovars in non-human samples are not causing a high burden of human illness. For example, samples positive for S. Kentucky were found in broiler chicken manure, chicken breasts and FBCP, but there were no endemic cases of human illness reported to FNC in 2019.
Whole genome sequencing patterns for Salmonella
Salmonella isolates recovered from 2019 FNC samples of poultry retail and farm manure were sequenced and analyzed to determine their relatedness to human WGS clusters defined by PulseNet Canada. Footnote 14
Fifty-one percent of these isolates (255/497) fell within a human WGS cluster, reflecting the importance of poultry as a potential risk factor for Salmonella infection.
| Sample type | Turkey manure | Chicken breast | Frozen breaded chicken products | Broiler chicken manure |
|---|---|---|---|---|
| % related | 73% | 53% | 44% | 22% |
| Serovar breakdown | Reading 41.9% Uganda 39.4% Hadar 6.3% Other 12.5% |
Enteritidis 70.6% Oranienburg 11.8% Indiana 8.8% Other 8.8% |
Enteritidis 70.4% Heidelberg 14.8% Other 14.8% |
Enteritidis 88.2% Schwarzengrund 8.8% Reading 2.9% |
| Total number analyzed | 218 | 64 | 62 | 153 |
SE comprised the majority of isolates that fell within a human WGS cluster among broiler chicken manure, chicken breast, and FBCP. SE was not identified among turkey manure samples.
Although Kentucky was the top serovar identified among broiler chicken farms in 2019, none of these isolates were found to fall within a human WGS cluster. This reflects that Kentucky does not appear to cause a high burden of human disease.
Emergence of S. Reading in turkey (includes QC site data)
S. Reading was among the top 5 overall FNC human Salmonella serovars in 2019. The prevalence of S. Reading in CIPARS retail turkey and FNC/CIPARS farm turkey samples increased in 2019 compared to previous years (Figure 4.1).
In 2019, the majority of S. Reading positive CIPARS retail turkey and FNC/CIPARS farm turkey samples fell within a human WGS cluster, including a national outbreak of S. Reading with 130 confirmed human cases. Footnote 15
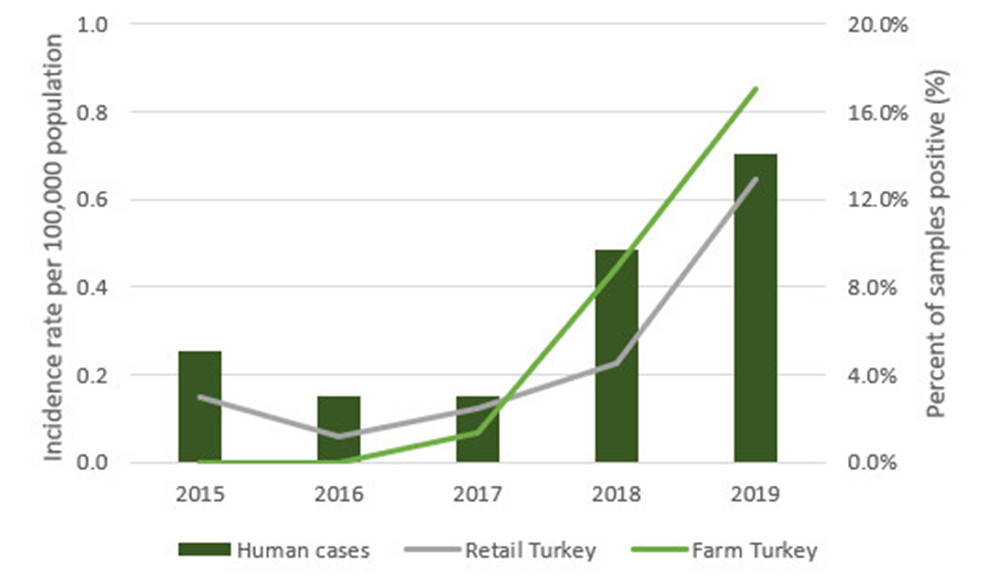
Figure 4.1 - Text description
Figure 4.1 shows a bar chart that depicts the annual human incidence rate per 100,000 population for FoodNet Canada (FNC) Salmonella Reading cases and line graphs that depict the annual percentage of Canadian Integrated Program for Antimicrobial Resistance Surveillance (CIPARS) retail turkey samples and shared FNC/CIPARS farm turkey samples positive for S. Reading for the combined sentinel sites (Ontario, Alberta, British Columbia and Quebec), 2015-2019. The left y-axis (vertical) presents the incidence rate per 100,000 population while the right y-axis (vertical) presents the percentage of samples positive. The x-axis (horizontal) presents the year.
| Measure | Human cases and sample type | 2015 | 2016 | 2017 | 2018 | 2019 |
|---|---|---|---|---|---|---|
| Incidence rate per 100,000 population | Human cases | 0.26 | 0.15 | 0.15 | 0.48 | 0.70 |
Percent of samples positive (%) |
Retail turkey | 2.98 | 1.19 | 2.48 | 4.50 | 12.92 |
| Farm turkey | 0.00 | 0.00 | 1.37 | 8.89 | 17.04 |
Farm-to-fork Campylobacter species in 2019
| - | Species | Human endemic cases | Broiler chicken manure | Turkey manure | Chicken breast |
|---|---|---|---|---|---|
| Overall incidence rate and prevalence | - | 20 cases per 100,000 population |
28% | 57% | 42% |
Proportion by species among cases and positive samples |
C. jejuni | 89.2% | 90.8% | 63.0% | 89.0% |
| C. coli | 6.1% | 9.2% | 31.5% | 11.0% | |
| Other | 4.7% | 0% | 5.6% | 0% |
Campylobacter species across FNC components
C. jejuni was the primary Campylobacter species identified among human cases, retail chicken breast samples, broiler chicken manure and turkey manure across all sentinel sites.
In 2019, 2.2% of Campylobacter human cases were determined to be C. upsaliensis. Human cases of C. upsaliensis have been associated with exposure to household pet dogs. Footnote 16
Chapter 5: Shigatoxigenic Escherichia coli
Chapter highlights
- Increased incidence rate of STEC over the last couple of years reflects an increase in testing of non-O157. Increased non-O157 STEC infections has improved the ability to identify exposure sources.
- Exposure to irrigation water, beef manure and pork meat products sold at the retail level continue to present a risk to public health.
- In 2019, O157 cases reported more severe illness compared to non-O157 cases.
STEC by the numbers
- 142 cases reported to FNC sentinel sites in 2019
- 63.1% visited the emergency roomFootnote iii
- 6.76 cases per 100,000 population
- 9.5% were admitted to hospitalFootnote iv
A change in non-O157
In June of 2018, the Alberta site began testing all STEC human clinical samples for non-O157 in addition to continuing O157 testing. Prior to this change, FNC reported annual non-O157 incidence rates of:
- 0.72 per 100,000 in 2015
- 0.50 per 100,000 in 2016
- 0.94 per 100,000 in 2017
Following this change, FNC reported annual non-O157 incidence rates of:
- 2.32 per 100,000 in 2018
- 3.95 per 100,000 in 2019
During this same period (2015-2019), incidence rates of O157 did not vary. The increase in incidence rate of non-O157 after a change in testing policy suggests that previously non-O157 had been under-diagnosed.
High-risk exposures
When comparing the exposures of endemic cases reported to FNC, there were two exposures that were significantly higher in STEC cases than other enteric pathogens.
| Exposure | STEC | Other enteric pathogensFootnote v |
|---|---|---|
| Attended or worked at a day care or day home | 10.7% | 3.1% |
| Visited or worked on a farm, petting zoo, or fair | 25.6% | 14.4% |
Indicators of severity: O157 vs non-O157
Adding to the existing body of evidence, data from multiple components of FNC found that indicators of severity are higher in O157 than non-O157.
Compared to non-O157, O157 was found to have...
- higher proportion of bloody diarrhea in clinical cases reported in 2019 (significant)
- higher proportion of vomiting in clinical cases reported in 2019
- higher proportion of ER visits and hospitalizations for clinical cases reported in 2019
- higher proportion of virulence genes encoded (stx2, eae, hly) in farm and retail samples from 2015-2019 (significant)
STEC seasonality
In 2019, endemic STEC cases reported to FNC showed a strong seasonal trend.
The incidence rate for cases with onset of illness in the summer was 2x greater than in the spring, and about 4x greater than in the winter or fall.
Higher incidence rates were also observed in the summer from 2015 to 2018.
STEC across FNC components
| FNC components | Serogroups | Human (Endemic cases) |
Pork sausage | Ground beef | Feedlot beef manure | Irrigation water | Surface water |
|---|---|---|---|---|---|---|---|
| Prevalence of STEC in food, animal and environmental samples | - | N/A | 4.9% | 3.1% | 12.0% | 27.3% | 26.7% |
| Proportion by serogroup among cases and positive samplesFootnote vi Footnote 17 | O157 | 41.6% | 0% | 0% | 35.7% | 0% | 0% |
| O26 | 22.1% | 0% | 0% | 0% | 9.8% | 0% | |
| O103 | 6.5% | 0% | 0% | 0% | 0% | 0% | |
| O121 | 5.2% | 5% | 0% | 0% | 2.4% | 0% | |
| O111 | 3.9% | 0% | 0% | 0% | 0% | 0% | |
| O145 | 2.6% | 0% | 0% | 0% | 0% | 0% | |
| O45 | 0% | 0% | 0% | 0% | 7.3% | 0% | |
| Other | 18.2% | 95% | 100% | 64.3% | 80.5% | 100% |
While 36% of STEC isolated from beef manure samples were positive for O157 in 2019, no O157 was isolated from any FNC retail samples tested. Due to improvements in hygiene practices and control measures in Canadian beef processing plants from 1996 to 2016, Footnote 18 the prevalence of STEC in ground beef at retail has declined since 2000 and has shown consistently low (<5%) prevalence among FNC retail beef samples in the last 5 years.
Surface water sampling was introduced in the Ontario sentinel site in 2019. Although STEC was present in over 25% of samples, none were top 7 subtypes of clinical significance.
O26 continues to be among the top serogroups causing human illness, and among the top serogroups identified among irrigation water samples.
Chapter 6: Parasites
Chapter highlights
- Drinking untreated or raw water, canoeing, kayaking, hiking or camping, and swimming in natural waters were found to be potential risk factors for Giardia infection.
- In 2019, there was an increase in travel-related Cryptosporidium cases compared to 2015 to 2018. The introduction of more sensitive testing methods may be contributing to the changes identified in incidence rates.
Notable changes in laboratory methods
- PCR laboratory testing methods were introduced in 2017 in ON and 2019 in BC and AB for the detection of Giardia and Cryptosporidium.
- These methods improve the ability to detect these pathogens compared to non-PCR based methods. Footnote 19
- The uptake of PCR laboratory testing methods may explain changes observed in incidence rates within FNC sentinel sites.
Parasites at a glance (2019)
| Parasite | Giardia | Cryptosporidium | CyclosporaFootnote vii |
|---|---|---|---|
| Number of cases reported | 256 | 102 | 6 |
| Number of cases per 100,000 population | 12.2 | 4.9 | 0.29 |
| Incidence rate | Highest incidence rate since 2015 | Highest incidence rate since 2015 | Lowest incidence rate since 2015 |
| Travel-related cases | 29.3% | 49.0% | 33.3% |
Giardia and endemic sex-based differences (2015-2019)
- 64% of endemic Giardia cases reported to FNC were male.
- Higher incidence rates were observed among male Giardia cases compared to female cases across almost all age groups (except 0-4).Footnote viii
- Similar to FNC cases, other countries have observed more cases of Giardia among males. Footnote 20 Footnote 21 Footnote 22
Endemic environmental exposures and behaviours
| Environmental exposure | Sex | Giardia | Other enteric pathogensFootnote ix |
|---|---|---|---|
Drinking untreated or raw water |
Female | 12.1% | 1.3% |
| Male | 20.5% | 2.6% | |
Canoeing, kayaking, hiking or camping |
Female | 26.2% | 6.3% |
| Male | 27.1% | 8.7% | |
Swimming in natural waterFootnote x |
Female | 22.7% | 6.9% |
| Male | 19.3% | 7.3% |
Exposures including drinking untreated or raw water, canoeing, kayaking, hiking or camping, and swimming in natural water were reported much more frequently in cases of Giardia than other pathogens combined between 2015-2019.
Although similar levels of water activity exposures were reported between males and females, male cases of Giardia were more likely to report drinking untreated or raw water.
Identified risk factors of Giardia cases from other countries include swimming in or drinking from natural bodies of water,Footnote 22 international travel,Footnote 22 Footnote 23 contact with animals or wildlife, Footnote 23 and male-male sexual contact. Footnote 22
Cryptosporidium and travel
For more information on international travel and enteric infections, see Chapter 7.
There were 3.1 times more travel-related cases of Cryptosporidium in 2019 than in 2015-2018.
- 2015-2018: Average of 16 travel-related cases reported each year
- 2019: Total of 50 travel-related cases reported
| Cryptosporidiosis | Case classification | 2015 | 2016 | 2017 | 2018 | 2019 |
|---|---|---|---|---|---|---|
Incidence rate per 100,000 population |
Endemic | 1.99 | 2.61 | 1.84 | 3.19 | 1.95 |
| Travel | 0.97 | 0.60 | 0.70 | 0.92 | 2.38 | |
| Total | 3.27 | 3.82 | 2.78 | 4.83 | 4.86 |
There were a greater number of cryptosporidiosis cases related to international travel in 2019 compared to the 2015-2018 average.
This increase was not observed in endemic cases, where the incidence rate has remained relatively stable since 2015.
However, there was a substantial increase in the travel-related incidence rate among cases of cryptosporidiosis in 2019, which was consistent across sentinel sites and across travel destinations.
Discussion
The overall incidence rate of international travel-related cryptosporidiosis was 2.38 cases per 100,000 population across all sites in 2019. This is the highest rate reported between 2015 and 2019.
It is unclear if the cause of this increase is a true rise in internationally-acquired cryptosporidiosis or due to other reasons such as the change to more sensitive testing methods.
FNC will continue to monitor and research cases of cryptosporidiosis for more information.
Chapter 7: Travel
Chapter highlights
- International travel continues to be a risk for gastrointestinal illness in Canadians.
- 25% of reported cases of enteric disease between 2015-2019 were related to international travel.
- Among these international travel related cases, the top three pathogens reported were Campylobacter, Salmonella, and Giardia.
Note: For this chapter, international travel-related outbreak cases and cases of S. Typhi and S. Paratyphi were excluded.
Burden related to travel
Overall, 25% of FNC cases were classified as international travel-related (2015-2019).
| Pathogen | International travel-related | OtherFootnote xi |
|---|---|---|
| Campylobacter | 22% | 78% |
| Salmonella | 26% | 74% |
| Giardia | 29% | 71% |
| Shigella | 53% | 47% |
| Cryptosporidium | 29% | 71% |
| STEC | 22% | 78% |
| Yersinia | 15% | 85% |
| Cyclospora | 70% | 30% |
International travel-related cases
The majority of international-travel related cases from 2015 to 2019 had Campylobacter (32%) or Salmonella (29%).
- Campylobacter (32.4%)
- Salmonella (28.7%)
- Giardia (16.3%)
- Shigella (6.1%)
- Cryptosporidium (5.9%)
- STEC (4.8%)
- Yersinia (3.4%)
- Cyclospora (2.4%)
Region of travel
- 46%: Americas (Central, South, Caribbean)
- 32%: Asia
- 8%: Europe
- 7%: United States of America
- 4%: Africa
- 3%: Multiple/OtherFootnote xii
Note: One case was missing region of travel and excluded.
| Country | Salmonella | Campylobacter | STEC | Cryptosporidium | Giardia | Cyclospora | Shigella | Yersinia | Listeria |
|---|---|---|---|---|---|---|---|---|---|
| Canada (endemic cases) | 27.9% | 41.5% | 5.7% | 5.1% | 10.2% | 0.2% | 1.9% | 7.2% | 0.3% |
Mexico (n=487) |
38.2% | 22.0% | 11.3% | 8.4% | 6.6% | 6.4% | 6.0% | 1.2% | 0% |
India (n=223) |
9.9% | 26.9% | 3.1% | 3.1% | 41.7% | 0% | 13.0% | 2.2% | 0% |
Cuba (n=156) |
62.8% | 7.1% | 0.6% | 6.4% | 3.2% | 1.3% | 1.9% | 16.7% | 0% |
United States (n=141) |
18.4% | 46.8% | 8.5% | 4.3% | 15.6% | 0.7% | 1.4% | 4.3% | 0% |
Dominican Republic (n=59) |
55.9% | 22.0% | 3.4% | 5.1% | 5.1% | 0% | 6.8% | 1.7% | 0% |
Pakistan (n=58) |
12.1% | 12.1% | 0% | 10.3% | 51.7% | 0% | 13.8% | 0% | 0% |
While the profile of pathogens acquired by international travel varied between countries, similarities can be seen within continents.
Chapter 8: Farmers' markets
Chapter highlights
- For some meat-bacteria combinations, there is a higher prevalence of contamination on farmers' market meat samples than those sampled from grocery stores.
Farmers' market shopping has been identified as a growing trend in recent years across Canada.
In 2019, Campylobacter, Salmonella and STEC endemic casesFootnote xiii with onset dates from May to August in the ON and AB sites reported eating the following from a farmers' market/farm laneway:
- 8% produce
- 10% eggs
- 8% meat
In 2019, FNC continued targeted sampling of raw ground beef, raw chicken breast, and raw pork sausage sold at farmers' markets in AB and ON.
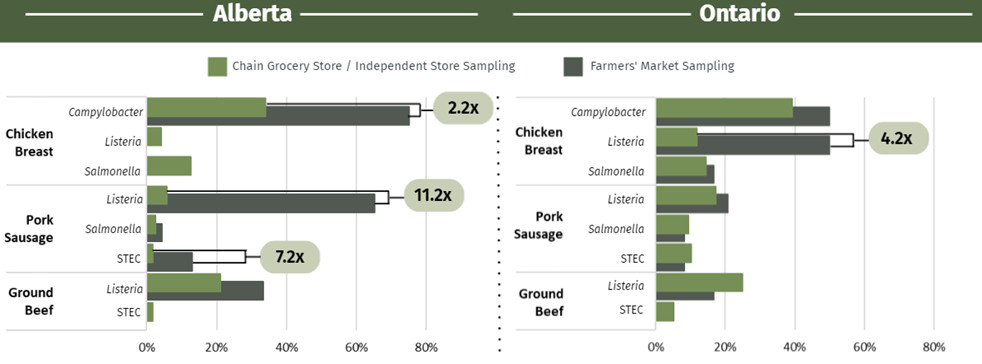
Figure 8.1: Text description
Figure 8.1 shows two bar charts side-by-side depicting the percentage of retail chicken breast samples, pork sausage samples, and ground beef samples from either chain grocery stores/independent stores or from farmers’ markets that tested positive for select pathogens in Alberta and Ontario in 2019. The x-axis (horizontal) presents the percent of samples positive, while the y-axis (vertical) presents the sample type and the pathogen tested for. Text boxes highlight the differences in proportion in the percent of samples testing positive for a specified pathogen in either Alberta or Ontario samples. Campylobacter was not tested for in pork sausage samples; Shigatoxigenic Escherichia coli (STEC) was not tested for in chicken breast samples.
| - | Sentinel site | Alberta | Ontario | ||||
|---|---|---|---|---|---|---|---|
| - | Measure | Percent of samples positive (%) | Difference in proportion | Percent of samples positive (%) | Difference in proportion | ||
| Sample type | Pathogen | Chain grocery store/independent store | Farmers' market | - | Chain grocery store/independent store | Farmers' market | - |
| Chicken breast | Campylobacter | 33.90 | 75.00 | 2.2 | 39.32 | 50.00 | Not shown |
| Listeria | 4.20 | 0.00 | Not shown | 11.97 | 50.00 | 4.2 | |
| Salmonella | 12.71 | 0.00 | Not shown | 14.53 | 16.67 | Not shown | |
| Pork sausage | Listeria | 5.83 | 65.22 | 11.2 | 17.24 | 20.83 | Not shown |
| Salmonella | 2.50 | 4.35 | Not shown | 9.48 | 8.33 | Not shown | |
| STEC | 1.80 | 13.04 | 7.2 | 10.34 | 8.33 | Not shown | |
| Ground beef | Listeria | 21.01 | 33.33 | Not shown | 25.00 | 16.67 | Not shown |
| STEC | 1.80 | 0.00 | Not shown | 5.17 | 0.00 | Not shown | |
Elevated levels of bacteria identified among retail meat samples collected from farmers' markets as compared with those collected from chain or independent grocery stores represents a potential emerging source of enteric illness. It is recommended that raw meat, poultry, fish and seafood from any source, be thoroughly cooked according to national food safety recommendations. Footnote 24
Chapter 9: Targeted seafood study
Chapter highlights
- Mussels and oysters can be contaminated with Vibrio and/or other pathogens. Therefore, ongoing monitoring and testing of shellfish products by federal food safety partners is important to understand the risk for human infection.
- Since oysters are commonly eaten raw, they pose a higher risk for causing enteric illness.
- Vibrio infections can vary from mild to severe, and in some instances can lead to death, particularly in the immunocompromised.
Background
Raw shellfish is eaten by Canadians
- According to Foodbook data, 0.4% of Canadians reported consuming raw oysters in the previous seven days.Footnote 25
- Eating raw shellfish can cause Vibrio infection
- Bacteria on raw shellfish can cause intestinal tract upset ranging from mild to severe symptoms.
Two multi-jurisdictional outbreaks of V. parahaemolyticus
- Within the past five years, two multi-jurisdictional outbreaks linked to consumption of raw shellfish have been reported in Canada. In the 2015 outbreak, 82 cases were reported, and more recently in the 2020 outbreak, 23 cases were reported. The majority of these illnesses were specifically linked to eating raw oysters. Footnote 26 Footnote 27
Methods
A targeted two-year retail seafood study sampled largely domestic raw mussels and oysters from 2018 to 2019. Samples were collected every two weeks from the BC, AB and ON FoodNet Canada sites and tested for the following pathogens: generic E. coli, Listeria, Salmonella, Vibrio, Cryptosporidium, Giardia, Toxoplasma, Hepatitis A and Norovirus.
Results
Retail store samples of raw mussels and oysters tested positive for bacteria, parasites Footnote 28 and viruses, including generic E. coli, Listeria, Salmonella (oysters only), Vibrio, Cryptosporidium, Giardia, Toxoplasma (mussels only) and Norovirus (mussels only).
The bacteria most frequently found in these samples was Vibrio. Prevalence:
- 53% of mussels
- 75% of oysters
Of the Vibrio positive mussel and oyster isolates, approximately 2/3 were V. alginolyticus and 1/4 were V. parahaemolyticus.
| Vibrio strain | Mussels (n=249) | Oysters (n=128) |
|---|---|---|
| V. alginolyticus | 47.0% | 63.3% |
| V. parahaemolyticus | 17.3% | 28.9% |
| V. cholerae | 3.2% | 7.0% |
| V. vulnificus | 3.6% | 2.3% |
| V. fluvialis | 0.0% | 0.8% |
Seasonality
The prevalence of Vibrio in raw mussels and oysters was highest from June to November. These seasonal trends align with NESP data (2018-2019), where the majority of clinical Vibrio isolates in Canada (82%) were reported from June to November. Footnote 29
Discussion
Ongoing monitoring and testing of shellfish products by federal food safety partners is important because mussels and oysters can be contaminated with Vibrio and/or other pathogens, that when eaten raw, can cause illness.
The clinical implications of the Vibrio findings in this study are unknown since the amount of bacteria on the samples was not measured.
Since oysters are commonly eaten raw (e.g., freshly shucked), this is a potential source of enteric illness.
To avoid illness from Vibrio, follow safe food handling and cooking practices for mussels and oysters. For more information visit: Shellfish food safety
Appendix A: Data collection and reporting
Each FoodNet Canada sentinel site relies on a unique partnership with the local public health authority, private laboratories, water and agri-food sectors as well as the provincial and federal institutions responsible for public health, food safety, and water safety. The sites include Ontario (Middlesex-London Health Unit), British Columbia (Fraser Health), Alberta (Calgary and Central Zones of Alberta Health Services) and Quebec (Région sociosanitaire de la Montérégie). The Ontario (ON) site data collection began in August of 2014; data from the ON pilot sentinel site (Region of Waterloo) (2005–March 2014) were not included in this report. The British Columbia (BC) site was officially established in April 2010. The province of Alberta (AB) contains the third site and data collection began in June of 2014. The fourth site was established in Quebec (QC) in July 2019. Please refer to Sentinel sites for further details on the site boundaries.
FoodNet Canada retail and farm sampling is integrated with CIPARS. This has included the streamlining and sharing of sampling and sampling sites, retrospective and prospective testing of antimicrobial resistance in selected bacteria isolated from FoodNet Canada samples, and improving data management mechanisms to maximize data linkages. CIPARS monitors trends and the relationship between antimicrobial use and antimicrobial resistance in selected bacterial organisms from human, animal, and food sources across Canada to inform evidence-based policy decision making to contain the emergence and spread of resistant bacteria. Please refer to Canadian Integrated Program for Antimicrobial Resistance Surveillance (CIPARS) page for further information about the program.
For further information on surveillance strategy, please refer to the FoodNet Canada Tables and Figures 2019 report.
Appendix B: Data considerations
As the Quebec sentinel site was established in July 2019, the data are only included in Chapter 1: Introduction to the Quebec Sentinel Site and Chapter 2: Listeria monocytogenes.
Missing responses for the severity of illness and symptom questions from the human enteric case questionnaires were included in proportion calculations. However, missing responses were excluded from proportion calculations for all risk factor questions (e.g., food, water and animal exposures). As such, the denominators for risk factor proportions may vary within a specific pathogen.
Minimum spanning trees featured in Chapter 3: Salmonella Enteritidis (SE) were generated in BioNumerics 7.6.3. Footnote 30 This is a bioinformatics software platform using the whole genome multilocus sequence typing (wgMLST) analysis method.
In 2019, the farm and retail components were active across all sentinel sites in ON, AB, BC, and QC whereas the water component was active in ON, AB and BC. A comprehensive sampling table by component is provided in Appendix C. Throughout the report, farm results are reported at the sample-level which includes all manure samples collected on each farm. For farm-level results, please refer to the FoodNet Canada Tables and Figures 2019 Report.
Appendix C: Sampling table by component
| Site | Year | Retail | Farm | Water |
|---|---|---|---|---|
BC |
2015 | Ground beef, skinless chicken breast, frozen uncooked breaded chicken products, fresh berries, fresh herbs | Broiler chickens, turkeys | Irrigation |
| 2016 | Ground beef, skinless chicken breast, frozen uncooked breaded chicken products, ground pork, ready-to-eat slaws & vegetables | Broiler chickens, turkeys | Irrigation | |
| 2017 | Ground beef, skinless chicken breast, frozen uncooked breaded chicken products, veal, frozen berries | Broiler chickens, turkeys | Irrigation | |
| 2018 | Ground beef, skinless chicken breast, frozen uncooked breaded chicken products, pork sausage, bivalve molluscs | Broiler chickens, turkeys | Irrigation | |
| 2019 | Ground beef, skinless chicken breast, frozen breaded chicken products (cooked/uncooked), pork sausage, bivalve molluscs | Broiler chickens, turkeys, dairyFootnote * | Irrigation | |
AB |
2015 | Ground beef, skinless chicken breast, frozen uncooked breaded chicken products, fresh berries, fresh herbs | Broiler chickens, feedlot beef | Irrigation |
| 2016 | Ground beef, skinless chicken breast, frozen uncooked breaded chicken products, ground pork, ready-to-eat slaws & vegetables | Broiler chickens, feedlot beef | Irrigation | |
| 2017 | Ground beef, skinless chicken breast, frozen uncooked breaded chicken products, veal, frozen berries | Broiler chickens, feedlot beef | Irrigation | |
| 2018 | Ground beef, skinless chicken breast, frozen uncooked breaded chicken products, pork sausage, bivalve molluscs | Broiler chickens, turkeys, feedlot beef | Irrigation | |
| 2019 | Ground beef, skinless chicken breast, frozen breaded chicken products (cooked/uncooked), pork sausage, bivalve molluscs | Broiler chickens, swine, turkeys, feedlot beef, dairy Footnote * | Irrigation | |
ON |
2015 | Ground beef, skinless chicken breast, frozen uncooked breaded chicken products, fresh berries, fresh herbs | Broiler chickens, swine | Surface |
| 2016 | Ground beef, skinless chicken breast, frozen uncooked breaded chicken products, ground pork, ready-to-eat slaws & vegetables | Broiler chickens, layer chickens, turkeys, swine | Not Tested | |
| 2017 | Ground beef, skinless chicken breast, frozen uncooked breaded chicken products, veal, frozen berries | Broiler chickens, layer chickens, turkeys, swine | Not Tested | |
| 2018 | Ground beef, skinless chicken breast, frozen uncooked breaded chicken products, pork sausage, bivalve molluscs | Broiler chickens, turkeys, swine | Not Tested | |
| 2019 | Ground beef, skinless chicken breast, frozen breaded chicken products (cooked/uncooked), pork sausage, bivalve molluscs | Broiler chickens, swine, turkeys, dairyFootnote * | Surface | |
| QC | 2019 | Ground beef, skinless chicken breast, frozen breaded chicken products (cooked/uncooked), pork sausage | Broiler chickens, swine, turkeys, dairyFootnote * | Not tested |
|
||||
References
- Footnote i
-
For the Salmonella analysis, the ON site was excluded due to differences in the incubation period used within the site (3 days) and Foodbook (7 days).
- Footnote ii
-
FNC human cases from BC, AB, ON and QC sites (QC site July to December 2019 only). CIPARS retail turkey samples collected from BC, AB, SK, ON and QC (partial year sampling in ON, SK and AB in 2016 to 2018) and the Atlantic Region (2015). FNC/CIPARS farm turkey samples collected from BC (2015-2019), ON (2016-2019), AB (2018-2019) and QC (2019).
- Footnote iii
-
Proportion of endemic STEC cases.
- Footnote iv
-
Proportion of endemic STEC cases.
- Footnote v
-
Other enteric pathogens includes Campylobacter, Salmonella, Giardia, Shigella, Yersinia, and Cryptosporidium.
- Footnote vi
-
Figure shows the proportion of the top 7 priority serogroups of clinically significant concern.
- Footnote vii
-
No further details on Cyclospora are provided due to low case counts.
- Footnote viii
-
Age groups: 0-4, 5-9, 10-14, 15-19, 20-24, 25-29, 30-39, 40-59, and 60+ years.
- Footnote ix
-
Other pathogens includes Campylobacter, Salmonella, STEC, Shigella, Yersinia, Cryptosporidium, and Cyclospora.
- Footnote x
-
Data only available from 2018-2019.
- Footnote xi
-
Other includes cases classified as endemic, outbreak-related, non-endemic, and lost to follow-up.
- Footnote xii
-
Includes cases that travelled to multiple countries across different regions or cases that travelled to countries that fall under 'Oceania'.
- Footnote xiii
-
Data not available for Listeria cases.
- Footnote 1
-
Nadon, C., Van Walle, I., Gerner-Smidt, P., Campos, J., Chinen, I., Concepcion-Acevedo, J., Gilpin, B., Smith, A. M., Man Kam, K., Perez, E., Trees, E., Kubota, K., Takkinen, J., Nielsen, E. M., Carleton, H., & FWD-NEXT Expert Panel. (2017). PulseNet International: Vision for the implementation of whole genome sequencing (WGS) for global food-borne disease surveillance. Euro surveillance : European communicable disease bulletin, 22(23), 30544.
- Footnote 2
-
World Health Organization and Food and Agriculture Organization of the United Nations. Risk assessment of Listeria monocytogenes in ready-to-eat foods: Microbiological risk assessment series 5. Geneva and Rome: WHO/FAO, 2004.
- Footnote 3
-
Government of Canada. Risks of listeriosis (Listeria). Available at: https://www.canada.ca/en/public-health/services/diseases/listeriosis/risk- listeriosis.html. Accessed September 2020.
- Footnote 4
-
Government of Canada. Canadian Notifiable Diseases Surveillance System online database. Available at: https://diseases.canada.ca/notifiable/charts-pre-built. Accessed September 2020.
- Footnote 5
-
Government of Canada. National Enteric Surveillance Program Annual Summary 2019: Public Health Agency of Canada, Guelph, 2020.
- Footnote 6
-
Government of Canada. 'Food recall warnings and allergy alerts' online database. Available at: https://www.inspection.gc.ca/food-recall-warnings-and-allergy- alerts/eng/1351519587174/1351519588221. Accessed September 2020.
- Footnote 7
-
A. Agunos, personal communication, September 2020.
- Footnote 8
-
Government of Canada. Questions and answers: New measures to reduce salmonella in frozen raw breaded chicken products. Available at: https://inspection.canada.ca/preventive-controls/meat/salmonella-in-frozen-raw-breaded-chicken/faq/eng/1554140834819/1554140994648. Accessed March 2022.
- Footnote 9
-
Government of Canada. National Enteric Surveillance Program Annual Summary 2019: Public Health Agency of Canada, Guelph, 2020.
- Footnote 10
-
Glass-Kaastra, S., Dougherty, B., Nesbitt, A., Viswanathan, M., Ciampa, N., Parker, S., Nadon, C., MacDonald, D., & Thomas, M.K. (2022). Estimated reduction in the burden of nontyphoidal Salmonella illness in Canada circa 2019. Foodborne Pathogens and Disease, 19(11), 744-749.
- Footnote 11
-
Janes®Ready for Anything!. Pub Style Chicken Strips. Available at: https://www.janesfoods.com/products/pub-style-chicken-strips-2/. Accessed May 2021.
- Footnote 12
-
Government of Canada. PulseNet Canada. Available at: https://www.canada.ca/en/public-health/programs/pulsenet-canada.html
- Footnote 13
-
Government of Canada. Foodbook Report. Public Health Agency of Canada, Guelph, 2015.
- Footnote 14
-
Government of Canada. PulseNet Canada. Available at: https://www.canada.ca/en/public-health/programs/pulsenet-canada.html
- Footnote 15
-
Government of Canada. Public Health Notice — Outbreak of Salmonella illnesses linked to raw turkey and raw chicken. Final Update: February 21, 2020. Available at: https://www.canada.ca/en/public-health/services/public-health-notices/2018/outbreak-salmonella-illnesses-raw-turkey-raw-chicken.html. Accessed October 2020.
- Footnote 16
-
Parsons, B.N., Porter, C.J., Stavisky, J.H., Williams, N.J., Birtles, R.J., Miller, W.G., Hart, C.A., Gaskell, R.M., & Dawson, S. (2012). Multilocus sequence typing of human and canine C. upsaliensis isolates. Veterinary Microbiology, 157(3-4), 391-397.
- Footnote 17
-
Huszczynski, G., Gauthier, M., Mohajer, S., Gill, A., & Blais, B. (2013). Method for the detection of priority Shiga toxin–producing Escherichia coli in beef trim. Journal of Food Protection, 76(10), 1689-1696.
- Footnote 18
-
Pollari, F., Christidis, T., Pintar, K.D.M., Nesbitt, A., Farber, J., Lavoie, M.C., Gill, A., Kirsch, P., & Johnson, R.P. (2017). Evidence for the benefits of food chain interventions on E. coli O157:H7/NM prevalence in retail ground beef and human disease incidence: A success story. Canadian Journal of Public Health, 108(1), e71-e78.
- Footnote 19
-
Bursle, E. (2016). Non-culture methods for detecting infection. Australian Prescriber, 39(5), 171-175.
- Footnote 20
-
Espelage, W., an der Heiden, M., Stark, K., & Alpers, K. (2010). Characteristics and risk factors for symptomatic Giardia lamblia infections in Germany. BMC Public Health, 10, 41.
- Footnote 21
-
Ellam, H., Verlander, N.Q., Lamden, K., Cheesbrough, J.S., Durband, C.A., & James, S. (2008). Surveillance of giardiasis in Northwest England 1996-2006: Impact of an enzyme immunoassay test. Eurosurveillance, 13(37).
- Footnote 22
-
Reses, H.E., Gargano, J.W., Liang, J.L., Cronquist, A., Smith, K., Collier, S.A., Roy, S.L., Eng, V., Bogard, A., Lee, B., Hlavsa, M.C., Rosenberg, E.S., Fullerton, K.E., Beach, M.J., & Yoder, J.S. (2018). Risk factors for sporadic Giardia infection in the USA: A case-control study in Colorado and Minnesota. Epidemiology and Infection, 146.
- Footnote 23
-
Zajaczkowski, P., Mazumdar, S., Conaty, S., Ellis, J.T., & Fletcher-Lartey, S.M. (2019). Epidemiology and associated risk factors of giardiasis in a peri-urban setting in New South Wales Australia. Epidemiology and Infection, 147(e15).
- Footnote 24
-
Government of Canada. Food Safety. Available at https://www.canada.ca/en/services/health/food-safety.html. Accessed August 2021.
- Footnote 25
-
Government of Canada. Foodbook Report. Public Health Agency of Canada, Guelph, 2015.
- Footnote 26
-
Government of Canada. Public Health Notice - Outbreak of Vibrio parahaemolyticus linked to raw shellfish. Final Update: October 15, 2015. Available at: https://www.canada.ca/en/public- health/services/public-health-notices/2015/public-health-notice-outbreak-vibrio-parahaemolyticus-linked-shellfish.html. Accessed September 2020.
- Footnote 27
-
Government of Canada. Public Health Notice - Outbreak of Vibrio parahaemolyticus infections linked to shellfish. Final Update: December 9, 2020. Available at: https://www.canada.ca/en/public-health/services/public-health-notices/2020/outbreak-vibrio-parahaemolyticus-infections-linked-shellfish.html. Accessed September 2020.
- Footnote 28
-
Merks, H., Boone, R., Janecko, N., Viswanathan, M., & Dixon, B.R. (2023). Foodborne protozoan parasites in fresh mussels and oysters purchased at retail in Canada. International Journal of Food Microbiology, 399, 110248.
- Footnote 29
-
Government of Canada. Personal correspondence with the National Enteric Surveillance Program (NESP) [data accessed May 9, 2023]. Public Health Agency of Canada, Guelph, 2023.
- Footnote 30
-
BioNumerics (version 7.6.3), created by bioMérieux (Applied Maths NV, St Martens Latem, Belgium).