
National Enteric Surveillance Program (NESP) annual summary 2020
Download the alternative format
(PDF format, 6.1 MB, 42 pages)
Organization: Public Health Agency of Canada
Published: 2024-XX-XX
Including serotype tables for 2020, NESP and National Microbiology Laboratory (NML)
Prepared by:
The National Microbiology Laboratory (NML), the Centre for Foodborne, Environmental and Zoonotic Infectious Diseases (CFEZID), Public Health Agency of Canada, and the provincial public health laboratories
Acknowledgements
National Enteric Surveillance Program (NESP) coordination team:
- Celine Nadon, Chief, Surveillance, Outbreak Detection and Response Section, Division of Enteric Diseases, National Microbiology Laboratory (NML)
- Sara Christianson, Chief, Diagnostic and Reference Services Section, Division of Enteric Diseases, NML
- Lori Lozinski, Surveillance Clerk, Division of Enteric Diseases, NML
- Kate Thomas, Manager, Foodborne Disease and AMR Surveillance Division (FDASD), Centre for Foodborne, Environmental and Zoonotic Infectious Diseases (CFEZID)
- Symron Bansal, Epidemiologist, FDASD, CFEZID
- Lauren Sherk, Epidemiologist, FDASD, CFEZID
Provincial laboratory partners:
- BC Centre for Disease Control Public Health Laboratory
- Alberta Precision Laboratories
- Saskatchewan Disease Control Laboratory
- Cadham Provincial Microbiology Laboratory (Manitoba)
- Public Health Ontario
- Laboratoire de santé publique du Québec (LSPQ)
- New Brunswick Public Health Laboratories
- Nova Scotia Public Health Laboratories
- Prince Edward Island Public Health Laboratories
- Newfoundland and Labrador Public Health Laboratory
Provincial/territorial epidemiology partners:
- British Columbia Centre for Disease Control
- Alberta Health
- Saskatchewan Ministry of Health
- Manitoba Health
- Public Health Ontario
- Ministère de la santé et des services sociaux du Québec
- New Brunswick Health
- Nova Scotia Department of Health and Wellness
- Prince Edward Island Department of Health and Wellness
- Newfoundland and Labrador Department of Health and Community Services
- Yukon Health and Social Services
- Northwest Territories Department Health and Social Services
- Nunavut Health and Social Services
Overview
The National Enteric Surveillance Program (NESP) is a collaboration between the Public Health Agency of Canada (PHAC) and the provincial public health laboratories. Through NESP, weekly analysis and reporting is conducted for 14 different organisms causing enteric illness, including 10 of which are nationally notifiable. The data derived from this surveillance system supports detection of multi-provincial clusters and outbreaks, guides public health interventions, and are designed to integrate with national and international efforts to limit the transmission of enteric diseases.
In 2020, a total of 10,000 isolate results were reported; a 35% decrease from the average number of notifications received in the previous five years (15,340). This decrease is likely due, in part, to the impacts of the COVID-19 pandemic. Salmonella spp. continues to be the most common organism identified with 4,919 notifications provided in 2020, representing 49% of all isolates reported. As in previous years, Salmonella Enteritidis (29%) and S. Typhimurium (10%), remain among the top 3 serotypes of all Salmonella reported in 2020. S. Newport (14%) was among the top 3 serotypes in 2020 due to a multi-jurisdictional outbreak in the summer of 2020. Collectively, these three serotypes represent 53% of all Salmonella serotypes identified.
The incidence rate of Shiga toxigenic Escherichia coli (STEC) O157 decreased compared to a relatively stable rate from 2010 to 2019, with 0.62 cases per 100,000 population reported in 2020. A decrease was also observed in the incidence rate of non-O157 STEC isolates in 2020 (0.84 cases per 100,000 population) compared to a high of 1.58 cases per 100,000 population in 2019. This is the fourth consecutive year where more non-O157 STEC isolates were reported than O157 isolates.
The incidence rate of invasive listeriosis in 2020 (0.42 per 100,000 population) is similar to what has been seen in the past 2 years. Over the 8-year period Hepatitis A has been under national surveillance, the highest incidence was reported to the program in 2019 (1.55 cases per 100,000 population) and 2020 saw a rate of 0.67 cases per 100,000 population. In contrast to previous years in which Shigella sonnei constituted the majority of Shigella species reported, in 2020 Shigella flexneri represented 57% of all Shigella reported and the rate of Shigella flexneri (0.59 per 100,000 population) was also higher than the rate of Shigella sonnei (0.40 per 100,000 population). Trends for all other Shigella species were lower in 2020 compared to previous years.
Table of contents
- Acknowledgements
- Overview
- About the National Enteric Surveillance Program (NESP)
- Laboratory-confirmed Isolate Counts & Incidence Rates
- Salmonella
- Escherichia coli
- Listeria monocytogenes
- Shigella
- Hepatitis A
Tables
- Table 1. Multi-jurisdictional Outbreak Investigations in 2020
- Table 2. Number of isolates reported to NESP by major organism group per province or territory, 2020
- Table 3. Annual national totals and rates (per 100,000 population) for enteric pathogens and organism groups reported to NESP, 2015 to 2020
- Table 4. Annual rates (per 100,000 population) of infection per province and territory for select groups of pathogens routinely reported to NESP, 2020
- Table 5. Number of isolates reported to NESP per province and territory for the ten most commonly reported Salmonella serotypes, 2020
- Table 6. National total counts (overall rank) for the ten most commonly reported Salmonella serotypes to NESP, 2015 to 2020
Figures
- Figure 1. Proportion of Salmonella serotypes causing human illness as reported to NESP, 2020 (n= 4,919)
- Figure 2. Annual counts between 2011 to 2020 for the top five non-typhoidal Salmonella serotypes reported to NESP in 2020
- Figure 3. Relative incidence rates (per 100,000 population) of S. Enteritidis, S. Newport, S. Typhimurium, and other Salmonella serotypes reported to NESP by year, 2016 to 2020 compared to the 2011 to 2015 baseline period
- Figure 4. Incidence rates (per 100,000 population) of E. coli O157, non-O157 STEC, and other non-typed E. coli reported to NESP, 1997 to 2020
- Figure 5. Distribution of non-O157 STEC serotypes reported to NESP in 2020 (n=513)
- Figure 6. Incidence rate (per 100,000 population) of the top five serotyped non-O157 STEC serotypes reported to NESP, 2011 to 2020
- Figure 7. Incidence rate (per 100,000 population) of invasive listeriosis reported to NESP by province, 2011 to 2020
- Figure 8. Incidence rate (per 100,000 population) of Shigella species reported to NESP, 1997 to 2020
- Figure 9. National and provincial incidence rate (per 100,000 population) of Hepatitis A reported to NESP, 2013 to 2020
Appendices
- Appendix A. Comparison of national totals, incidence per 100,000 population and proportion captured between the Canadian Notifiable Disease Surveillance System (CNDSS) and the National Enteric Surveillance Program (NESP) for enteric diseases, 2019
- Appendix B. Species and serotype data reported to NESP by province and territory, 2020
- Appendix C. Impacts of COVID-19. Comparison of NESP weekly isolate counts for 2020 and the average weekly isolate counts for 2015 to 2019 for select pathogens
- Figure 10. Comparison of NESP weekly isolate counts for 2020 and the average weekly isolate counts for 2015 to 2019, all Salmonella serotypes, overlaid with 2020 Canadian case counts of COVID-19
- Figure 11. Comparison of NESP weekly isolate counts for 2020 and the average weekly isolate counts for 2015 to 2019, all Salmonella serotypes excluding S. Enteritidis, overlaid with 2020 Canadian case counts of COVID-19
- Figure 12. Comparison of NESP weekly isolate counts for 2020 and the average weekly isolate counts for 2015 to 2019, S. Enteritidis, overlaid with 2020 Canadian case counts of COVID-19
- Figure 13. Comparison of NESP weekly isolate counts for 2020 and the average weekly isolate counts for 2015 to 2019, E. coli O157, overlaid with 2020 Canadian case counts of COVID-19
- Figure 14. Comparison of NESP weekly isolate counts for 2020 and the average weekly isolate counts for 2015 to 2019, non-O157 STEC, overlaid with 2020 Canadian case counts of COVID-19
- Figure 15. Comparison of NESP weekly isolate counts for 2020 and the average weekly isolate counts for 2015 to 2019, Listeria monocytogenes, overlaid with 2020 Canadian case counts of COVID-19
- Figure 16. Comparison of NESP weekly isolate counts for 2020 and the average weekly isolate counts for 2015 to 2019, Shigella, overlaid with 2020 Canadian case counts of COVID-19
About the National Enteric Surveillance Program (NESP)
In Canada, the surveillance of enteric diseases is conducted through NESP and the Canadian Notifiable Diseases Surveillance System (CNDSS)Footnote 1. NESP is jointly administered by PHAC's National Microbiology Laboratory (NML) and the Centre for Foodborne, Environmental and Zoonotic Infectious Diseases (CFEZID). Since 1997, weekly analysis and reporting on laboratory-confirmed cases of enteric illness by the provincial public health laboratories has been conducted through NESP.
NESP provides the first and most timely level of characterization (primarily species and serotype) of data critical to, and integrated with, other surveillance programs. Monitoring aggregated data allows for the rapid evaluation and response to enteric illness outbreaks. In addition, the data allows for the description of trends in pathogen subtypes and in the incidence of nationally notifiable enteric pathogens. CNDSS receives data that are collected by local health units, which is forwarded to provincial/territorial health authorities and collated by PHAC's Centre for Communicable Diseases and Infection Control (CCDIC). These data may be more representative of total numbers of annual illnesses; however, CNDSS is not designed to provide timely information required for cluster or outbreak detection. These two surveillance systems (CNDSS and NESP) are complementary in providing both epidemiological and laboratory results; however, discrepancies between them do exist. Due to the reporting protocols and requirements, CNDSS is a more reliable source of information in terms of total number of illnesses, while NESP data are more current and responsive to trends. A comparison of national case counts and incidence rates for enteric diseases is included (Appendix A).
NESP is also highly complementary to another laboratory-based surveillance system, PulseNet CanadaFootnote 2. Also administered by PHAC, PulseNet Canada collects high resolution data in real-time on cases of enteric diseases for the purpose of outbreak detection and response. Due to the additional testing performed (molecular or genomic subtyping), there are differences in turnaround time compared to weekly NESP data. Further, PulseNet Canada surveillance is conducted only for a subset of the organisms that are tracked by NESP.
Data collection
Isolates (or specimens) are submitted to provincial public health laboratories for testing and/or confirmation of the enteric pathogen. On a weekly basis, each provincial public health laboratory summarizes the number of enteric microorganisms isolated from human patients. The information details the genus, species and serotype (where appropriate). The 'report week' for NESP spans the period from Sunday to Saturday and is based on the date the laboratory test was completed, except for in Alberta, where it is based on the date received. Data are submitted to NML either directly (faxing or emailing), or by entering the data via the web-based application (webNESP) hosted on the Canadian Network for Public Health Intelligence (CNPHI). The information is submitted as soon as possible and no later than the second day after a weekend or holiday. An exception to this reporting scheme occurs when the isolate must be sent to another laboratory for completion of the identification. In this case, the isolate is reported at the level of typing or identification attained (e.g. Salmonella sp.) for the week in which it was sent to the reference laboratory. The NESP record is then updated when the final identification is received from the reference laboratory (e.g. report in week 35 that one "Salmonella sp." reported in week 33 has been confirmed as "S. Banana"). This updated information is submitted with the next weekly NESP report form.
All data submitted are aggregated by province and pathogen and do not contain any patient identifiers, locators, or other confidential information. NESP partners endeavor to include only the number of isolates from new cases identified at the laboratory that week, or updates to previously reported numbers. To avoid duplication, the provincial public health laboratories attempt to identify multiple, repeat, or follow-up specimens from the same individual, and consider all identical isolates from the same patient that are collected over a three month period as a single case.
Data collected for surveillance purposes are increasingly being generated using whole genome sequencing (WGS) instead of by classical microbiological methods. Most of the data collected by NESP, however, can be derived from whole genome sequence data in silico (e.g., species identification, serotype), ensuring that the over two decades of data used for NESP analyses will remain compatible with surveillance in the genomics era. Starting in 2018, portions of the data collected and analyzed by NESP will have been generated via WGS.
Data analysis and dissemination
Data analysis is conducted weekly by using an algorithm to determine if the current week case counts are significantly higher than the expected baseline. Statistical significance is based on the cumulative Poisson probability between the reported case count and the retrospective five-year median.
Results from the weekly analysis included in the "NESP Weekly Report" are disseminated to all provincial public health laboratories, at least one epidemiologist or Medical Officer of Health in each province/territory and multiple stakeholders at the federal level. Protocol allows sharing of the reports with other public health professionals who have an operational need to have this information, although, the weekly reports are not intended for public distribution. No response is required by public health professionals to the statistical elevations noted in the reports. The aim is to provide useful and timely information for those responsible for public health action.
In addition to NESP Weekly Reports, partners can perform real-time data analysis, examine trends and display their respective jurisdictions' data within webNESP. PulseNet Canada uses these data in conjunction with laboratory DNA fingerprinting data determined by pulsed-field gel electrophoresis (PFGE) and other molecular/genomic data to detect disease clusters and outbreaks. The resulting data analyses are also shared on CNPHI with provincial public health laboratories, the Canadian Food Inspection Agency (CFIA), Health Canada (HC), PHAC and provincial/territorial epidemiologists. The coordinated assessment of laboratory evidence collected through these complementary laboratory surveillance networks allows for the interpretation of clinical microbiological evidence during multi-jurisdictional epidemiologic investigations, as described in the Food-borne Illness Outbreak Response Protocol (FIORP)Footnote 3.
Limitations
It should be noted that there are some inherent limitations of these data. For some organisms, the number of isolates reported is a subset of laboratory isolations and may not reflect the incidence of disease at the provincial or national level. For example, Campylobacter isolates are not routinely forwarded to provincial public health or central reference laboratories for further testing beyond genus/species characterizations, and are therefore greatly under-represented in NESP. By contrast, Salmonella and E. coli O157 isolates captured by NESP are more representative of the true incidence of disease in Canada, as the number of cases reported to CNDSS and isolates reported to NESP show a high degree of concurrence for both diseases. There may be over-reporting of organisms in NESP due to reporting of multiple specimens from a single patient, but efforts are made to minimize this occurrence. Information regarding extra-intestinal isolation sites and foreign travel are not consistently reported to NESP from all provincial public health laboratories and therefore any interpretation should be considered with caution.
In March of 2020, the COVID-19 pandemic was declaredFootnote 4 and global public health action was taken to address it. Across Canada and within specific provinces/territories and regions various public health measures were put in place. These public health measures and the adaptations Canadians made to combat COVID-19 not only helped to reduce the transmission of COVID-19 but have also impacted other reported infectious diseases to varying degrees. Interpretation of the 2020 NESP data must be considered in light of these COVID-19 public health measures and adaptations (Appendix C).
Questions and correspondence may be forwarded via email to:
| Multi-jurisdictional outbreak Investigations | Number of cases-final (Canada only) | Date of first case onset | Date of last case onset | Provinces and territories with cases |
|---|---|---|---|---|
| [2020-058] [OICC: Hepatitis A cluster in BC, AB, ON and NB] [February to June] | 13 | 2019-07-28 | 2020-03-23 | BC 2 AB 1 ON 9 NB 1 |
| [2020-116] [OICC: S. Typhimurium in BC, AB, SK, ON, QC and NB] [April to December] | 31 | 2017-06-01 | 2020-10-15 | BC 3 AB 6 SK 1 ON 4 QC 16 NB 1 |
| [2020-133] [OICC: E. coli O157 in AB, BC, and MB (former OICC 2019-212)] [May to August] | 5 | 2020-03-08 | 2020-08-02 | BC 2 AB 2 MB 1 |
| [2020-137] [OICC: S. Typhimurium in AB, BC and YT] [June to December] | 10 | 2020-02-28 | 2020-09-30 | BC 5 AB 4 YK 1 |
| [2020-148] [OICC: Locally-acquired cyclosporiasis in ON, QC, NL, NB BC and NU] [June to October] | 399 | 2020-05-15 | 2020-10-08 (Specimen Collection Date) | BC 1 ON 283 QC 105 NB 2 NL 6 NU 2 |
| [2020-151] [OICC: S. Newport in AB, BC, MB, ON, SK, PE, QC and US] [July to September] | 515 | 2020-06-15 | 2020-08-29 | BC 121 AB 293 SK 35 MB 26 ON 14 QC 25 PE 1 |
| [2020-175] [OICC: S. Enteritidis in ON, QC and the US] [August to October] | 57 | 2020-06-30 (Specimen Collection Date) | 2020-09-03 (Isolation Date) | ON 41 QC 16 |
| [2020-216] [OICC: S. Oranienburg in ON, QC and NB] [September to November] | 10 | 2020-08-11 | 2020-09-22 | ON 4 QC 5 NB 1 |
| [2020-217] [OICC: Vibrio parahaemolyticus in NB, PE, QC and SK] [September to December] | 23 | 2020-07-03 | 2020-11-02 (Isolation Date) | SK 1 QC 7 NB 10 PE 5 |
| [2020-239] [OICC: E. coli O157 in BC, AB, and the US] [October to December] | 5 | 2020-07-08 | 2020-09-21 | BC 4 AB 1 |
| [2020-255] [OICC: E. coli O157:H7 in BC, MB, and the US] [November to January] | 4 | 2020-10-10 | 2020-11-12 | BC 1 MB 3 |
Laboratory-confirmed isolate counts and incidence rates
In 2020, provincial public health laboratories reported the results of 10,000 isolates of enteric pathogens to NESP, a decrease from the average number of notifications in the previous five years (15,340). The most frequently reported enteric pathogen group was Salmonella, followed by enteric viruses (Norovirus, Hepatitis A, Rotavirus and Adenovirus), and Campylobacter (Table 2). Organism isolate counts reported by province and territory in 2020 can be found in Appendix B.
| Grouptable 2 note 4 | BC | AB | SK | MB | ON | QC | NB | NS | PE | NL | YT | NT | NU | Total | % of total isolates reported |
|---|---|---|---|---|---|---|---|---|---|---|---|---|---|---|---|
| Salmonella | 760 | 741 | 148 | 180 | 1,631 | 968 | 122 | 146 | 11 | 209 | 2 | 1 | 0 | 4,919 | 49.19 |
| Campylobactertable 2 note 1 | 25 | 252 | 169 | 48 | 87 | 208 | 252 | 90 | 48 | 105 | 4 | 1 | 0 | 1,289 | 12.89 |
| Virusestable 2 note 1 | 112 | 78 | 40 | 113 | 382 | 34 | 56 | 53 | 19 | 178 | 2 | 0 | 0 | 1,067 | 10.67 |
| Parasitestable 2 note 1 | 144 | 10 | 42 | 68 | 467 | NRtable 2 note 3 | 83 | 95 | 14 | 83 | 10 | 1 | 0 | 1,017 | 10.17 |
| E. colitable 2 note 2 | 97 | 201 | 42 | 40 | 124 | 107 | 1 | 1 | 1 | 216 | 0 | 0 | 0 | 830 | 8.30 |
| Shigella | 56 | 37 | 7 | 10 | 156 | 121 | 0 | 2 | 0 | 3 | 0 | 1 | 0 | 393 | 3.93 |
| Yersinia | 101 | 27 | 10 | 4 | 114 | 18 | 2 | 3 | 0 | 2 | 2 | 0 | 0 | 283 | 2.83 |
| Listeria | 12 | 9 | 6 | 7 | 66 | 44 | 6 | 5 | 1 | 2 | 0 | 0 | 0 | 158 | 1.58 |
| Vibrio | 11 | 4 | 3 | 1 | 3 | 1 | 14 | 1 | 6 | 0 | 0 | 0 | 0 | 44 | 0.44 |
| Total | 1,318 | 1,359 | 467 | 471 | 3,030 | 1,501 | 536 | 396 | 100 | 798 | 20 | 4 | 0 | 10,000 | 100.00 |
Table 2 Notes
|
|||||||||||||||
Annual national incidence rates for the groups of enteric pathogens reported to NESP between 2015 and 2020 are shown in Table 3 and Appendix A. Isolates of E. coli O157 or non-O157 STEC, Listeria monocytogenes, Salmonella and Shigella are routinely forwarded to provincial public health laboratories, while isolates for Campylobacter, Yersinia, enteric parasites (Giardia, Cryptosporidium, Entamoeba histolytica/dispar and Cyclospora) and enteric viruses (Norovirus, Rotavirus and Adenovirus) are not routinely reported to the provincial public health or central reference laboratories. As such, NESP incidence rates are considered to be reflective of the true incidence rate for those routinely reported pathogens enabling the calculation of provincial and territorial incidence rates as shown in Table 4.
| Group | 2015 | 2016 | 2017 | 2018 | 2019 | 2020 | ||||||
|---|---|---|---|---|---|---|---|---|---|---|---|---|
| Total | Ratetable 3 note 1 | Total | Ratetable 3 note 1 | Total | Ratetable 3 note 1 | Total | Ratetable 3 note 1 | Total | Ratetable 3 note 1 | Total | Ratetable 3 note 1 | |
| E. coli O157 | 379 | 1.06 | 415 | 1.15 | 348 | 0.95 | 426 | 1.15 | 397 | 1.06 | 237 | 0.62 |
| Non-O157STECtable 3 note 2 | 229 | 0.64 | 205 | 0.57 | 361 | 0.99 | 525 | 1.42 | 595 | 1.58 | 320 | 0.84 |
| Listeria | 125 | 0.35 | 191 | 0.53 | 109 | 0.30 | 150 | 0.40 | 174 | 0.46 | 158 | 0.42 |
| Salmonella | 7,717 | 21.61 | 7,816 | 21.65 | 7,313 | 20.01 | 7,300 | 19.70 | 6,350 | 16.89 | 4,919 | 12.94 |
| Shigella | 739 | 2.07 | 807 | 2.23 | 699 | 1.91 | 784 | 2.12 | 828 | 2.20 | 393 | 1.03 |
| Campylobacter | 1,514 | 4.24 | 1,378 | 3.82 | 1,287 | 3.52 | 1,333 | 3.60 | 1,664 | 4.43 | 1,289 | 3.39 |
| Vibrio | 85 | 0.24 | 44 | 0.12 | 54 | 0.15 | 67 | 0.18 | 52 | 0.14 | 44 | 0.12 |
| Yersinia | 383 | 1.07 | 353 | 0.98 | 387 | 1.06 | 404 | 1.09 | 318 | 0.85 | 283 | 0.74 |
| Parasites | 1,845 | 5.17 | 1,921 | 5.32 | 1,679 | 4.59 | 1,675 | 4.52 | 1,639 | 4.36 | 1,017 | 2.68 |
| Viruses | 3,075 | 8.61 | 2,295 | 6.36 | 2,600 | 7.11 | 2,303 | 6.21 | 2,656 | 7.07 | 1,067 | 2.81 |
Table 3 Notes
|
||||||||||||
| Grouptable 4 note 2 | BC | AB | SK | MB | ON | QC | NB | NS | PE | NL | YT | NT | NU |
|---|---|---|---|---|---|---|---|---|---|---|---|---|---|
| E. coli O157 | 0.72 | 1.00 | 0.34 | 1.60 | 0.58 | 0.51 | 0.13 | 0.00 | 0.00 | 0.00 | 0.00 | 0.00 | 0.00 |
| Non-O157 STEC | 0.85 | 3.55 | 3.22 | 1.31 | 0.26 | 0.26 | 0.00 | 0.10 | 0.63 | 0.00 | 0.00 | 0.00 | 0.00 |
| Listeria | 0.23 | 0.20 | 0.51 | 0.51 | 0.45 | 0.51 | 0.77 | 0.51 | 0.63 | 0.38 | 0.00 | 0.00 | 0.00 |
| Salmonella | 14.76 | 16.76 | 12.56 | 13.05 | 11.07 | 11.29 | 15.61 | 14.91 | 6.89 | 40.03 | 4.76 | 2.21 | 0.00 |
| Shigella | 1.09 | 0.84 | 0.59 | 0.73 | 1.06 | 1.41 | 0.00 | 0.20 | 0.00 | 0.57 | 0.00 | 2.21 | 0.00 |
Table 4 Notes
|
|||||||||||||
Salmonella
A total of 4,919 Salmonella isolates representing 196 serotypes were reported in 2020. Salmonella Enteritidis accounted for 29% of all human salmonellosis, and together with the eight remaining most common serotypes (Figure 1), they constituted 73% of all Salmonella infections reported. National, provincial and territorial case counts for Salmonella reported in 2020 are shown in Table 5 and Appendix B.
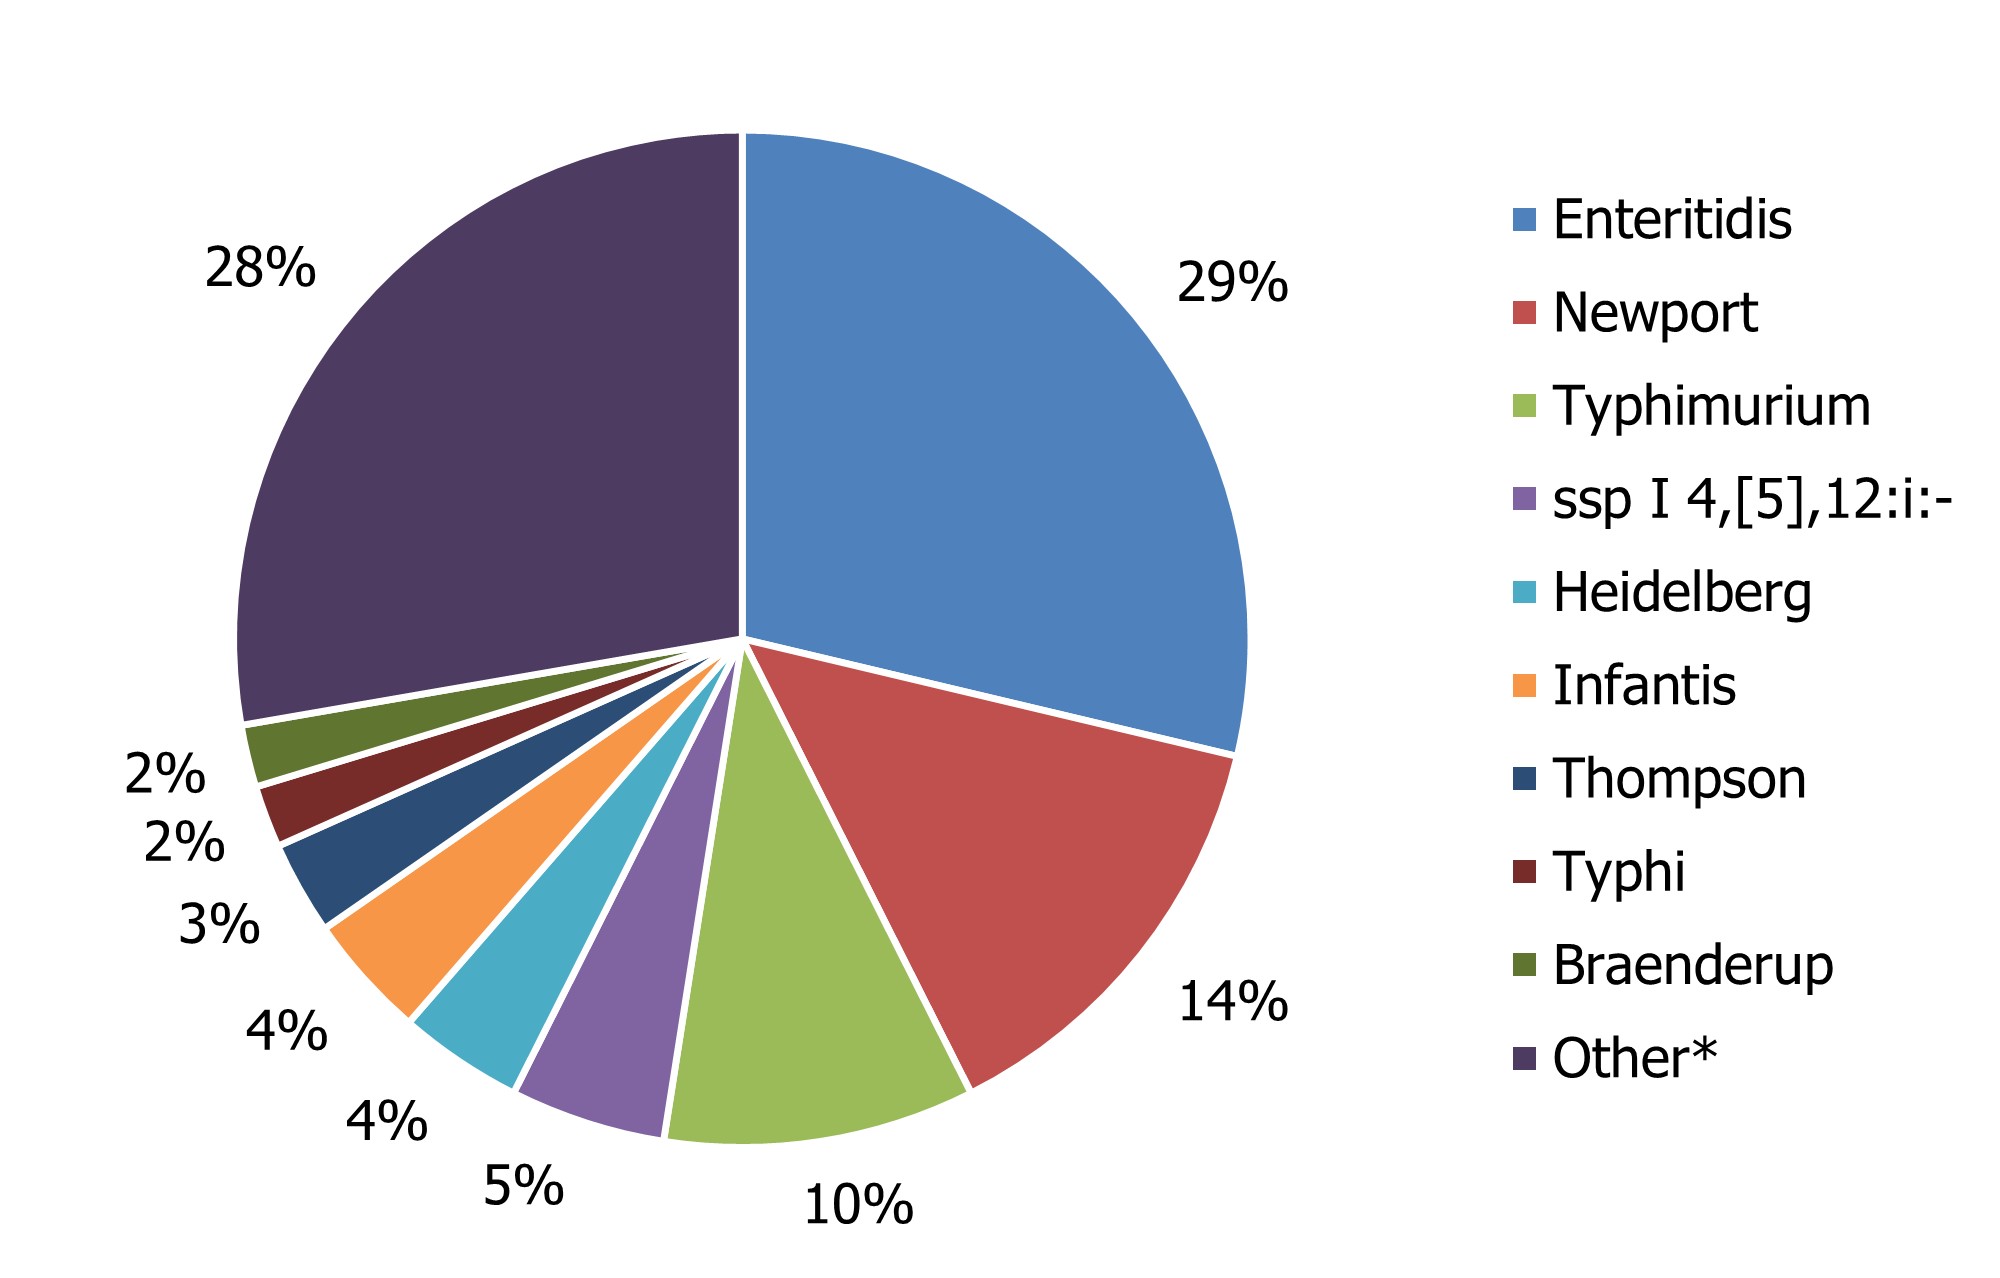
Figure 1 - Text description
| Salmonella Species | Percentage of total Salmonella |
|---|---|
| Enteritidis | 29% |
| Newport | 14% |
| Typhimurium | 10% |
| ssp I 4,[5],12:i:- | 5% |
| Heidelberg | 4% |
| Infantis | 4% |
| Thompson | 3% |
| Typhi | 2% |
| Braenderup | 2% |
| Otherfigure 1 note * | 28% |
Figure 1 Notes
|
|
*Other serotypes (1,355 isolates) were divided among 187 serotypes or incomplete antigenic profiles, and 58 isolates were reported as unspecified Salmonella species.
| Group | BC | AB | SK | MB | ON | QC | NB | NS | PE | NL | YT | NT | NU | Total | % of total Salmonella (n=4,919) |
|---|---|---|---|---|---|---|---|---|---|---|---|---|---|---|---|
| Enteritidis | 303 | 138 | 43 | 42 | 357 | 232 | 70 | 104 | 5 | 127 | 1 | 0 | 0 | 1,422 | 28.91 |
| Newport | 153 | 322 | 38 | 34 | 91 | 50 | 0 | 3 | 1 | 1 | 0 | 0 | 0 | 693 | 14.09 |
| Typhimurium | 49 | 55 | 10 | 18 | 208 | 116 | 2 | 3 | 3 | 4 | 0 | 0 | 0 | 468 | 9.51 |
| ssp I 4,[5],12:i:- | 14 | 24 | 4 | 2 | 76 | 113 | 11 | 8 | 0 | 4 | 0 | 0 | 0 | 256 | 5.20 |
| Heidelberg | 9 | 13 | 2 | 5 | 113 | 50 | 6 | 3 | 0 | 6 | 0 | 0 | 0 | 207 | 4.21 |
| Infantis | 11 | 18 | 4 | 10 | 72 | 67 | 6 | 5 | 1 | 4 | 0 | 0 | 0 | 198 | 4.03 |
| Thompson | 7 | 2 | 0 | 2 | 69 | 40 | 2 | 4 | 0 | 0 | 0 | 0 | 0 | 126 | 2.56 |
| Typhi | 20 | 11 | 7 | 5 | 59 | 11 | 0 | 0 | 0 | 0 | 0 | 0 | 0 | 113 | 2.30 |
| Braenderup | 11 | 13 | 2 | 4 | 35 | 11 | 3 | 1 | 0 | 0 | 0 | 1 | 0 | 81 | 1.65 |
| Montevideo | 6 | 3 | 0 | 1 | 8 | 52 | 1 | 0 | 0 | 0 | 0 | 0 | 0 | 71 | 1.44 |
| Total | 583 | 599 | 110 | 123 | 1,088 | 742 | 101 | 131 | 10 | 146 | 1 | 1 | 0 | 3,635 | 73.90 |
Compared to the average number of Salmonella notifications received between 2015 and 2019 (7,299 cases), there was a 32.6% decrease observed in 2020 (4,919) likely in part due to the impacts of COVID-19 and the continued impact related to CFIA regulation implemented in April 2019 to address Salmonella in frozen raw breaded chicken products (Figure 2). While S. Enteritidis remained the most common serotype over this time period, changes were observed among the other most commonly reported Salmonella serotypes (Table 6).
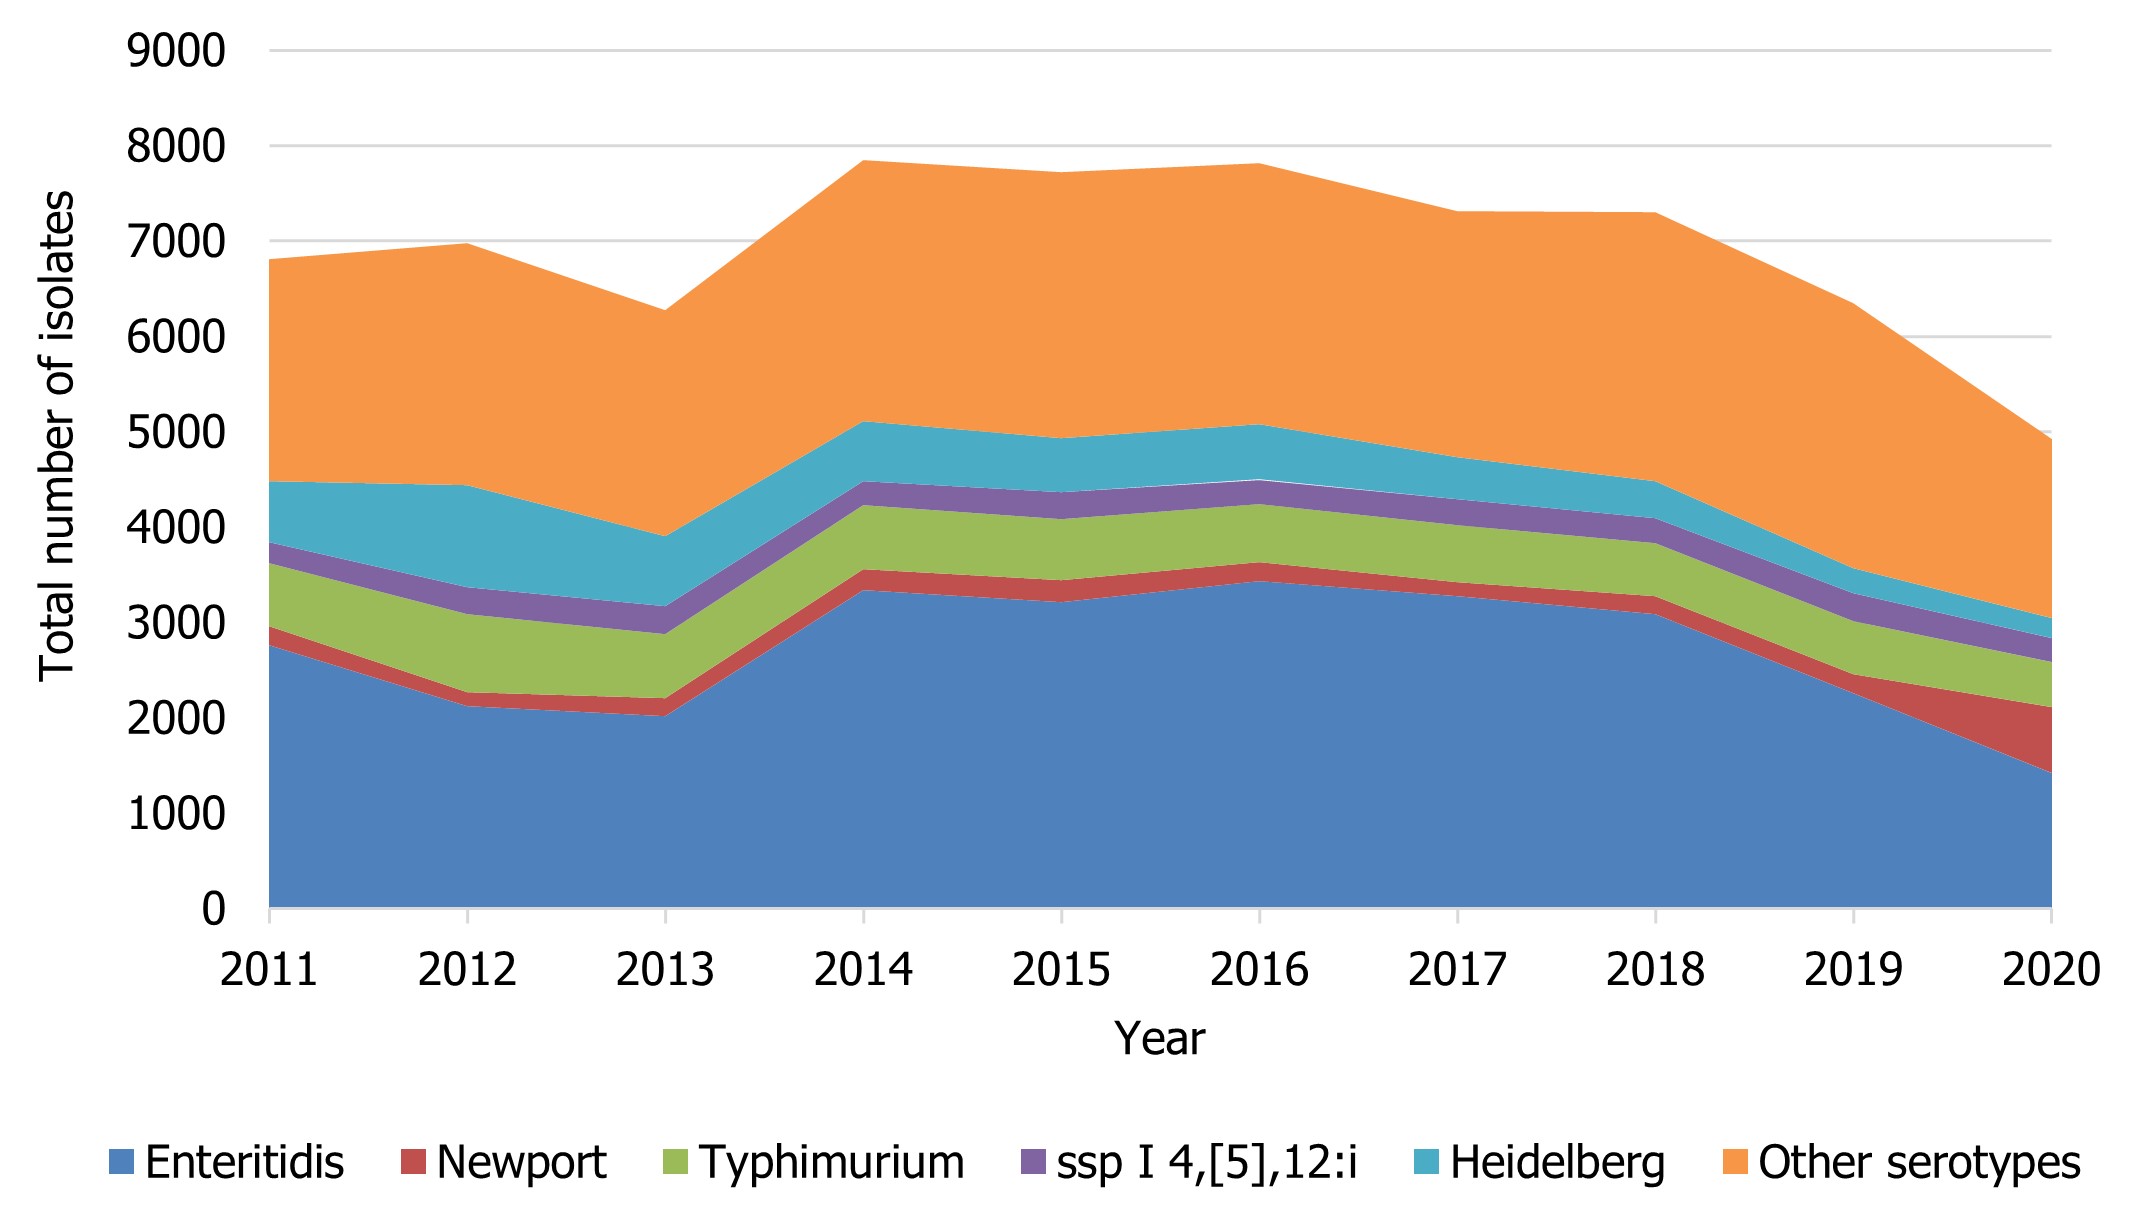
Figure 2 - Text description
| Salmonella serovar | Year | |||||||||
|---|---|---|---|---|---|---|---|---|---|---|
| 2011 | 2012 | 2013 | 2014 | 2015 | 2016 | 2017 | 2018 | 2019 | 2020 | |
| Enteritidis | 2763 | 2117 | 2019 | 3337 | 3209 | 3433 | 3278 | 3083 | 2254 | 1422 |
| Newport | 195 | 153 | 189 | 224 | 235 | 198 | 143 | 192 | 200 | 693 |
| Typhimurium | 661 | 814 | 668 | 671 | 642 | 607 | 602 | 551 | 557 | 468 |
| ssp I 4,[5],12:i | 219 | 281 | 299 | 251 | 280 | 259 | 265 | 263 | 294 | 256 |
| Heidelberg | 641 | 1071 | 733 | 628 | 571 | 580 | 444 | 390 | 267 | 207 |
| Other serotypes | 2325 | 2544 | 2362 | 2739 | 2780 | 2739 | 2581 | 2821 | 2778 | 1873 |
| Serotypes | 2015 | 2016 | 2017 | 2018 | 2019 | 2020 | Average no. of isolates (2015-2019) |
|---|---|---|---|---|---|---|---|
| Enteritidis | 3209 | 3433 | 3278 | 3083 | 2254 | 1422 | 3051 |
| Newport | 235 | 198 | 143 | 192 | 200 | 693 | 194 |
| Typhimurium | 642 | 607 | 602 | 551 | 557 | 468 | 592 |
| ssp I 4,[5],12:i:- | 280 | 259 | 265 | 263 | 294 | 256 | 272 |
| Heidelberg | 571 | 580 | 444 | 390 | 267 | 207 | 450 |
| Infantis | 279 | 378 | 244 | 313 | 264 | 198 | 296 |
| Thompson | 311 | 290 | 135 | 148 | 98 | 126 | 196 |
| Typhi | 121 | 136 | 181 | 198 | 232 | 113 | 174 |
| Braenderup | 123 | 81 | 145 | 127 | 102 | 81 | 116 |
| Montevideo | 26 | 30 | 32 | 45 | 36 | 71 | 34 |
| Oranienburg | 68 | 61 | 53 | 113 | 104 | 71 | 80 |
| Paratyphi A | 77 | 62 | 62 | 56 | 116 | 59 | 75 |
| Javiana | 136 | 114 | 111 | 118 | 143 | 50 | 124 |
| Agona | 63 | 120 | 103 | 125 | 101 | 35 | 102 |
In May 2017, PulseNet Canada began performing WGS on all Salmonella isolates submitted for routine laboratory-based surveillance, providing high discriminatory genomic subtype data for outbreak detection and response.
Salmonella Enteritidis
In 2020, 1,422 isolates of S. Enteritidis, 28.9% of all Salmonella submissions, were reported to NESP. The incidence rate observed in 2020 was 51.9% lower (3.7 cases per 100,000 population) relative to the 2011 to 2015 baseline period (7.7 cases per 100,000 population). A general decrease in incidence can be seen from 2016 to 2019 as well, suggesting that the rate observed in 2020 is part of an ongoing trend unrelated to the impacts of COVID-19 (Figure 3).
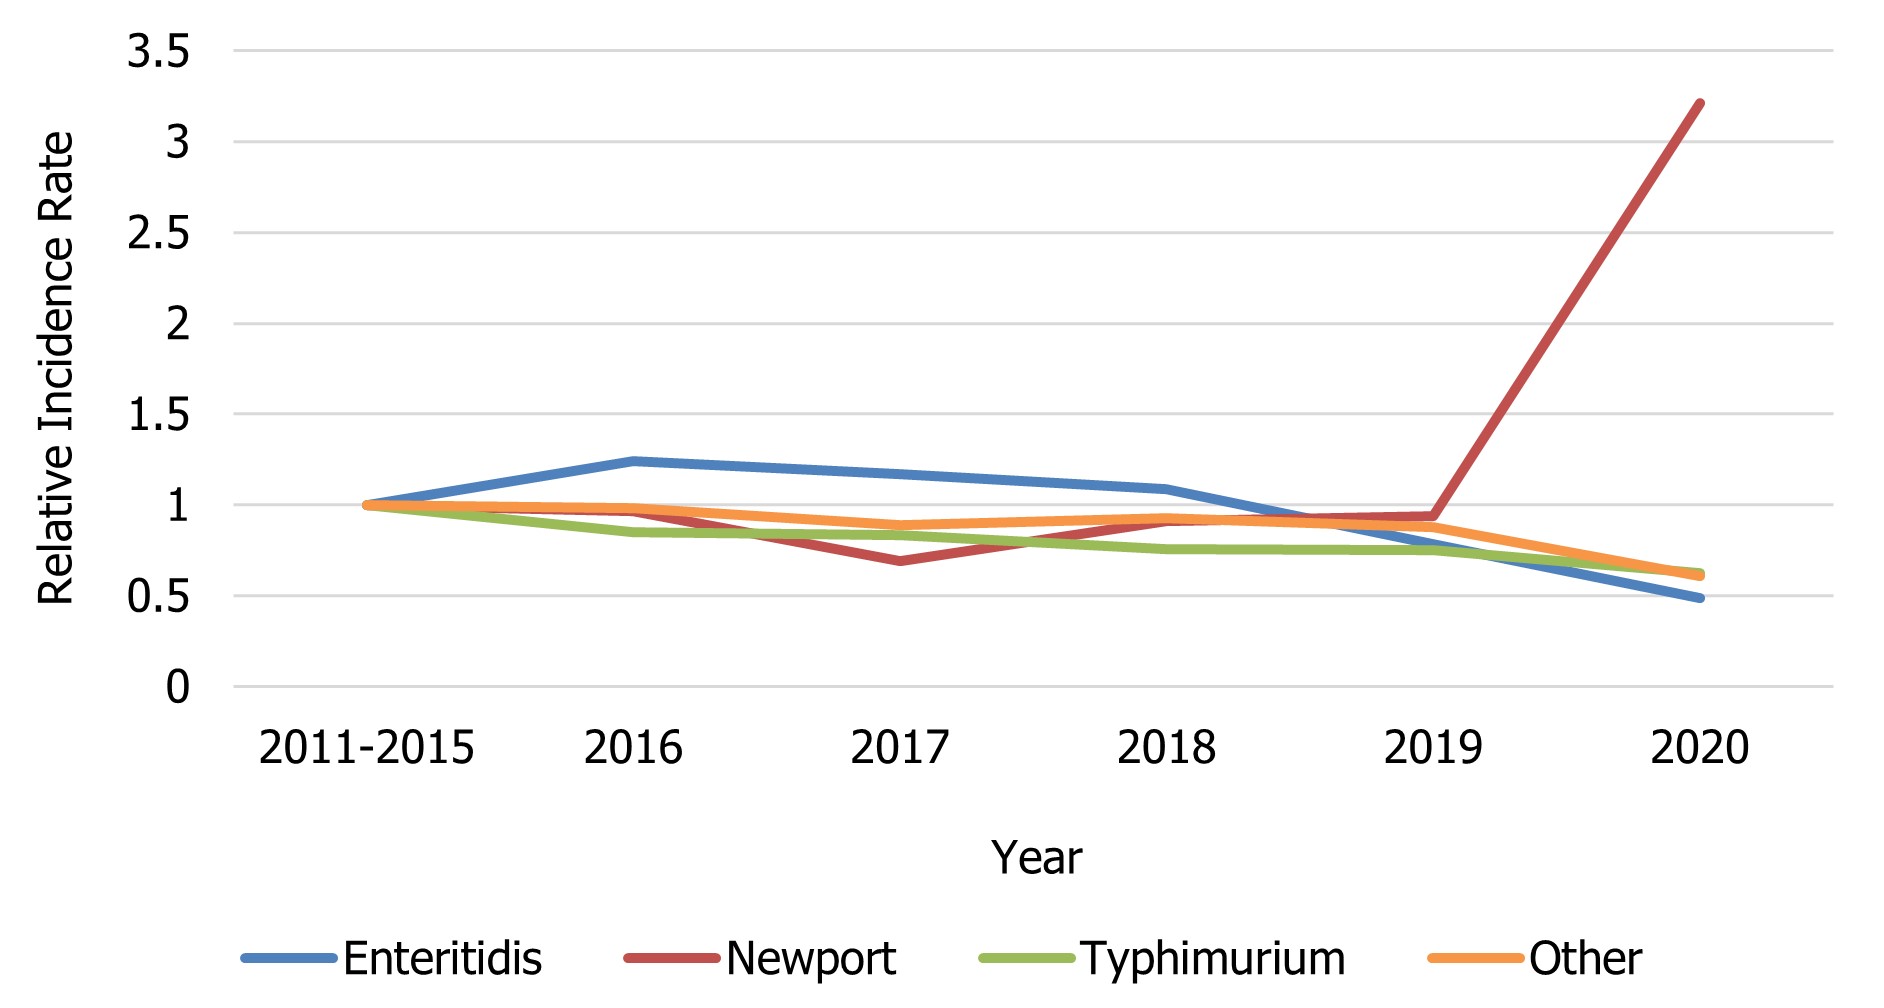
Figure 3 - Text description
| Salmonella serovar | Year | |||||
|---|---|---|---|---|---|---|
| 2011-2015 | 2016 | 2017 | 2018 | 2019 | 2020 | |
| Enteritidis | 1 | 1.24 | 1.17 | 1.09 | 0.78 | 0.49 |
| Newport | 1 | 0.97 | 0.69 | 0.91 | 0.94 | 3.21 |
| Typhimurium | 1 | 0.85 | 0.83 | 0.75 | 0.75 | 0.62 |
| Other | 1 | 0.98 | 0.89 | 0.93 | 0.88 | 0.61 |
- Figure 3 Footnote *
-
Rates are compared to the 2011 to 2015 baseline period.
Salmonella Newport
The incidence rate of S. Newport in 2020 (1.82 per 100,000) was much higher than in 2019 (0.53 per 100,000) and compared to the baseline period (0.57 per 100,000) due to a multi-jurisdictional outbreak of S. Newport consisting of 515 cases with onset dates ranging from June 15 to August 29, 2020 (Table 1).
Salmonella Typhimurium
Compared to the 2011 to 2015 baseline period, a 26% decrease in the incidence of S. Typhimurium cases was noted in 2020 (1.97 versus 1.46 cases per 100,000 population, respectively). From 2015 to 2019, a slight decreasing trend can be seen in the incidence of S. Typhimurium (Figure 3). Although S. Typhimurium continues to rank among the top 3 most common serotypes causing human salmonellosis in Canada, it represents only 10% of all Salmonella isolates reported to NESP in 2020 (Figure 1 and Table 6).
Escherichia coli
Unless otherwise indicated, it is assumed that all the samples reported to NESP from the provinces and territories are Shiga toxigenic Escherichia coli (STEC). The 2020 rate of O157 (0.62 cases per 100,000 population) is lower than the relatively stable rates seen between 2010 to 2019, likely due to the impacts of COVID-19 (Figure 4). In 2020, three provinces reported incidence rates of E. coli O157 higher than the national reported incidence rate: Alberta (1.00 cases per 100,000 population), Manitoba (1.60 cases per 100,000 population), and British Columbia (0.72 cases per 100,000 population) (Table 4). The incidence rate of non-O157 STEC decreased in 2020 (0.84 cases per 100,000 population) from 2019 (1.58 cases per 100,000 population) likely due to the impacts of the pandemic (Figure 4). This is the fourth consecutive year where the proportion of non-O157 STEC isolates reported has exceeded the proportion of O157 isolates. It should be noted that non-O157 STECare reported less consistently than E. coli O157 to NESP and therefore any changes observed over time are a reflection in testing practices by some provincial public health laboratories. Further, 6.6% of isolates were identified using culture-independent diagnostic tests (CIDT), which are PCR-based tests used for the identification of organisms without an isolate cultured. Reflex culture of a CIDT positive sample may obtain an isolate for further sub-typing, which would be updated in NESP.
Among non-O157 STEC isolates that were serotyped, in 2020, 54% of these were represented by five serotypes: E. coli O26, E. coli O111, E. coli O121, E. coli O103, and E. coli O118 (Figure 5). In 2020, 20% of non-O157 STEC did not have additional serotype information. In 2017, a request was submitted by NML to provincial public health laboratories to report the testing method used for the identification of organisms, as the use of CIDTs are becoming more prevalent in Canada.
With the exception of E. coli O121, all of the top 5 serotypes among serotyped E. coli isolates showed a decreased rate per 100,000 population in 2020 compared to 2019, likely due to the impacts of COVID-19 (Figure 6). All E. coli serotypes, including confirmed non-O157 STEC isolates, and any other reported pathotypes are summarized in Appendix B.
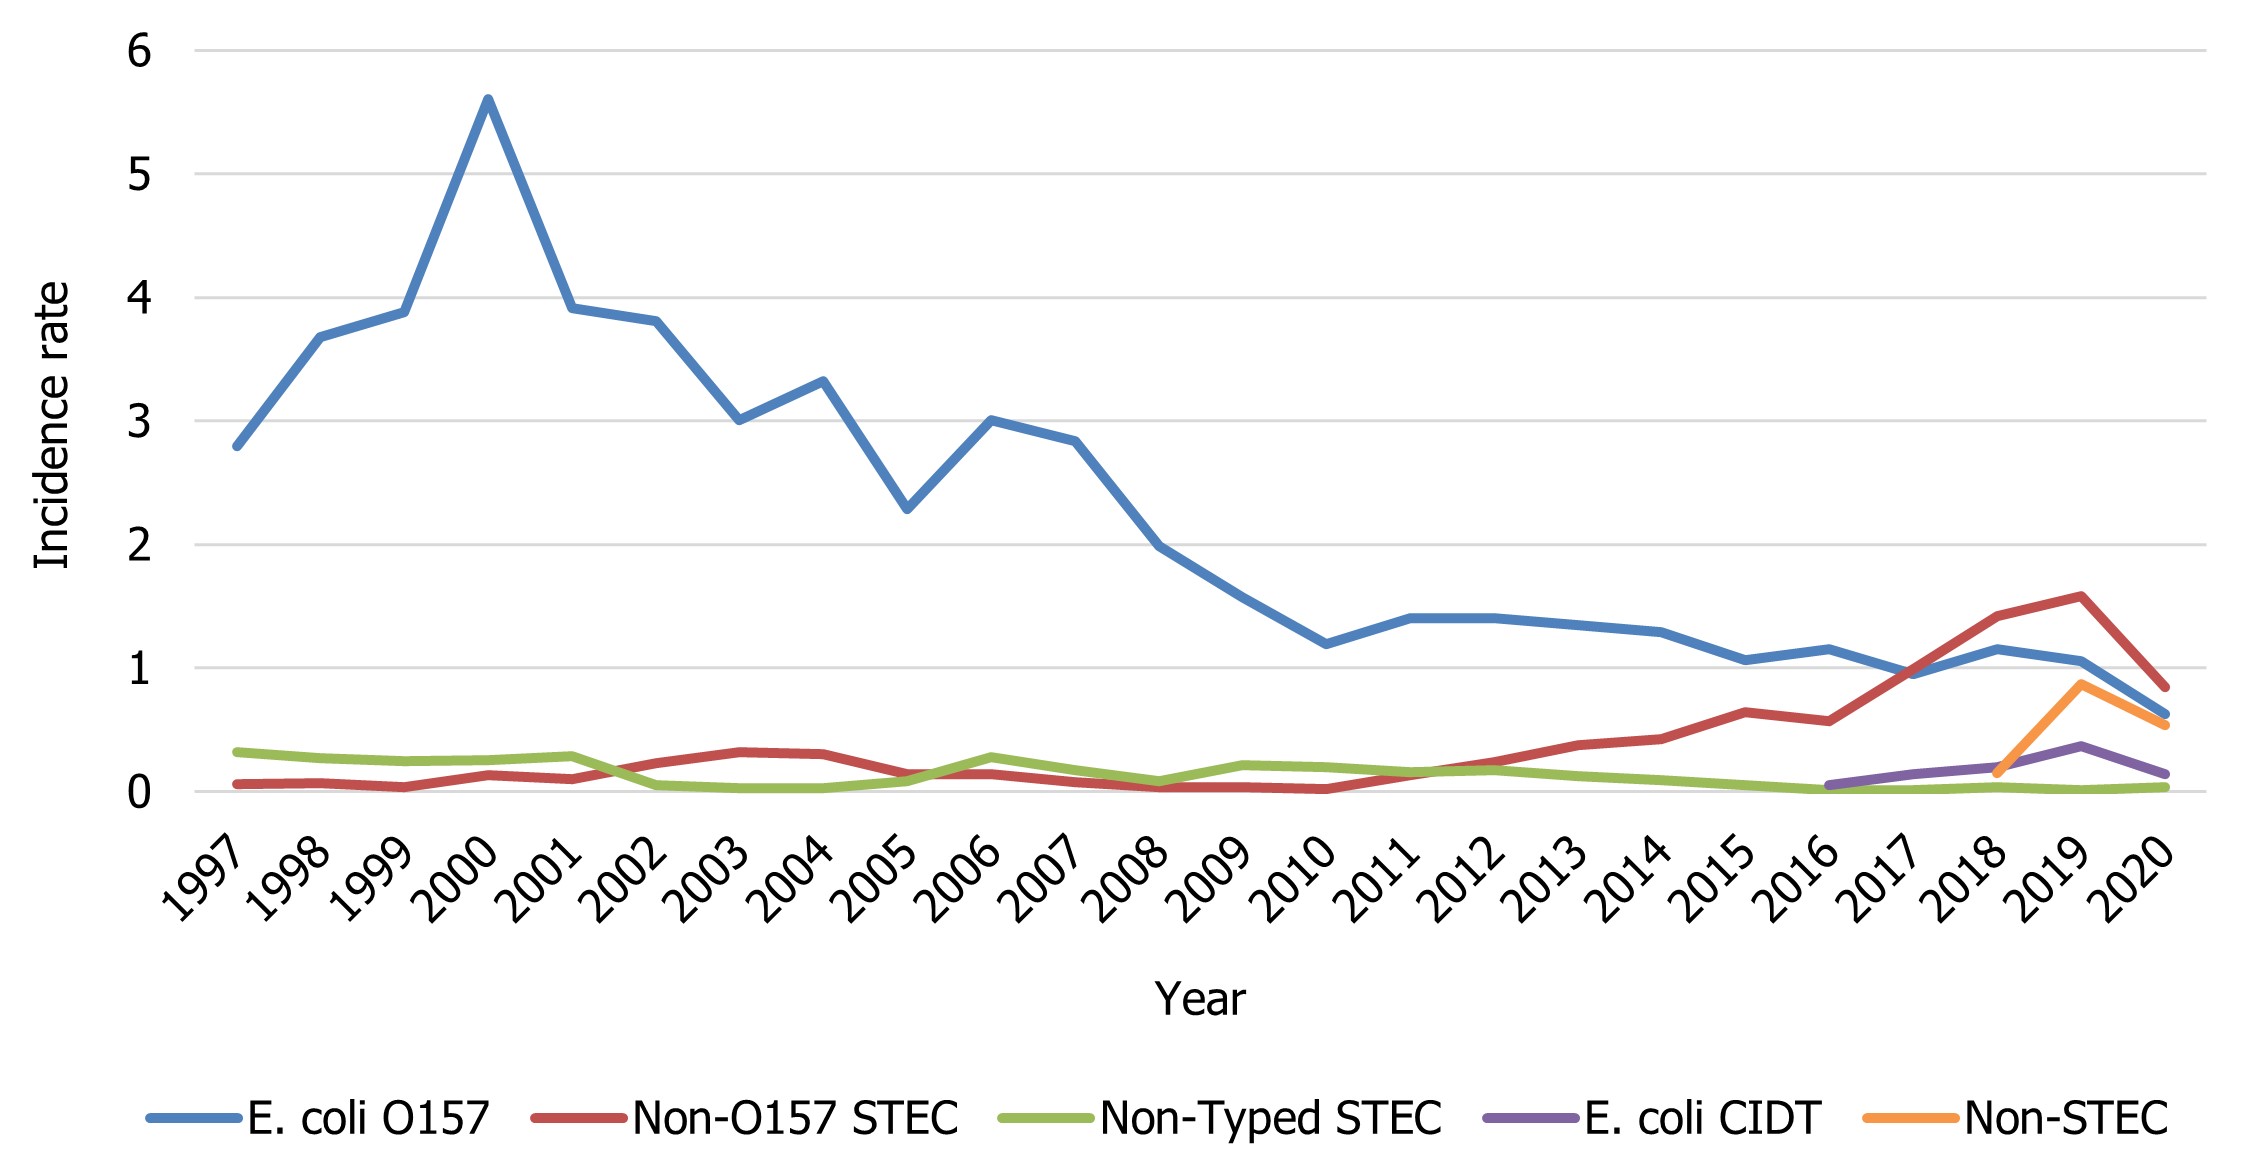
Figure 4 - Text description
| E. coli group | Year | |||||||||||
|---|---|---|---|---|---|---|---|---|---|---|---|---|
| 1997 | 1998 | 1999 | 2000 | 2001 | 2002 | 2003 | 2004 | 2005 | 2006 | 2007 | 2008 | |
| E. coli O157 | 2.79 | 3.68 | 3.88 | 5.60 | 3.91 | 3.81 | 3.01 | 3.32 | 2.28 | 3.00 | 2.84 | 1.99 |
| Non-O157 STEC | 0.06 | 0.07 | 0.04 | 0.13 | 0.10 | 0.23 | 0.32 | 0.30 | 0.14 | 0.14 | 0.08 | 0.04 |
| Non-Typed STEC | 0.32 | 0.27 | 0.25 | 0.25 | 0.28 | 0.05 | 0.03 | 0.03 | 0.08 | 0.28 | 0.18 | 0.09 |
| E. coli CIDT | 0 | 0 | 0 | 0 | 0 | 0 | 0 | 0 | 0 | 0 | 0 | 0 |
| Non-STEC | 0 | 0 | 0 | 0 | 0 | 0 | 0 | 0 | 0 | 0 | 0 | 0 |
| E. coli group | Year | |||||||||||
|---|---|---|---|---|---|---|---|---|---|---|---|---|
| 2009 | 2010 | 2011 | 2012 | 2013 | 2014 | 2015 | 2016 | 2017 | 2018 | 2019 | 2020 | |
| E. coli O157 | 1.57 | 1.19 | 1.40 | 1.40 | 1.35 | 1.29 | 1.06 | 1.15 | 0.95 | 1.15 | 1.06 | 0.62 |
| Non-O157 STEC | 0.04 | 0.02 | 0.13 | 0.24 | 0.37 | 0.43 | 0.64 | 0.57 | 0.99 | 1.42 | 1.58 | 0.84 |
| Non-Typed STEC | 0.21 | 0.19 | 0.15 | 0.18 | 0.13 | 0.10 | 0.05 | 0.01 | 0.01 | 0.04 | 0.01 | 0.04 |
| E. coli CIDT | 0 | 0 | 0 | 0 | 0 | 0 | 0 | 0.05 | 0.14 | 0.19 | 0.37 | 0.14 |
| Non-STEC | 0 | 0 | 0 | 0 | 0 | 0 | 0 | 0 | 0 | 0.15 | 0.87 | 0.53 |
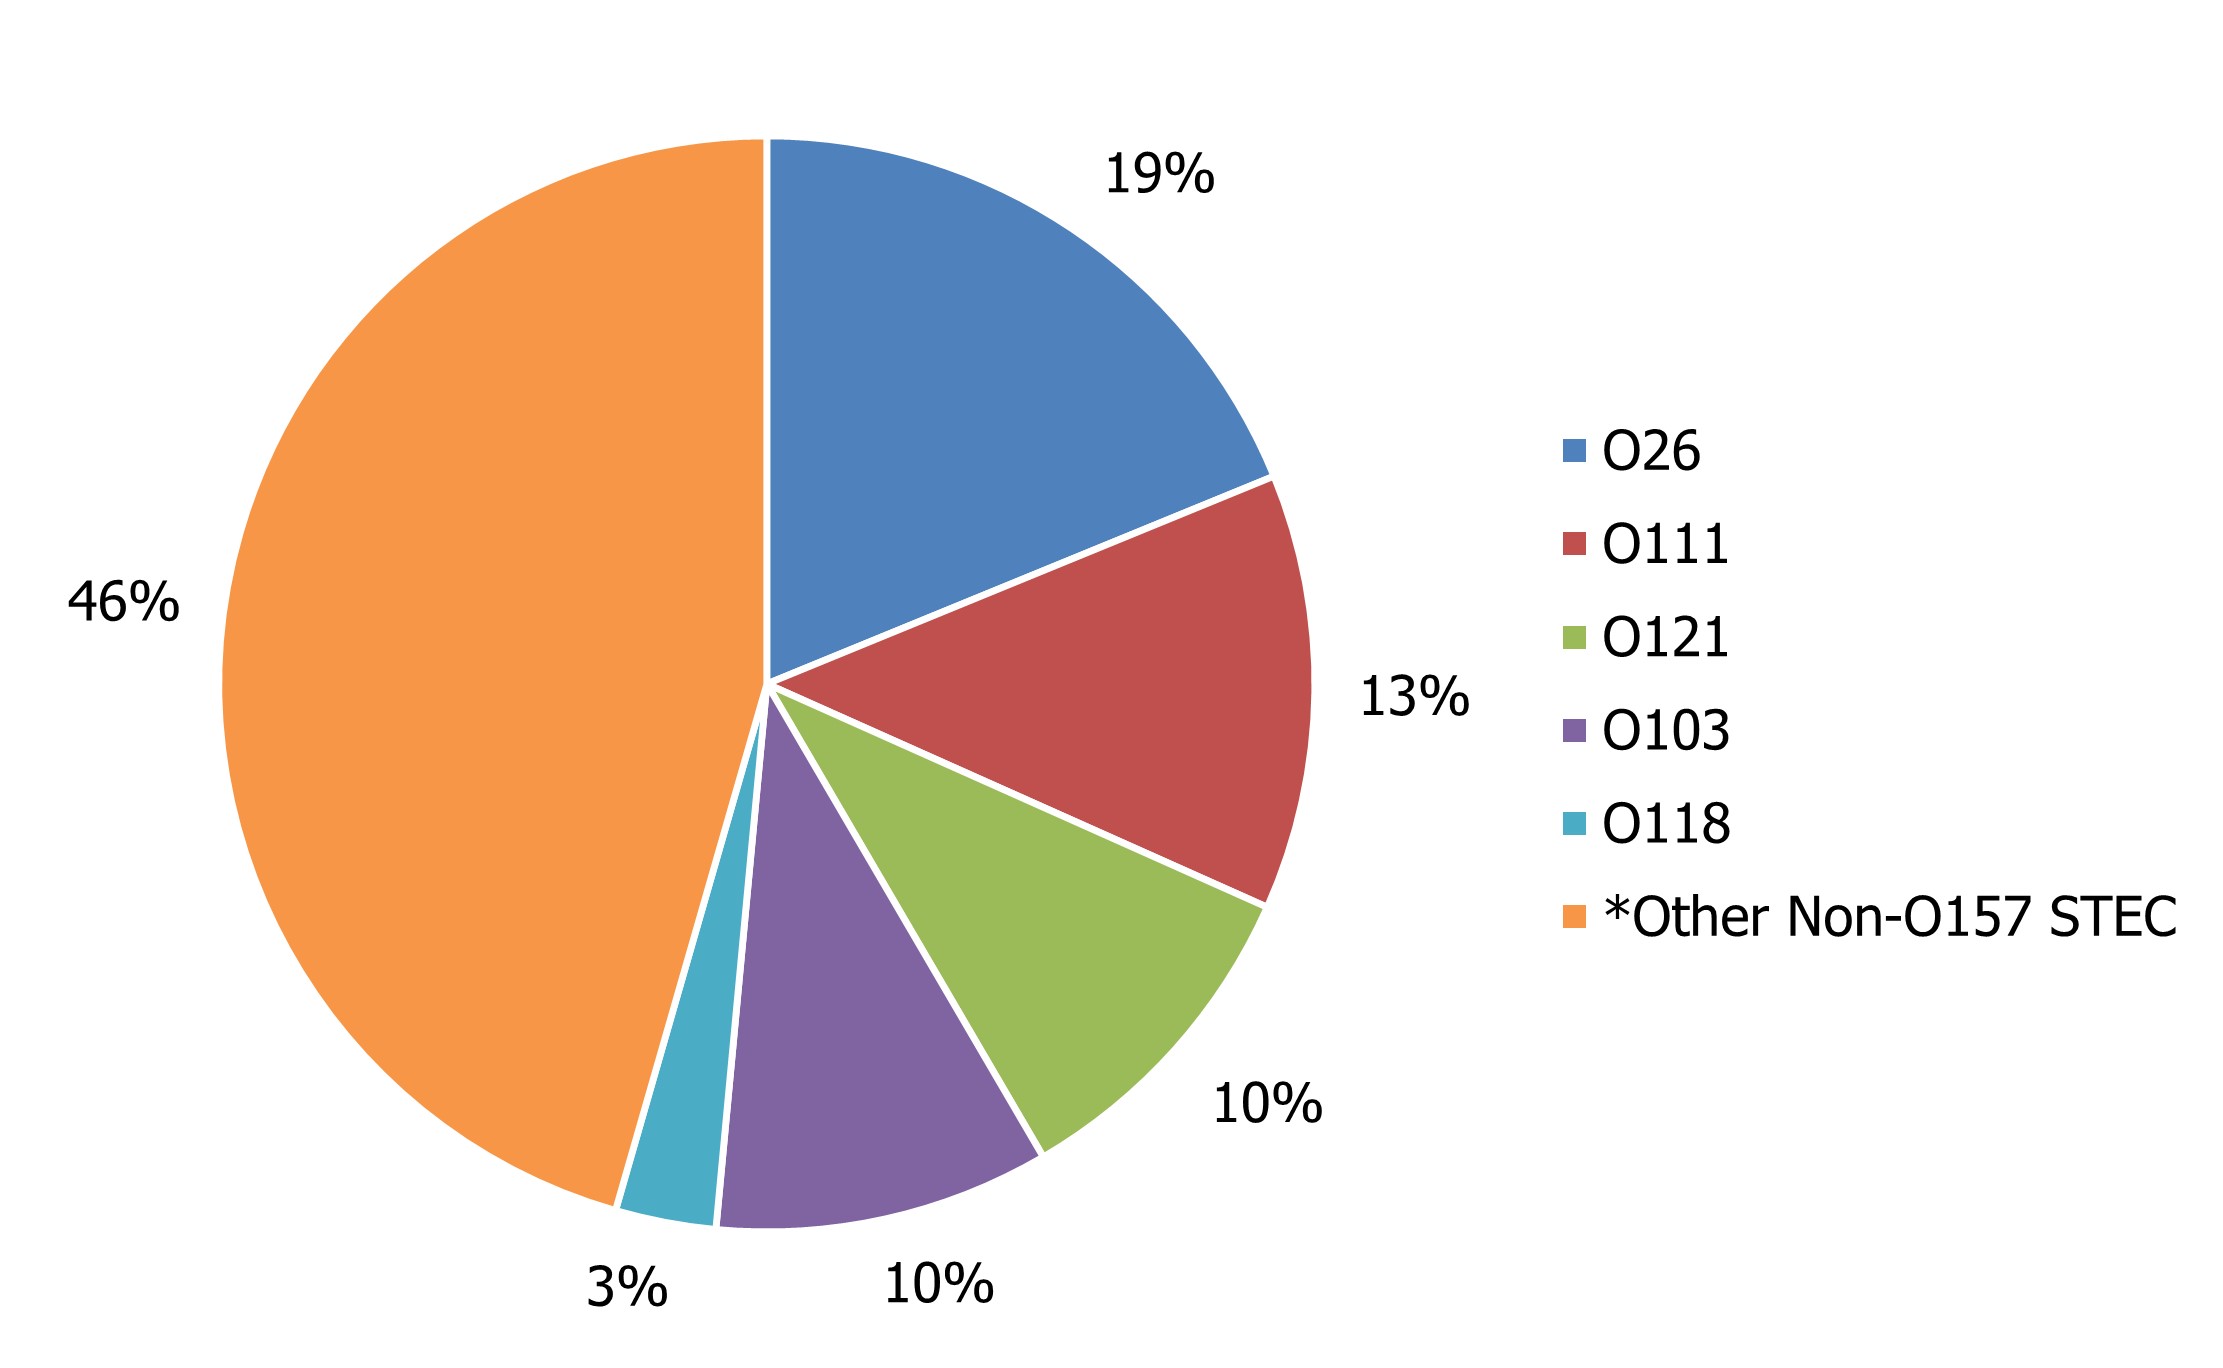
Figure 5 - Text description
| Non-O157 serotype | Percentage of total non-O157 STEC |
|---|---|
| O26 | 19% |
| O111 | 13% |
| O121 | 10% |
| O103 | 10% |
| O118 | 3% |
| Other Non-O157 STECfigure 5 note * | 46% |
Figure 5 Notes
|
|
*Other serotypes (146 isolates) were divided among 36 serotypes and 63 isolates were reported as unspecified non-O157 STEC.
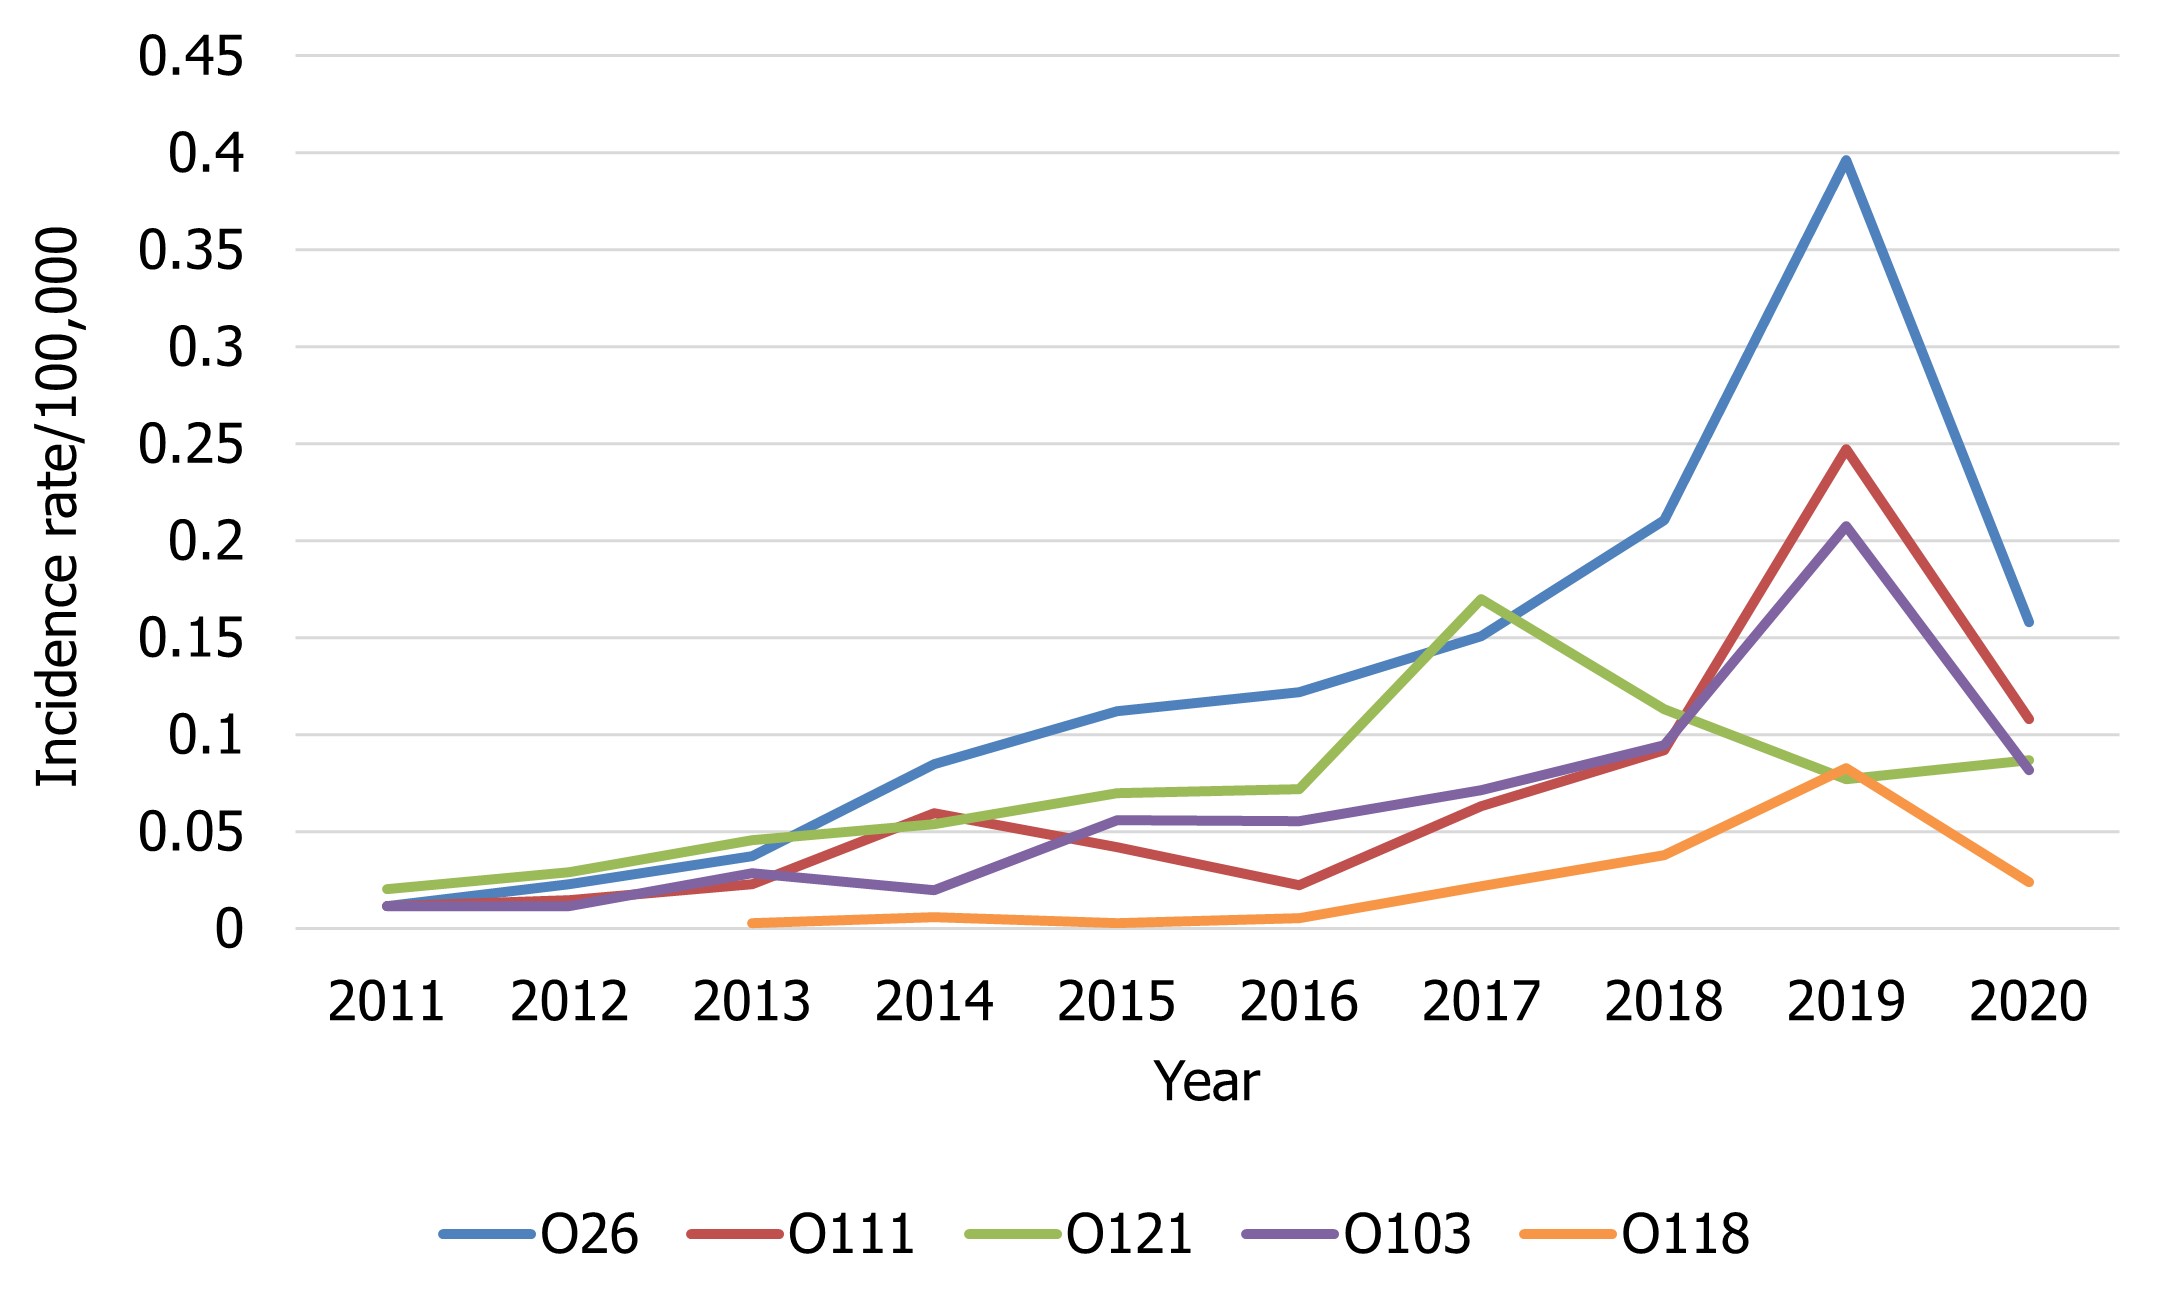
Figure 6 - Text description
| Non-O157 STEC serotype | Year | |||||||||
|---|---|---|---|---|---|---|---|---|---|---|
| 2011 | 2012 | 2013 | 2014 | 2015 | 2016 | 2017 | 2018 | 2019 | 2020 | |
| O26 | 0.01 | 0.02 | 0.04 | 0.08 | 0.11 | 0.12 | 0.15 | 0.21 | 0.40 | 0.16 |
| O111 | 0.01 | 0.01 | 0.02 | 0.06 | 0.04 | 0.02 | 0.06 | 0.09 | 0.25 | 0.11 |
| O121 | 0.02 | 0.03 | 0.05 | 0.05 | 0.07 | 0.07 | 0.17 | 0.11 | 0.08 | 0.09 |
| O103 | 0.01 | 0.01 | 0.03 | 0.02 | 0.06 | 0.06 | 0.07 | 0.09 | 0.21 | 0.08 |
| O118 | 0 | 0 | 0.00 | 0.01 | 0.00 | 0.01 | 0.02 | 0.04 | 0.08 | 0.02 |
Listeria monocytogenes
As per the case definition for invasive listeriosis, only isolates obtained from a normally sterile site or placental/fetal tissues should be reported. A decreased number of isolates for invasive listeriosis were reported in 2020 (158) compared to 2019 (174). As there are small numbers of cases of invasive listeriosis within most jurisdictions, the magnitude of the change is greatly affected with a difference of even one case (Figure 7).
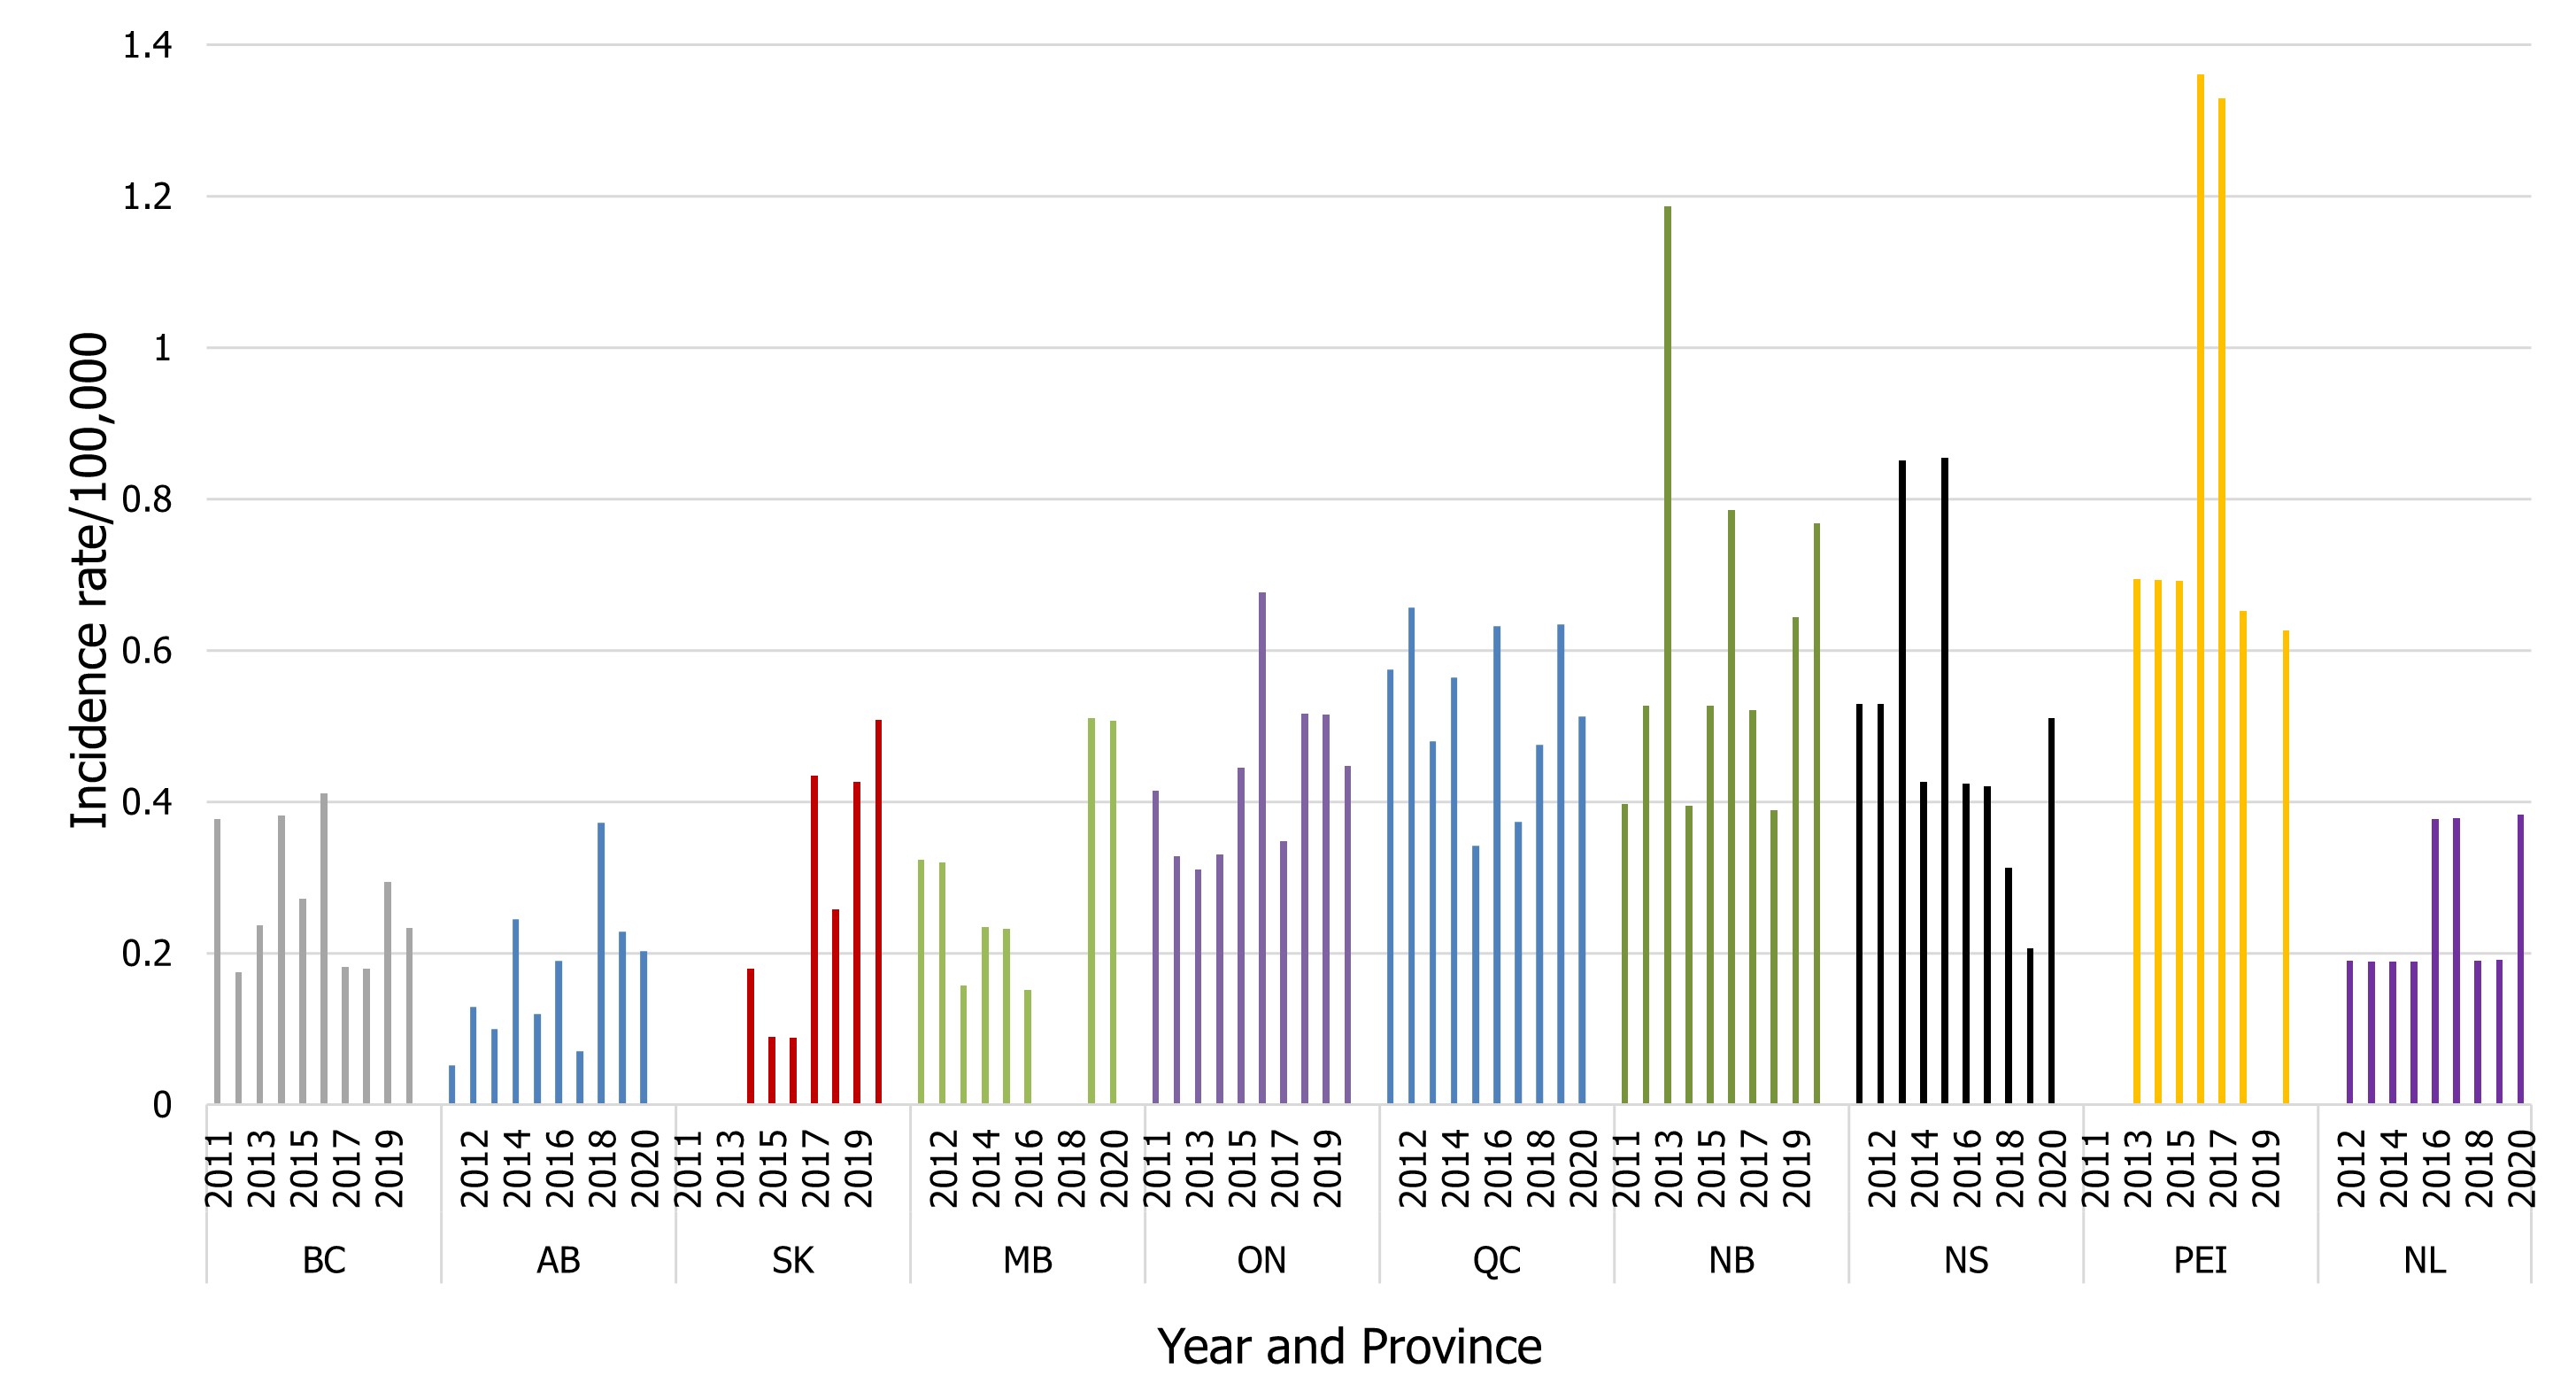
Figure 7 - Text description
| Province | Year | |||||||||
|---|---|---|---|---|---|---|---|---|---|---|
| 2011 | 2012 | 2013 | 2014 | 2015 | 2016 | 2017 | 2018 | 2019 | 2020 | |
| BC | 0.38 | 0.18 | 0.24 | 0.38 | 0.27 | 0.41 | 0.18 | 0.18 | 0.29 | 0.23 |
| AB | 0.05 | 0.13 | 0.10 | 0.24 | 0.12 | 0.19 | 0.07 | 0.37 | 0.23 | 0.20 |
| SK | 0 | 0 | 0 | 0.18 | 0.09 | 0.09 | 0.43 | 0.26 | 0.43 | 0.51 |
| MB | 0.32 | 0.32 | 0.16 | 0.23 | 0.23 | 0.15 | 0 | 0 | 0.51 | 0.51 |
| ON | 0.41 | 0.33 | 0.31 | 0.33 | 0.45 | 0.68 | 0.35 | 0.52 | 0.52 | 0.45 |
| QC | 0.57 | 0.66 | 0.48 | 0.56 | 0.34 | 0.63 | 0.37 | 0.48 | 0.64 | 0.51 |
| NB | 0.40 | 0.53 | 1.19 | 0.40 | 0.53 | 0.79 | 0.52 | 0.39 | 0.64 | 0.77 |
| NS | 0.53 | 0.53 | 0.85 | 0.43 | 0.85 | 0.42 | 0.42 | 0.31 | 0.21 | 0.51 |
| PEI | 0 | 0 | 0.69 | 0.69 | 0.69 | 1.36 | 1.33 | 0.65 | 0 | 0.63 |
| NL | 0 | 0.19 | 0.19 | 0.19 | 0.19 | 0.38 | 0.38 | 0.19 | 0.19 | 0.38 |
- Figure 7 Footnote *
-
There were no cases of invasive listeriosis reported in 2020 by Yukon, Northwest Territories, and Nunavut.
Shigella
There were 393 isolates of Shigella reported in 2020, representing a rate of 1.03 cases per 100,000 population compared to an average of 2.11 cases per 100,000 population reported between 2015 to 2019 (Figure 8). Isolates of Shigella sonnei and Shigella flexneri comprised 38% and 57% of total notifications respectively. Overall trends for Shigella have historically been driven by the incidence of S. sonnei (0.40 cases per 100,000 population). However, the rate of S. flexneri (0.59 cases per 100,000) surpassed that of S. sonnei in 2020 (Figure 8). Among the other Shigella species, incidence trends over time have remained relatively unchanged with an incidence of 0.03 cases per 100,000 population for Shigella boydii and 0.01 cases per 100,000 population for Shigella dysenteriae observed in 2020 (Figure 8). Rates of all species of Shigella noted in Figure 8 were lower in 2020 compared to 2019, likely due to the impacts of COVID-19.
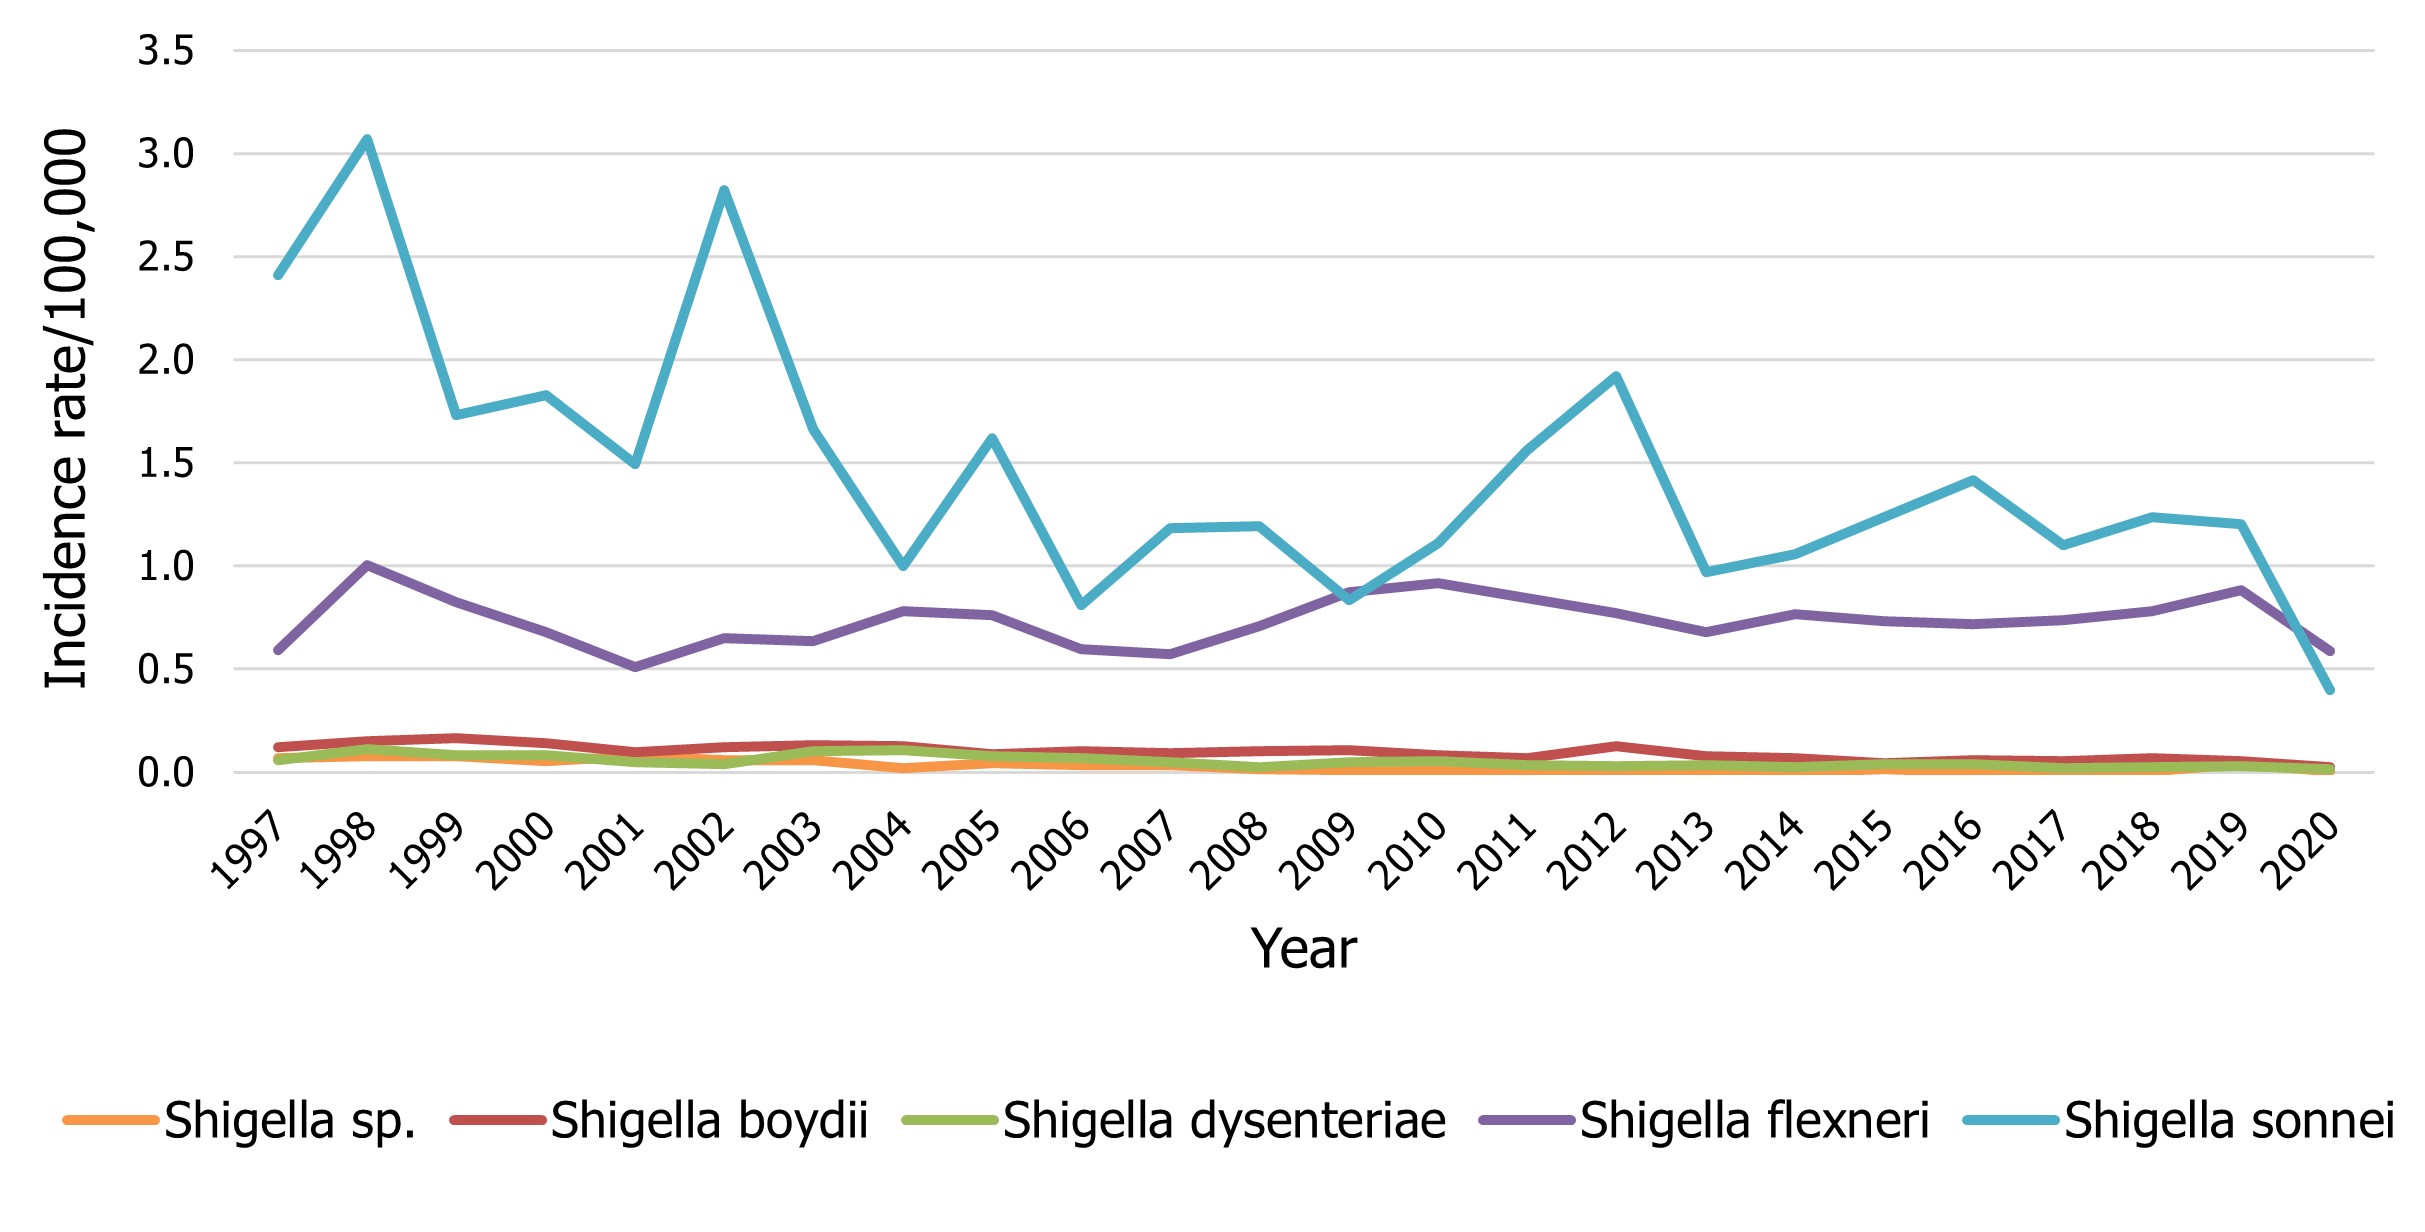
Figure 8 - Text description
| Shigella group | Year | |||||||||||
|---|---|---|---|---|---|---|---|---|---|---|---|---|
| 1997 | 1998 | 1999 | 2000 | 2001 | 2002 | 2003 | 2004 | 2005 | 2006 | 2007 | 2008 | |
| Shigella sp. | 0.07 | 0.08 | 0.08 | 0.06 | 0.08 | 0.06 | 0.06 | 0.02 | 0.05 | 0.04 | 0.03 | 0.02 |
| Shigella boydii | 0.12 | 0.15 | 0.16 | 0.14 | 0.10 | 0.12 | 0.13 | 0.13 | 0.09 | 0.10 | 0.09 | 0.10 |
| Shigella dysenteriae | 0.06 | 0.11 | 0.08 | 0.08 | 0.05 | 0.04 | 0.10 | 0.11 | 0.08 | 0.07 | 0.05 | 0.03 |
| Shigella flexneri | 0.59 | 1.00 | 0.82 | 0.68 | 0.51 | 0.65 | 0.64 | 0.78 | 0.76 | 0.60 | 0.57 | 0.71 |
| Shigella sonnei | 2.41 | 3.07 | 1.73 | 1.83 | 1.49 | 2.82 | 1.66 | 1.00 | 1.62 | 0.81 | 1.19 | 1.19 |
| Shigella group | Year | |||||||||||
|---|---|---|---|---|---|---|---|---|---|---|---|---|
| 2009 | 2010 | 2011 | 2012 | 2013 | 2014 | 2015 | 2016 | 2017 | 2018 | 2019 | 2020 | |
| Shigella sp. | 0.01 | 0.01 | 0.00 | 0.00 | 0.01 | 0.00 | 0.01 | 0.00 | 0.00 | 0.01 | 0.04 | 0.01 |
| Shigella boydii | 0.11 | 0.09 | 0.07 | 0.13 | 0.08 | 0.07 | 0.04 | 0.06 | 0.05 | 0.07 | 0.05 | 0.03 |
| Shigella dysenteriae | 0.05 | 0.05 | 0.03 | 0.03 | 0.03 | 0.03 | 0.04 | 0.04 | 0.02 | 0.02 | 0.03 | 0.01 |
| Shigella flexneri | 0.87 | 0.92 | 0.84 | 0.77 | 0.68 | 0.76 | 0.73 | 0.72 | 0.74 | 0.78 | 0.88 | 0.59 |
| Shigella sonnei | 0.84 | 1.11 | 1.56 | 1.92 | 0.97 | 1.06 | 1.24 | 1.42 | 1.10 | 1.24 | 1.20 | 0.40 |
Hepatitis A
The national incidence rate for Hepatitis A in 2020 was lower than in 2019 (0.67 cases per 100,000 population in 2020 compared to 1.55 in 2019), likely due to the impacts of COVID-19 (Figure 9). Each provincial and territorial laboratory determines whether to report a case based solely on laboratory testing, without public health follow-up. A positive IgM result could be due to false positive or recent immunization. When local public health follow up occurs it is then determined whether the case meets a confirmed case definition or not. If local public health determines it is not a case (e.g. recent immunization), this information may not always be relayed back to the laboratory, and therefore, our surveillance figures are not corrected. The increases observed in Figure 9 could be a result of change of laboratory detection methods. Conversely, since not all specimens/isolates are referred from the regional and local laboratories to the provincial public health laboratories, viruses, including Hepatitis A,are under-represented in NESP and reported case counts are not representative of the true incidence of the disease in Canada.
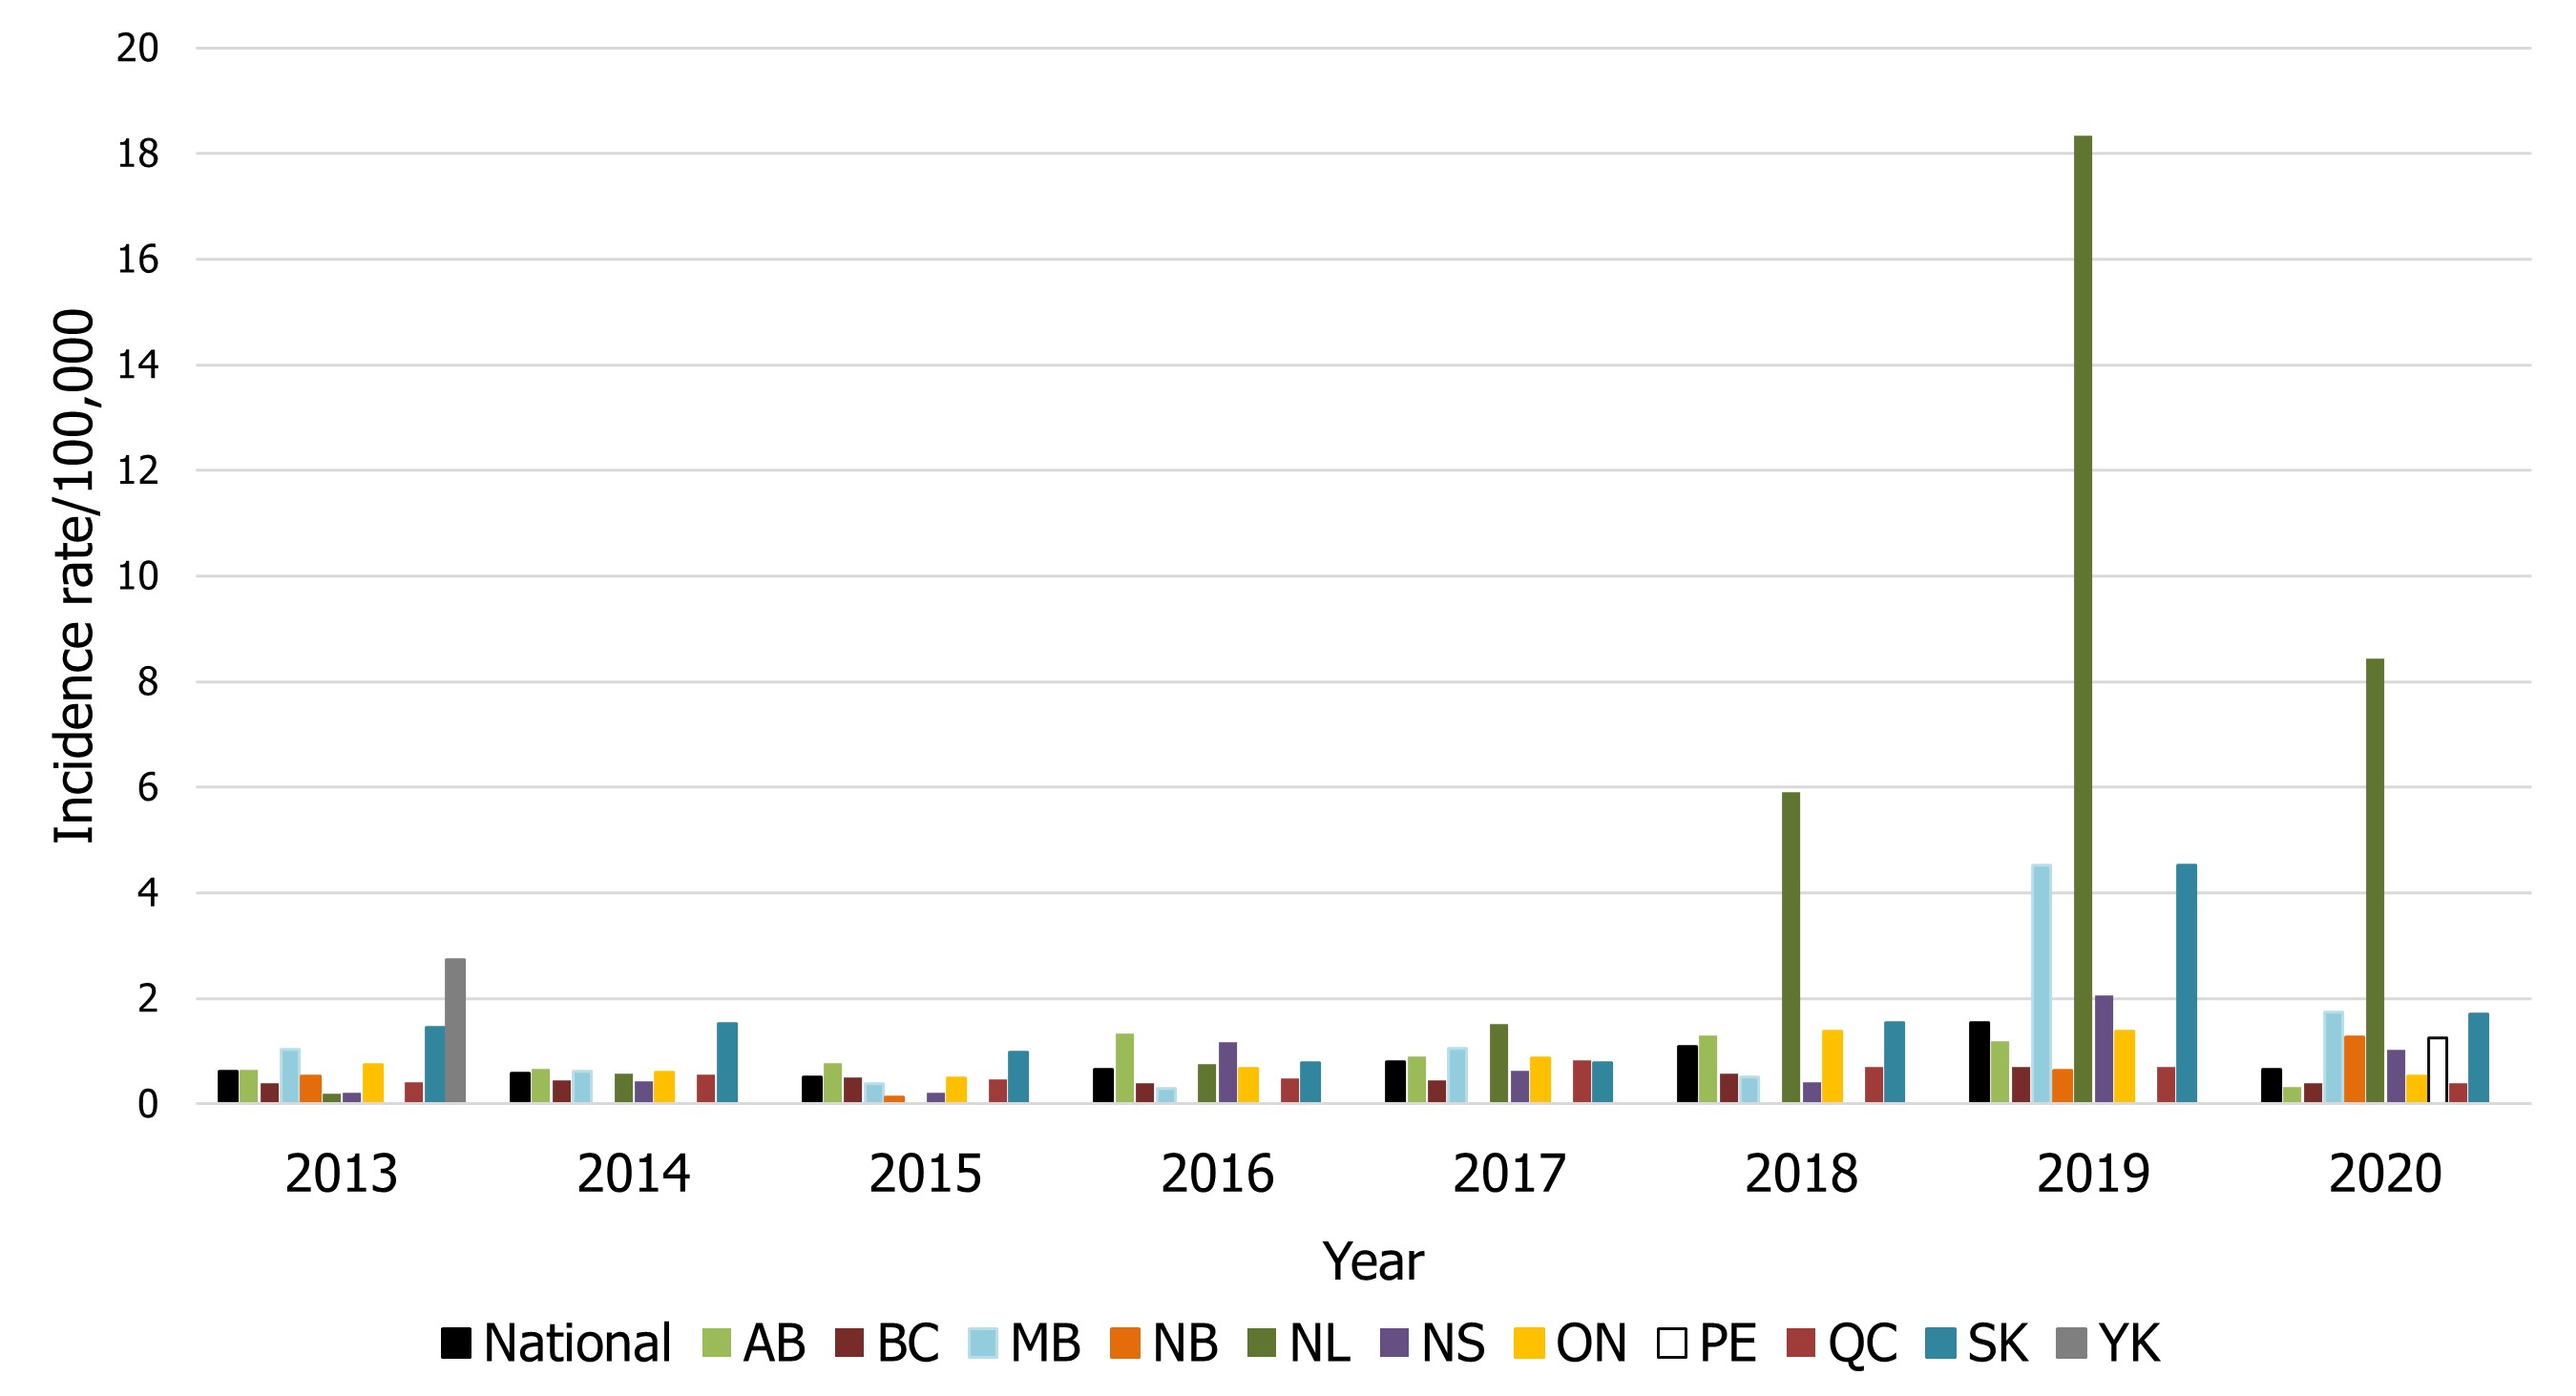
Figure 9 - Text description
| Province / territory | Year | |||||||
|---|---|---|---|---|---|---|---|---|
| 2013 | 2014 | 2015 | 2016 | 2017 | 2018 | 2019 | 2020 | |
| National | 0.62 | 0.59 | 0.51 | 0.65 | 0.79 | 1.08 | 1.55 | 0.67 |
| AB | 0.65 | 0.66 | 0.77 | 1.33 | 0.90 | 1.30 | 1.19 | 0.32 |
| BC | 0.39 | 0.45 | 0.50 | 0.39 | 0.45 | 0.58 | 0.71 | 0.39 |
| MB | 1.03 | 0.63 | 0.39 | 0.30 | 1.05 | 0.52 | 4.53 | 1.74 |
| NB | 0.53 | 0 | 0.13 | 0 | 0 | 0 | 0.64 | 1.28 |
| NL | 0.19 | 0.57 | 0.00 | 0.76 | 1.51 | 5.90 | 18.34 | 8.43 |
| NS | 0.21 | 0.43 | 0.21 | 1.17 | 0.63 | 0.42 | 2.06 | 1.02 |
| ON | 0.75 | 0.61 | 0.50 | 0.67 | 0.88 | 1.38 | 1.38 | 0.53 |
| PE | 0 | 0 | 0 | 0 | 0 | 0 | 0 | 1.25 |
| QC | 0.42 | 0.56 | 0.46 | 0.49 | 0.83 | 0.70 | 0.69 | 0.40 |
| SK | 1.45 | 1.53 | 0.98 | 0.79 | 0.78 | 1.55 | 4.52 | 1.70 |
| YK | 2.74 | 0 | 0 | 0 | 0 | 0 | 0 | 0 |
Appendix A. Comparison of national totals, incidence per 100,000 population and proportion captured between the Canadian Notifiable Disease Surveillance System (CNDSS) and the National Enteric Surveillance Program (NESP) for enteric diseases, 2019appendix a table 1 note 1
| Enteric, Food and Waterborne Diseases | Canadian Notifiable Disease Surveillance System (CNDSS) | National Enteric Surveillance Program (NESP) | % of CNDSS cases captured in NESP (NESP isolations / CNDSS casesappendix a table 1 note 8) | ||
|---|---|---|---|---|---|
| 2019 | N | Rate per 100,000 population |
N | Rate per 100,000 population |
|
| Botulism | 7 | 0.02 | - | - | N/A |
| Campylobacteriosisappendix a table 1 note 2 | 10,237 | 27.23 | 1,664 | - | 16.3 |
| Choleraappendix a table 1 note 3 | 3 | 0.01 | 2 | 0.005 | 66.7 |
| Cryptosporidiosisappendix a table 1 note 2 | 1,490 | 3.96 | 457 | - | 30.7 |
| Cyclosporiasisappendix a table 1 note 2 | 495 | 1.32 | 66 | - | 13.3 |
| Giardiasisappendix a table 1 note 2 | 3,889 | 10.34 | 739 | - | 19.0 |
| Hepatitis A | 386 | 1.03 | 583 | 1.55 | 151.0appendix a table 1 note 8 |
| Invasive Listeriosis | 172 | 0.43 | 174 | 0.46 | 101.2appendix a table 1 note 8 |
| Norovirusappendix a table 1 note 2appendix a table 1 note 4appendix a table 1 note 5 | 372 | 7.48 | 1,554 | - | N/A |
| Paralytic Shellfish Poisoningappendix a table 1 note 6 | 3 | 0.009 | - | - | N/A |
| Salmonellosis | 5,845 | 15.55 | 6,350 | 16.9 | 108.6appendix a table 1 note 8 |
| Shigellosis | 914 | 2.43 | 827 | 2.02 | 90.5 |
| Typhoidappendix a table 1 note 7 | 194 | 0.52 | 232 | 0.62 | 119.6appendix a table 1 note 8 |
| Shiga toxigenic Escherichia coli Infection | 1,116 | 2.97 | 776appendix a table 1 note 9 | 2.06 | 69.5 |
Table 8 Notes
|
|||||
Appendix B. Species and serotype data reported to NESP by province and territory, 2020
Cases visiting a different province or territory are captured in the total count for the province or territory where the case was detected.
| Organism | BC | AB | SK | MB | ON | QC | NB | NS | PE | NL | YT | NT | NU | Total |
|---|---|---|---|---|---|---|---|---|---|---|---|---|---|---|
| Campylobacter coli | 1 | 9 | 11 | 7 | 7 | 19 | 10 | 1 | 4 | 0 | 0 | 0 | 0 | 69 |
| Campylobacter concisus | 2 | 0 | 0 | 0 | 0 | 0 | 0 | 0 | 0 | 0 | 0 | 0 | 0 | 2 |
| Campylobacter curvus | 0 | 0 | 0 | 0 | 0 | 2 | 0 | 1 | 0 | 0 | 0 | 0 | 0 | 3 |
| Campylobacter fetus | 1 | 0 | 0 | 0 | 6 | 8 | 0 | 0 | 0 | 0 | 0 | 0 | 0 | 15 |
| Campylobacter gracilis | 0 | 0 | 0 | 0 | 0 | 1 | 0 | 0 | 0 | 0 | 0 | 0 | 0 | 1 |
| Campylobacter hominis | 0 | 0 | 0 | 0 | 0 | 1 | 0 | 0 | 0 | 0 | 0 | 0 | 0 | 1 |
| Campylobacter hyointestinalis | 0 | 0 | 0 | 0 | 2 | 0 | 0 | 0 | 0 | 0 | 0 | 0 | 0 | 2 |
| Campylobacter jejuni | 15 | 240 | 157 | 40 | 37 | 159 | 170 | 85 | 43 | 0 | 4 | 1 | 0 | 951 |
| Campylobacter lari | 0 | 0 | 0 | 0 | 3 | 2 | 3 | 0 | 0 | 0 | 0 | 0 | 0 | 8 |
| Campylobacter rectus | 0 | 0 | 0 | 0 | 0 | 1 | 0 | 1 | 0 | 0 | 0 | 0 | 0 | 2 |
| Campylobacter showae - like | 1 | 0 | 0 | 0 | 0 | 1 | 0 | 0 | 0 | 0 | 0 | 0 | 0 | 2 |
| Campylobacter sp | 2 | 0 | 0 | 0 | 0 | 0 | 66 | 0 | 0 | 105 | 0 | 0 | 0 | 173 |
| Campylobacter upsaliensis | 1 | 2 | 1 | 1 | 32 | 8 | 3 | 2 | 1 | 0 | 0 | 0 | 0 | 51 |
| Campylobacter ureolyticus | 0 | 1 | 0 | 0 | 0 | 6 | 0 | 0 | 0 | 0 | 0 | 0 | 0 | 7 |
| Campylobacter volucris | 2 | 0 | 0 | 0 | 0 | 0 | 0 | 0 | 0 | 0 | 0 | 0 | 0 | 2 |
| Total Campylobacter | 25 | 252 | 169 | 48 | 87 | 208 | 252 | 90 | 48 | 105 | 4 | 1 | 0 | 1,289 |
| Organism | BC | AB | SK | MB | ON | QC | NB | NS | PE | NL | YT | NT | NU | Total |
|---|---|---|---|---|---|---|---|---|---|---|---|---|---|---|
| E. coli | 0 | 0 | 0 | 0 | 0 | 1 | 0 | 0 | 0 | 0 | 0 | 0 | 0 | 1 |
| CIDT Positive for STX/STEC | 6 | 0 | 0 | 0 | 0 | 40 | 0 | 0 | 0 | 9 | 0 | 0 | 0 | 55 |
| Non-O157 E. coli STEC | 5 | 0 | 38 | 18 | 0 | 0 | 0 | 1 | 1 | 0 | 0 | 0 | 0 | 63 |
| E. coli Non-Typed EAEC | 0 | 0 | 0 | 0 | 0 | 0 | 0 | 0 | 0 | 23 | 0 | 0 | 0 | 23 |
| E. coli Non-Typed EPEC | 0 | 0 | 0 | 0 | 0 | 0 | 0 | 0 | 0 | 167 | 0 | 0 | 0 | 167 |
| E. coli Non-Typed ETEC | 0 | 0 | 0 | 0 | 0 | 0 | 0 | 0 | 0 | 13 | 0 | 0 | 0 | 13 |
| E. coli Non-Typed STEC | 10 | 0 | 0 | 0 | 0 | 0 | 0 | 0 | 0 | 4 | 0 | 0 | 0 | 14 |
| E. coli O undetermined:H11 | 0 | 1table 8 note * | 0 | 0 | 0 | 0 | 0 | 0 | 0 | 0 | 0 | 0 | 0 | 1 |
| E. coli O undetermined:H16 | 1 | 1 | 0 | 0 | 0 | 0 | 0 | 0 | 0 | 0 | 0 | 0 | 0 | 2 |
| E. coli O undetermined:H19 | 0 | 1table 8 note * | 0 | 0 | 0 | 0 | 0 | 0 | 0 | 0 | 0 | 0 | 0 | 1 |
| E. coli O undetermined:H2 | 0 | 1table 8 note * | 0 | 0 | 1 | 0 | 0 | 0 | 0 | 0 | 0 | 0 | 0 | 2 |
| E. coli O undetermined:H21 | 0 | 1table 8 note * | 0 | 0 | 0 | 1table 8 note * | 0 | 0 | 0 | 0 | 0 | 0 | 0 | 2 |
| E. coli O undetermined:H45 | 0 | 1table 8 note * | 0 | 0 | 0 | 0 | 0 | 0 | 0 | 0 | 0 | 0 | 0 | 1 |
| E. coli O undetermined:H7 | 0 | 0 | 0 | 0 | 1 | 0 | 0 | 0 | 0 | 0 | 0 | 0 | 0 | 1 |
| E. coli O undetermined:H8 | 0 | 1table 8 note * | 0 | 0 | 0 | 0 | 0 | 0 | 0 | 0 | 0 | 0 | 0 | 1 |
| E. coli O undetermined:HNM | 3 | 1 | 0 | 0 | 0 | 0 | 0 | 0 | 0 | 0 | 0 | 0 | 0 | 4 |
| E. coli O-Rough:H12 | 1 | 0 | 0 | 0 | 0 | 0 | 0 | 0 | 0 | 0 | 0 | 0 | 0 | 1 |
| E. coli O-Rough:H19 | 0 | 1table 8 note * | 0 | 0 | 0 | 0 | 0 | 0 | 0 | 0 | 0 | 0 | 0 | 1 |
| E. coli O-Rough:H2 | 0 | 1table 8 note * | 0 | 0 | 0 | 0 | 0 | 0 | 0 | 0 | 0 | 0 | 0 | 1 |
| E. coli O100:HNM | 0 | 1table 8 note * | 0 | 0 | 0 | 0 | 0 | 0 | 0 | 0 | 0 | 0 | 0 | 1 |
| E. coli O103:H2 | 4 | 12table 8 note * | 0 | 0 | 6 | 4table 8 note * | 0 | 0 | 0 | 0 | 0 | 0 | 0 | 26 |
| E. coli O103:H25 | 0 | 2table 8 note * | 0 | 0 | 1 | 0 | 0 | 0 | 0 | 0 | 0 | 0 | 0 | 3 |
| E. coli O103:HNM | 1 | 1table 8 note * | 0 | 0 | 0 | 0 | 0 | 0 | 0 | 0 | 0 | 0 | 0 | 2 |
| E. coli O111 | 3 | 0 | 0 | 0 | 0 | 0 | 0 | 0 | 0 | 0 | 0 | 0 | 0 | 3 |
| E. coli O111:HNM | 2 | 22table 8 note * | 0 | 0 | 9 | 5table 8 note * | 0 | 0 | 0 | 0 | 0 | 0 | 0 | 38 |
| E. coli O113:H21 | 0 | 1table 8 note * | 0 | 0 | 0 | 0 | 0 | 0 | 0 | 0 | 0 | 0 | 0 | 1 |
| E. coli O117:H7 | 4 | 0 | 0 | 0 | 1 | 0 | 0 | 0 | 0 | 0 | 0 | 0 | 0 | 5 |
| E. coli O118:14 | 0 | 1table 8 note * | 0 | 0 | 0 | 0 | 0 | 0 | 0 | 0 | 0 | 0 | 0 | 1 |
| E. coli O118:H16 | 0 | 1table 8 note * | 0 | 0 | 0 | 2table 8 note * | 0 | 0 | 0 | 0 | 0 | 0 | 0 | 3 |
| E. coli O118:H2 | 0 | 3table 8 note * | 0 | 0 | 1 | 0 | 0 | 0 | 0 | 0 | 0 | 0 | 0 | 4 |
| E. coli O118:HNM | 0 | 0 | 0 | 0 | 0 | 1 | 0 | 0 | 0 | 0 | 0 | 0 | 0 | 1 |
| E. coli O121 | 1 | 0 | 0 | 0 | 0 | 0 | 0 | 0 | 0 | 0 | 0 | 0 | 0 | 1 |
| E. coli O121:H19 | 9 | 23table 8 note * | 0 | 0 | 0 | 0 | 0 | 0 | 0 | 0 | 0 | 0 | 0 | 32 |
| E. coli O123:H2 | 0 | 0 | 0 | 0 | 1 | 0 | 0 | 0 | 0 | 0 | 0 | 0 | 0 | 1 |
| E. coli O128ab:H2 | 0 | 1table 8 note * | 0 | 0 | 0 | 1table 8 note * | 0 | 0 | 0 | 0 | 0 | 0 | 0 | 2 |
| E. coli O142:H Rough | 0 | 1table 8 note * | 0 | 0 | 0 | 0 | 0 | 0 | 0 | 0 | 0 | 0 | 0 | 1 |
| E. coli O145 | 1 | 0 | 0 | 0 | 0 | 0 | 0 | 0 | 0 | 0 | 0 | 0 | 0 | 1 |
| E. coli O145:H25 | 0 | 1table 8 note * | 0 | 0 | 0 | 0 | 0 | 0 | 0 | 0 | 0 | 0 | 0 | 1 |
| E. coli O145:HNM | 0 | 1table 8 note * | 0 | 0 | 0 | 0 | 0 | 0 | 0 | 0 | 0 | 0 | 0 | 1 |
| E. coli O146:H21 | 1 | 2table 8 note * | 0 | 0 | 0 | 1table 8 note * | 0 | 0 | 0 | 0 | 0 | 0 | 0 | 4 |
| E. coli O152:H8 | 0 | 0 | 0 | 0 | 1 | 0 | 0 | 0 | 0 | 0 | 0 | 0 | 0 | 1 |
| E. coli O156:H25 | 0 | 1 | 0 | 0 | 0 | 0 | 0 | 0 | 0 | 0 | 0 | 0 | 0 | 1 |
| E. coli O157 | 0 | 0 | 4table 8 note * | 21table 8 note * | 0 | 0 | 1table 8 note * | 0 | 0 | 0 | 0 | 0 | 0 | 26 |
| E. coli O157:H7 | 32 | 41 | 0 | 1 | 75 | 40 | 0 | 0 | 0 | 0 | 0 | 0 | 0 | 189 |
| E. coli O157:HNM | 5 | 3table 8 note * | 0 | 0 | 10 | 4 | 0 | 0 | 0 | 0 | 0 | 0 | 0 | 22 |
| E. coli O168:H8 | 0 | 1table 8 note * | 0 | 0 | 0 | 0 | 0 | 0 | 0 | 0 | 0 | 0 | 0 | 1 |
| E. coli O16:H5 | 0 | 1table 8 note * | 0 | 0 | 0 | 0 | 0 | 0 | 0 | 0 | 0 | 0 | 0 | 1 |
| E. coli O181:H49 | 0 | 1table 8 note * | 0 | 0 | 0 | 0 | 0 | 0 | 0 | 0 | 0 | 0 | 0 | 1 |
| E. coli O186:H11 | 0 | 1table 8 note * | 0 | 0 | 0 | 0 | 0 | 0 | 0 | 0 | 0 | 0 | 0 | 1 |
| E. coli O186:H2 | 0 | 1 | 0 | 0 | 1 | 0 | 0 | 0 | 0 | 0 | 0 | 0 | 0 | 2 |
| E. coli O25:H15 | 1 | 0 | 0 | 0 | 0 | 0 | 0 | 0 | 0 | 0 | 0 | 0 | 0 | 1 |
| E. coli O26:H11 | 5 | 33table 8 note * | 0 | 0 | 9 | 2table 8 note * | 0 | 0 | 0 | 0 | 0 | 0 | 0 | 49 |
| E. coli O26:HNM | 0 | 8table 8 note * | 0 | 0 | 1 | 2table 8 note * | 0 | 0 | 0 | 0 | 0 | 0 | 0 | 11 |
| E. coli O28ac:H25 | 0 | 1table 8 note * | 0 | 0 | 0 | 0 | 0 | 0 | 0 | 0 | 0 | 0 | 0 | 1 |
| E. coli O38:H21 | 0 | 1table 8 note * | 0 | 0 | 0 | 0 | 0 | 0 | 0 | 0 | 0 | 0 | 0 | 1 |
| E. coli O41:H2 | 0 | 1table 8 note * | 0 | 0 | 0 | 0 | 0 | 0 | 0 | 0 | 0 | 0 | 0 | 1 |
| E. coli O45:H2 | 0 | 0 | 0 | 0 | 0 | 1table 8 note * | 0 | 0 | 0 | 0 | 0 | 0 | 0 | 1 |
| E. coli O48:H21 | 0 | 1table 8 note * | 0 | 0 | 0 | 0 | 0 | 0 | 0 | 0 | 0 | 0 | 0 | 1 |
| E. coli O52:H45 | 0 | 0 | 0 | 0 | 2 | 0 | 0 | 0 | 0 | 0 | 0 | 0 | 0 | 2 |
| E. coli O5:HNM | 0 | 5table 8 note * | 0 | 0 | 0 | 1table 8 note * | 0 | 0 | 0 | 0 | 0 | 0 | 0 | 6 |
| E. coli O60:H7 | 1 | 0 | 0 | 0 | 0 | 0 | 0 | 0 | 0 | 0 | 0 | 0 | 0 | 1 |
| E. coli O69:H11 | 0 | 5table 8 note * | 0 | 0 | 0 | 0 | 0 | 0 | 0 | 0 | 0 | 0 | 0 | 5 |
| E. coli O69:HNM | 0 | 1table 8 note * | 0 | 0 | 0 | 0 | 0 | 0 | 0 | 0 | 0 | 0 | 0 | 1 |
| E. coli O70:HNM | 0 | 0 | 0 | 0 | 0 | 1 | 0 | 0 | 0 | 0 | 0 | 0 | 0 | 1 |
| E. coli O71:H11 | 0 | 4table 8 note * | 0 | 0 | 0 | 0 | 0 | 0 | 0 | 0 | 0 | 0 | 0 | 4 |
| E. coli O71:H8 | 0 | 1table 8 note * | 0 | 0 | 0 | 0 | 0 | 0 | 0 | 0 | 0 | 0 | 0 | 1 |
| E. coli O71:HNM | 0 | 1table 8 note * | 0 | 0 | 0 | 0 | 0 | 0 | 0 | 0 | 0 | 0 | 0 | 1 |
| E. coli O76:H19 | 0 | 0 | 0 | 0 | 1 | 0 | 0 | 0 | 0 | 0 | 0 | 0 | 0 | 1 |
| E. coli O82:H40 | 0 | 0 | 0 | 0 | 1 | 0 | 0 | 0 | 0 | 0 | 0 | 0 | 0 | 1 |
| E. coli O84:HNM | 0 | 4table 8 note * | 0 | 0 | 0 | 0 | 0 | 0 | 0 | 0 | 0 | 0 | 0 | 4 |
| E. coli O85:H2 | 0 | 0 | 0 | 0 | 1 | 0 | 0 | 0 | 0 | 0 | 0 | 0 | 0 | 1 |
| E. coli O86:H2 | 0 | 1table 8 note * | 0 | 0 | 0 | 0 | 0 | 0 | 0 | 0 | 0 | 0 | 0 | 1 |
| E. coli O87:H16 | 0 | 0 | 0 | 0 | 1 | 0 | 0 | 0 | 0 | 0 | 0 | 0 | 0 | 1 |
| E. coli O91:H21 | 1 | 0 | 0 | 0 | 0 | 0 | 0 | 0 | 0 | 0 | 0 | 0 | 0 | 1 |
| E. coli O91:HNM | 0 | 1table 8 note * | 0 | 0 | 0 | 0 | 0 | 0 | 0 | 0 | 0 | 0 | 0 | 1 |
| Total E. coli | 97 | 201 | 42 | 40 | 124 | 107 | 1 | 1 | 1 | 216 | 0 | 0 | 0 | 830 |
Table 8 Notes
|
||||||||||||||
| Organism | BC | AB | SK | MB | ON | QC | NB | NS | PE | NL | YT | NT | NU | Total |
|---|---|---|---|---|---|---|---|---|---|---|---|---|---|---|
| Listeria monocytogenes | 12 | 9 | 6 | 7 | 66 | 44 | 6 | 5 | 1 | 2 | 0 | 0 | 0 | 158 |
| Total Listeria | 12 | 9 | 6 | 7 | 66 | 44 | 6 | 5 | 1 | 2 | 0 | 0 | 0 | 158 |
| Organism | BC | AB | SK | MB | ON | QC | NB | NS | PE | NL | YT | NT | NU | Total |
|---|---|---|---|---|---|---|---|---|---|---|---|---|---|---|
| Salmonella Aarhus | 0 | 0 | 0 | 0 | 1 | 0 | 0 | 0 | 0 | 0 | 0 | 0 | 0 | 1 |
| Salmonella Adelaide | 0 | 0 | 0 | 0 | 5 | 0 | 0 | 0 | 0 | 0 | 0 | 0 | 0 | 5 |
| Salmonella Adjame | 0 | 0 | 0 | 0 | 1 | 0 | 0 | 0 | 0 | 0 | 0 | 0 | 0 | 1 |
| Salmonella Agama | 1 | 0 | 0 | 0 | 0 | 0 | 0 | 0 | 0 | 0 | 0 | 0 | 0 | 1 |
| Salmonella Agbeni | 1 | 0 | 2 | 0 | 2 | 0 | 1 | 0 | 0 | 0 | 0 | 0 | 0 | 6 |
| Salmonella Agona | 7 | 6 | 0 | 0 | 14 | 7 | 0 | 1 | 0 | 0 | 0 | 0 | 0 | 35 |
| Salmonella Alachua | 0 | 0 | 1 | 0 | 0 | 1 | 0 | 0 | 0 | 0 | 0 | 0 | 0 | 2 |
| Salmonella Albany | 0 | 0 | 0 | 0 | 2 | 0 | 0 | 0 | 0 | 0 | 0 | 0 | 0 | 2 |
| Salmonella Altona | 0 | 0 | 0 | 0 | 1 | 0 | 0 | 0 | 0 | 0 | 0 | 0 | 0 | 1 |
| Salmonella Amounderness | 0 | 0 | 0 | 0 | 1 | 0 | 0 | 0 | 0 | 0 | 0 | 0 | 0 | 1 |
| Salmonella Anatum | 2 | 1 | 0 | 0 | 15 | 7 | 1 | 0 | 0 | 0 | 0 | 0 | 0 | 26 |
| Salmonella Apapa | 0 | 0 | 0 | 0 | 1 | 0 | 0 | 0 | 0 | 0 | 0 | 0 | 0 | 1 |
| Salmonella Apeyeme | 2 | 0 | 0 | 0 | 0 | 0 | 0 | 0 | 0 | 0 | 0 | 0 | 0 | 2 |
| Salmonella Arechavaleta | 0 | 0 | 0 | 0 | 2 | 0 | 0 | 0 | 0 | 0 | 0 | 0 | 0 | 2 |
| Salmonella Austin | 0 | 0 | 0 | 0 | 1 | 0 | 0 | 0 | 0 | 0 | 0 | 0 | 0 | 1 |
| Salmonella Bareilly | 2 | 2 | 0 | 1 | 7 | 0 | 0 | 0 | 0 | 0 | 0 | 0 | 0 | 12 |
| Salmonella Berta | 0 | 0 | 0 | 0 | 4 | 1 | 0 | 0 | 0 | 0 | 0 | 0 | 0 | 5 |
| Salmonella Blockley | 0 | 0 | 0 | 0 | 2 | 5 | 0 | 0 | 0 | 0 | 0 | 0 | 0 | 7 |
| Salmonella Bonariensis | 0 | 0 | 0 | 0 | 2 | 0 | 0 | 0 | 0 | 0 | 0 | 0 | 0 | 2 |
| Salmonella Bovismorbificans | 1 | 1 | 0 | 0 | 2 | 1 | 0 | 0 | 0 | 0 | 0 | 0 | 0 | 5 |
| Salmonella Braenderup | 11 | 13 | 2 | 4 | 35 | 11 | 3 | 1 | 0 | 0 | 0 | 1 | 0 | 81 |
| Salmonella Brancaster | 0 | 0 | 0 | 0 | 1 | 0 | 0 | 0 | 0 | 0 | 0 | 0 | 0 | 1 |
| Salmonella Brandenburg | 4 | 3 | 3 | 0 | 5 | 8 | 0 | 0 | 0 | 0 | 0 | 0 | 0 | 23 |
| Salmonella Breda | 0 | 0 | 0 | 1 | 0 | 0 | 0 | 0 | 0 | 0 | 0 | 0 | 0 | 1 |
| Salmonella Bredeney | 0 | 0 | 1 | 0 | 2 | 1 | 0 | 0 | 0 | 0 | 0 | 0 | 0 | 4 |
| Salmonella Brunei | 1 | 0 | 0 | 0 | 0 | 0 | 0 | 0 | 0 | 0 | 0 | 0 | 0 | 1 |
| Salmonella Cerro | 0 | 0 | 0 | 0 | 2 | 0 | 0 | 0 | 0 | 0 | 0 | 0 | 0 | 2 |
| Salmonella Chandans | 0 | 0 | 0 | 0 | 0 | 2 | 0 | 0 | 0 | 0 | 0 | 0 | 0 | 2 |
| Salmonella Chester | 2 | 0 | 0 | 0 | 4 | 1 | 0 | 0 | 0 | 0 | 0 | 0 | 0 | 7 |
| Salmonella Chicago | 0 | 0 | 0 | 0 | 1 | 0 | 0 | 0 | 0 | 0 | 0 | 0 | 0 | 1 |
| Salmonella Choleraesuis | 1 | 0 | 0 | 0 | 0 | 0 | 1 | 0 | 0 | 0 | 0 | 0 | 0 | 2 |
| Salmonella Choleraesuis var Decatur | 0 | 0 | 0 | 0 | 1 | 0 | 0 | 0 | 0 | 0 | 0 | 0 | 0 | 1 |
| Salmonella Choleraesuis var Kunzendorf | 0 | 0 | 0 | 0 | 1 | 0 | 0 | 0 | 0 | 0 | 0 | 0 | 0 | 1 |
| Salmonella Coeln | 1 | 3 | 0 | 0 | 3 | 2 | 2 | 0 | 0 | 0 | 0 | 0 | 0 | 11 |
| Salmonella Colindale | 0 | 1 | 0 | 0 | 0 | 1 | 0 | 0 | 0 | 0 | 0 | 0 | 0 | 2 |
| Salmonella Corvallis | 3 | 0 | 0 | 1 | 8 | 2 | 0 | 0 | 0 | 0 | 0 | 0 | 0 | 14 |
| Salmonella Cotham | 0 | 0 | 1 | 0 | 0 | 1 | 0 | 0 | 0 | 0 | 0 | 0 | 0 | 2 |
| Salmonella Cubana | 2 | 3 | 0 | 0 | 0 | 0 | 0 | 0 | 0 | 0 | 0 | 0 | 0 | 5 |
| Salmonella Daytona | 2 | 0 | 0 | 0 | 0 | 0 | 0 | 0 | 0 | 0 | 0 | 0 | 0 | 2 |
| Salmonella Derby | 1 | 1 | 0 | 2 | 5 | 4 | 0 | 0 | 0 | 0 | 0 | 0 | 0 | 13 |
| Salmonella Dublin | 2 | 2 | 0 | 0 | 6 | 17 | 0 | 0 | 0 | 0 | 0 | 0 | 0 | 27 |
| Salmonella Durban | 0 | 1 | 0 | 0 | 2 | 0 | 1 | 0 | 0 | 0 | 0 | 0 | 0 | 4 |
| Salmonella Ealing | 0 | 0 | 0 | 0 | 1 | 0 | 0 | 0 | 0 | 0 | 0 | 0 | 0 | 1 |
| Salmonella Eastbourne | 0 | 0 | 0 | 0 | 4 | 0 | 0 | 0 | 0 | 0 | 0 | 0 | 0 | 4 |
| Salmonella Emek | 1 | 0 | 0 | 0 | 0 | 0 | 0 | 0 | 0 | 0 | 0 | 0 | 0 | 1 |
| Salmonella Enteritidis | 303 | 138 | 43 | 42 | 357 | 232 | 70 | 104 | 5 | 127 | 1 | 0 | 0 | 1,422 |
| Salmonella Essen | 0 | 1 | 0 | 0 | 0 | 0 | 0 | 0 | 0 | 0 | 0 | 0 | 0 | 1 |
| Salmonella Fluntern | 0 | 0 | 0 | 0 | 1 | 0 | 0 | 0 | 0 | 0 | 0 | 0 | 0 | 1 |
| Salmonella Freetown | 0 | 0 | 0 | 0 | 2 | 0 | 0 | 0 | 0 | 0 | 0 | 0 | 0 | 2 |
| Salmonella Gaminara | 0 | 0 | 0 | 1 | 1 | 0 | 0 | 0 | 0 | 0 | 0 | 0 | 0 | 2 |
| Salmonella Georgia | 0 | 0 | 0 | 0 | 0 | 0 | 0 | 1 | 0 | 0 | 0 | 0 | 0 | 1 |
| Salmonella Give | 0 | 2 | 1 | 3 | 8 | 1 | 0 | 0 | 0 | 0 | 0 | 0 | 0 | 15 |
| Salmonella Glostrup | 0 | 0 | 0 | 0 | 0 | 1 | 0 | 0 | 0 | 0 | 0 | 0 | 0 | 1 |
| Salmonella Grumpensis | 0 | 0 | 0 | 0 | 0 | 1 | 0 | 0 | 0 | 0 | 0 | 0 | 0 | 1 |
| Salmonella Hadar | 5 | 4 | 1 | 1 | 41 | 5 | 2 | 0 | 0 | 0 | 0 | 0 | 0 | 59 |
| Salmonella Haifa | 0 | 0 | 0 | 0 | 0 | 1 | 0 | 0 | 0 | 0 | 0 | 0 | 0 | 1 |
| Salmonella Hartford | 0 | 0 | 0 | 0 | 6 | 0 | 0 | 0 | 0 | 0 | 0 | 0 | 0 | 6 |
| Salmonella Havana | 1 | 0 | 0 | 0 | 2 | 0 | 0 | 0 | 0 | 0 | 0 | 0 | 0 | 3 |
| Salmonella Heidelberg | 9 | 13 | 2 | 5 | 113 | 50 | 6 | 3 | 0 | 6 | 0 | 0 | 0 | 207 |
| Salmonella Hvittingfoss | 0 | 0 | 0 | 0 | 1 | 2 | 0 | 0 | 0 | 0 | 0 | 0 | 0 | 3 |
| Salmonella Idikan | 0 | 0 | 0 | 0 | 1 | 0 | 0 | 0 | 0 | 0 | 0 | 0 | 0 | 1 |
| Salmonella Indiana | 2 | 0 | 1 | 1 | 1 | 0 | 0 | 0 | 0 | 0 | 0 | 0 | 0 | 5 |
| Salmonella Infantis | 11 | 18 | 4 | 10 | 72 | 67 | 6 | 5 | 1 | 4 | 0 | 0 | 0 | 198 |
| Salmonella Isangi | 0 | 0 | 0 | 0 | 0 | 1 | 0 | 0 | 0 | 0 | 0 | 0 | 0 | 1 |
| Salmonella Javiana | 3 | 7 | 1 | 3 | 16 | 16 | 2 | 2 | 0 | 0 | 0 | 0 | 0 | 50 |
| Salmonella Jedburgh | 0 | 0 | 0 | 0 | 1 | 0 | 0 | 0 | 0 | 0 | 0 | 0 | 0 | 1 |
| Salmonella Johannesburg | 0 | 1 | 0 | 0 | 0 | 0 | 0 | 0 | 0 | 0 | 0 | 0 | 0 | 1 |
| Salmonella Kedougou | 0 | 0 | 2 | 0 | 0 | 1 | 0 | 0 | 0 | 0 | 0 | 0 | 0 | 3 |
| Salmonella Kentucky | 6 | 1 | 0 | 0 | 7 | 3 | 0 | 0 | 0 | 1 | 0 | 0 | 0 | 18 |
| Salmonella Kiambu | 0 | 2 | 4 | 1 | 3 | 0 | 0 | 0 | 0 | 0 | 0 | 0 | 0 | 10 |
| Salmonella Kisarawe | 0 | 0 | 0 | 0 | 1 | 0 | 0 | 0 | 0 | 0 | 0 | 0 | 0 | 1 |
| Salmonella Kisii | 0 | 0 | 0 | 0 | 1 | 0 | 0 | 0 | 0 | 0 | 0 | 0 | 0 | 1 |
| Salmonella Kottbus | 0 | 0 | 0 | 0 | 0 | 1 | 0 | 0 | 0 | 0 | 0 | 0 | 0 | 1 |
| Salmonella Lattenkamp | 0 | 0 | 0 | 0 | 1 | 0 | 0 | 0 | 0 | 0 | 0 | 0 | 0 | 1 |
| Salmonella Lexington | 0 | 0 | 0 | 0 | 1 | 0 | 0 | 0 | 0 | 0 | 0 | 0 | 0 | 1 |
| Salmonella Litchfield | 1 | 1 | 0 | 1 | 13 | 6 | 1 | 0 | 0 | 1 | 0 | 0 | 0 | 24 |
| Salmonella Liverpool | 1 | 0 | 0 | 0 | 1 | 0 | 0 | 0 | 0 | 0 | 0 | 0 | 0 | 2 |
| Salmonella Livingstone | 0 | 0 | 0 | 0 | 5 | 1 | 0 | 0 | 0 | 0 | 0 | 0 | 0 | 6 |
| Salmonella Lomalinda | 0 | 0 | 0 | 1 | 3 | 0 | 0 | 0 | 0 | 0 | 0 | 0 | 0 | 4 |
| Salmonella Lome | 0 | 0 | 0 | 0 | 6 | 3 | 0 | 0 | 0 | 0 | 0 | 0 | 0 | 9 |
| Salmonella London | 1 | 1 | 1 | 1 | 0 | 1 | 0 | 0 | 0 | 0 | 0 | 0 | 0 | 5 |
| Salmonella Manhattan | 0 | 1 | 0 | 0 | 1 | 0 | 0 | 1 | 0 | 0 | 0 | 0 | 0 | 3 |
| Salmonella Matopeni | 1 | 0 | 0 | 0 | 2 | 0 | 0 | 0 | 0 | 0 | 0 | 0 | 0 | 3 |
| Salmonella Mbandaka | 3 | 1 | 2 | 0 | 3 | 1 | 0 | 2 | 0 | 0 | 0 | 0 | 0 | 12 |
| Salmonella Miami | 0 | 0 | 0 | 0 | 10 | 2 | 1 | 0 | 0 | 0 | 0 | 0 | 0 | 13 |
| Salmonella Michigan | 1 | 0 | 0 | 0 | 0 | 0 | 0 | 0 | 0 | 0 | 0 | 0 | 0 | 1 |
| Salmonella Mikawasima | 0 | 0 | 0 | 0 | 1 | 0 | 0 | 0 | 0 | 0 | 0 | 0 | 0 | 1 |
| Salmonella Minnesota | 1 | 0 | 0 | 0 | 1 | 0 | 0 | 0 | 0 | 0 | 0 | 0 | 0 | 2 |
| Salmonella Mississippi | 1 | 0 | 0 | 0 | 5 | 4 | 0 | 0 | 0 | 0 | 0 | 0 | 0 | 10 |
| Salmonella Molade | 1 | 0 | 0 | 0 | 0 | 0 | 0 | 0 | 0 | 0 | 0 | 0 | 0 | 1 |
| Salmonella Montevideo | 6 | 3 | 0 | 1 | 8 | 52 | 1 | 0 | 0 | 0 | 0 | 0 | 0 | 71 |
| Salmonella Muenchen | 6 | 7 | 1 | 4 | 25 | 10 | 0 | 2 | 0 | 0 | 0 | 0 | 0 | 55 |
| Salmonella Muenster | 4 | 4 | 1 | 1 | 10 | 2 | 0 | 0 | 0 | 0 | 0 | 0 | 0 | 22 |
| Salmonella Nchanga | 0 | 0 | 0 | 0 | 1 | 0 | 0 | 0 | 0 | 0 | 0 | 0 | 0 | 1 |
| Salmonella Newport | 153 | 322 | 38 | 34 | 91 | 50 | 0 | 3 | 1 | 1 | 0 | 0 | 0 | 693 |
| Salmonella Norwich | 0 | 0 | 0 | 0 | 1 | 3 | 0 | 0 | 0 | 0 | 0 | 0 | 0 | 4 |
| Salmonella Oakland | 0 | 0 | 0 | 0 | 0 | 1 | 0 | 0 | 0 | 0 | 0 | 0 | 0 | 1 |
| Salmonella Ohio | 0 | 0 | 0 | 0 | 3 | 1 | 0 | 0 | 0 | 0 | 0 | 0 | 0 | 4 |
| Salmonella Okatie | 1 | 0 | 0 | 0 | 2 | 0 | 0 | 0 | 0 | 0 | 0 | 0 | 0 | 3 |
| Salmonella Oranienburg | 9 | 9 | 2 | 0 | 32 | 16 | 2 | 0 | 0 | 1 | 0 | 0 | 0 | 71 |
| Salmonella Orientalis | 0 | 1 | 0 | 0 | 0 | 0 | 0 | 0 | 0 | 0 | 0 | 0 | 0 | 1 |
| Salmonella Oslo | 2 | 0 | 0 | 0 | 2 | 0 | 0 | 0 | 0 | 0 | 0 | 0 | 0 | 4 |
| Salmonella Ouakam | 0 | 0 | 1 | 0 | 0 | 0 | 0 | 0 | 0 | 0 | 0 | 0 | 0 | 1 |
| Salmonella Panama | 5 | 3 | 0 | 0 | 11 | 3 | 0 | 2 | 0 | 0 | 0 | 0 | 0 | 24 |
| Salmonella Paratyphi A | 15 | 10 | 0 | 0 | 30 | 4 | 0 | 0 | 0 | 0 | 0 | 0 | 0 | 59 |
| Salmonella Paratyphi B | 0 | 0 | 0 | 0 | 2 | 0 | 0 | 0 | 0 | 0 | 0 | 0 | 0 | 2 |
| Salmonella Paratyphi B var. Java | 16 | 9 | 0 | 0 | 8 | 6 | 2 | 1 | 0 | 1 | 0 | 0 | 0 | 43 |
| Salmonella Pensacola | 0 | 0 | 0 | 0 | 1 | 0 | 0 | 0 | 0 | 0 | 0 | 0 | 0 | 1 |
| Salmonella Plymouth | 0 | 0 | 0 | 0 | 0 | 1 | 0 | 0 | 0 | 0 | 0 | 0 | 0 | 1 |
| Salmonella Pomona | 0 | 0 | 0 | 0 | 2 | 0 | 0 | 0 | 0 | 0 | 0 | 0 | 0 | 2 |
| Salmonella Poona | 1 | 4 | 0 | 0 | 13 | 3 | 1 | 0 | 0 | 0 | 0 | 0 | 0 | 22 |
| Salmonella Praha | 0 | 0 | 0 | 0 | 1 | 0 | 0 | 0 | 0 | 0 | 0 | 0 | 0 | 1 |
| Salmonella Putten | 0 | 0 | 0 | 0 | 0 | 2 | 0 | 0 | 0 | 0 | 0 | 0 | 0 | 2 |
| Salmonella Reading | 15 | 8 | 8 | 13 | 6 | 0 | 0 | 0 | 0 | 0 | 0 | 0 | 0 | 50 |
| Salmonella Richmond | 1 | 0 | 0 | 0 | 2 | 0 | 0 | 0 | 0 | 0 | 0 | 0 | 0 | 3 |
| Salmonella Rissen | 2 | 1 | 0 | 0 | 0 | 1 | 0 | 0 | 0 | 0 | 0 | 0 | 0 | 4 |
| Salmonella Rubislaw | 0 | 0 | 0 | 1 | 2 | 0 | 0 | 0 | 0 | 0 | 0 | 0 | 0 | 3 |
| Salmonella Saintpaul | 9 | 6 | 2 | 3 | 14 | 4 | 3 | 1 | 0 | 0 | 0 | 0 | 0 | 42 |
| Salmonella Sandiego | 0 | 0 | 0 | 0 | 8 | 5 | 0 | 0 | 0 | 0 | 0 | 0 | 0 | 13 |
| Salmonella Schwarzengrund | 2 | 9 | 0 | 7 | 6 | 1 | 0 | 0 | 0 | 0 | 0 | 0 | 0 | 25 |
| Salmonella Senftenberg | 4 | 2 | 1 | 0 | 7 | 2 | 0 | 0 | 0 | 0 | 0 | 0 | 0 | 16 |
| Salmonella Singapore | 0 | 0 | 0 | 0 | 1 | 0 | 0 | 0 | 0 | 0 | 0 | 0 | 0 | 1 |
| Salmonella Soerenga | 0 | 0 | 0 | 0 | 1 | 0 | 0 | 0 | 0 | 0 | 0 | 0 | 0 | 1 |
| Salmonella Splott | 1 | 0 | 0 | 0 | 0 | 0 | 0 | 0 | 0 | 0 | 0 | 0 | 0 | 1 |
| Salmonella Stanley | 10 | 4 | 0 | 1 | 10 | 2 | 0 | 0 | 0 | 2 | 0 | 0 | 0 | 29 |
| Salmonella Stanleyville | 0 | 0 | 0 | 0 | 1 | 3 | 0 | 0 | 0 | 0 | 0 | 0 | 0 | 4 |
| Salmonella Telelkebir | 0 | 1 | 0 | 0 | 3 | 0 | 0 | 0 | 0 | 0 | 0 | 0 | 0 | 4 |
| Salmonella Tennessee | 0 | 1 | 0 | 0 | 5 | 1 | 0 | 0 | 0 | 0 | 0 | 0 | 0 | 7 |
| Salmonella Thompson | 7 | 2 | 0 | 2 | 69 | 40 | 2 | 4 | 0 | 0 | 0 | 0 | 0 | 126 |
| Salmonella Typhi | 20 | 11 | 7 | 5 | 59 | 11 | 0 | 0 | 0 | 0 | 0 | 0 | 0 | 113 |
| Salmonella Typhimurium | 49 | 55 | 10 | 18 | 208 | 116 | 2 | 3 | 3 | 4 | 0 | 0 | 0 | 468 |
| Salmonella Uganda | 1 | 2 | 0 | 3 | 7 | 3 | 1 | 1 | 0 | 1 | 0 | 0 | 0 | 19 |
| Salmonella Veneziana | 1 | 0 | 0 | 0 | 0 | 0 | 0 | 0 | 0 | 0 | 0 | 0 | 0 | 1 |
| Salmonella Virchow | 1 | 4 | 0 | 1 | 1 | 3 | 0 | 0 | 0 | 0 | 0 | 0 | 0 | 10 |
| Salmonella Wandsworth | 0 | 0 | 0 | 0 | 1 | 0 | 0 | 0 | 0 | 0 | 0 | 0 | 0 | 1 |
| Salmonella Wangata | 0 | 0 | 0 | 0 | 1 | 1 | 0 | 0 | 0 | 0 | 0 | 0 | 0 | 2 |
| Salmonella Waral | 0 | 0 | 0 | 0 | 1 | 0 | 0 | 0 | 0 | 0 | 0 | 0 | 0 | 1 |
| Salmonella Waycross | 0 | 0 | 0 | 0 | 1 | 0 | 0 | 0 | 0 | 0 | 0 | 0 | 0 | 1 |
| Salmonella Weltevreden | 3 | 5 | 1 | 0 | 6 | 0 | 0 | 0 | 0 | 0 | 0 | 0 | 0 | 15 |
| Salmonella Worthington | 1 | 0 | 0 | 0 | 0 | 0 | 0 | 0 | 0 | 0 | 0 | 0 | 0 | 1 |
| Salmonella bongori 48:z35:- | 0 | 0 | 0 | 0 | 1 | 0 | 0 | 0 | 0 | 0 | 0 | 0 | 0 | 1 |
| Salmonella sp | 0 | 0 | 0 | 2 | 0 | 0 | 0 | 0 | 0 | 56 | 0 | 0 | 0 | 58 |
| Salmonella ssp I | 1 | 0 | 0 | 0 | 0 | 0 | 0 | 0 | 1 | 0 | 0 | 0 | 0 | 2 |
| Salmonella ssp I 13,23:b:- | 0 | 0 | 0 | 0 | 1 | 0 | 0 | 0 | 0 | 0 | 0 | 0 | 0 | 1 |
| Salmonella ssp I 17:-:- | 1 | 0 | 0 | 0 | 0 | 0 | 0 | 0 | 0 | 0 | 0 | 0 | 0 | 1 |
| Salmonella ssp I 3,10:-:1,6 | 0 | 0 | 0 | 0 | 1 | 0 | 0 | 0 | 0 | 0 | 0 | 0 | 0 | 1 |
| Salmonella ssp I 4,[5],12:-:- | 0 | 0 | 0 | 0 | 2 | 2 | 0 | 0 | 0 | 0 | 0 | 0 | 0 | 4 |
| Salmonella ssp I 4,[5],12:b:- | 0 | 0 | 0 | 0 | 17 | 10 | 0 | 0 | 0 | 0 | 0 | 0 | 0 | 27 |
| Salmonella ssp I 4,[5],12:d:1,7 | 0 | 0 | 0 | 0 | 0 | 1 | 0 | 0 | 0 | 0 | 0 | 0 | 0 | 1 |
| Salmonella ssp I 4,[5],12:i:- | 14 | 24 | 4 | 2 | 76 | 113 | 11 | 8 | 0 | 4 | 0 | 0 | 0 | 256 |
| Salmonella ssp I 47:z4,z23:- | 0 | 0 | 0 | 0 | 0 | 1 | 0 | 0 | 0 | 0 | 0 | 0 | 0 | 1 |
| Salmonella ssp I 48:-:-:z58 | 0 | 0 | 0 | 0 | 1 | 0 | 0 | 0 | 0 | 0 | 0 | 0 | 0 | 1 |
| Salmonella ssp I 6,7,[14]:c:- | 0 | 0 | 0 | 0 | 0 | 1 | 0 | 0 | 0 | 0 | 0 | 0 | 0 | 1 |
| Salmonella ssp I 6,7:-:- | 0 | 0 | 0 | 0 | 3 | 0 | 0 | 0 | 0 | 0 | 0 | 0 | 0 | 3 |
| Salmonella ssp I 6,7:c:- | 0 | 0 | 0 | 0 | 0 | 1 | 0 | 0 | 0 | 0 | 0 | 0 | 0 | 1 |
| Salmonella ssp I 6,7:z4,z23:- | 0 | 0 | 0 | 0 | 0 | 1 | 0 | 0 | 0 | 0 | 0 | 0 | 0 | 1 |
| Salmonella ssp I 6,8,[20]:-:z6 | 0 | 0 | 0 | 0 | 0 | 1 | 0 | 0 | 0 | 0 | 0 | 0 | 0 | 1 |
| Salmonella ssp I 6,8:-:1,5 | 1 | 0 | 0 | 0 | 0 | 0 | 0 | 0 | 0 | 0 | 0 | 0 | 0 | 1 |
| Salmonella ssp I 9,12:-:- | 0 | 0 | 0 | 0 | 1 | 0 | 0 | 0 | 0 | 0 | 0 | 0 | 0 | 1 |
| Salmonella ssp I 9,12:-:1,5 | 0 | 0 | 0 | 0 | 1 | 2 | 0 | 0 | 0 | 0 | 0 | 0 | 0 | 3 |
| Salmonella ssp I O Untypeable:HNM | 0 | 0 | 0 | 0 | 0 | 3 | 0 | 0 | 0 | 0 | 0 | 0 | 0 | 3 |
| Salmonella ssp I O Untypeable:g,m:- | 0 | 0 | 0 | 0 | 0 | 1 | 0 | 0 | 0 | 0 | 0 | 0 | 0 | 1 |
| Salmonella ssp I Rough-O:H r:- | 0 | 0 | 0 | 0 | 2 | 0 | 0 | 0 | 0 | 0 | 0 | 0 | 0 | 2 |
| Salmonella ssp I Rough-O:H undetermined | 0 | 0 | 0 | 0 | 1 | 0 | 0 | 0 | 0 | 0 | 0 | 0 | 0 | 1 |
| Salmonella ssp I Rough-O:HNM | 0 | 0 | 0 | 0 | 6 | 1 | 0 | 0 | 0 | 0 | 0 | 0 | 0 | 7 |
| Salmonella ssp I Rough-O:a:- | 0 | 0 | 0 | 0 | 1 | 0 | 0 | 0 | 0 | 0 | 0 | 0 | 0 | 1 |
| Salmonella ssp I Rough-O:a:1,7 | 0 | 0 | 0 | 0 | 1 | 0 | 0 | 0 | 0 | 0 | 0 | 0 | 0 | 1 |
| Salmonella ssp I Rough-O:g,m:- | 0 | 0 | 0 | 0 | 2 | 1 | 0 | 0 | 0 | 0 | 0 | 0 | 0 | 3 |
| Salmonella ssp I Rough-O:i:- | 0 | 0 | 0 | 0 | 1 | 0 | 0 | 0 | 0 | 0 | 0 | 0 | 0 | 1 |
| Salmonella ssp I Rough-O:i:1,2 | 0 | 0 | 0 | 0 | 1 | 0 | 0 | 0 | 0 | 0 | 0 | 0 | 0 | 1 |
| Salmonella ssp I Rough-O:m,t:- | 0 | 0 | 0 | 0 | 1 | 0 | 0 | 0 | 0 | 0 | 0 | 0 | 0 | 1 |
| Salmonella ssp I Rough-O:z29:- | 0 | 0 | 0 | 0 | 0 | 0 | 0 | 0 | 0 | 0 | 1 | 0 | 0 | 1 |
| Salmonella ssp II 16:m,t:[z42] | 0 | 1 | 0 | 0 | 0 | 0 | 0 | 0 | 0 | 0 | 0 | 0 | 0 | 1 |
| Salmonella ssp IIIa 11:z4,z23:- | 0 | 0 | 0 | 0 | 0 | 1 | 0 | 0 | 0 | 0 | 0 | 0 | 0 | 1 |
| Salmonella ssp IIIa 41:z4,z23:- | 0 | 0 | 0 | 0 | 3 | 1 | 0 | 0 | 0 | 0 | 0 | 0 | 0 | 4 |
| Salmonella ssp IIIa 48:g,z51:- | 0 | 1 | 0 | 0 | 0 | 0 | 0 | 0 | 0 | 0 | 0 | 0 | 0 | 1 |
| Salmonella ssp IIIa 56:z4,z23:- | 0 | 0 | 0 | 0 | 0 | 1 | 0 | 0 | 0 | 0 | 0 | 0 | 0 | 1 |
| Salmonella ssp IIIb | 0 | 0 | 0 | 2 | 0 | 0 | 0 | 0 | 0 | 0 | 0 | 0 | 0 | 2 |
| Salmonella ssp IIIb 38:l,v:z35 | 0 | 0 | 0 | 0 | 0 | 2 | 0 | 0 | 0 | 0 | 0 | 0 | 0 | 2 |
| Salmonella ssp IIIb 50:k:z | 0 | 0 | 0 | 0 | 2 | 0 | 0 | 0 | 0 | 0 | 0 | 0 | 0 | 2 |
| Salmonella ssp IIIb 50:r:z53 | 0 | 0 | 0 | 0 | 0 | 1 | 0 | 0 | 0 | 0 | 0 | 0 | 0 | 1 |
| Salmonella ssp IIIb 50:r:z:[z67] | 0 | 0 | 0 | 0 | 2 | 0 | 0 | 0 | 0 | 0 | 0 | 0 | 0 | 2 |
| Salmonella ssp IIIb 50:z:z52 | 0 | 0 | 0 | 0 | 1 | 0 | 0 | 0 | 0 | 0 | 0 | 0 | 0 | 1 |
| Salmonella ssp IIIb 53:z10:z35 | 0 | 0 | 0 | 0 | 0 | 0 | 0 | 1 | 0 | 0 | 0 | 0 | 0 | 1 |
| Salmonella ssp IIIb 58:z52:- | 0 | 0 | 0 | 0 | 1 | 0 | 0 | 0 | 0 | 0 | 0 | 0 | 0 | 1 |
| Salmonella ssp IIIb 61:k:1,5 | 0 | 0 | 0 | 0 | 0 | 1 | 0 | 0 | 0 | 0 | 0 | 0 | 0 | 1 |
| Salmonella ssp IIIb 61:l,v:1,5,7:[z57] | 0 | 1 | 0 | 0 | 0 | 0 | 0 | 0 | 0 | 0 | 0 | 0 | 0 | 1 |
| Salmonella ssp IIIb 61:r:z53:[z47],[z50 | 0 | 1 | 0 | 0 | 0 | 0 | 0 | 0 | 0 | 0 | 0 | 0 | 0 | 1 |
| Salmonella ssp IIIb 61:z52:z53 | 0 | 0 | 0 | 0 | 1 | 0 | 0 | 0 | 0 | 0 | 0 | 0 | 0 | 1 |
| Salmonella ssp IIIb Rough-O:l,v:z35 | 0 | 0 | 0 | 0 | 0 | 1 | 0 | 0 | 0 | 0 | 0 | 0 | 0 | 1 |
| Salmonella ssp IIIb Rough-O:r:z | 0 | 0 | 0 | 0 | 1 | 0 | 0 | 0 | 0 | 0 | 0 | 0 | 0 | 1 |
| Salmonella ssp IIIb Rough-O:z10:- | 0 | 0 | 0 | 0 | 1 | 0 | 0 | 0 | 0 | 0 | 0 | 0 | 0 | 1 |
| Salmonella ssp IV | 0 | 0 | 0 | 1 | 0 | 0 | 0 | 0 | 0 | 0 | 0 | 0 | 0 | 1 |
| Salmonella ssp IV 44:z4,z23:- | 0 | 0 | 0 | 0 | 0 | 1 | 0 | 0 | 0 | 0 | 0 | 0 | 0 | 1 |
| Salmonella ssp IV 45:g,z51:- | 0 | 1 | 0 | 0 | 0 | 0 | 0 | 0 | 0 | 0 | 0 | 0 | 0 | 1 |
| Salmonella ssp IV 45:z36,z38:- | 0 | 0 | 0 | 0 | 1 | 0 | 0 | 0 | 0 | 0 | 0 | 0 | 0 | 1 |
| Salmonella ssp IV 48:g,z51:- | 0 | 1 | 0 | 0 | 3 | 1 | 0 | 0 | 0 | 0 | 0 | 0 | 0 | 5 |
| Total Salmonella | 760 | 741 | 148 | 180 | 1,631 | 968 | 122 | 146 | 11 | 209 | 2 | 1 | 0 | 4,919 |
| Organism | BC | AB | SK | MB | ON | QC | NB | NS | PE | NL | YT | NT | NU | Total |
|---|---|---|---|---|---|---|---|---|---|---|---|---|---|---|
| Shigella | 0 | 0 | 0 | 0 | 0 | 0 | 0 | 0 | 0 | 3 | 0 | 0 | 0 | 3 |
| Shigella boydii 1 | 0 | 0 | 0 | 0 | 0 | 1 | 0 | 0 | 0 | 0 | 0 | 0 | 0 | 1 |
| Shigella boydii 12 | 0 | 1 | 0 | 0 | 0 | 1 | 0 | 0 | 0 | 0 | 0 | 0 | 0 | 2 |
| Shigella boydii 18 | 1 | 0 | 0 | 0 | 0 | 0 | 0 | 0 | 0 | 0 | 0 | 0 | 0 | 1 |
| Shigella boydii 2 | 0 | 0 | 0 | 0 | 1 | 1 | 0 | 0 | 0 | 0 | 0 | 0 | 0 | 2 |
| Shigella boydii 20 | 0 | 0 | 0 | 0 | 1 | 0 | 0 | 0 | 0 | 0 | 0 | 0 | 0 | 1 |
| Shigella boydii 4 | 0 | 0 | 0 | 0 | 1 | 0 | 0 | 0 | 0 | 0 | 0 | 0 | 0 | 1 |
| Shigella boydii 9 | 1 | 0 | 0 | 0 | 0 | 0 | 0 | 0 | 0 | 0 | 0 | 0 | 0 | 1 |
| Shigella boydii | 1 | 0 | 0 | 0 | 0 | 0 | 0 | 0 | 0 | 0 | 0 | 0 | 0 | 1 |
| Shigella dysenteriae 2 | 0 | 1 | 0 | 0 | 1 | 0 | 0 | 0 | 0 | 0 | 0 | 0 | 0 | 2 |
| Shigella dysenteriae 4 | 0 | 0 | 0 | 0 | 0 | 1 | 0 | 0 | 0 | 0 | 0 | 0 | 0 | 1 |
| Shigella dysenteriae 9 | 0 | 0 | 0 | 0 | 0 | 2 | 0 | 0 | 0 | 0 | 0 | 0 | 0 | 2 |
| Shigella flexneri 1a | 0 | 0 | 0 | 0 | 7 | 0 | 0 | 0 | 0 | 0 | 0 | 0 | 0 | 7 |
| Shigella flexneri 1b | 4 | 3 | 0 | 0 | 12 | 32 | 0 | 0 | 0 | 0 | 0 | 1 | 0 | 52 |
| Shigella flexneri 2 | 1 | 0 | 0 | 0 | 0 | 0 | 0 | 0 | 0 | 0 | 0 | 0 | 0 | 1 |
| Shigella flexneri 2a | 10 | 9 | 0 | 0 | 23 | 37 | 0 | 0 | 0 | 0 | 0 | 0 | 0 | 79 |
| Shigella flexneri 2b | 0 | 0 | 0 | 0 | 0 | 1 | 0 | 0 | 0 | 0 | 0 | 0 | 0 | 1 |
| Shigella flexneri 3a | 4 | 2 | 0 | 0 | 15 | 7 | 0 | 0 | 0 | 0 | 0 | 0 | 0 | 28 |
| Shigella flexneri 3b | 0 | 0 | 0 | 0 | 3 | 1 | 0 | 0 | 0 | 0 | 0 | 0 | 0 | 4 |
| Shigella flexneri 4a | 0 | 0 | 0 | 0 | 3 | 0 | 0 | 0 | 0 | 0 | 0 | 0 | 0 | 3 |
| Shigella flexneri 4b | 1 | 0 | 0 | 0 | 0 | 0 | 0 | 0 | 0 | 0 | 0 | 0 | 0 | 1 |
| Shigella flexneri 4c | 0 | 0 | 0 | 0 | 0 | 2 | 0 | 0 | 0 | 0 | 0 | 0 | 0 | 2 |
| Shigella flexneri 5a | 0 | 0 | 0 | 0 | 1 | 0 | 0 | 0 | 0 | 0 | 0 | 0 | 0 | 1 |
| Shigella flexneri 6 | 1 | 1 | 0 | 0 | 0 | 1 | 0 | 0 | 0 | 0 | 0 | 0 | 0 | 3 |
| Shigella flexneri | 1 | 0 | 3 | 5 | 0 | 0 | 0 | 1 | 0 | 0 | 0 | 0 | 0 | 10 |
| Shigella flexneri Prov. SH-104 | 0 | 0 | 0 | 0 | 19 | 7 | 0 | 0 | 0 | 0 | 0 | 0 | 0 | 26 |
| Shigella flexneri var. Y | 2 | 0 | 0 | 0 | 2 | 2 | 0 | 0 | 0 | 0 | 0 | 0 | 0 | 6 |
| Shigella sonnei | 29 | 20 | 4 | 5 | 67 | 25 | 0 | 1 | 0 | 0 | 0 | 0 | 0 | 151 |
| Total Shigella | 56 | 37 | 7 | 10 | 156 | 121 | 0 | 2 | 0 | 3 | 0 | 1 | 0 | 393 |
| Organism | BC | AB | SK | MB | ON | QC | NB | NS | PE | NL | YT | NT | NU | Total |
|---|---|---|---|---|---|---|---|---|---|---|---|---|---|---|
| Vibrio alginolyticus | 1 | 3 | 0 | 0 | 0 | 0 | 0 | 0 | 0 | 0 | 0 | 0 | 0 | 4 |
| Vibrio cholerae | 0 | 0 | 0 | 1 | 0 | 0 | 0 | 0 | 0 | 0 | 0 | 0 | 0 | 1 |
| Vibrio cholerae non-O1/O139 | 3 | 0 | 2 | 0 | 1 | 1 | 1 | 0 | 0 | 0 | 0 | 0 | 0 | 8 |
| Vibrio fluvialis | 0 | 0 | 0 | 0 | 0 | 0 | 2 | 1 | 0 | 0 | 0 | 0 | 0 | 3 |
| Vibrio harveyi | 1 | 0 | 0 | 0 | 0 | 0 | 0 | 0 | 0 | 0 | 0 | 0 | 0 | 1 |
| Vibrio parahaemolyticus | 6 | 1 | 1 | 0 | 2 | 0 | 11 | 0 | 6 | 0 | 0 | 0 | 0 | 27 |
| Total Vibrio | 11 | 4 | 3 | 1 | 3 | 1 | 14 | 1 | 6 | 0 | 0 | 0 | 0 | 44 |
| Organism | BC | AB | SK | MB | ON | QC | NB | NS | PE | NL | YT | NT | NU | Total |
|---|---|---|---|---|---|---|---|---|---|---|---|---|---|---|
| Yersinia enterocolitica | 52 | 22 | 9 | 3 | 114 | 18 | 2 | 3 | 0 | 2 | 2 | 0 | 0 | 227 |
| Yersinia frederiksenii | 16 | 3 | 0 | 1 | 0 | 0 | 0 | 0 | 0 | 0 | 0 | 0 | 0 | 20 |
| Yersinia intermedia | 6 | 2 | 1 | 0 | 0 | 0 | 0 | 0 | 0 | 0 | 0 | 0 | 0 | 9 |
| Yersinia kristensenii | 1 | 0 | 0 | 0 | 0 | 0 | 0 | 0 | 0 | 0 | 0 | 0 | 0 | 1 |
| Yersinia massiliensis | 19 | 0 | 0 | 0 | 0 | 0 | 0 | 0 | 0 | 0 | 0 | 0 | 0 | 19 |
| Yersinia mollaretii | 1 | 0 | 0 | 0 | 0 | 0 | 0 | 0 | 0 | 0 | 0 | 0 | 0 | 1 |
| Yersinia pseudotuberculosis | 3 | 0 | 0 | 0 | 0 | 0 | 0 | 0 | 0 | 0 | 0 | 0 | 0 | 3 |
| Yersinia rohdei | 3 | 0 | 0 | 0 | 0 | 0 | 0 | 0 | 0 | 0 | 0 | 0 | 0 | 3 |
| Total Yersinia | 101 | 27 | 10 | 4 | 114 | 18 | 2 | 3 | 0 | 2 | 2 | 0 | 0 | 283 |
| Organism | BC | AB | SK | MB | ON | QC | NB | NS | PE | NL | YT | NT | NU | Total |
|---|---|---|---|---|---|---|---|---|---|---|---|---|---|---|
| Cryptosporidium | 7 | 2 | 7 | 11 | 160 | 0 | 30 | 26 | 10 | 24 | 1 | 0 | 0 | 278 |
| Cyclospora | 1 | 0 | 0 | 0 | 55 | 0 | 2 | 0 | 0 | 9 | 0 | 1 | 0 | 68 |
| Entamoeba histolytica/dispar | 89 | 1 | 2 | 8 | 75 | 0 | 0 | 4 | 0 | 0 | 4 | 0 | 0 | 183 |
| Giardia | 47 | 7 | 33 | 49 | 177 | 0 | 51 | 65 | 4 | 50 | 5 | 0 | 0 | 488 |
| Total Parasites | 144 | 10 | 42 | 68 | 467 | 0 | 83 | 95 | 14 | 83 | 10 | 1 | 0 | 1,017 |
| Organism | BC | AB | SK | MB | ON | QC | NB | NS | PE | NL | YT | NT | NU | Total |
|---|---|---|---|---|---|---|---|---|---|---|---|---|---|---|
| Adenovirus | 1 | 1 | 0 | 7 | 24 | 0 | 0 | 2 | 0 | 12 | 0 | 0 | 0 | 47 |
| Astrovirus | 2 | 9 | 0 | 3 | 0 | 0 | 0 | 0 | 0 | 26 | 0 | 0 | 0 | 40 |
| Enterovirus | 0 | 0 | 0 | 2 | 0 | 0 | 0 | 0 | 0 | 0 | 0 | 0 | 0 | 2 |
| Hepatitis A | 20 | 14 | 20 | 24 | 78 | 34 | 10 | 10 | 2 | 44 | 0 | 0 | 0 | 256 |
| Norovirus | 73 | 43 | 16 | 52 | 280 | 0 | 21 | 35 | 15 | 85 | 2 | 0 | 0 | 622 |
| Rotavirus | 12 | 11 | 4 | 11 | 0 | 0 | 25 | 4 | 2 | 3 | 0 | 0 | 0 | 72 |
| Sapovirus | 4 | 0 | 0 | 14 | 0 | 0 | 0 | 2 | 0 | 8 | 0 | 0 | 0 | 28 |
| Total Virus | 112 | 78 | 40 | 113 | 382 | 34 | 56 | 53 | 19 | 178 | 2 | 0 | 0 | 1,067 |
Appendix C. Impacts of COVID-19. Comparison of NESP weekly isolate counts for 2020 and the average weekly isolate counts for 2015 to 2019 for select pathogens
In March of 2020, the COVID-19 pandemic was declaredFootnote 4 and global public health action was taken to address it. Across Canada and within specific provinces/territories and regions various public health measures were put in place. These included internationalFootnote 5 and domestic travel restrictions, closing of non-essential businesses and activities (including restaurants, gyms, salons, places of worship, etc.), closing of in-person schools and initiating virtual learning, mandating of face coverings in public and indoor spaces, etc. Additionally, increased public health messaging related to hand washing and cough and sneeze etiquette, reminders about staying home if you were feeling unwell and to get tested for COVID-19 were implemented. These public health measures and the adaptations Canadians made to combat COVID-19 not only helped to reduce the transmission of COVID-19 but have also impacted other reported infectious diseases to varying degrees. Interpretation of the 2020 NESP data must be considered in light of these COVID-19 public health measures and adaptations.
The following figures highlight differences seen in the 2020 NESP data compared with the previous five years (2015 to 2019), for select pathogens. The NESP data are plotted along with the COVID-19 national case numbers as a proxy for the stage of the pandemic and the related public health measures and should not be interpreted as having any direct link between these illnesses.
The impact of the COVID-19 public health measures and adaptations varied across pathogens. For all Salmonella (Figure 10), the steep drop beginning around week 13 is likely associated with the initial implementation of public health measures and the international travel. The spike seen starting in week 28 is related to the S. Newport outbreak. Figures 11 and 12 highlight the differences seen between S. Enteritidis alone and all other Salmonella serotypes excluding S. Enteritidis. The decline seen in the 2020 S. Enteritidis data is sustained throughout the year and this is likely related to both the impacts of COVID-19 public health measures, but also the continued impact related to CFIA regulation implemented in April 2019 to address Salmonella in frozen raw breaded chicken products. In Figures 13 and 14, an initial steep drop around weeks 14 and 15 is seen for E. coli O157 and non-O157 STEC, respectively. For E. coli O157, weeks 24 to 41 appear to have a slight decrease in 2020 compared with the historical average, and then around week 41 until the end of 2020 a larger decrease is apparent. In contrast, non-O157 STECappears to rebound around week 22 and keeps pace with the historical average until week 39 where it then appears to have a slight decrease in 2020 compared with the historical average. This slight difference between E. coli O157 and non-O157 STEC trends may in part be due to the overall general increasing trend of non-O157 STECidentification and reporting that has been seen. Figure 15 shows the 2020 trend for Listeria monocytogenes does not differ greatly from the historical average for 2015 to 2019 and in fact slightly exceeds the historical average. This demonstrates the minimal impact the COVID-19 public health measures had on this organism. Listeria monocytogenes is typically not travel-related and causes severe illness, which may in part explain the consistency with pre-COVID-19 pandemic levels of reported data. For Shigella, similar to what is seen for all Salmonella, in figure 16 the large decrease around week 13 followed by a sustained decrease throughout 2020. Shigella is often travel-related and transmitted through person-to-person contact, which may in part explain the large impact the COVID-19 public health measures would have had on this organism.
In general, larger decreases are seen in pathogens that typically have a larger travel-related proportion, are typically milder or are more frequently related to person-to-person contact. In comparison with Listeria monocytogenes as it is typically severe, is not associated with travel and not acquired through person-to-person contact.
The public health measures that were implemented in response to the COVID-19 pandemic were multifaceted; thus, it is challenging to attribute specific measures to specific enteric disease impacts (perhaps with the exception of the impacts of travel restrictions). That the public health measures also likely caused a major shift in food consumption patterns (i.e., decreasing food purchased and consumed outside the home) further complicates our ability to easily discern these individual impacts. Finally, any changes in medical care-seeking behaviours among Canadians as a result of stay-at-home orders and local healthcare system changes may have also influenced these observations; however, this remains unknown at this time. Additional analysis will be done to further explore the impact of COVID-19 on the occurrence of enteric diseases in Canada as collected and reported by NESP.
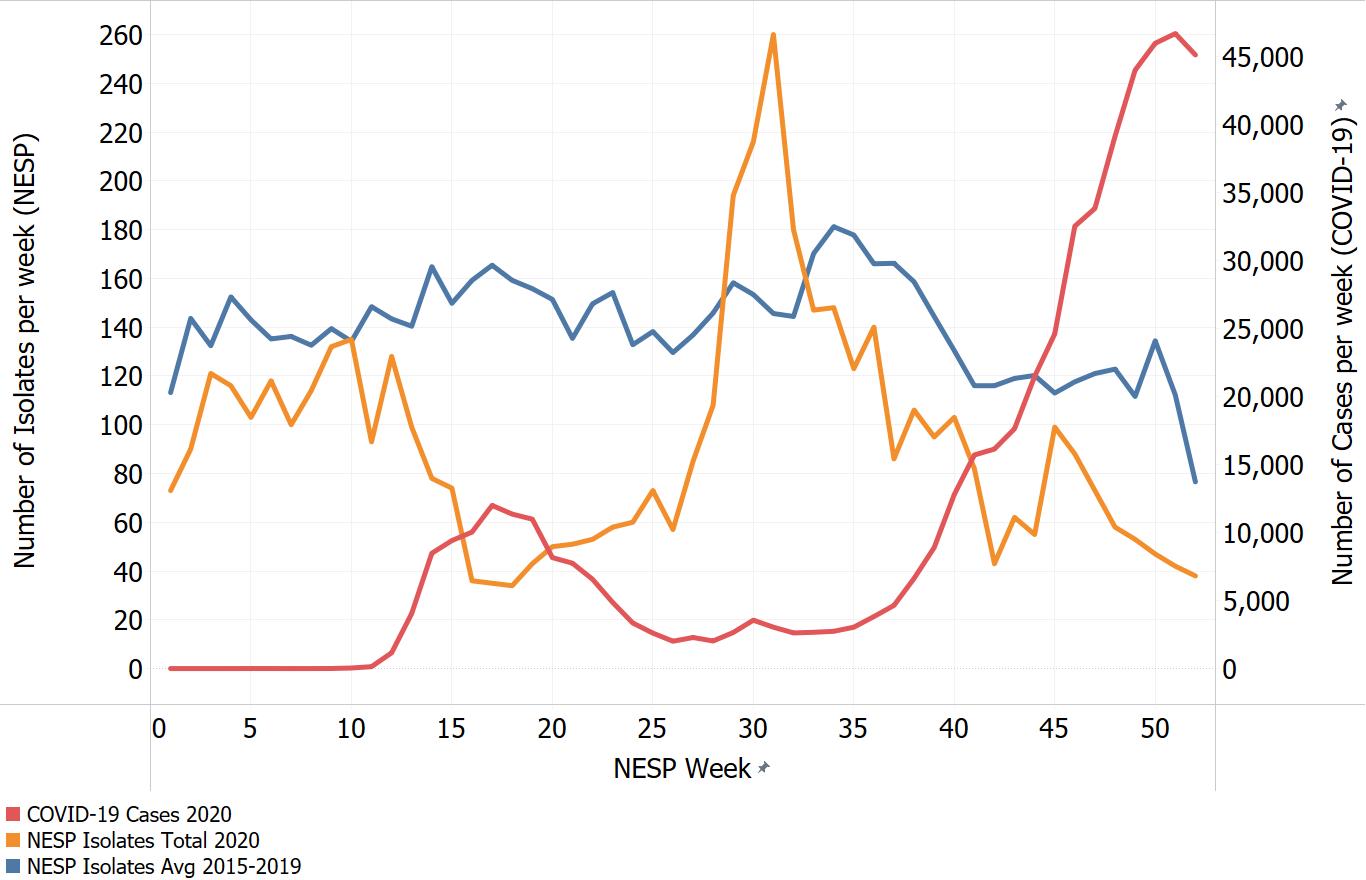
Figure 10 - Text description
| Week Number | COVID-19 Cases 2020 | NESP Isolates Total 2020 | NESP Isolates Avg 2015-2019 |
|---|---|---|---|
| 1 | 0 | 73 | 113.2 |
| 2 | 0 | 90 | 143.6 |
| 3 | 0 | 121 | 132.4 |
| 4 | 0 | 116 | 152.4 |
| 5 | 4 | 103 | 143 |
| 6 | 3 | 118 | 135.2 |
| 7 | 0 | 100 | 136.2 |
| 8 | 2 | 114 | 132.6 |
| 9 | 6 | 132 | 139.4 |
| 10 | 42 | 135 | 134.2 |
| 11 | 140 | 93 | 148.4 |
| 12 | 1161 | 128 | 143.4 |
| 13 | 4054 | 99 | 140.4 |
| 14 | 8479 | 78 | 164.8 |
| 15 | 9414 | 74 | 149.8 |
| 16 | 10035 | 36 | 159.2 |
| 17 | 11997 | 35 | 165.4 |
| 18 | 11359 | 34 | 159.2 |
| 19 | 10988 | 43 | 155.8 |
| 20 | 8159 | 50 | 151.4 |
| 21 | 7748 | 51 | 135.4 |
| 22 | 6564 | 53 | 149.6 |
| 23 | 4867 | 58 | 154.2 |
| 24 | 3353 | 60 | 132.8 |
| 25 | 2609 | 73 | 138.2 |
| 26 | 2013 | 57 | 129.6 |
| 27 | 2284 | 85 | 136.8 |
| 28 | 2030 | 108 | 145.8 |
| 29 | 2653 | 194 | 158.2 |
| 30 | 3557 | 216 | 153.4 |
| 31 | 3043 | 260 | 145.6 |
| 32 | 2622 | 180 | 144.4 |
| 33 | 2668 | 147 | 170.2 |
| 34 | 2740 | 148 | 181.2 |
| 35 | 3043 | 123 | 177.8 |
| 36 | 3822 | 140 | 166 |
| 37 | 4646 | 86 | 166.2 |
| 38 | 6633 | 106 | 158.6 |
| 39 | 8897 | 95 | 144.4 |
| 40 | 12800 | 103 | 130.4 |
| 41 | 15708 | 82 | 116 |
| 42 | 16142 | 43 | 116 |
| 43 | 17638 | 62 | 119 |
| 44 | 21485 | 55 | 120.2 |
| 45 | 24611 | 99 | 113 |
| 46 | 32530 | 88 | 117.6 |
| 47 | 33839 | 73 | 121 |
| 48 | 39136 | 58 | 122.8 |
| 49 | 44007 | 53 | 111.6 |
| 50 | 45982 | 47 | 134.4 |
| 51 | 46693 | 42 | 112.2 |
| 52 | 45124 | 38 | 76.6 |
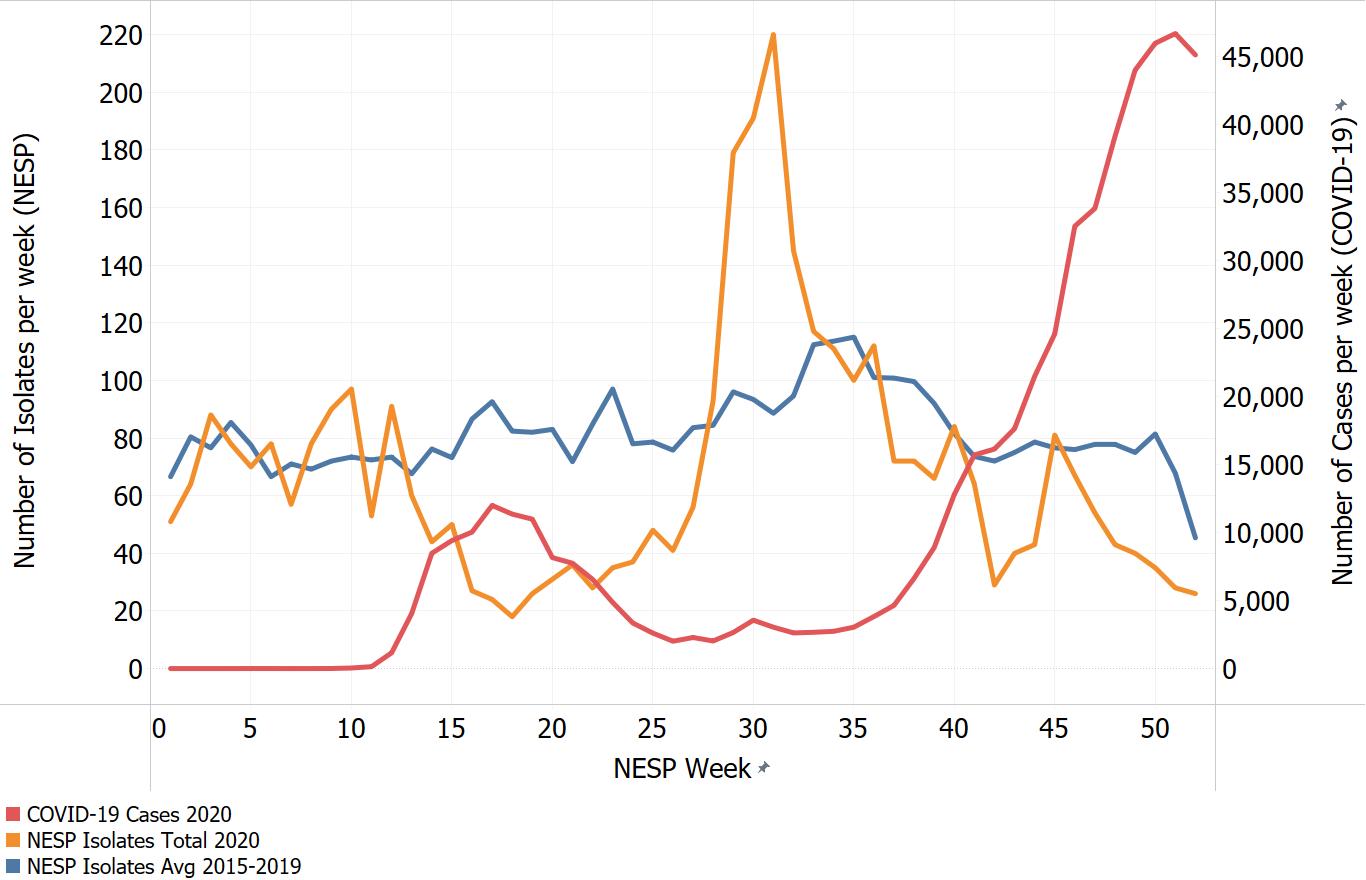
Figure 11 - Text description
| Week Number | COVID-19 Cases 2020 | NESP Isolates Total 2020 | NESP Isolates Avg 2015-2019 |
|---|---|---|---|
| 1 | 0 | 51 | 66.6 |
| 2 | 0 | 64 | 80.4 |
| 3 | 0 | 88 | 76.6 |
| 4 | 0 | 78 | 85.4 |
| 5 | 4 | 70 | 77.6 |
| 6 | 3 | 78 | 66.6 |
| 7 | 0 | 57 | 71 |
| 8 | 2 | 78 | 69.2 |
| 9 | 6 | 90 | 72 |
| 10 | 42 | 97 | 73.4 |
| 11 | 140 | 53 | 72.4 |
| 12 | 1161 | 91 | 73.4 |
| 13 | 4054 | 60 | 67.6 |
| 14 | 8479 | 44 | 76.2 |
| 15 | 9414 | 50 | 73.2 |
| 16 | 10035 | 27 | 86.6 |
| 17 | 11997 | 24 | 92.6 |
| 18 | 11359 | 18 | 82.4 |
| 19 | 10988 | 26 | 82 |
| 20 | 8159 | 31 | 83 |
| 21 | 7748 | 36 | 71.8 |
| 22 | 6564 | 28 | 84.8 |
| 23 | 4867 | 35 | 97 |
| 24 | 3353 | 37 | 78 |
| 25 | 2609 | 48 | 78.6 |
| 26 | 2013 | 41 | 75.8 |
| 27 | 2284 | 56 | 83.6 |
| 28 | 2030 | 93 | 84.4 |
| 29 | 2653 | 179 | 96 |
| 30 | 3557 | 191 | 93.4 |
| 31 | 3043 | 220 | 88.6 |
| 32 | 2622 | 145 | 94.6 |
| 33 | 2668 | 117 | 112.4 |
| 34 | 2740 | 111 | 113.6 |
| 35 | 3043 | 100 | 115 |
| 36 | 3822 | 112 | 101 |
| 37 | 4646 | 72 | 100.8 |
| 38 | 6633 | 72 | 99.6 |
| 39 | 8897 | 66 | 92 |
| 40 | 12800 | 84 | 81.6 |
| 41 | 15708 | 64 | 73.6 |
| 42 | 16142 | 29 | 72 |
| 43 | 17638 | 40 | 75 |
| 44 | 21485 | 43 | 78.6 |
| 45 | 24611 | 81 | 76.6 |
| 46 | 32530 | 67 | 76 |
| 47 | 33839 | 54 | 77.8 |
| 48 | 39136 | 43 | 77.8 |
| 49 | 44007 | 40 | 75 |
| 50 | 45982 | 35 | 81.4 |
| 51 | 46693 | 28 | 67.8 |
| 52 | 45124 | 26 | 45.4 |
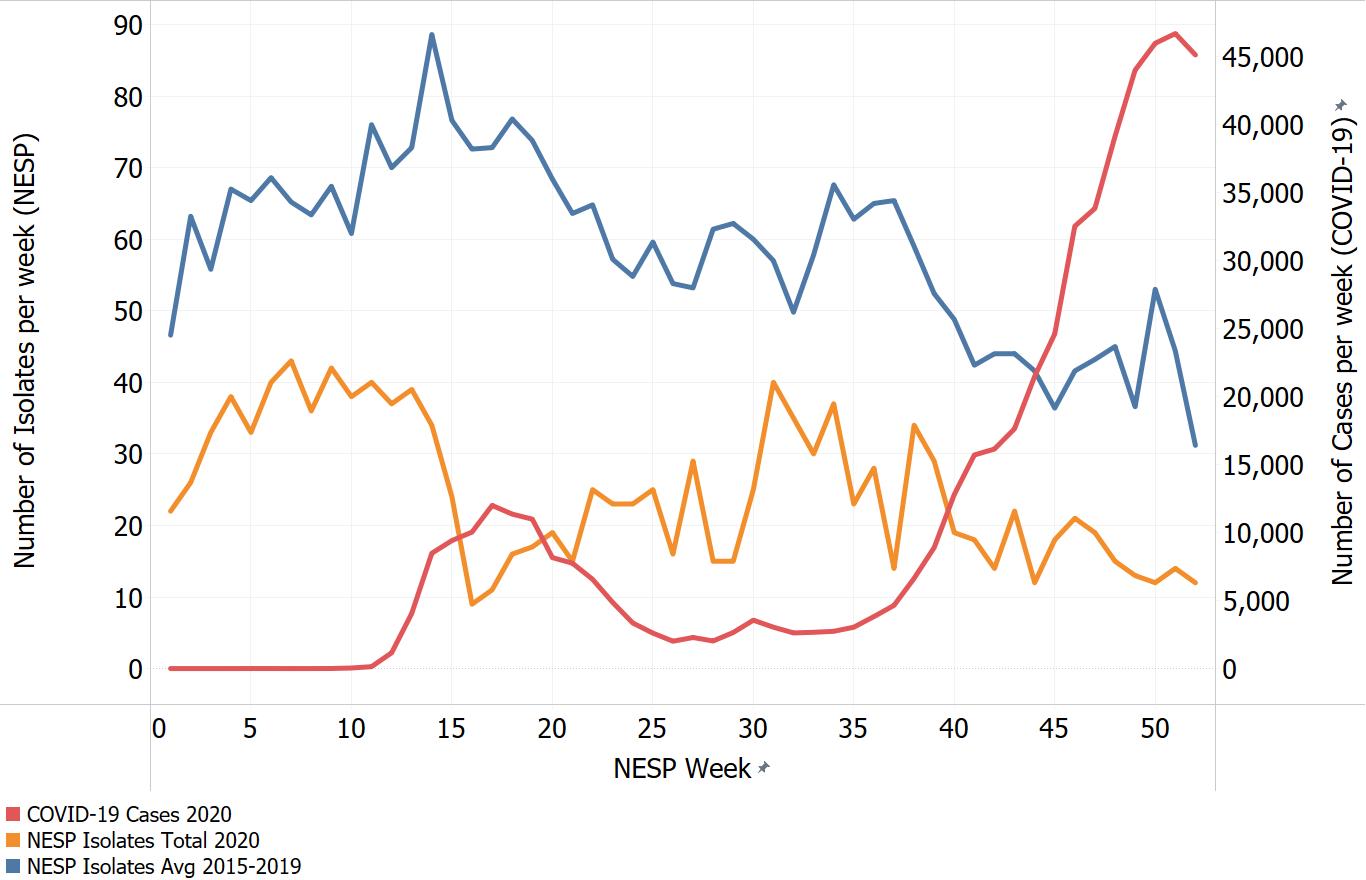
Figure 12 - Text description
| Week Number | COVID-19 Cases 2020 | NESP Isolates Total 2020 | NESP Isolates Avg 2015-2019 |
|---|---|---|---|
| 1 | 0 | 22 | 46.6 |
| 2 | 0 | 26 | 63.2 |
| 3 | 0 | 33 | 55.8 |
| 4 | 0 | 38 | 67 |
| 5 | 4 | 33 | 65.4 |
| 6 | 3 | 40 | 68.6 |
| 7 | 0 | 43 | 65.2 |
| 8 | 2 | 36 | 63.4 |
| 9 | 6 | 42 | 67.4 |
| 10 | 42 | 38 | 60.8 |
| 11 | 140 | 40 | 76 |
| 12 | 1161 | 37 | 70 |
| 13 | 4054 | 39 | 72.8 |
| 14 | 8479 | 34 | 88.6 |
| 15 | 9414 | 24 | 76.6 |
| 16 | 10035 | 9 | 72.6 |
| 17 | 11997 | 11 | 72.8 |
| 18 | 11359 | 16 | 76.8 |
| 19 | 10988 | 17 | 73.8 |
| 20 | 8159 | 19 | 68.4 |
| 21 | 7748 | 15 | 63.6 |
| 22 | 6564 | 25 | 64.8 |
| 23 | 4867 | 23 | 57.2 |
| 24 | 3353 | 23 | 54.8 |
| 25 | 2609 | 25 | 59.6 |
| 26 | 2013 | 16 | 53.8 |
| 27 | 2284 | 29 | 53.2 |
| 28 | 2030 | 15 | 61.4 |
| 29 | 2653 | 15 | 62.2 |
| 30 | 3557 | 25 | 60 |
| 31 | 3043 | 40 | 57 |
| 32 | 2622 | 35 | 49.8 |
| 33 | 2668 | 30 | 57.8 |
| 34 | 2740 | 37 | 67.6 |
| 35 | 3043 | 23 | 62.8 |
| 36 | 3822 | 28 | 65 |
| 37 | 4646 | 14 | 65.4 |
| 38 | 6633 | 34 | 59 |
| 39 | 8897 | 29 | 52.4 |
| 40 | 12800 | 19 | 48.8 |
| 41 | 15708 | 18 | 42.4 |
| 42 | 16142 | 14 | 44 |
| 43 | 17638 | 22 | 44 |
| 44 | 21485 | 12 | 41.6 |
| 45 | 24611 | 18 | 36.4 |
| 46 | 32530 | 21 | 41.6 |
| 47 | 33839 | 19 | 43.2 |
| 48 | 39136 | 15 | 45 |
| 49 | 44007 | 13 | 36.6 |
| 50 | 45982 | 12 | 53 |
| 51 | 46693 | 14 | 44.4 |
| 52 | 45124 | 12 | 31.2 |
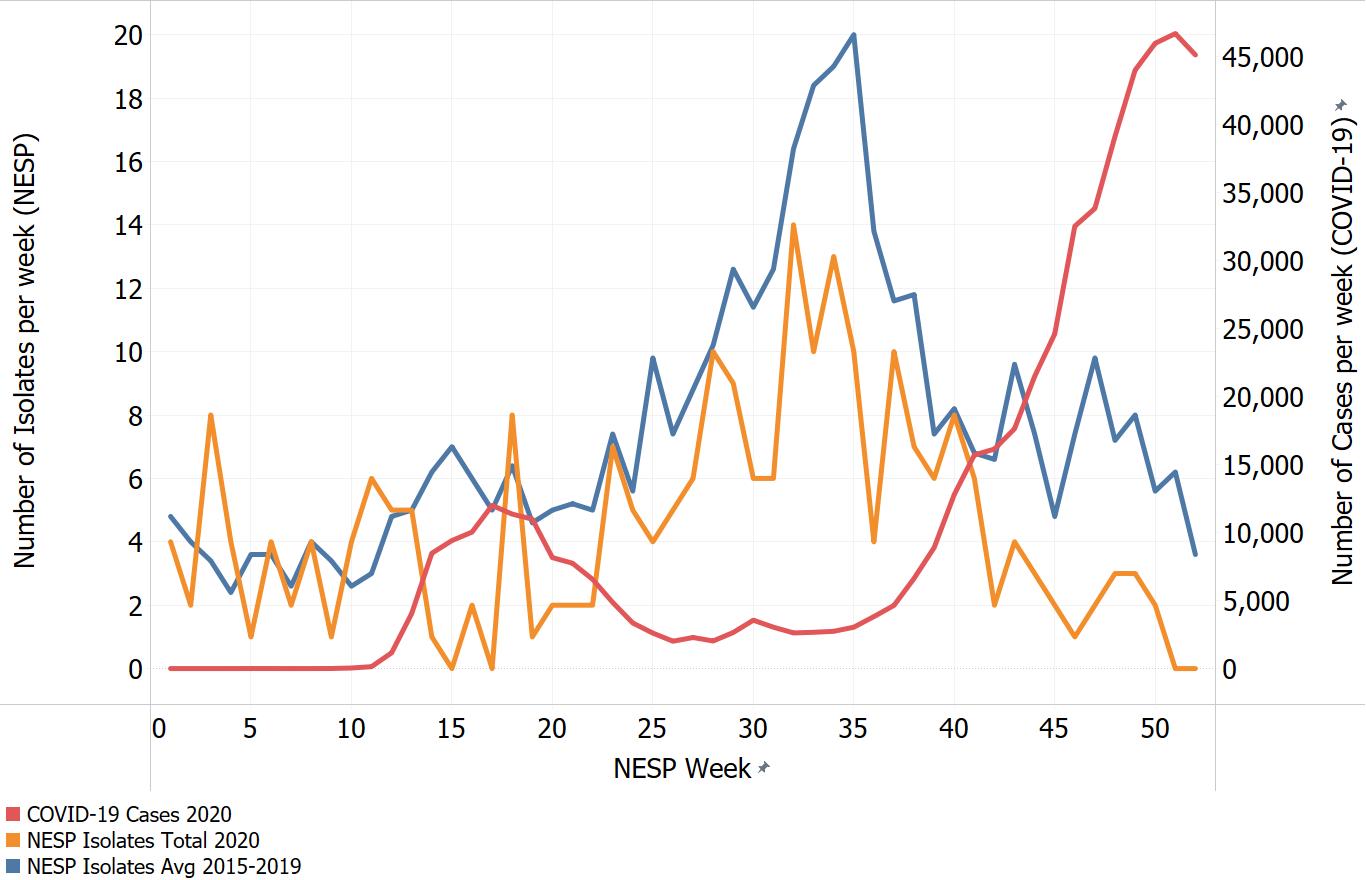
Figure 13 - Text description
| Week Number | COVID-19 Cases 2020 | NESP Isolates Total 2020 | NESP Isolates Avg 2015-2019 |
|---|---|---|---|
| 1 | 0 | 4 | 4.8 |
| 2 | 0 | 2 | 4 |
| 3 | 0 | 8 | 3.4 |
| 4 | 0 | 4 | 2.4 |
| 5 | 4 | 1 | 3.6 |
| 6 | 3 | 4 | 3.6 |
| 7 | 0 | 2 | 2.6 |
| 8 | 2 | 4 | 4 |
| 9 | 6 | 1 | 3.4 |
| 10 | 42 | 4 | 2.6 |
| 11 | 140 | 6 | 3 |
| 12 | 1161 | 5 | 4.8 |
| 13 | 4054 | 5 | 5 |
| 14 | 8479 | 1 | 6.2 |
| 15 | 9414 | 0 | 7 |
| 16 | 10035 | 2 | 6 |
| 17 | 11997 | 0 | 5 |
| 18 | 11359 | 8 | 6.4 |
| 19 | 10988 | 1 | 4.6 |
| 20 | 8159 | 2 | 5 |
| 21 | 7748 | 2 | 5.2 |
| 22 | 6564 | 2 | 5 |
| 23 | 4867 | 7 | 7.4 |
| 24 | 3353 | 5 | 5.6 |
| 25 | 2609 | 4 | 9.8 |
| 26 | 2013 | 5 | 7.4 |
| 27 | 2284 | 6 | 8.8 |
| 28 | 2030 | 10 | 10.2 |
| 29 | 2653 | 9 | 12.6 |
| 30 | 3557 | 6 | 11.4 |
| 31 | 3043 | 6 | 12.6 |
| 32 | 2622 | 14 | 16.4 |
| 33 | 2668 | 10 | 18.4 |
| 34 | 2740 | 13 | 19 |
| 35 | 3043 | 10 | 20 |
| 36 | 3822 | 4 | 13.8 |
| 37 | 4646 | 10 | 11.6 |
| 38 | 6633 | 7 | 11.8 |
| 39 | 8897 | 6 | 7.4 |
| 40 | 12800 | 8 | 8.2 |
| 41 | 15708 | 6 | 6.8 |
| 42 | 16142 | 2 | 6.6 |
| 43 | 17638 | 4 | 9.6 |
| 44 | 21485 | 3 | 7.4 |
| 45 | 24611 | 2 | 4.8 |
| 46 | 32530 | 1 | 7.4 |
| 47 | 33839 | 2 | 9.8 |
| 48 | 39136 | 3 | 7.2 |
| 49 | 44007 | 3 | 8 |
| 50 | 45982 | 2 | 5.6 |
| 51 | 46693 | 0 | 6.2 |
| 52 | 45124 | 0 | 3.6 |
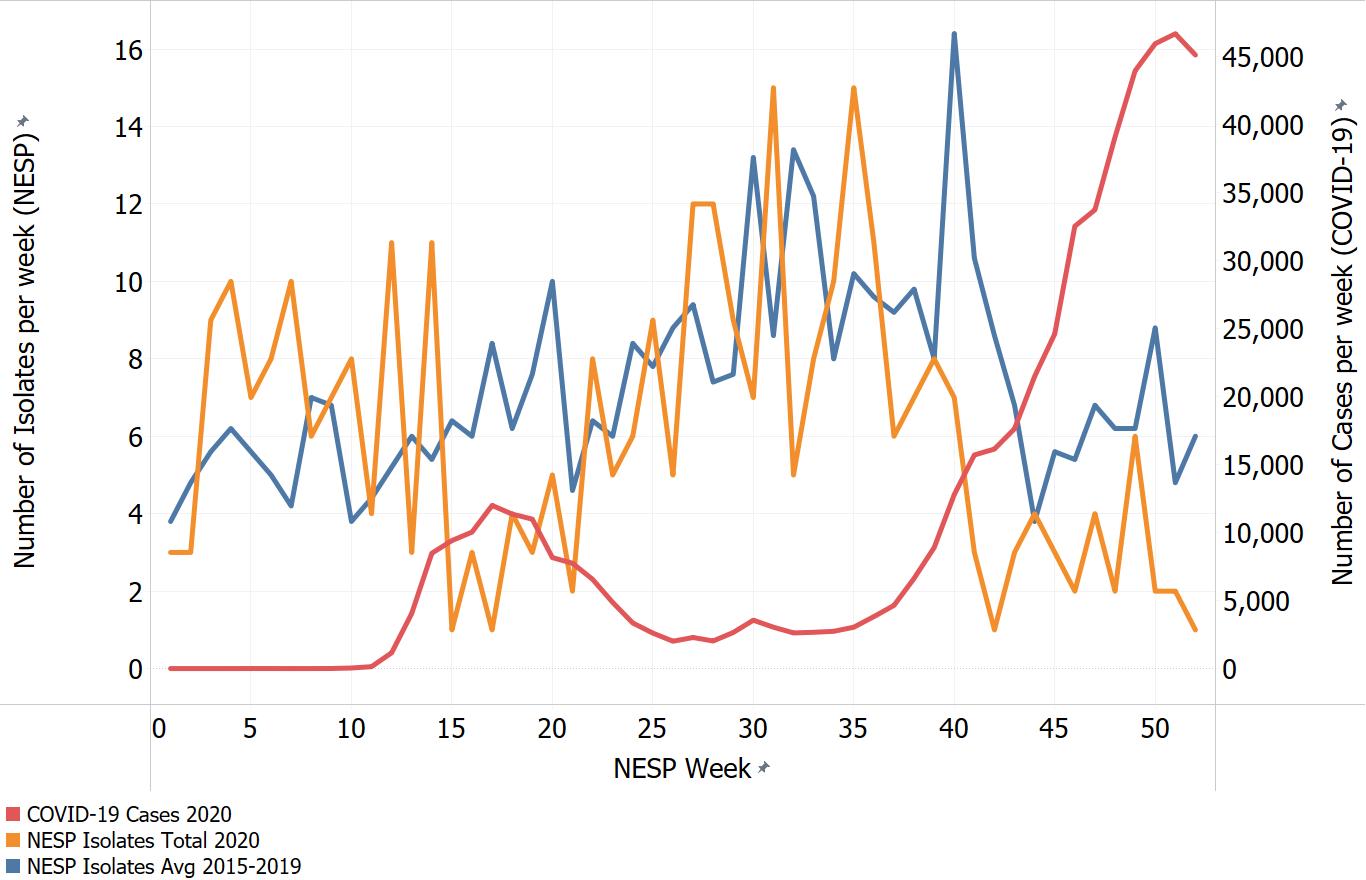
Figure 14 - Text description
| Week Number | COVID-19 Cases 2020 | NESP Isolates Total 2020 | NESP Isolates Avg 2015-2019 |
|---|---|---|---|
| 1 | 0 | 3 | 3.8 |
| 2 | 0 | 3 | 4.8 |
| 3 | 0 | 9 | 5.6 |
| 4 | 0 | 10 | 6.2 |
| 5 | 4 | 7 | 5.6 |
| 6 | 3 | 8 | 5 |
| 7 | 0 | 10 | 4.2 |
| 8 | 2 | 6 | 7 |
| 9 | 6 | 7 | 6.8 |
| 10 | 42 | 8 | 3.8 |
| 11 | 140 | 4 | 4.4 |
| 12 | 1161 | 11 | 5.2 |
| 13 | 4054 | 3 | 6 |
| 14 | 8479 | 11 | 5.4 |
| 15 | 9414 | 1 | 6.4 |
| 16 | 10035 | 3 | 6 |
| 17 | 11997 | 1 | 8.4 |
| 18 | 11359 | 4 | 6.2 |
| 19 | 10988 | 3 | 7.6 |
| 20 | 8159 | 5 | 10 |
| 21 | 7748 | 2 | 4.6 |
| 22 | 6564 | 8 | 6.4 |
| 23 | 4867 | 5 | 6 |
| 24 | 3353 | 6 | 8.4 |
| 25 | 2609 | 9 | 7.8 |
| 26 | 2013 | 5 | 8.8 |
| 27 | 2284 | 12 | 9.4 |
| 28 | 2030 | 12 | 7.4 |
| 29 | 2653 | 9 | 7.6 |
| 30 | 3557 | 7 | 13.2 |
| 31 | 3043 | 15 | 8.6 |
| 32 | 2622 | 5 | 13.4 |
| 33 | 2668 | 8 | 12.2 |
| 34 | 2740 | 10 | 8 |
| 35 | 3043 | 15 | 10.2 |
| 36 | 3822 | 11 | 9.6 |
| 37 | 4646 | 6 | 9.2 |
| 38 | 6633 | 7 | 9.8 |
| 39 | 8897 | 8 | 8 |
| 40 | 12800 | 7 | 16.4 |
| 41 | 15708 | 3 | 10.6 |
| 42 | 16142 | 1 | 8.6 |
| 43 | 17638 | 3 | 6.8 |
| 44 | 21485 | 4 | 3.8 |
| 45 | 24611 | 3 | 5.6 |
| 46 | 32530 | 2 | 5.4 |
| 47 | 33839 | 4 | 6.8 |
| 48 | 39136 | 2 | 6.2 |
| 49 | 44007 | 6 | 6.2 |
| 50 | 45982 | 2 | 8.8 |
| 51 | 46693 | 2 | 4.8 |
| 52 | 45124 | 1 | 6 |
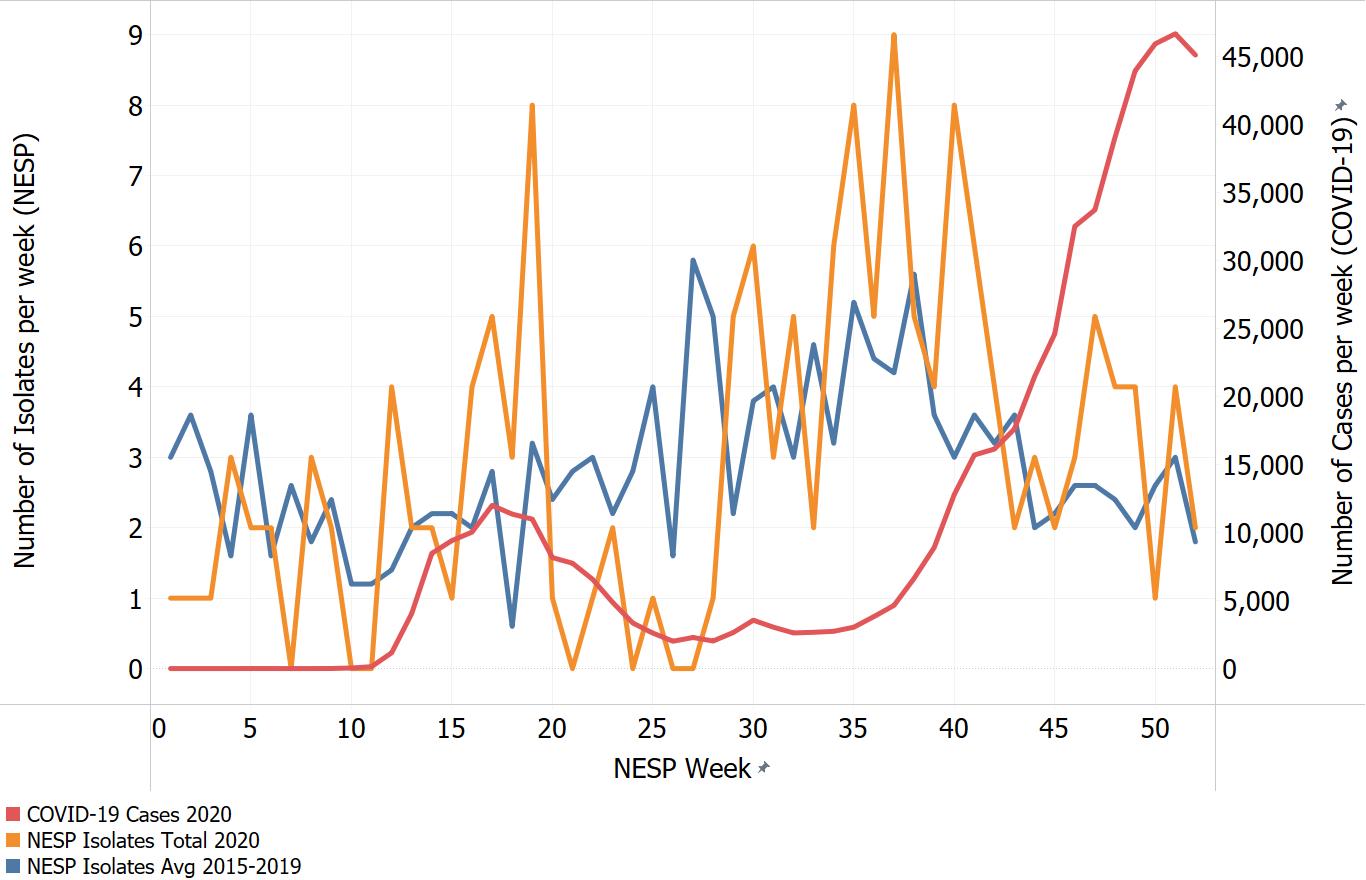
Figure 15 - Text description
| Week Number | COVID-19 Cases 2020 | NESP Isolates Total 2020 | NESP Isolates Avg 2015-2019 |
|---|---|---|---|
| 1 | 0 | 1 | 3 |
| 2 | 0 | 1 | 3.6 |
| 3 | 0 | 1 | 2.8 |
| 4 | 0 | 3 | 1.6 |
| 5 | 4 | 2 | 3.6 |
| 6 | 3 | 2 | 1.6 |
| 7 | 0 | 0 | 2.6 |
| 8 | 2 | 3 | 1.8 |
| 9 | 6 | 2 | 2.4 |
| 10 | 42 | 0 | 1.2 |
| 11 | 140 | 0 | 1.2 |
| 12 | 1161 | 4 | 1.4 |
| 13 | 4054 | 2 | 2 |
| 14 | 8479 | 2 | 2.2 |
| 15 | 9414 | 1 | 2.2 |
| 16 | 10035 | 4 | 2 |
| 17 | 11997 | 5 | 2.8 |
| 18 | 11359 | 3 | 0.6 |
| 19 | 10988 | 8 | 3.2 |
| 20 | 8159 | 1 | 2.4 |
| 21 | 7748 | 0 | 2.8 |
| 22 | 6564 | 1 | 3 |
| 23 | 4867 | 2 | 2.2 |
| 24 | 3353 | 0 | 2.8 |
| 25 | 2609 | 1 | 4 |
| 26 | 2013 | 0 | 1.6 |
| 27 | 2284 | 0 | 5.8 |
| 28 | 2030 | 1 | 5 |
| 29 | 2653 | 5 | 2.2 |
| 30 | 3557 | 6 | 3.8 |
| 31 | 3043 | 3 | 4 |
| 32 | 2622 | 5 | 3 |
| 33 | 2668 | 2 | 4.6 |
| 34 | 2740 | 6 | 3.2 |
| 35 | 3043 | 8 | 5.2 |
| 36 | 3822 | 5 | 4.4 |
| 37 | 4646 | 9 | 4.2 |
| 38 | 6633 | 5 | 5.6 |
| 39 | 8897 | 4 | 3.6 |
| 40 | 12800 | 8 | 3 |
| 41 | 15708 | 6 | 3.6 |
| 42 | 16142 | 4 | 3.2 |
| 43 | 17638 | 2 | 3.6 |
| 44 | 21485 | 3 | 2 |
| 45 | 24611 | 2 | 2.2 |
| 46 | 32530 | 3 | 2.6 |
| 47 | 33839 | 5 | 2.6 |
| 48 | 39136 | 4 | 2.4 |
| 49 | 44007 | 4 | 2 |
| 50 | 45982 | 1 | 2.6 |
| 51 | 46693 | 4 | 3 |
| 52 | 45124 | 2 | 1.8 |
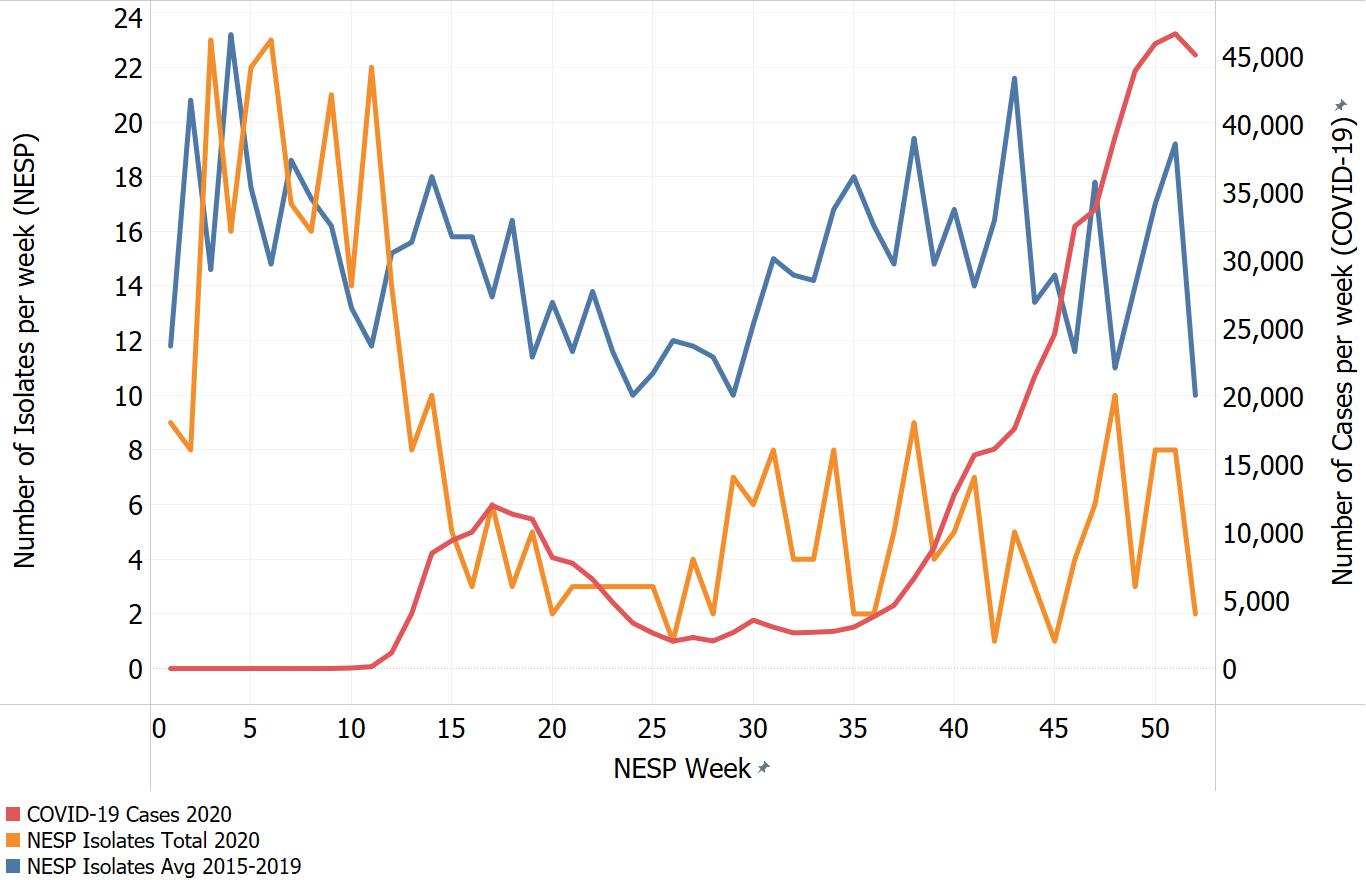
Figure 16 - Text description
| Week Number | COVID-19 Cases 2020 | NESP Isolates Total 2020 | NESP Isolates Avg 2015-2019 |
|---|---|---|---|
| 1 | 0 | 9 | 11.8 |
| 2 | 0 | 8 | 20.8 |
| 3 | 0 | 23 | 14.6 |
| 4 | 0 | 16 | 23.2 |
| 5 | 4 | 22 | 17.6 |
| 6 | 3 | 23 | 14.8 |
| 7 | 0 | 17 | 18.6 |
| 8 | 2 | 16 | 17.2 |
| 9 | 6 | 21 | 16.2 |
| 10 | 42 | 14 | 13.2 |
| 11 | 140 | 22 | 11.8 |
| 12 | 1161 | 14 | 15.2 |
| 13 | 4054 | 8 | 15.6 |
| 14 | 8479 | 10 | 18 |
| 15 | 9414 | 5 | 15.8 |
| 16 | 10035 | 3 | 15.8 |
| 17 | 11997 | 6 | 13.6 |
| 18 | 11359 | 3 | 16.4 |
| 19 | 10988 | 5 | 11.4 |
| 20 | 8159 | 2 | 13.4 |
| 21 | 7748 | 3 | 11.6 |
| 22 | 6564 | 3 | 13.8 |
| 23 | 4867 | 3 | 11.6 |
| 24 | 3353 | 3 | 10 |
| 25 | 2609 | 3 | 10.8 |
| 26 | 2013 | 1 | 12 |
| 27 | 2284 | 4 | 11.8 |
| 28 | 2030 | 2 | 11.4 |
| 29 | 2653 | 7 | 10 |
| 30 | 3557 | 6 | 12.6 |
| 31 | 3043 | 8 | 15 |
| 32 | 2622 | 4 | 14.4 |
| 33 | 2668 | 4 | 14.2 |
| 34 | 2740 | 8 | 16.8 |
| 35 | 3043 | 2 | 18 |
| 36 | 3822 | 2 | 16.2 |
| 37 | 4646 | 5 | 14.8 |
| 38 | 6633 | 9 | 19.4 |
| 39 | 8897 | 4 | 14.8 |
| 40 | 12800 | 5 | 16.8 |
| 41 | 15708 | 7 | 14 |
| 42 | 16142 | 1 | 16.4 |
| 43 | 17638 | 5 | 21.6 |
| 44 | 21485 | 3 | 13.4 |
| 45 | 24611 | 1 | 14.4 |
| 46 | 32530 | 4 | 11.6 |
| 47 | 33839 | 6 | 17.8 |
| 48 | 39136 | 10 | 11 |
| 49 | 44007 | 4 | 14 |
| 50 | 45982 | 1 | 17 |
| 51 | 46693 | 4 | 19.2 |
| 52 | 45124 | 2 | 10 |
Footnotes
- Footnote 1
-
Canadian Notifiable Diseases Surveillance System, Public Health Agency of Canada: https://diseases.canada.ca/notifiable/
- Footnote 2
-
PulseNet Canada, National Microbiology Laboratory, Public Health Agency of Canada: https://www.nml-lnm.gc.ca/index-eng.htm
- Footnote 3
-
Food-borne Illness Outbreak Response Protocol (FIORP) 2010: To guide a multi-jurisdictional response. Public Health Agency of Canada: http://www.phac-aspc.gc.ca/zoono/fiorp-pritioa/index-eng.php
- Footnote 4
-
https://www.who.int/director-general/speeches/detail/who-director-general-s-opening-remarks-at-the-media-briefing-on-covid-19---11-march-2020 (accessed September 13, 2021)
- Footnote 5
-
https://pm.gc.ca/en/news/news-releases/2020/03/16/prime-minister-announces-new-actions-under-canadas-covid-19-response (accessed October 20, 2021). On March 18, 2020 Canada initiated international travel restrictions, this corresponds to NESP week 12.