
Adverse Events Following Immunization (AEFI) Quarterly Report for 2015 – Q1
Safety assessment summary for this Quarter:
- No significant vaccine safety concerns were identified in quarter 1 of 2015.
- All serious cases were reviewed and most found either to be expected (based on known vaccine-related adverse reactions and listed in the Canadian Immunization Guide and Product Information) or to have alternate explanations and not related to vaccination.
- As in previous quarters the total count of AEFI reports received was lower than that seen in previous quarters reflecting a gap in reporting from jurisdictions that are implementing new electronic reporting systems.
Vaccines are closely monitored in Canada at all phases of the vaccine product 'life cycle' from discovery through market authorization (pre-market) and beyond, as people begin using them (post-market). Many stakeholders are involved in various activities related to vaccine safety assessment and monitoring including the federal government, provincial, territorial and local public health authorities, health care providers, vaccine industry and the public. The Public Health Agency of Canada (the Agency) conducts vigilant post-market safety surveillance through a national reporting system, the Canadian Adverse Events Following Immunization Surveillance System (CAEFISS).
The primary purpose of vaccine post market surveillance is to detect safety concerns. These concerns include a possible increase in the severity or frequency of expected reactions, or occurrence of one or more unexpected events (i.e. an event that is not consistent with Canadian product information or labelling). This allows immunization providers and public health immunization program providers to take public health action at the level of the:
- individual (e.g. further investigation to confirm a diagnosis and determine possible causes, consultation to rule out allergy to one or more vaccine components, or evaluate whether or not to give subsequent doses of a vaccine), and/or
- immunization program (e.g. investigation of a cluster of adverse events, review of procedures to ensure that vaccine storage requirements have been strictly followed, or consider a change in policy to adopt a less reactogenic vaccine).
The Agency also shares adverse event following immunization (AEFI) data with Health Canada, the vaccine regulator in Canada, to enable regulatory action related to vaccines marketed in Canada. These actions may include issuing communications to immunization providers or the public regarding the safety concern or requiring additional information or investigation by the vaccine distributor.
Vaccine safety surveillance reports summarizing CAEFISS data are released by the Agency on a routine basis. The Quarterly Reports summarize all reports of adverse events following immunization (AEFI) received by the Agency from Jan 1st to March 31st (Quarter 1), Apr 1st to June 30th (Quarter 2), July 1st to Sept 30th (Quarter 3) and Oct 1st to Dec 31st (Quarter 4), regardless of the date the vaccine was actually given. In addition, the Quarter 4 Report provides cumulative data spanning the entire year and contains a more detailed review of any concerns that may have been observed in the earlier reports.
In order to compare data from year to year, each quarter's data are shown along with an average of several prior years' quarterly data.
Notes on interpretation: An AEFI is defined as "any untoward medical occurrence which follows immunization and which does not necessarily have a causal relationship with the usage of the vaccine. The adverse event may be any unfavorable or unintended sign, abnormal laboratory finding, symptom or disease". AEFI reports submitted to the Public Health Agency of Canada represent a suspicion, opinion or observation by the reporter as opposed to an assertion or proof that the vaccine may have caused the event. For most events a clear causal relationship is difficult to establish. Additional limitations to AEFI report data include varied reporting standards and underreporting, lack of certainty regarding the diagnostic validity of a reported event, missing information regarding other potential causes and other reporting biases. In short, this information should not be used to estimate the incidence of adverse events.
Results highlighted for Quarter 1 of 2015
Cumulative counts included in this Quarterly Report (Q1) include reports received from Jan 1st to Mar 31st and comparisons are made to the average number of reports received in the same quarter over the previous four calendar years (2011-2014). The reports analysed for 2015 were extracted from the CAEFISS database on 15 May,-2015 and for 2011-2014 on 29-April-2014 by the Public Health Agency of Canada (the Agency).
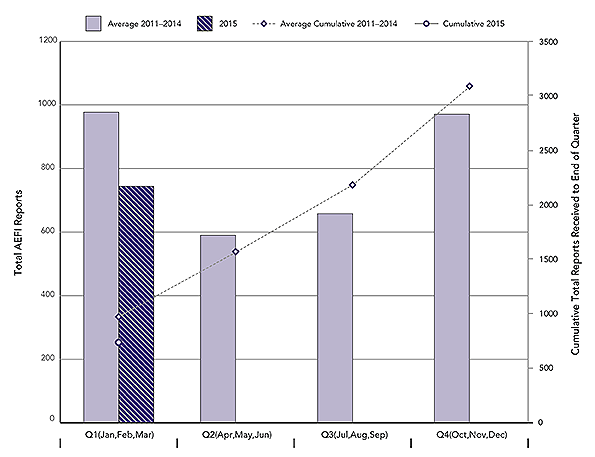
Figure 1: Total AEFI Reports by calendar quarter and cumulative to end of each Quarter: 2015 vs. average for 2011-2014
A total of 744 AEFI reports were received by the Agency in Q1 of 2015. During the same periods for 2011, 2012, 2013 and 2014 the Agency received an average of 977 (range: 760-1258) AEFI reports. The main reason for the drop continues to be related to delayed report transmission from one or more provinces and territories to the Agency over the past few years, for technical reasons related to implementing new electronic databases. As always, any reports not yet received by the Agency due to delays in transmission are nevertheless reviewed and analysed in their reporting jurisdictions. Any concerns are communicated via Provincial/Territorial focal points on the pan-Canadian Vaccine Vigilance Working Group.
Text Equivalent
This is a combination bar and line graph. The bars show the total number of AEFI reports received each calendar quarter(Q) with Q1 encompassing January, February and March, Q2 April, May and Jun, Q3 July, August and September and Q4 October, November and December. The line shows the accumulated total reports to the end of each quarter. The primary y-axis on the left hand side of the graph is for the bar graph and shows the total count for each quarter, ranging from 0-1200. The secondary y-axis on the right hand side of the graph is for the line graph and shows the accumulated total count to the end of each quarter, ranging from 0 to 3500. The x-axis is quarter and ranges from Q1 to Q4. Two time periods are depicted on the graph.
The light bars shows the average total reports each quarter from 2011 to 2014: 977 in Q1, 590 in Q2, 619 in Q3 and 902 in Q4. The dotted line shows the average cumulative total reports received by the end of each quarter for the same four years: 977 in Q1, 1567 by the end of Q2, 2185 by the end of Q3 and 3087 by the end of Q4.
A second, dark bar for Q1 only, shows the total reports received for of 2015: 744 The solid line beginning with a dot for Q1, shows that a cumulative total of 744 reports were received by the end of Q1, 2015.
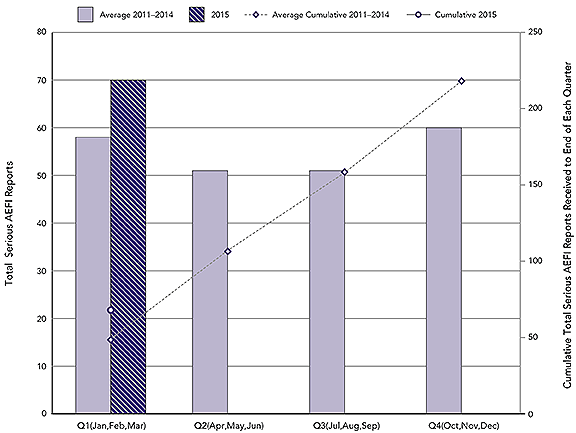
Figure 2: Total serious AEFI reports by calendar quarter and cumulative to end of each quarter: 2015 vs. average for 2011-2014.
A total of 70 AEFI reports received by the Agency in Q1 of 2015 were classified as serious (9.4% of all AEFI reports). During the same periods for 2011, 2012, 2013 and 2014 the Agency received an average of 58 (range: 54-66) serious AEFI reports representing from 4.3 - 8.7% of all AEFI reports received in the same quarter for these years.
Text Equivalent
This is a combination bar and line graph. The bars show the total number of serious AEFI reports received each calendar quarter(Q) with Q1 encompassing January, February and March, Q2 April, May and Jun, Q3 July, August and September and Q4 October, November and December. The line shows the accumulated total reports to the end of each quarter. The primary y-axis on the left hand side of the graph is for the bar graph and shows the total count for each quarter, ranging from 0-80. The secondary y-axis on the right hand side of the graph is for the line graph and shows the total count to the end of each quarter, ranging from 0 to 250. The x-axis is quarter and ranges from Q1 to Q4. Two time periods are depicted on the graph.
The light bars show the average total reports each quarter for 2011 to 2014: 58 in Q1, 51 in Q2, 51 in Q3 and 60 in Q4. The dotted line shows the average cumulative total reports received by the end of each quarter for the same years: the 58 for Q1, 109 by the end of Q2, 160 by the end of Q3 and 220 by the end of Q4.
The dark bar shows the total reports received each quarter for 2015: in this case just one bar representing 70 for Q1. The solid line, in this case just a dot, shows that a cumulative total of 58 reports were received by the end of Q1, 2015.
Frequency of serious and non-serious AEFI Reports by Age Group
There were a few changes in age distribution for serious AEFI reports received in Q1 for 2015 relative to previous years. Notably, as shown in Table 1, the total of all serious reports for children 1 to less than 2 years of age was higher in the first quarter of 2015 than the previous 4 year average (26 versus 13). This change was related in part to an increasing use of new hexavalent vaccines (DTaP-IPV-HB-Hib). New vaccines typically have increased reporting rates. (see Table 3 below).
For non-serious AEFI reports, the age group distribution was similar in Q1 in 2015 to previous years for Q1.
| Age Group | Serious Adverse Events (SAE) | Non-serious Adverse Events (non-SAE) | ||
|---|---|---|---|---|
| 2015 | Average for 2011-2014 | 2015 | Average for 2011-2014 | |
| Unknown | 0 | 0 | 2 | 20 |
| 65+ years | 4 | 7 | 89 | 87 |
| 18-<65 years | 9 | 9 | 277 | 316 |
| 7-<18 years | 7 | 6 | 113 | 126 |
| 2-<7 years | 7 | 6 | 73 | 121 |
| 1-<2 years | 26 | 13 | 60 | 147 |
| 0-<1 year | 17 | 18 | 60 | 103 |
| Number of Serious Adverse Event (SAE) Reports Received | Number of Non-Serious Adverse Event(non-SAE) Reports Received | |||
|---|---|---|---|---|
| 2015 | Average for 2011-14 | 2015 | Average for 2011-14 | |
Table 3 Footnotes
|
||||
| Rota | 7 | 5 | 16 | 24 |
| DTaP-IPV-Hib | 8 | 15 | 36 | 103 |
| DTaP-HB-IPV-Hib | 12 | 3 | 30 | 43 |
| Pneu-C | 27 | 21 | 54 | 143 |
| Men-C | 21 | 12 | 81 | 137 |
| MMR | 11 | 7 | 35 | 125 |
| MMR-Var | 8 | 6 | 45 | 25 |
| Var | 5 | 4 | 18 | 77 |
| DTaP-IPV | 0 | 1 | 14 | 32 |
| Tdap-IPVTable 3 Footnote * | 0 | 1 | 11 | 18 |
| HPV | 2 | 2 | 28 | 47 |
| HB | 2 | 4 | 41 | 51 |
| Tdap | 4 | 1 | 56 | 61 |
| Inf | 23 | 18 | 275 | 387 |
| Zos | 0 | 0 | 49 | 13 |
| Pneu-P | 2 | 5 | 61 | 65 |
Most common vaccines identified in Adverse Events Following Immunization (AEFI) Reports
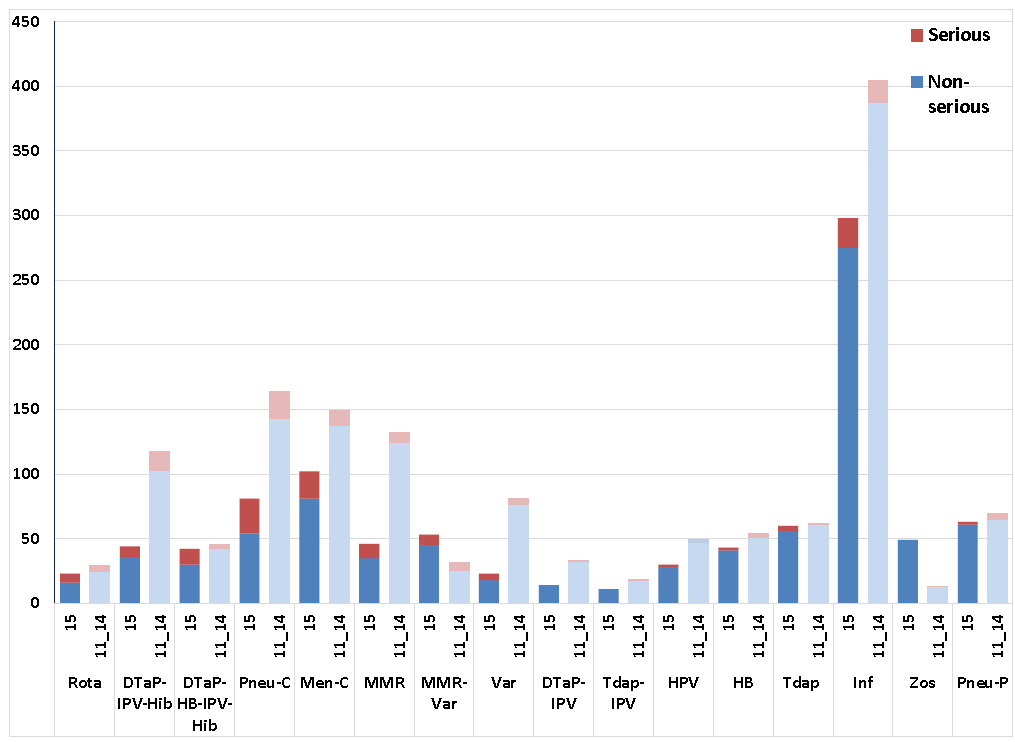
Table 3 lists the most commonly implicated vaccines among AEFI reports received for Q1 of 2015 relative to the 2011-2014 average reports received for the same quarter. The most notable change in the 1st quarter of 2015 relative to previous years was a higher number of serious AEFI reports following hexavalent vaccine, along with meningococcal and MMR vaccines. Hexavalent vaccines have still only recently emerged and thus they have fewer historic reports, and MMR vaccine distribution has likely increased as a result of recent outbreaks drawing attention to the importance of catching up with the vaccine.
Figure 3 provides a cumulative summary of the most commonly implicated vaccines among AEFI reports received by the Agency during the 1st Quarter of 2015 (Jan 1st to Mar 31st) compared to the average in 2011, 2012, 2013 and 2014 for the same time frame. As already noted in previous reports there was a trend for a lower frequency of non-serious adverse event reports for most commonly administered vaccines relative to the previous four years. The reason for the lower numbers is primarily accounted for by delays in reporting from jurisdictions still in the process of initiating new electronic AEFI reporting infrastructures. These will reflect increases in subsequent reports and will be explained at the time.
Figure 3: Most common vaccines identified in AEFIs reported from January 1st to end of 1st Quarter 2015 vs average for 2011-2014.
Text Equivalent
This is a bar graph showing total numbers of non-serious and serious AEFI reports received for specific vaccines at the Public Health Agency to the end of the first quarter (March 31) of 2015 versus the average of reports received to the end of the first quarters of 2011 to 2014. The y-axis shows the number of reports, ranging from 0 to 450. The x-axis shows specific vaccine groups based on the antigenic content rather than specific brand.
The vaccine groups shown and the number of non-serious/serious AEFI reports received for each to the end of the 1st quarter in a) 2015 versus (light bar for non-serious, dark bar for serious) b) the average for 2011 to 2014 (light bar for non-serious, dark bar for serious) respectively are: Rotavirus: a) 16/7 versus b) 24.3/4.8, DTaP-IPV-Hib: a) 36/8 versus b) 102.5/14.8; DTaP-HB-IPV-Hib: a) 30/12 versus b) 42.8/2.8; pneumococcal conjugate: a) 54/27 versus b) 142.8/21; meningococcal conjugate C: a) 81/21 versus b) 137.3/12; MMR: a) 35/11 versus b) 124.5/7.3; MMRV: a) 45/8 versus b) 25.3/6.3; Varicella: a) 18/5 versus b) 76.8/4.3; DTaP-IPV: a) 14/0 versus b) 32/1.3; Tdap-IPV: a) 11/0 versus b) 17.7/1; HPV: a) 28/2 versus b) 46.8/2.3; HB: a) 41/2 versus b) 50.8/3.5; Tdap: a) 56/4 versus b) 61/0.5; Influenza: a) 275/23 versus b) 387/17.5; Zoster: a) 49/0 versus b) 12.8/0.3; Pneumococcal polysaccharide: a) 61/2 versus b) 64.5/4.8.
The main reason for reporting serious (SAE) and non-serious (non-SAE) AEFI for Q1 of 2015 compared to the 2011-2014 average for Q1 is shown in Table 4.
| Main Reason for Reporting | Number of Serious Adverse Event (SAE) Reports | Number of Non-serious Adverse Event (non-SAE) Reports | ||
|---|---|---|---|---|
| 2015 | Average for 2011-2014 | 2015 | Average for 2011-2014 | |
| Reaction at or near the vaccination site | 7 | 4 | 300 | 320 |
| Allergic or allergic-like events | 1 | 3 | 92 | 140 |
| Neurologic events | 23 | 24 | 21 | 29 |
| Rash only | 1 | 1 | 111 | 188 |
| Other events specified on the CAEFISS form | 7 | 6 | 18 | 30 |
| Systemic events | 25 | 15 | 76 | 108 |
| Vaccination anxiety related events | 0 | 0 | 13 | 12 |
| Miscellaneous other events | 6 | 5 | 41 | 79 |
| Vaccination error without an associated AEFI | 0 | 0 | 2 | 13 |
Figure 4 provides a cumulative summary of reports received from the beginning of the year to the end of Q1 (Jan 1st - Mar 31st) compared to the average in 2011-2014. As noted previously, the total numbers of non-SAE reports were less than previous years. The most frequently reported non-SAE were reactions at or near the vaccination site, rash as the only event, allergic or allergic like events and systemic events.
Figure 4: Total AEFI reports received from January 1st to end of the 1st Quarter, by main reason for reporting and seriousness: 2015 vs. average for 2011-2014

Text Equivalent
This is a bar graph showing the total number of non-serious and serious reports categorized by the main reason for reporting received by the Public Health Agency of Canada to the end of the 1th quarter (March 31st) of 2015 (light bar for non-serious; dark bar for serious) and the average of 2011 to 2014 for the same period (light bar for non-serious; dark bar for serious). The y-axis shows the 9 different categories of AEFI and the x-axis shows the total number of reports for each category ranging from 0 to 400.
The respective totals for non-serious/ serious AEFI reports received by the end of Q1 were: reactions at or near the vaccination site: 2015: 300/7; 2011-14: 320/4.2; allergic or allergic-like events: 2015: 92/1; 2011-14: 139/2.5; neurologic events: 2015: 21/23; 2011-14: 28.75/24.25; rash only (in other words rash without any other signs or symptoms): 2015: 111/1; 2011-2014: 188.1.25; Other events specified on CAEFISS report form: 2015: 18/7; 2011-14: 30.25/6.25; systemic events: 2015: 76/25; 2011-14: 108/14.7; vaccination anxiety related events: 2015: 13/0; 2011-14: 11.5/0.25; miscellaneous other events: 2015: 41/6; 2011-14: 79/4.75; vaccination error without an associated AEFI: 2015: 2/0; 2011-14: 13/0.
Serious Adverse Events Following Immunization (SAE) Reports received
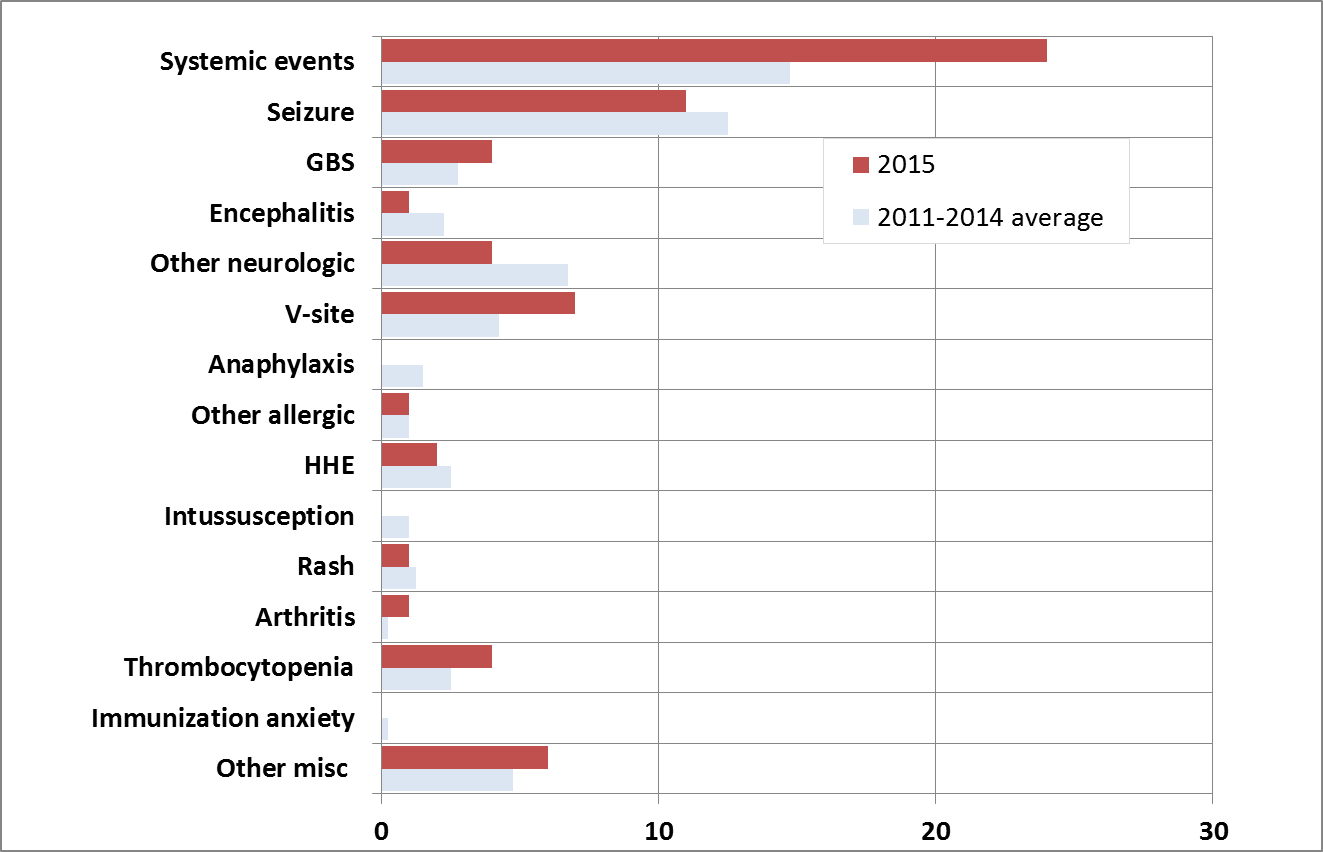
The type of serious adverse events (SAE) reported are described below. Table 5 summarizes the type of SAE reported in Q1 of 2015 compared to the 2011-2014 average. Figure 5 provides a cumulative summary of the same data collected from the start of the year to the end of the quarter (Jan 1 - Mar 31st) in 2015 compared to the average in 2011-2014.
There were a total of 70 SAE reports in Q1 of 2015 (9.4% of 744 reports total). The average for Q1 from 2011 to 2014 was 58 serious reports (7.2% of 977 reports total). As noted in previous reports, the single most common reason for reporting SAEs in Q4 were seizures usually accompanied by fever. The only increase by category of SAE was for systemic events, but an investigation of these did not reveal any clustering by event, age or vaccine.
| Types of SAE reports | 2015 | Mean for 2011-2014 (range) |
|---|---|---|
| Systemic events | 25 | 14 (12-17) |
| Seizure | 11 | 10 (6-13) |
| GBS | 5 | 3 (0-5) |
| Encephalitis | 1 | 2 (0-2) |
| Other neurologic | 6 | 4 (1-6) |
| V-site | 7 | 7 (2-12) |
| Anaphylaxis | 0 | 1 (1-3) |
| Other allergic | 1 | 2 (0-4) |
| HHE | 2 | 3 (1-6) |
| Intussusception | 0 | 1 (0-1) |
| Rash | 1 | 1 (0-2) |
| Arthritis | 1 | 0 (0-1) |
| Thrombocytopenia | 4 | 3 (2-7) |
| Immunization anxiety | 0 | 0 (0-1) |
| Other misc | 6 | 10 (6-14) |
Figure 5: Total serious AEFI reports received from January 1st to end of 1st Quarter by type of adverse event: 2015 vs. prior 4 years
Text Equivalent
This is a bar graph showing the total serious reports of specific AEFIs received to the end of the 1st quarter (March 31st) for 2015 and an average of 2011-2014. The y-axis lists the specific AEFI types as described below. The x-axis shows the total number of reports ranging from 0-30.
For each specific AEFI type the total reports received, respectively to the end of Q1 for 2015 (dark bar), and 2011-2014 (light bar) were: systemic events: 25 and 15; seizure: 11 and 13; Guillain-Barre syndrome: 5 and 3; encephalitis: 1 and 2; other neurologic events: 6 and 7; reactions at or near the vaccination site: 7 and 4; anaphylaxis: 0 and 2; other allergic events: 1 and 1; hypotonic-hyporesponsive episodes: 2 and 3; intussusception: 0 and 1; rash: 1 and 1; arthritis: 1 and 0; thrombocytopenia: 4 and 3 ; Para/Anaesthesia: 0 and 0; immunization related anxiety: 0 and 0; other miscellaneous events: 6 and 5.