
National report: Apparent opioid-related deaths in Canada (December 2017)
Suggested citation
Special Advisory Committee on the Epidemic of Opioid Overdoses. National report: Apparent opioid-related deaths in Canada (January 2016 to June 2017) Web-based Report. Ottawa: Public Health Agency of Canada; 2017.
Canada is experiencing a serious and growing opioid crisis. Across the country, it is having devastating effects on families and communities.
Accurate information about the crisis will help the efforts to reduce opioid-related harms and deaths.
The Government of Canada is working closely with the provinces and territories to collect and share data on apparent opioid-related deaths. The data will be updated four times a year and may change based on review and refinement.
The data in this report should be interpreted with caution due to provincial and territorial differences in the processing and reporting of apparent opioid-related deaths. In addition, please refer to the Considerations and Limitations for more information.
Key Findings
According to data reported as of December 11, 2017:
- in 2016, there were 2,861 apparent opioid-related deaths in Canada
- from January to June 2017, there were at least 1,460 apparent opioid-related deaths and it is expected that this count will rise as additional data become available
- overall, most apparent opioid-related deaths occurred among males (74%) and among individuals between the ages of 30 and 39 (28%)
- from January to June 2017, 74% of apparent opioid-related deaths involved fentanyl or fentanyl analogues, compared to 53% in 2016.
The data in this report:
- are updated on a quarterly basis
- may change based on review and refinement
- have been collected by the provinces and territories from their respective offices of Chief Coroners/Medical Examiners
- have been shared through the Special Advisory Committee on the Epidemic of Opioid Overdoses (SAC)
Changes from last report include:
- the addition of available preliminary data from April to June 2017 (except for Manitoba, Quebec and Newfoundland and Labrador)
- updates to preliminary data from 2016 and January to March 2017
National and regional trends of apparent opioid-related deaths
The opioid crisis has affected every part of the country, but some provinces and territories have been impacted more than others. According to data reported as of December 11, 2017:
- there were 2,861Footnote a apparent opioid-related deaths in Canada in 2016, corresponding to a death rate of 7.9Footnote a per 100,000 population (Table 1)
- there were at least 1,460 apparent opioid-related deaths from January to June 2017 (Table 1)
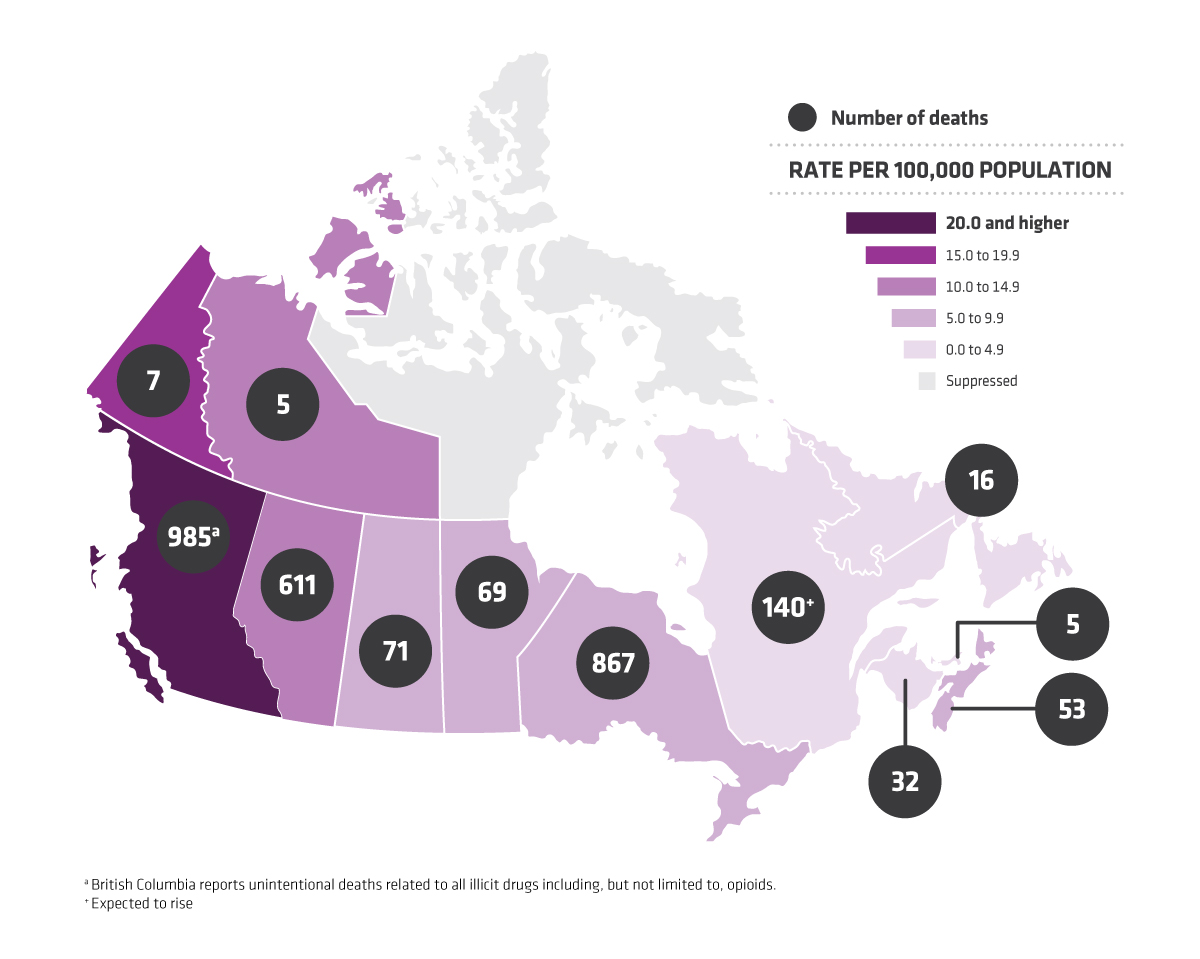
Figure 1. Number and rate (per 100,000 population) of apparent opioid-related deaths by province or territory, 2016.
Text equivalent
| Provinces and territories | Number | Rate per 100,000 population |
|---|---|---|
| British Columbia (note: reports on unintentional deaths related to all illicit drugs, including but not limited, to opioids) |
985 | 20.0 and up |
| Alberta | 611 | 10.0 to 14.9 |
| Saskatchewan | 71 | 5.0 to 9.9 |
| Manitoba | 69 | 5.0 to 9.9 |
| Ontario | 867 | 5.0 to 9.9 |
| Quebec (expected to rise) |
140 | 0.0 to 4.9 |
| New Brunswick | 32 | 0.0 to 4.9 |
| Nova Scotia | 53 | 5.0 to 9.9 |
| Prince Edward Island | 5 | 0.0 to 4.9 |
| Newfoundland and Labrador | 16 | 0.0 to 4.9 |
| Yukon | 7 | 15.0 to 19.9 |
| Northwest Territories | 5 | 10.0 to 14.9 |
| Nunavut | Suppressed | Suppressed |
| Province or territory | 2016 | 2017 (January to June) | |
|---|---|---|---|
| Number | Death rate per 100,000 population | Number | |
| British ColumbiaFootnote 1 | 985 | 20.7 | 798 |
| Alberta | 611 | 14.4 | 350 |
| SaskatchewanFootnote 2 | 71 | 6.2 | 10 |
| Manitoba | 69 | 5.2 | 30Footnote 3 |
| Ontario | 867 | 6.2 | 214Footnote 4 |
| QuebecFootnote 2 | 140 | 1.7 | Suppressed |
| New Brunswick | 32 | 4.2 | 17 |
| Nova Scotia | 53 | 5.6 | 37 |
| Prince Edward IslandFootnote 2 | 5 | 3.3 | Suppressed |
| Newfoundland and Labrador | 16 | 3.0 | Suppressed |
| Yukon | 7 | 18.4 | 4 |
| Northwest Territories | 5 | 11.2 | 0 |
| Nunavut | Suppressed | Suppressed | Suppressed |
| Total | 2861 | 7.9 | 1460 |
FootnotesN/A - Data were not available at the time of this publication.
|
|||
| Province or territory | 2016 | 2017 (January to June) | ||||
|---|---|---|---|---|---|---|
| Jan to Mar | Apr to Jun | Jul to Sep | Oct to Dec | Jan to Mar | Apr to Jun | |
| British ColumbiaFootnote 1 | 221 | 191 | 195 | 378 | 389 | 409 |
| Alberta | 138 | 146 | 159 | 168 | 161 | 189 |
| SaskatchewanFootnote 2 | N/A | N/A | N/A | N/A | N/A | N/A |
| Manitoba | 16 | 13 | 15 | 25 | 30 | N/A |
| Ontario | 214 | 218 | 195 | 240 | N/A | 214Footnote 4 |
| QuebecFootnote 3 | 50 | 43 | 35 | 12 | N/A | N/A |
| New Brunswick | 12 | 4 | 9 | 7 | 9 | 8 |
| Nova Scotia | 17 | 14 | 17 | 5 | 19 | 18 |
| Prince Edward IslandFootnote 3 | Suppressed | Suppressed | Suppressed | Suppressed | Suppressed | Suppressed |
| Newfoundland and Labrador | Suppressed | Suppressed | Suppressed | Suppressed | N/A | N/A |
| Yukon | 0 | 2 | 2 | 3 | 4 | 0 |
| Northwest Territories | 2 | 0 | 1 | 2 | 0 | 0 |
| Nunavut | Suppressed | Suppressed | Suppressed | Suppressed | Suppressed | Suppressed |
FootnotesN/A - Data were not available at the time of this publication.
|
||||||
Sex and age trends of apparent opioid-related deaths
This crisis has affected Canadians from all walks of life. However, available data from January 2016 to June 2017, reported as of December 11, 2017, indicate there are differences by sex and age.
Although these trends vary by province or territory, overall:
- most (74%) apparent opioid-related deaths occurred among males (Figure 2)
- the highest percent (28%) of apparent opioid-related deaths occurred among individuals between the ages of 30 and 39 (Table 3)
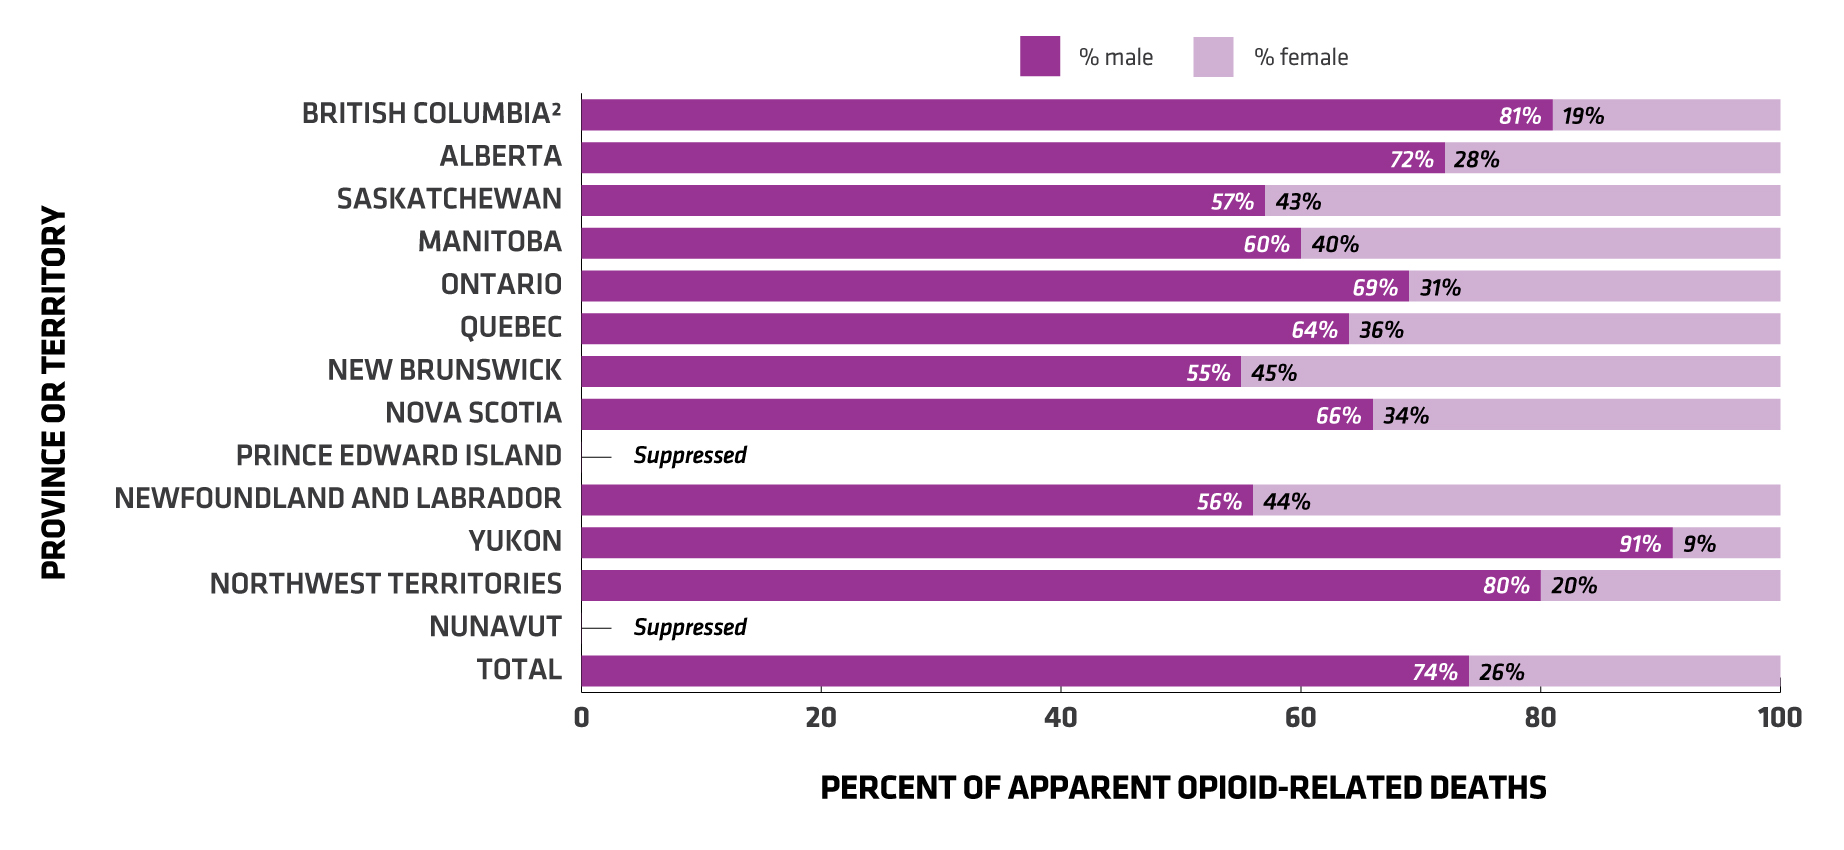
Figure 2. Sex distribution of apparent opioid-related deaths by province or territory, January 2016 to June 2017Figure 2 Footnote 1.
Text equivalent
| Province or territory | Percentage that are male | Percentage that are female |
|---|---|---|
| British ColumbiaFigure 2 Footnote 2 | 81 | 19 |
| Alberta | 72 | 28 |
| Saskatchewan | 57 | 43 |
| Manitoba | 60 | 40 |
| Ontario | 69 | 31 |
| Quebec | 64 | 36 |
| New Brunswick | 55 | 45 |
| Nova Scotia | 66 | 34 |
| Prince Edward Island | Suppressed | Suppressed |
| Newfoundland and Labrador | 56 | 44 |
| Yukon | 91 | 9 |
| Northwest Territories | 80 | 20 |
| Nunavut | Suppressed | Suppressed |
| Total | 74 | 26 |
Suppressed – Data may be suppressed in provinces or territories with low numbers of cases. Please refer to the Considerations and Limitations for more information.
|
||
| Province or territory | Age group | ||||||
|---|---|---|---|---|---|---|---|
| ≤ 19 | 20 to 29 | 30 to 39 | 40 to 49 | 50 to 59 | 60 to 69 | ≥ 70 | |
| British ColumbiaFootnote 2 | 2.5% | 18.4% | 28.1% | 23.2% | 21.6% | 5.8% | 0.4% |
| Alberta | 2.5% | 20.2% | 33.8% | 17.6% | 18.5% | 6.5% | 0.9% |
| Saskatchewan | 0.0% | 16.0% | 35.8% | 14.8% | 22.2% | 9.9% | 1.2% |
| Manitoba | 2.0% | 23.2% | 32.3% | 14.1% | 10.1% | 13.1% | 5.1% |
| Ontario | 1.8% | 18.9% | 22.8% | 21.4% | 23.9% | 8.6% | 2.7% |
| Quebec | N/A | N/A | N/A | N/A | N/A | N/A | N/A |
| New Brunswick | 2.0% | 16.3% | 18.4% | 20.4% | 24.5% | 16.3% | 2.0% |
| Nova Scotia | 2.2% | 15.6% | 26.7% | 16.7% | 20.0% | 14.4% | 4.4% |
| Prince Edward Island | Suppressed | ||||||
| Newfoundland and Labrador | Suppressed | ||||||
| Yukon | 0.0% | 9.1% | 36.4% | 27.3% | 9.1% | 0.0% | 18.2% |
| Northwest Territories | 0.0% | 60.0% | 0.0% | 0.0% | 20.0% | 20.0% | 0.0% |
| Nunavut | Suppressed | ||||||
| Total | 2.2% | 19.0% | 28.1% | 20.8% | 21.2% | 7.3% | 1.4% |
FootnotesN/A - Data were not available at the time of this publication.
|
|||||||
Fentanyl, fentanyl analogues, and other substances involved in apparent opioid-related deaths
Apparent opioid-related deaths often involveFootnote b multiple substances including one or more opioids as well as non-opioid substances. Knowing the type(s) of opioid and non-opioid substances involved in these deaths can help public health officials and other government agencies communicate risks and target harm reduction efforts.
Similar to previous updates, we are seeing more fentanyl or fentanyl analogues involved in apparent opioid-related deaths (Table 4, Table 5). According to available data reported as of December 11, 2017:
- the percent of deaths involving fentanyl or fentanyl analogues was 53% in 2016 and 74% from January to June 2017Footnote c
- the number of apparent opioid-related deaths involving fentanyl or fentanyl analogues more than doubled in January to June of 2017 compared to the same time period in 2016
Non-opioid substances
We can also highlight the involvement of non-opioid substances in apparent opioid-related deaths.
According to available data, approximately 82% of apparent opioid-related deaths from January 2016 to June 2017Footnote d also involved one or more types of non-opioid substances.
| Province or territory | 2016 | 2017 (January to June) | ||
|---|---|---|---|---|
| Number | Percent | Number | Percent | |
| British ColumbiaFootnote 1 | 668 | 68% | 662 | 83% |
| AlbertaFootnote 2 | 357 | 63% | 257 | 76% |
| SaskatchewanFootnote 3 | 8 | 11% | 2 | 20% |
| ManitobaFootnote 4 | 33 | 48% | 14 | 47% |
| Ontario | 353 | 41% | 122Footnote 5 | 65% |
| QuebecFootnote 3 | 27 | 19% | N/A | N/A |
| New Brunswick | 4 | 13% | 4 | 24% |
| Nova Scotia | 8 | 15% | 4 | 11% |
| Prince Edward IslandFootnote 3 | 1 | 20% | Suppressed | |
| Newfoundland and Labrador | Suppressed | Suppressed | ||
| Yukon | 5 | 71% | 2 | 50% |
| Northwest Territories | 1 | 20% | 0 | Not applicable |
| Nunavut | Suppressed | Suppressed | ||
FootnotesN/A - Data were not available at the time of this publication. Please note: Higher percentages in 2017 compared to 2016 of apparent opioid-related deaths involving fentanyl or fentanyl analogues should be interpreted with caution. The observed differences between the two time periods may reflect relative increases in the numbers of deaths involving fentanyl or fentanyl analogues, or may reflect a delay in the reporting of deaths involving non-fentanyl-related opioids in some jurisdictions. Furthermore, these data are preliminary and are subject to change.
|
||||
| Province or territory | 2016 | 2017 (January to June) | ||||
|---|---|---|---|---|---|---|
| Jan to Mar | Apr to Jun | Jul to Sep | Oct to Dec | Jan to Mar | Apr to Jun | |
| British ColumbiaFootnote 1 | 123 | 127 | 120 | 298 | 327 | 335 |
| AlbertaFootnote 2 | 69 | 81 | 87 | 120 | 126 | 131 |
| SaskatchewanFootnote 3 | N/A | N/A | N/A | N/A | N/A | N/A |
| Manitoba | 8 | 2 | 8 | 15 | 14 | N/A |
| Ontario | 76 | 94 | 72 | 111 | N/A | 122Footnote 4 |
| Quebec | 10 | 9 | 6 | 2 | N/A | N/A |
| New Brunswick | 2 | 0 | 1 | 1 | 3 | 1 |
| Nova Scotia | 4 | 2 | 2 | 0 | 1 | 3 |
| Prince Edward Island | Suppressed | Suppressed | Suppressed | Suppressed | Suppressed | Suppressed |
| Newfoundland and Labrador | Suppressed | Suppressed | Suppressed | Suppressed | N/A | N/A |
| Yukon | 0 | 1 | 1 | 3 | 2 | 0 |
| Northwest Territories | 0 | 0 | 0 | 1 | 0 | 0 |
| Nunavut | Suppressed | Suppressed | Suppressed | Suppressed | Suppressed | Suppressed |
FootnotesN/A - Data were not available at the time of this publication.
|
||||||
Considerations and Limitations
Definition of apparent opioid-related death
An apparent opioid-related death is a death caused by intoxication/toxicity (poisoning) as a result of drug use, where one or more of the drugs is an opioid.
How apparent opioid-related deaths are counted
The data can include:
- open (preliminary) and closed (certified) cases
- non-natural manners of death (both intentional and unintentional)
- individuals with or without personal prescriptions
These data do not include deaths due to:
- chronic substance use (for example, the medical consequences of long term use or overuse of an exogenous [external] substance(s), such as alcoholic cirrhosis)
- medical assistance in dying
- trauma where an exogenous (external) substance contributed to the circumstances of the injury
However, some jurisdictional differences remain in the type of data reported and in the time periods for which data are available (refer to Table 6).
| BCFootnote 1 | AB | SK | MB | ONFootnote 2 | QCFootnote 3 | NB | NS | PE | NL | YK | NT | NU | ||
|---|---|---|---|---|---|---|---|---|---|---|---|---|---|---|
| Reporting period (as of December 11, 2017) | ||||||||||||||
| January to December 2016 | ✓ | ✓ | ✓ | ✓ | ✓ | ✓ | ✓ | ✓ | ✓ | ✓ | ✓ | ✓ | ✓ | |
| January to March 2017 | ✓ | ✓ | ✓ | ✓ | ✓ | ✓ | ✓ | ✓ | ✓ | ✓ | ✓ | |||
| April to June 2017 | ✓ | ✓ | ✓ | ✓ | ✓ | ✓ | ✓ | ✓ | ✓ | ✓ | ||||
| Deaths included in the reported data | ||||||||||||||
| Closed (certified) cases with completed death investigation |
Unintentional/accidental | ✓ | ✓ | ✓ | ✓ | ✓ | ✓ | ✓ | ✓ | ✓ | ✓ | ✓ | ✓ | ✓ |
| Intentional/suicide | ✓ | ✓ | ✓ | ✓ | ✓ | ✓ | ✓ | ✓ | ✓ | ✓ | ✓ | |||
| Undetermined manner of death | ✓ | ✓ | ✓ | ✓ | ✓ | ✓ | ✓ | ✓ | ✓ | ✓ | ✓ | ✓ | ||
| Open cases with ongoing death investigation | ✓ | ✓ | ✓ | ✓ | ✓ | ✓ | ✓ | ✓ | ✓ | ✓ | ||||
Footnotes✓ - These data have been reported by the province or territory and are reflected in this report, unless otherwise specified.
|
||||||||||||||
Data suppression
The suppression of data in this report is based on the preferences of individual provinces or territories to address concerns around releasing small numbers for their jurisdiction.
- Prince Edward Island suppressed counts less than five for total and quarterly data, and for any data regarding sex and age distribution. However, if the total annual count of apparent opioid-related deaths is greater than four, annual counts less than five may be reported when presenting type of substance(s).
- Newfoundland and Labrador suppressed all counts less than five.
- Nunavut suppressed all counts less than five.
- While Yukon has typically suppressed counts of less than five, the decision was made between the Chief Medical Officer of Health and the Chief Coroner, to release smaller counts, due to the urgency of the current opioid crisis, the value of detailed ongoing surveillance, and the importance of being as transparent as possible while still maintaining confidentiality with respect to case details.
Opioids and other involved substances
Fentanyl and fentanyl analogues include, but are not limited to:
- 3-methylfentanyl
- acetylfentanyl
- butyrylfentanyl
- carfentanil
- despropionyl-fentanyl
- fentanyl
- furanyl-fentanyl
- norfentanyl
Non-fentanyl-related opioids include, but are not limited to:
- buprenorphine metabolites
- codeine
- dihydrocodeine
- heroin
- hydrocodone
- hydromorphone
- loperamide
- meperidine
- methadone
- monoacetylmorphine
- morphine
- normeperidine
- oxycodone
- tapentadol
- tramadol
- U-47700
Non-opioid substances include, but are not limited to:
- alcohol
- benzodiazepines
- cocaine
- W-18
Limitations of these apparent opioid-related deaths data
Data presented in this report should be interpreted with caution:
- This report is based on data submitted to the Public Health Agency of Canada on or before December 11, 2017. New or revised data submitted after this date will be reflected in future updates.
- Data released by provinces and territories may differ from the data provided in this report due to the availability of updated data, differences in the type of data reported (e.g. manners of death), alternate age groupings, differences in time periods presented, etc.
- As some data are based on ongoing investigations by coroners and medical examiners, they are considered preliminary and subject to change. Data are considered closed (certified) after completion of the death investigation by the coroner/medical examiner. The time required to complete an investigation and related administrative processes is case-dependent and can range from approximately 3 to 24 months.
- This report does not distinguish between pharmaceutical and non-pharmaceutical opioids, or prescription and non-prescription drugs, which may have differing levels of potency.
- Jurisdictional differences in the death investigation process, death classification method, toxicology testing and type of data reported (e.g. intentional/suicide deaths included or excluded) may impact the interpretation and comparability of the reported data.
- Information related to changes over time at the national level is based only on jurisdictions where data were available for all time periods of interest.
- Rates reported here have not been age-standardized and therefore have not been adjusted for existing differences in provincial and territorial age distributions.
- Rates for jurisdictions with smaller populations may change substantially with even slight changes in the number of deaths; comparisons over time and between jurisdictions should be interpreted with caution.