
Obesity Statistics in Canada: Report
Download in PDF format
(2.5 MB, 120 pages)
Organization:Public Health Agency of Canada
Date published: 2025-06-05
Table of contents
- Acknowledgements
- Executive summary
- List of tables
- List of figures
- Section 1: What is obesity and how is it measured?
- Section 2: Adult obesity
- Section 3: Child and youth obesity
- Section 4: Data sources and methods
- Appendixes
- Bibliography
Acknowledgements
The report was prepared by the following people (currently and formerly) in the Centre for Surveillance and Applied Research (CSAR) at the Public Health Agency of Canada (PHAC): Farah Barakat, Julie Bates, Marisol Betancourt, Alexandria Melvin, Karen C Roberts, Margot Shields, Calum Thompson, Wendy Thompson, Stephanie Toigo, Ron Wall, Chinchin Wang, and Danisha Zaman.
We would also like to acknowledge the contributions of the following who provided valuable review and input to the development of this report: Mary Sue Devereaux, Didier Garriguet, Margaret de Groh, Blair Jones, Alison Lake, Sarah MacKinnon, Shaila Rodrigues, and Eric Vallières.
Executive summary
Introduction (and health risks)
The term "obesity" describes a medical condition where excess body fat threatens health. Individuals with excess body fat have an elevated risk of chronic diseases such as cardiovascular disease and diabetes, some types of cancers, and various mental health conditions Footnote 1Footnote 2. Among children, high body mass index (BMI) has been associated with the early onset of diseases including type 2 diabetes, hypertension, and a range of cancers Footnote 3Footnote 4. Evidence also suggests that a high BMI in childhood can have adverse psychosocial impacts, such as depression, lower self-esteem, and behavioral disorders Footnote 5Footnote 6. As well, obesity in childhood and adolescence is strongly associated with obesity in adulthood Footnote 7Footnote 8.
Purpose of this report
The purpose of this report is to promote awareness and give the most up-to-date information and data on the prevalence of obesity among adults, children, and adolescents in the Canadian context. This report aims to inform stakeholders, policymakers, and healthcare professionals when developing programs and policies concerning the prevalence of obesity in Canada. This report discusses obesity and how it is measured in addition to identifying the population groups more affected by obesity.
The information and data portrayed in this report are drawn from the Canadian Community Health Survey (CCHS) years 2000 to 2021, the Canadian Health Measures Survey (CHMS) cycle 1 (2007-2009) to cycle 6 (2018-2019), and the CCHS–Nutrition Focus (CCHS-Nutrition) from 2004 and 2015. The statistical analysis of the data allows for prevalence breakdowns of obesity according to different variables (where available) such as: age and sex, household income and education, Indigenous status, regional variation, as well as temporal and forecasted projections.
How is obesity measured?
BMI is the indicator most used by surveillance systems to track excess body fat within a population. BMI is a measure of an individual's weight in relation to their height (weight divided by height squared-weight (kg)/height (m2)) Footnote 9.
For adults
Among adults, BMI estimates calculated from self-reported data are often biased, because adults' self-reports underestimate weight and overestimate height Footnote 10. Correction equations for adjusting BMI based on self-reported height and weight have been developed for use on adults in the CCHS. In this report, BMIAdjSR refers to BMI based on self-reported values that have been adjusted to correct for biases. For adults, only BMI from measured data and adjusted BMI are presented in the report.
For children and youth
Children and youth grow at varying rates, therefore the World Health Organization age- and sex-specific cut-points are applied to classify BMI Footnote 11Footnote 12Footnote 13. For 5- to 17-year-olds, there are four BMI categories (thin, normal weight, overweight, and obesity). For children younger than 5 years, an "at risk of overweight" category is also used to lessen the likelihood that they will be classified in the obesity category during a period of rapid growth. Among children and youth, self- and parent-reported height and weight often result in substantial misclassification of BMI, for which no correction equations have been established in Canada Footnote 14Footnote 15. Consequently, only measured data for children and youth are used in this report.
Key findings
Adult obesity
- In 2021, 29.5% of Canadian adults had a BMIAdjSR classified as obesity. An additional 35.5% had a BMIAdjSR classified as overweight. Therefore, 65% of Canadian adults are classified in the combined overweight and obesity category.
- Men were more likely than women to have a BMIAdjSR in the overweight range (39.7% versus 31.3%).
- The lowest prevalence of obesity was among the youngest (18 to 34 years) and oldest (80 years or older) age groups: 22.5% and 21.2%, respectively.
- Among women, low household income was associated with a significantly higher prevalence of obesity than the highest household income group (30.8% versus 26.6%).
- For both sexes, the lowest prevalence of obesity was among those in the highest household education group (post-secondary graduate).
- Obesity was significantly more common among adults in rural areas (33.6%) than in urban ones (28.6%).
- Between 2000-2001 and 2019-2020, the prevalence of obesity among adults based on self-reported data rose from 20.6% to 28.2%. A significant upward trend in the prevalence of obesity (based on adjusted BMI) was observed among adults in all age groups, all household income quintiles, and all levels of household education. The impact of COVID-19 has yet to be determined.
Child and youth obesity
- In 2015, 12.4% of Canadian children and youth aged 5 to 17 years had a BMI that placed them in the obesity category, and another 19.4% were in the overweight range. As a result, close to one out of three children and youth (31.8%) were classified in the combined overweight and obesity category.
- A larger percentage of boys than girls were in the obesity category (14.9% versus 9.9%).
- The prevalence of combined overweight/obesity was higher at ages 12 to 17 years than at ages 5 to 11 years (35.6% versus 28.4%).
- In 2004, the prevalence of obesity among children and youth (12.9%) was double the rate observed in 1978-1979.
- There is an indication of child and youth obesity and overweight/obesity rates plateauing in recent decades, with some exceptions. Among 5- to 11-year-olds, both obesity and combined overweight/obesity prevalence in 2014-2019 were lower than in 2004 (13.3% versus 10.4%, and 35.9% versus 26.6%). Among 12- to 17-year-olds, no significant differences in obesity or combined overweight/obesity were observed. Among girls (but not boys) aged 2 to 4 years, the prevalence of combined overweight/obesity decreased between 2004 and 2015 (11.1% versus 4.1%).
Concluding remarks
For adults, the prevalence of obesity from 2021 appears to be higher than previous years, but additional data is required to determine if the increase is larger than would have been expected based on recent trends. Ongoing surveillance could help to monitor the trends of obesity in the context of a pandemic in the long term. We are awaiting nationally representative measured data for children and youth collected since the COVID-19 pandemic. Further research is needed to fully understand the impact COVID-19 had on health behaviours (for example, movement, dietary patterns) of children (5–11 years) and youth (12–17 years) in Canada Footnote 16. Ongoing research will help determine if obesity prevalence in children and youth remains at a plateau or if an increase will be observed following the COVID-19 pandemic.
List of tables
- Table 2a: Prevalence of waist circumference health risk by sex and age group, household population aged 18 to 79 years, Canada excluding territories, 2014 to 2019,
- Table 2b: Prevalence of adjusted self-reported obesity by sex and province/territory, household population aged 18 years or older, Canada, 2019-2020,
- Table 3a: Prevalence of measured obesity and overweight/obesity, by sex and household income quintile, household population aged 5 to 17 years, Canada excluding territories, 2015,
- Table 3b: Prevalence of measured obesity and overweight/obesity, by sex and highest level of education in household, household population aged 5 to 17 years, Canada excluding territories, 2015,
- Table 3c: Prevalence of measured obesity and overweight/obesity by sex and province, household population aged 5 to 17 years, Canada excluding territories, 2015,
- Table 3d: Prevalence of measured obesity and overweight/obese by sex and urban/rural, household population aged 5 to 17 years, Canada excluding territories, 2015,
- Table A2.2: Percentage distribution of household population aged 18 years or older, by sex and adjusted self-reported body mass index (BMI) category, Canada excluding territories, 2021,
- Table A2.3: Prevalence of adjusted self-reported obesity by sex and age group, household population aged 18 years or older, Canada excluding territories, 2021,
- Table A2.4: Prevalence of adjusted self-reported obesity by sex and household income quintile, household population aged 18 years or older, Canada excluding territories, 2021,
- Table A2.5: Prevalence of adjusted self-reported obesity by sex and highest level of education in the household, household population aged 18 years or older, Canada excluding territories, 2021,
- Table A2b: Prevalence of adjusted self-reported obesity (age standardized) by sex and province/territory, household population aged 18 years or older, Canada, 2019-2020,
- Table A2.6: Prevalence of adjusted self-reported obesity by sex and urban/rural, household population aged 18 years or older, Canada excluding territories, 2021,
- Table A2.7: Prevalence of adjusted self-reported obesity by health regions among Canadians aged 18 years and older, 2015-2018,
- Table A2.8a: Prevalence of adjusted self-reported obesity by sex, household population aged 18 years or older, Canada excluding territories, 2000-2001 to 2019-2020,
- Table A2.8b: Prevalence of adjusted self-reported obesity (age standardized) by sex, household population aged 18 years or older, Canada excluding territories, 2000-2001 to 2019-2020,
- Table A2.9: Prevalence of adjusted self-reported obesity by sex and age group, household population aged 18 years or older, Canada excluding territories, 2000-2001 to 2019-2020,
- Table A2.10: Prevalence of adjusted self-reported obesity by sex and household income quintile, household population aged 18 years or older, Canada excluding territories, 2000-2001 to 2019-2020,
- Table A2.11: Prevalence of adjusted self-reported obesity by sex and highest level of education in the household, household population aged 18 years or older, Canada excluding territories, 2000-2001 to 2019-2020,
- Table A2.12a: Prevalence of adjusted self-reported class III obesity by sex, household population aged 18 years or older, Canada excluding territories, 2000-2001 to 2019-2020,
- Table A2.12b: Prevalence of adjusted self-reported class III obesity (age standardized) by sex, household population aged 18 years or older, Canada excluding territories, 2000-2001 to 2019-2020,
- Table A2.13a: Prevalence of measured obesity by sex, household population aged 18 years or older, Canada excluding territories (selected years),
- Table A2.13b: Prevalence of measured obesity (age standardized) by sex, household population aged 18-79 years, Canada excluding territories (selected years),
- Table A2.14a: Prevalence of measured class III obesity by sex, household population aged 18 years or older, Canada (selected years),
- Table A2.14b: Prevalence of measured class III obesity (age standardized estimates) by sex, household population aged 18 years or older, Canada excluding territories (selected years),
- Table A2.16: Prevalence of adjusted self-reported obesity among Indigenous/non-Indigenous peoples (living off reserve), by sex and age group, household population aged 18 years or older, Canada excluding territories, 2021,
- Table A3.1a: Percentage distribution of household population aged 2 to 17 years, by sex and measured body mass index (BMI) category, Canada excluding territories, 2015,
- Table A3.1b: Percentage distribution of household population aged 5 to 17 years, by sex and measured body mass index (BMI) category, Canada excluding territories, 2014-2019,
- Table A3.2a: Prevalence of measured obesity by sex and age group, household population aged 2 to 17 years, Canada excluding territories (selected years),
- Table A3.3a: Prevalence of measured overweight/obesity by sex and age group, household population aged 2 to 17 years, Canada excluding territories (selected years),
- Table A3.6: Prevalence of measured obesity and overweight/obesity among Indigenous/non-Indigenous children and youth, by sex, household population aged 5 to 17 years, Canada excluding territories, 2015,
- Table A4a: Response rates and sample sizes for self-reported estimates based on the Canadian Community Health Survey,
- Table A4b: Response rates and sample sizes for measured estimates,
List of figures
- Figure 2.1: Prevalence of adjusted self-reported and measured obesity by sex, household population aged 18 to 79 years, Canada excluding territories, (selected years)
- Figure 2.2: Percentage distribution of household population aged 18 years or older, by sex and adjusted self-reported body mass index (BMI) category, Canada excluding territories, 2021
- Figure 2.3: Prevalence of adjusted self-reported obesity by sex and age group, household population aged 18 years or older, Canada excluding territories, 2021
- Figure 2.4: Prevalence of adjusted self-reported obesity by sex and household income quintile, household population aged 18 years or older, Canada excluding territories, 2021
- Figure 2.5: Prevalence of adjusted self-reported obesity by sex and highest level of education in the household, household population aged 18 years or older, Canada excluding territories, 2021
- Figure 2.6: Prevalence of adjusted self-reported obesity by sex and urban/rural, household population aged 18 years or older, Canada excluding territories, 2021
- Figure 2.7: Prevalence (%) of obesity (self-reported, adjusted BMI), crude rates, among Canadian adults aged 18 years and older, by health regions, both sexes
- Figure 2.8: Prevalence of adjusted self-reported obesity by sex, household population aged 18 years or older, Canada 2000-2001 to 2019-2020
- Figure 2.9: Prevalence of adjusted self-reported obesity by age group, household population aged 18 years or older, Canada 2000-2001 to 2019-2020
- Figure 2.10: Prevalence of adjusted self-reported obesity by household income quintile, household population aged 18 years or older, Canada excluding territories, 2000-2001 to 2019-2020
- Figure 2.11: Prevalence of adjusted self-reported obesity by highest level of education in the household, household population aged 18 years or older, Canada excluding territories, 2000-2001 to 2019-2020
- Figure 2.12: Prevalence of adjusted self-reported class III obesity by sex, household population aged 18 years or older, Canada 2000-2001 to 2019-2020
- Figure 2.13: Prevalence of measured obesity by sex, household population aged 18-79, Canada excluding territories (selected years)
- Figure 2.14: Prevalence of measured class III obesity by sex, household population aged 18-79 years, Canada (selected years)
- Figure 2.15: Prevalence of adjusted self-reported obesity based on POHEM projections and survey data, household population aged 18-79, Canada, 2001-2035
- Figure 3.1: Percentage distribution of household population aged 5-17 years, by sex and measured body mass index (BMI) category, Canada excluding territories, 2015
- Figure 3.2: Prevalence of measured obesity by sex, household population aged 5 to 11 years, Canada excluding territories (selected years)
- Figure 3.3: Prevalence of measured overweight/obesity by sex, household population aged 5 to 11 years, Canada excluding territories (selected years)
- Figure 3.4: Prevalence of measured obesity based on POHEM projections and survey data, household population aged 6-11, by sex, Canada excluding the territories, 2001-2035
- Figure 3.5: Prevalence of measured obesity based on POHEM projections and survey data, household population aged 12-17, by sex, Canada excluding the territories, 2001-2035
- Figure 4.1: Prevalence of self-reported, adjusted self-reported and measured obesity, male household population aged 18 to 79 years, Canada 2000-2001 to 2019
- Figure 4.2: Prevalence of self-reported, adjusted self-reported and measured obesity, female household population aged 18 to 79 years, Canada 2000-2001 to 2019
Section 1: What is obesity and how is it measured?
Key points
- The most used indicator of excess body fat is the body mass index (BMI), which is a measure of an individual's weight in relation to their height.
- The Canadian Guidelines for Body Weight Classification in Adults classify individuals aged 18 years or older into six BMI categories, each representing a different level of health risk.
- The World Health Organization (WHO) recommends age- and sex-specific categories for calculating BMI for children and youth.
- A population-based surveillance of BMI can provide information on trends over time and assist in the development and evaluation of intervention programs.
What is obesity?
The term "obesity" describes a medical condition where excess body fat threatens health Footnote 17. Individuals with excess body fat have an elevated risk of diseases such as hypertension, coronary heart disease, type 2 diabetes, stroke, osteoarthritis and several types of cancer Footnote 2Footnote 18, and mental health conditions such as depression Footnote 1Footnote 18.
How is obesity measured?
BMI is the indicator most used by surveillance systems to track excess body fat within a population. It is a measure of an individual's weight in relation to their height (weight divided by height squared—weight (kg)/height(m2)) Footnote 19.
There are six BMI categories that classify people aged 18 years or older. Each represent a different level of health risk: underweight, normal weight, overweight, obesity class I, obesity class II, and obesity class III (see Box 1. BMI classification for adults). These categories are based on Canadian Guidelines for Body Weight Classification in Adults Footnote 20, and are aligned with those of the WHO Footnote 21.
| Classification | BMI category
(kg/m2) |
Risk of developing health problems |
|---|---|---|
| Underweight | < 18.5 | Increased |
| Normal weight | 18.5 to < 25.0 | Least |
| Overweight | 25.0 to < 30.0 | Increased |
| Obesity | ≥ 30.0 | |
| Obesity ≥ 30.0 (kg/m2) | ||
| Class I | 30.0 to < 35.0 | High |
| Class II | 35.0 to < 40.0 | Very high |
| Class III | ≥ 40.0 | Extremely high |
Some articles have been discussing the need to review the BMI cut-off points or the way BMI is measured since it does not consider age, gender, ethnicities and indigenous status, but recommendations by the WHO have yet to be emitted Footnote 22Footnote 23Footnote 24Footnote 25Footnote 26. At the present, these BMI cut-offs remain the best measure for obesity at a population level. |
||
This report uses the Canadian Guidelines to classify adults aged 18 years or older (excluding pregnant women) according to BMI Footnote 20.
Since children and youth grow at varying rates, WHO recommends age- and sex-specific cut-points. These cut-points are employed to calculate BMI for these groups (see Box 2. BMI classification for children and youth). For 5- to 17-year-olds, there are four classification categories (thin, normal weight, overweight, and obesity); for children younger than 5 years, an additional "at risk of overweight" category is used. For this report, the WHO cut-offs were used to classify children and youth aged 17 or younger (215 months or less) Footnote 11Footnote 12Footnote 13. Although the WHO cut-offs extend to age 19 years, for those aged 18 years or older (216 months or older), the adult classification was applied.
Box 2. BMI classification for children and youth
BMI calculation for children and youth is the same as for adults (weight divided by height squared). However, due to varying growth rates, cut-points are age- and sex-specific. The Public Health Agency of Canada calculates prevalence estimates of overweight and obesity based on BMI categories specified by the WHO Footnote 9Footnote 11.
In 2006, the WHO released international growth standards for children younger than 5 years (60 months or younger) Footnote 21. These standards are based on a cohort of children raised in desirable conditions that include breastfeeding, a good diet and a non-smoking mother, conditions considered optimal for healthy growth Footnote 11. In 2007, the WHO produced growth references for 5- to 19-year-olds. (61 to 228 months) Footnote 12. By 2010, several Canadian professional associations had recommended to employ the WHO references to monitor children's growth Footnote 27.
The WHO categories for classifying children younger than 5 years (60 months or younger) as having a BMI in the overweight or obesity category differ from those for children aged 5 years or older (61 months or older) Footnote 13. For both age groups, classification is based on growth charts specifying mean BMIs and standard deviations (SDs) by age in months. The approach for children younger than 5 years includes an "at risk of overweight" category, which lessens the likelihood that they will be classified in the obesity category during a period of rapid growth Footnote 13. Because of the difference in classification categories, the WHO does not recommend combining the younger and older age groups.
The following categories and SD values (based on the WHO cut-offs and SDs) Footnote 11Footnote 12Footnote 13 are used in the classification systems for children aged 60 months or younger and children aged 61 months or older:
| BMI category | 60 months or younger | 61 months or older |
|---|---|---|
| Thin | ≥ 2 SD below the mean | ≥ 2 SD below the mean |
| Normal weight | < 2 SD below the mean and
≤ 1 SD above the mean |
< 2 SD below the mean and
≤ 1 SD above the mean |
| At risk of overweight | > 1 SD above the mean and ≤ 2 SD above the mean | Category not applicable |
| Overweight | > 2 SD above the mean and ≤ 3 SD above the mean | > 1 SD above the mean and ≤ 2 SD above the mean |
| Obesity | > 3 SD above the mean | > 2 SD above the mean |
SD=standard deviation from the age-/sex-specific WHO growth chart mean |
||
Other measures of excess body fat
BMI does not distinguish between body fat and lean body mass (muscle), and it gives no information about the distribution of body fat or body shape Footnote 19Footnote 28. Abdominal obesity, a measure of body fat distribution, has shown to be associated with all-cause mortality and cardiovascular disease mortality Footnote 29Footnote 30Footnote 31Footnote 32Footnote 33Footnote 34. Measures of abdominal obesity may provide added discriminatory power in predicting obesity-related disease Footnote 29Footnote 30Footnote 31Footnote 32Footnote 33Footnote 34. Even among individuals whose BMI is in the normal weight category, abdominal fat has been associated with cardiovascular disease risk-factors Footnote 35. For clinical settings, it is recommended that waist circumference be measured as well as BMI, particularly for people with a BMI in the normal, overweight, or obese class I categories Footnote 36. Among adults with a BMI in obese class II and class III categories, waist circumference measurements are nearly all in the high health risk waist circumference group. For people aged 18 years or older, the WHO Footnote 37, Health Canada Footnote 38, and Obesity Canada Footnote 36 classify waist circumference into three health-risk categories Footnote 39 (see Box 3. Waist circumference health-risk categories for adults).
Several techniques for measuring body fat are more accurate than BMI such as underwater weighing (densitometry), dual energy X-ray absorptiometry, and magnetic resonance imaging Footnote 19Footnote 28. These procedures are complex, expensive, and not practical for clinical settings or for surveillance. They confirm the accuracy of simpler methods, such as BMI, in research studies. BMI has been found to be strongly correlated with body fat as measured by these more complex methods (which are considered to be the "gold standard"), but does have its limitations Footnote 7Footnote 19Footnote 28.
| Waist circumference health-risk | Waist circumference measurement | |
|---|---|---|
| Men | Women | |
| Low-risk | < 94.0 cm | < 80.0 cm |
| Increased-risk | 94.0 to < 102.0 cm | 80.0 to < 88.0 cm |
| High-risk | ≥ 102.0 cm | ≥ 88.0 cm |
Although these supplemental techniques (for example, waist circumference, densitometry, and magnetic resonance imaging) provide valuable insights, BMI remains the preferred measure for population surveillance and epidemiologic studies, owing to its simplicity, cost-effectiveness, and the ease with which it can be estimated.
Health risks associated with elevated BMI
Among adults, obesity (BMI ≥ 30 kg/m2) has been associated with increased risk of type 2 diabetes, cardiovascular disease, asthma, gallbladder disease, osteoarthritis, chronic back pain, and several types of cancer Footnote 2. As well, a BMI in the overweight category (BMI 25.0-29.9 kg/m2) has been associated with a higher likelihood of these diseases Footnote 2. Research has also revealed relationships between excess body fat and mental health conditions such as mood disorders, post-traumatic stress disorder, binge eating disorder, and schizophrenia Footnote 1.
Severe obesity (BMI ≥ 40 kg/m2, as defined by Health Canada and WHO guidelines Footnote 38 presents the greatest health risk, particularly for type 2 diabetes (5.1 times the risk compared to normal BMI) and cardiovascular disease (2.53 to 3.14 times the risk compared to normal BMI) Footnote 40Footnote 41. Although the prevalence of severe obesity is low, the associated health care expenditures are disproportionately high Footnote 42.
The association between BMI and mortality is less conclusive. Some studies Footnote 43Footnote 44Footnote 45Footnote 46Footnote 47Footnote 48 have found that that people with a BMI in the overweight category are at decreased risk of all-cause mortality, compared with a BMI in the normal weight category. The obesity paradox describes this counterintuitive relationship. Methodological shortcomings in the research reporting these results, such as reverse causation and failure to account for confounding variables, are likely at the root of this unexpected association. This relationship is further complicated by BMI failing to distinguish between body fat and fat-free, lean muscle mass. The BMI "overweight" category includes individuals whose BMI value results from higher levels of body fat but also individuals whose BMI value results from higher fat-free, lean muscle mass Footnote 49. Misclassification through lean muscle mass is most common in certain clinical populations Footnote 50, and individuals with physical fitness requirements (for example, soldiers Footnote 51 or athletes Footnote 52). See Appendix A: BMI, mortality, and the obesity paradox.
Among children, the earlier onset of diseases – including type 2 diabetes, coronary heart disease, hypertension, and a range of cancers – has been associated with high BMI Footnote 3Footnote 4. Evidence also suggests that a high BMI in childhood can have psychosocial impact, such as depression, lower self-esteem, and behavioral disorders Footnote 5Footnote 6. As well, obesity in childhood and adolescence is strongly associated with obesity in adulthood Footnote 7Footnote 8.
Estimates for the direct (that is, costs associated with treatment and condition management) and indirect costs (that is, costs associated with life years lost to premature death and short- or long-term disability) of obesity are high Footnote 53. A recent Organisation for Economic Co-operation and Development (OECD) report found that, on average, countries would spend 8.4% of total health expenditures treating the consequences of overweight and obesity between 2020 and 2050 Footnote 53. OECD predicted average spending associated with management of obesity and overweight is approximately double the estimated healthcare costs of overweight and obesity in 2006 of 4.1% Footnote 54. Obesity and its health consequences are associated with economic effects such as decreased work productivity and workforce participation. As mentioned in the OECD report, at a macroeconomic level, such an impact on the labour market affects the GDP of a country and increases fiscal pressure Footnote 53.
Surveillance
Regular surveillance of BMI trends over time is essential for understanding populations at risk, identifying areas for intervention, and evaluating the effectiveness of policies and programs.
BMI remains the preferred measure for population surveillance and epidemiologic studies, owing to its simplicity, cost-effectiveness, and the ease with which it can be estimated.
At the national level, several Statistics Canada surveys routinely provide surveillance data for BMI calculation. However, because height and weight data are not collected in the same way, different surveys yield different estimates. See Section 4: Data Sources and Methods for more information.
Self-reported versus measured BMI
BMI may be calculated using information from surveys that ask respondents to self-report their height and weight, or from surveys with interviewers trained to take precise measurements. To estimate BMI for children, surveys may ask parents to report their child's height and weight. However, the accuracy of BMI estimates based on parent-reported data has been questioned Footnote 55.
Adults’ self-reports underestimate weight and overestimate height Footnote 10. Consequently, prevalence estimates of overweight and obesity calculated from self-reported data are significantly lower than estimates based on measured data. Researchers in Canada have sought to establish equations that correct such self-reports to obtain more accurate estimates of BMI from self-reported data. See Appendix B: Correction equations for adjusting BMI in the CCHS based on self-/parent-reported height and weight. In this report, BMIAdjSR refers to BMI based on self-reported values that have been adjusted to correct for biases.
Similar to adults, BMI classification of youth, based on self-reported height and weight, underestimates the prevalence of overweight and obesity Footnote 14Footnote 15. For youth, however, females underestimate their weight more than males. Furthermore, for both sexes, those with a BMI classified as in the overweight/obesity range underestimate their weight more than youth with a BMI in the normal weight category Footnote 15. More work is required to determine if developing correction equations for youth is feasible.
For children, self- and parent-reported height and weight often result in substantial misclassification of BMI Footnote 55. Moreover, while misclassification of BMI based on adults' self-reported height and weight tends to be consistent and predictable, this is not true for children's BMI based on parent-reported height and weight Footnote 55. This inconsistency has thwarted attempts to devise correction equations to adjust BMI based on parent reports.
Section 2: Adult obesity
Key points
- In 2021, based on adjusted self-reported height and weight, 29.5% of Canadian adults had a BMIAdjSR classified as obesity.
- An additional 35.5% had a BMIAdjSR classified as overweight.
- An estimated 3.7% of adults had a BMIAdjSR that placed them in obesity class III, the category associated with extremely high health risk.
- Although there was no difference in the proportion of men compared to women with a BMIAdjSR in the obesity range, men were more likely than women to have a BMIAdjSR in the overweight range (39.7% versus 31.3%).
- The lowest prevalence of obesity was among the youngest (18 to 34 years) and oldest (80 years or older) age groups: 22.5% and 21.2%, respectively.
- Among women, low household income was associated with a significantly higher prevalence of obesity than the highest household income group (30.8% versus 26.6%). Among men, no significant differences were seen across the different household incomes.
- For both sexes, the lowest prevalence of obesity was among those in the highest household education group (post-secondary graduate): 28.3% versus 36.7% and 35.1% among those with only secondary school graduation, or less than secondary school graduation.
- Obesity was significantly more common among adults in rural areas (33.6%) than in urban ones (28.6%).
- Between 2000-2001 and 2019-2020, the prevalence of obesity among adults based on self-reported data rose from 20.6% to 28.2%; increases were similar among men and women.
- A significant upward trend in the prevalence of obesity was observed among adults in all age groups, all household income quintiles, and all levels of household education.
- The prevalence of obesity class III among adults doubled from 2000-2001 to 2019-2020.
- Initial results from 2021 show increases in the prevalence of obesity during the COVID-19 pandemic, however more data is required to determine trends.
Reminder: BMIAdjSR refers to BMI based on self-reported values that have been adjusted to correct for biases.
Box 4. Data sources
Recent estimates of adult BMI are available from three national surveys:
- The Canadian Community Health Survey (CCHS) collects self-reported height and weight on adults aged 18 and over. The most recent, complete cycle, 2021, provides estimates for Canada, excluding the territories. The 2019-2020 CCHS provides the most recent data for the provinces and the territories.
- The Canadian Health Measures Survey (CHMS) collects measured height, weight, and waist circumference on adults aged 18 to 79. The most recent cycles (4, 5 and 6) were conducted in 2014-2015, 2016-2017, and 2018-2019. For this report, results from these three cycles (combined 2014-2019) were combined to report more stable estimates.
- The CCHS–Nutrition Focus (CCHS-Nutrition), which was conducted in 2004 and 2015, includes measured height and weight on adults aged 18 and over.
Most estimates in this section are based on adjusted self-reported BMI data (BMIAdjSR) from the 2021 CCHS. See Appendix B: Correction equations for adjusting BMI in the CCHS based on self-/parent-reported height and weight. CCHS 2019-2020 data were used for the analyses of provincial and territorial variations.
Although measured BMI data are available from the CHMS, adjusted self-reported data from the CCHS survey are used instead to obtain the largest sample, allowing for detailed granular estimates. The extent to which adjusted self-reported estimates align with estimates based on physical measurements is indicated in Figure 2.1, which presents estimates of the prevalence of obesity among adults aged 18 to 79 years from three surveys with comparable time frames: the combined 2015-2016 CCHS, the 2015 CCHS—Nutrition, and the 2014-2015/2016-2017 CHMS. Estimates from the 2015-2016 CCHS were adjusted (BMIAdjSR) to correct for the bias in BMI derived from self-reported data. For both men and women, estimates from the three surveys are similar.
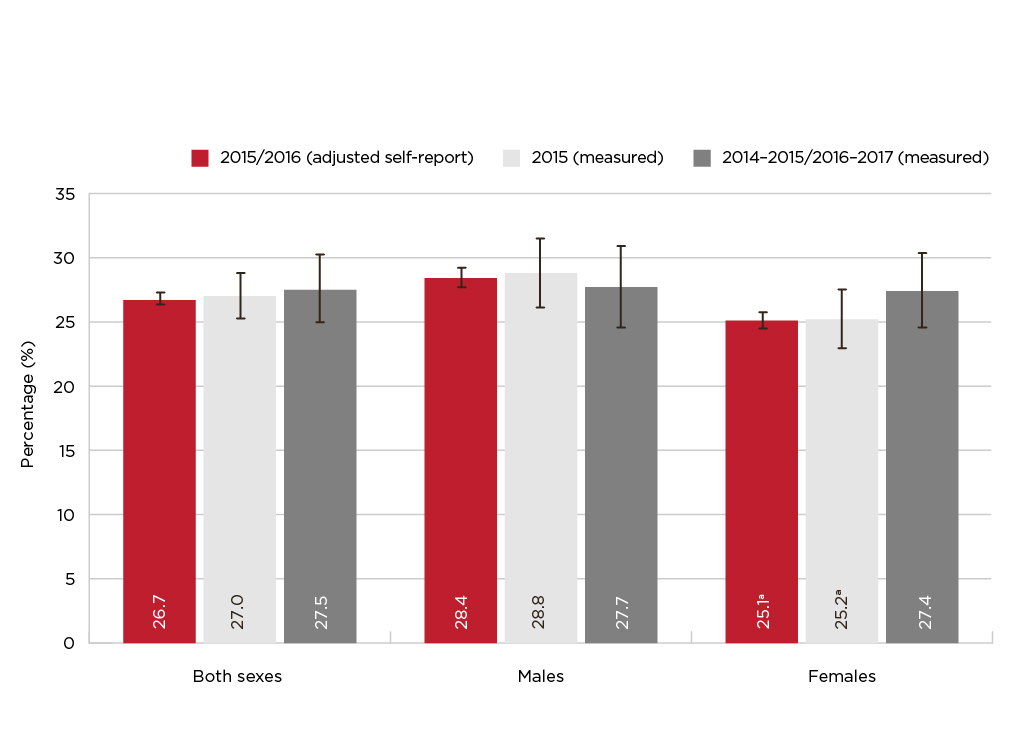
Figure 2.1 - Text description
| Both Sexes | Males | Females | ||||
|---|---|---|---|---|---|---|
| % | 95% Confidence Interval |
% | 95% Confidence Interval |
% | 95% Confidence Interval |
|
| 2015/2016 (adjusted self-report) | 26.7 | (26.3, 27.2) | 28.4 | (27.6, 29.1) | 25.1 Footnote a | (24.4, 25.7) |
| 2015 (measured) | 27.0 | (25.2, 28.8) | 28.8 | (26.1, 31.4) | 25.2 Footnote a | (22.9, 27.5) |
| 2014-2015/2016-2017 (measured) | 27.5 | (24.9, 30.1) | 27.7 | (24.5, 30.8) | 27.4 | (24.5, 30.3) |
Data sources: 2015/2016 Canadian Community Health Survey (share file), 2015 Canadian Community Health Survey—Nutrition (share file), 2014-2015/2016-2017 Canadian Health Measures Survey (Cycles 4 and 5). Footnotes
|
||||||
Prevalence of obesity and overweight among adults
In 2021, 29.5% of Canadian adults were classified as having a BMIAdjSR that set them in the obesity category (see Table A2.2 in Appendix C). An estimated 18.9% had a BMIAdjSR in obesity class I (high risk); 6.9%, in class II (very high risk); and 3.7%, in class III (extremely high risk) (see Figure 2.2). See Box 1. BMI classification for adults in Section 1 for details regarding the categories.
Age and sex
In 2021, for both sexes, 65.0% had a BMIAdjSR classified as overweight/obese while 29.5% were classified in the obesity category and 35.5% were classified in the overweight category. When comparing men and women, there were significantly more men than women in the overweight/obesity category: 69.8% versus 60.1% (see Table A2.2 in Appendix C). For the BMIAdjSR in the obesity range, there were no differences between men and women. However, more men than women were in the overweight category: 39.7% versus 31.3%. Another significant difference than can be observed between men and women is for the obesity class I where a higher percentage of men than women are classified in that category (19.9% versus 18.0%) (see Figure 2.2).

Figure 2.2 - Text description
| Underweight (< 18.5) | Normal weight (18.5 to 24.9) | Overweight (25.0 to 29.9) | Obesity Class I (30.0 to 34.9) | Obesity Class II (35.0 to 39.9) | Obesity Class III (≥ 40.0) | |
|---|---|---|---|---|---|---|
| Both | 1.7 | 33.4 | 35.5 | 18.9 | 6.9 | 3.7 |
| Males | 1.3 Footnote E | 28.9 | 39.7 | 19.9 | 6.6 | 3.6 |
| Females | 2.0 Footnote a | 37.8 Footnote a | 31.3 Footnote a | 18.0 Footnote a | 7.1 | 3.8 |
Data source: 2021 Canadian Community Health Survey (share file). Footnotes
Note: The percentages are based on records with a valid value for BMI. Excluded from the total population counts are pregnant women (n=284, estimated population 278.2 thousand) and individuals with a missing value for BMI (n=828 for males, estimated population 613.9 thousand; n=1,138 for females, estimated population 812.9 thousand). |
||||||
Overall, the prevalence of adjusted self-reported obesity is significantly lower for those aged between 18 and 34 years (22.5%) and 80 years or older (21.2%) (see Figure 2.3). The same observation can be made when looking at men and women separately. For men specifically, the prevalence of obesity was lower for those in the 65 to 79 age group when compared to the 50 to 64 age group (30.9% versus 36.4%). For women, those age groups had similar obesity prevalence. Among men, the prevalence of obesity was significantly higher than women between the ages of 50 and 64 years: 36.4% versus 31.1%. For more information, see Table A2.3 in Appendix C.
The low prevalence of obesity among the elderly (21.2%) should be interpreted cautiously. As people age, they tend to lose muscle mass, which is often replaced with fat Footnote 56Footnote 57. Therefore, even if an individual's BMI does not change, increases in fat may raise their health risk.

Figure 2.3 - Text description
| Age group (in years) | Both Sexes | Males | Females | |||
|---|---|---|---|---|---|---|
| % | 95% |
% | 95% |
% | 95% |
|
| Total (18 or older) | 29.5 | (28.6, 30.3) | 30.1 | (28.9, 31.3) | 28.9 | (27.8, 30.0) |
| 18 to 34 | 22.5 Footnote b | (20.7, 24.3) | 22.3 Footnote b | (19.8, 24.8) | 22.7 Footnote b | (20.3, 25.2) |
| 35 to 49 | 32.9 | (31.1, 34.6) | 33.8 | (31.3, 36.3) | 31.9 | (29.7, 34.1) |
| 50 to 64 (reference) | 33.7 | (32.1, 35.3) | 36.4 | (34.0, 38.8) | 31.1 Footnote a | (28.9, 33.3) |
| 65 to 79 | 31.5 | (30.1, 32.8) | 30.9 Footnote b | (28.8, 32.9) | 32.0 | (30.1, 33.8) |
| 80 or older | 21.2 Footnote b | (18.7, 23.7) | 19.6 Footnote b | (15.9, 23.3) | 22.4 Footnote b | (19.0, 25.9) |
Data source: 2021 Canadian Community Health Survey (share file). Footnotes
|
||||||
Waist circumference
Based on CHMS data from 2014 to 2019, 41.9% of adults aged 18 to 79 years had a waist circumference in the high-risk range (see Table 2a). An additional 21.9% were in the increased-risk category. Overall, 63.8% of adults had a waist circumference associated with high health risk. In all age categories, significantly more women had a high-risk waist circumference compared to men: 29.5% versus 21.9% for age 18 to 34; 50.1% versus 31.6% for age 35 to 49; 61.3% versus 39.5% for age 50 to 64; and 66.5% versus 50.3% for age 65 to 79.
Measures of central obesity can be helpful in assessing health risk at older ages Footnote 19Footnote 28Footnote 47. Waist circumference data from the CHMS show that the prevalence of high-risk measurements rose with age. The percentage of men with a high-risk waist circumference increased from 21.9% at ages 18 to 34 years to 50.3% at ages 65 to 79 years (the oldest age group in the CHMS); among women, percentages were higher, rising from 29.5% at ages 18 to 34 years to 66.5% at ages 65 to 79 years (see Table 2a).
| Age group (in years) | Both Sexes | Males | Females | |||
|---|---|---|---|---|---|---|
| % | 95% Confidence Interval | % | 95% Confidence Interval | % | 95% Confidence Interval | |
| Total (18-79) | ||||||
| Low-risk WC | 36.2 | (33.4, 39.0) | 42.6 | (39.9, 45.2) | 29.8 Footnote b | (25.6, 34.0) |
| Increased-risk WC | 21.9 | (20.3, 23.5) | 23.6 | (21.2, 26.1) | 20.1 Footnote b | (17.8, 22.3) |
| High-risk WC | 41.9 | (38.5, 45.3) | 33.8 | (30.5, 37.1) | 50.1 Footnote b | (45.8, 54.5) |
| Age 18-34 | ||||||
| Low-risk WC | 56.7 Footnote a | (52.1, 61.2) | 62.4 Footnote a | (56.8, 67.9) | 50.6 Footnote aFootnote b | (42.4, 58.9) |
| Increased-risk WC | 17.7 Footnote a | (14.7, 20.7) | 15.7 Footnote a | (12.5, 19.0) | 19.8 | (14.4, 25.3) |
| High-risk WC | 25.6 Footnote a | (22.1, 29.1) | 21.9 Footnote a | (17.4, 26.5) | 29.5 Footnote aFootnote b | (23.6, 35.5) |
| Age 35-49 (reference) | ||||||
| Low-risk WC | 36.2 | (31.0, 41.4) | 42.7 | (36.8, 48.7) | 29.7 Footnote b | (23.1, 36.2) |
| Increased-risk WC | 22.9 | (20.3, 25.5) | 25.7 | (21.4, 29.9) | 20.2 | (16.7, 23.6) |
| High-risk WC | 40.9 | (35.5, 46.2) | 31.6 | (25.3, 37.9) | 50.1 Footnote b | (43.9, 56.4) |
| Age 50-64 | ||||||
| Low-risk WC | 24.5 Footnote a | (21.4, 27.7) | 31.2 Footnote a | (26.5, 35.9) | 17.8 Footnote aFootnote b | (14.2, 21.3) |
| Increased-risk WC | 25.2 | (22.3, 28.0) | 29.4 | (24.6, 34.1) | 21.0 Footnote b | (16.4, 25.5) |
| High-risk WC | 50.3 Footnote a | (46.3, 54.4) | 39.5 Footnote a | (33.6, 45.3) | 61.3 Footnote aFootnote b | (56.7, 65.8) |
| Age 65-79 | ||||||
| Low-risk WC | 19.8 Footnote a | (16.5, 23.2) | 25.1 Footnote a | (20.3, 30.0) | 14.8 Footnote aFootnote b | (10.5, 19.1) |
| Increased-risk WC | 21.6 | (18.7, 24.6) | 24.6 | (20.4, 28.8) | 18.8 Footnote b | (15.6, 21.9) |
| High-risk WC | 58.5 Footnote a | (54.0, 63.1) | 50.3 Footnote a | (44.9, 55.7) | 66.5 Footnote aFootnote b | (61.4, 71.5) |
Data sources: 2014-2015, 2016-2017, and 2018-2019 Canadian Health Measures Survey (Cycles 4, 5, and 6).
WC=waist circumference. |
||||||
Household income and education
Associations between household income and obesity differed for men and women (see Figure 2.4). Women in the lowest income quintiles had the highest prevalence of obesity (30.8%), which was significantly higher than women in the highest income quintile (26.6%). The prevalence varied relatively little among women in quintiles two to four (ranging from 28.4% to 29.5%). By contrast, men in the highest income quintile have a significantly higher prevalence of obesity than women in the same quintile (31.2% versus 26.6%). Among men, no differences in the distribution of BMIAdjSR appeared across income quintiles. For information on the confidence intervals (CI), see Table A2.4 in Appendix C.
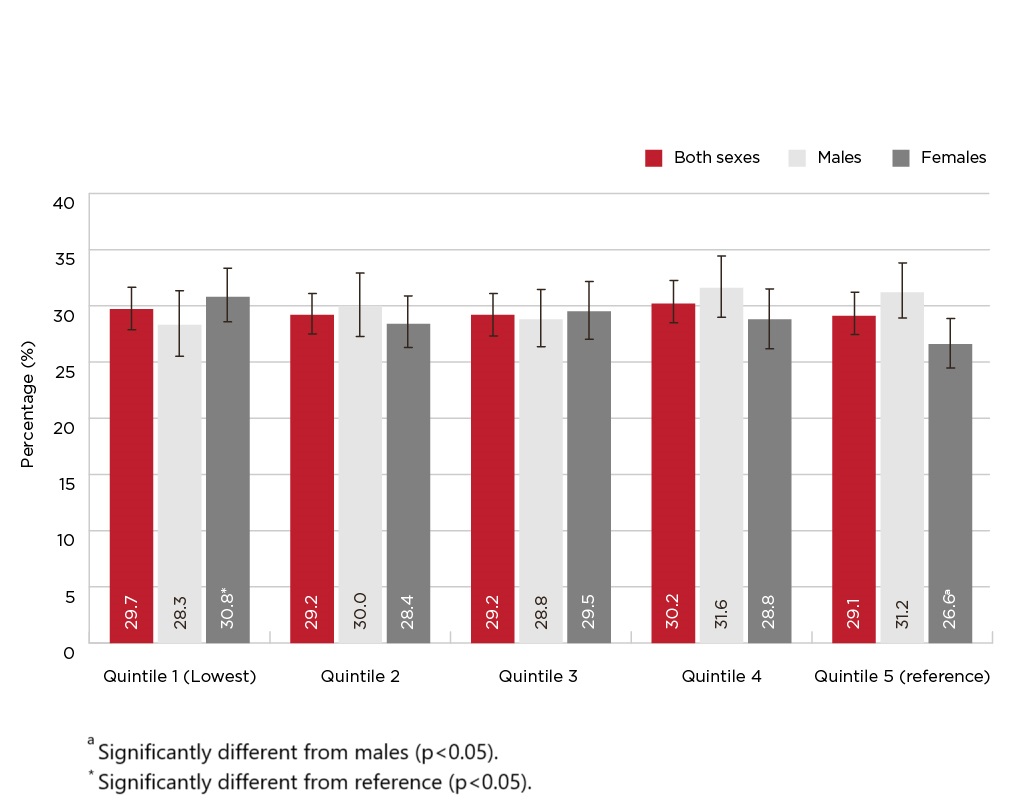
Figure 2.4 - Text description
| Household income quintile | Both Sexes | Males | Females | |||
|---|---|---|---|---|---|---|
| % | 95% |
% | 95% |
% | 95% |
|
| Quintile 1 (Lowest) | 29.7 | (27.8, 31.5) | 28.3 | (25.4, 31.2) | 30.8 Footnote b | (28.5, 33.2) |
| Quintile 2 | 29.2 | (27.4, 31.0) | 30.0 | (27.2, 32.8) | 28.4 | (26.2, 30.7) |
| Quintile 3 | 29.2 | (27.3, 31.0) | 28.8 | (26.3, 31.4) | 29.5 | (26.9, 32.0) |
| Quintile 4 | 30.2 | (28.4, 32.1) | 31.6 | (28.9, 34.3) | 28.8 | (26.1, 31.4) |
| Quintile 5 (reference) | 29.1 | (27.4, 30.9) | 31.2 | (28.8, 33.6) | 26.6 Footnote a | (24.4, 28.8) |
Data source: 2021 Canadian Community Health Survey (share file). Footnotes
|
||||||
For both sexes, the lowest prevalence of obesity was among those in the highest household education group (post-secondary graduate): 28.3% versus 36.7% (only secondary school graduation) and 35.1% (less than secondary school graduation). See Table A2.5 in Appendix C or look at Figure 2.5 below. Significantly more men than women with a post-secondary degree, were classified in the obesity category: 29.2% versus 27.3%.

Figure 2.5 - Text description
| Highest level of education in the household | Both Sexes | Males | Females | |||
|---|---|---|---|---|---|---|
| % | 95% |
% | 95% |
% | 95% |
|
| Less than secondary school graduation | 35.1 Footnote b | (31.9, 38.2) | 33.5 | (29.1, 37.9) | 36.5 Footnote b | (32.1, 40.9) |
| Secondary school graduation | 36.7 Footnote b | (34.4, 39.0) | 36.5 Footnote b | (32.9, 40.1) | 36.9 Footnote b | (33.9, 39.8) |
| Post-secondary certificate, diploma or university degree (reference) | 28.3 | (27.4, 29.2) | 29.2 | (27.9, 30.5) | 27.3 Footnote a | (26.2, 28.5) |
Data source: 2021 Canadian Community Health Survey (share file). Footnotes
|
||||||
Box 5. International Surveillance
International surveillance has revealed a negative association between socioeconomic status (SES) and BMI in higher-income countries, but a positive association in lower-income countries. This is called the "reversal hypothesis," for which several explanations have been proposed. In affluent countries, the higher prevalence of obesity among those with low SES may be due to lack of funds to buy healthy foods. In poorer countries, the lower prevalence of obesity among those with low SES may reflect limited access to any food Footnote 58. As well, in higher-income countries, cultural values about the desirability of being thin may motivate high-SES individuals to avoid weight gain. By contrast, in lower-income countries, excess weight may be seen as a status symbol.
Regional variations
In 2019-2020, the prevalence of adult obesity varied across provinces and territories, ranging from 23.2% in British Columbia to 40.4% in Newfoundland and Labrador (see Table 2b). Provincial prevalence estimates of obesity were similar when differences in the age-distribution between provinces were taken into consideration (see Table A2b in Appendix C).
| Province | Both Sexes | Males | Females | |||
|---|---|---|---|---|---|---|
| % | 95% |
% | 95% |
% | 95% |
|
| Total (18+) | 28.2 | (27.7, 28.7) | 28.7 | (28.0, 29.5) | 27.7 Footnote a | (26.9, 28.4) |
| Newfoundland and Labrador | 40.4 Footnote b | (37.4, 43.4) | 41.2 Footnote b | (37.0, 45.4) | 39.5 Footnote b | (35.6, 43.4) |
| Prince Edward Island | 36.2 Footnote b | (32.4, 40.1) | 34.6 | (28.9, 40.2) | 37.9 Footnote b | (33.0, 42.9) |
| Nova Scotia | 34.8 Footnote b | (32.2, 37.4) | 35.2 Footnote b | (31.0, 39.4) | 34.5 Footnote b | (31.4, 37.5) |
| New Brunswick | 37.3 Footnote b | (34.7, 39.9) | 34.4 | (30.5, 38.4) | 40.2 Footnote aFootnote b | (36.6, 43.7) |
| Quebec | 26.2 Footnote b | (25.1, 27.4) | 26.9 | (25.3, 28.4) | 25.6 Footnote b | (24.1, 27.1) |
| Ontario | 28.3 | (27.3, 29.2) | 28.4 | (27.0, 29.8) | 28.1 | (26.9, 29.4) |
| Manitoba | 32.7 Footnote b | (30.5, 34.9) | 32.0 | (28.7, 35.2) | 33.5 Footnote b | (30.5, 36.4) |
| Saskatchewan | 35.6 Footnote b | (33.2, 37.9) | 37.0 Footnote b | (33.5, 40.5) | 34.0 Footnote b | (30.7, 37.4) |
| Alberta | 29.7 | (28.2, 31.2) | 31.5 | (29.3, 33.8) | 27.8 Footnote a | (25.8, 29.9) |
| British Columbia | 23.2 Footnote b | (21.8, 24.6) | 24.4 Footnote b | (22.4, 26.5) | 22.0 Footnote b | (20.1, 23.8) |
| Yukon | 33.3 | (27.8, 38.9) | 32.6 | (24.0, 41.3) | 34.0 | (26.3, 41.8) |
| Northwest Territories | 36.7 | (30.4, 43.0) | 34.7 | (27.3, 42.0) | 39.0 | (29.7, 48.2) |
| Nunavut | 33.2 | (24.5, 41.8) | 23.0 Footnote E | (11.3, 34.8) | 46.6 Footnote EFootnote a | (31.1, 62.1) |
Data source: 2019-2020 Canadian Community Health Survey (share file).
|
||||||
In 2021, obesity was more common among adults in rural areas (33.6%) than in urban centres (28.6%). For both sexes, the observation was the same, males: 35.0% versus 29.0%; females: 32.0% versus 28.3% (See Table A2.6 in Appendix C or look at Figure 2.6 below). Furthermore, in rural areas, the prevalence of self-reported obesity is significantly higher in men than women.
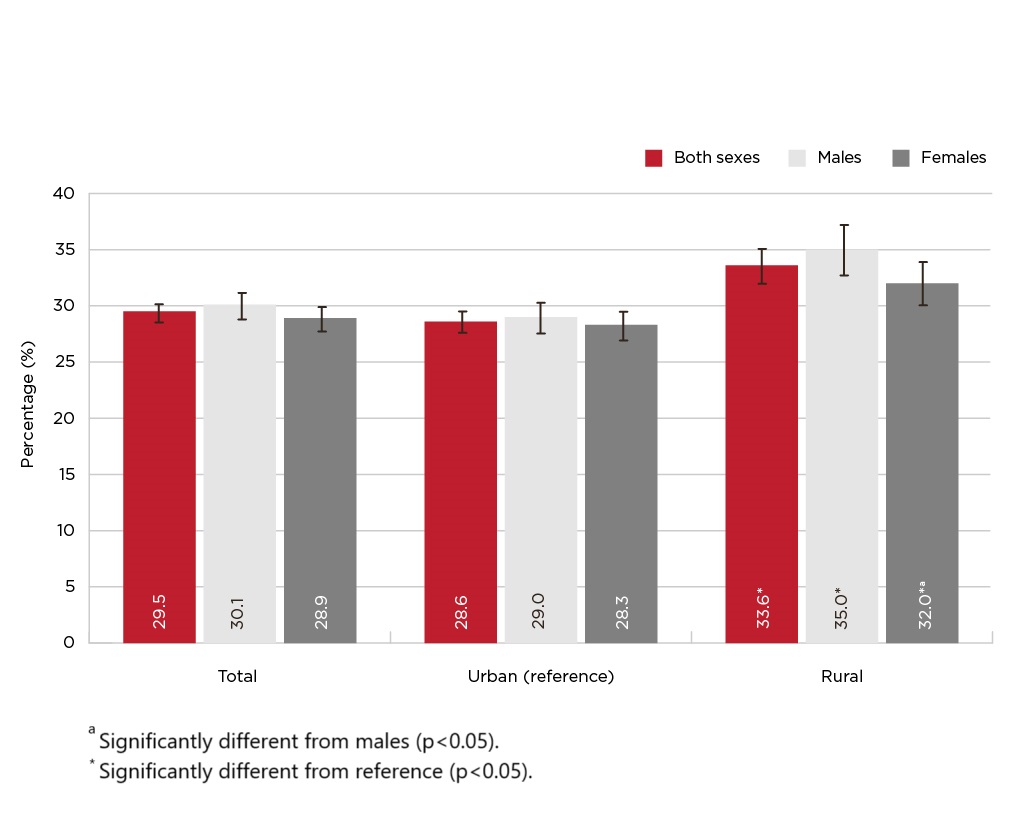
Figure 2.6 - Text description
| Urban/rural | Both Sexes | Males | Females | |||
|---|---|---|---|---|---|---|
| % | 95% |
% | 95% |
% | 95% |
|
| Total | 29.5 | (28.6, 30.3) | 30.1 | (28.9, 31.3) | 28.9 | (27.8, 30.0) |
| Urban (reference) | 28.6 | (27.7, 29.6) | 29.0 | (27.6, 30.4) | 28.3 | (27.0, 29.5) |
| Rural | 33.6 Footnote b | (32.1, 35.1) | 35.0 b | (32.8, 37.3) | 32.0 Footnote aFootnote b | (30.1, 34.0) |
Data source: 2021 Canadian Community Health Survey (share file). Footnotes
|
||||||
The Canadian Risk Factor Atlas (CRFA) examines the prevalence of obesity and overweight in all provinces, territories, health regions, census metropolitan areas, and large census agglomerations in Canada. To allow for information to be presented at a range of geographic levels, including distributions by age, sex, income and education, data from four cycles of the CCHS (2015-2018) were combined Footnote 59. Figure 2.7 shows the distribution of obesity by health region among adults, using data from the CRFA tool. For additional information, see Table A2.7 in Appendix C.
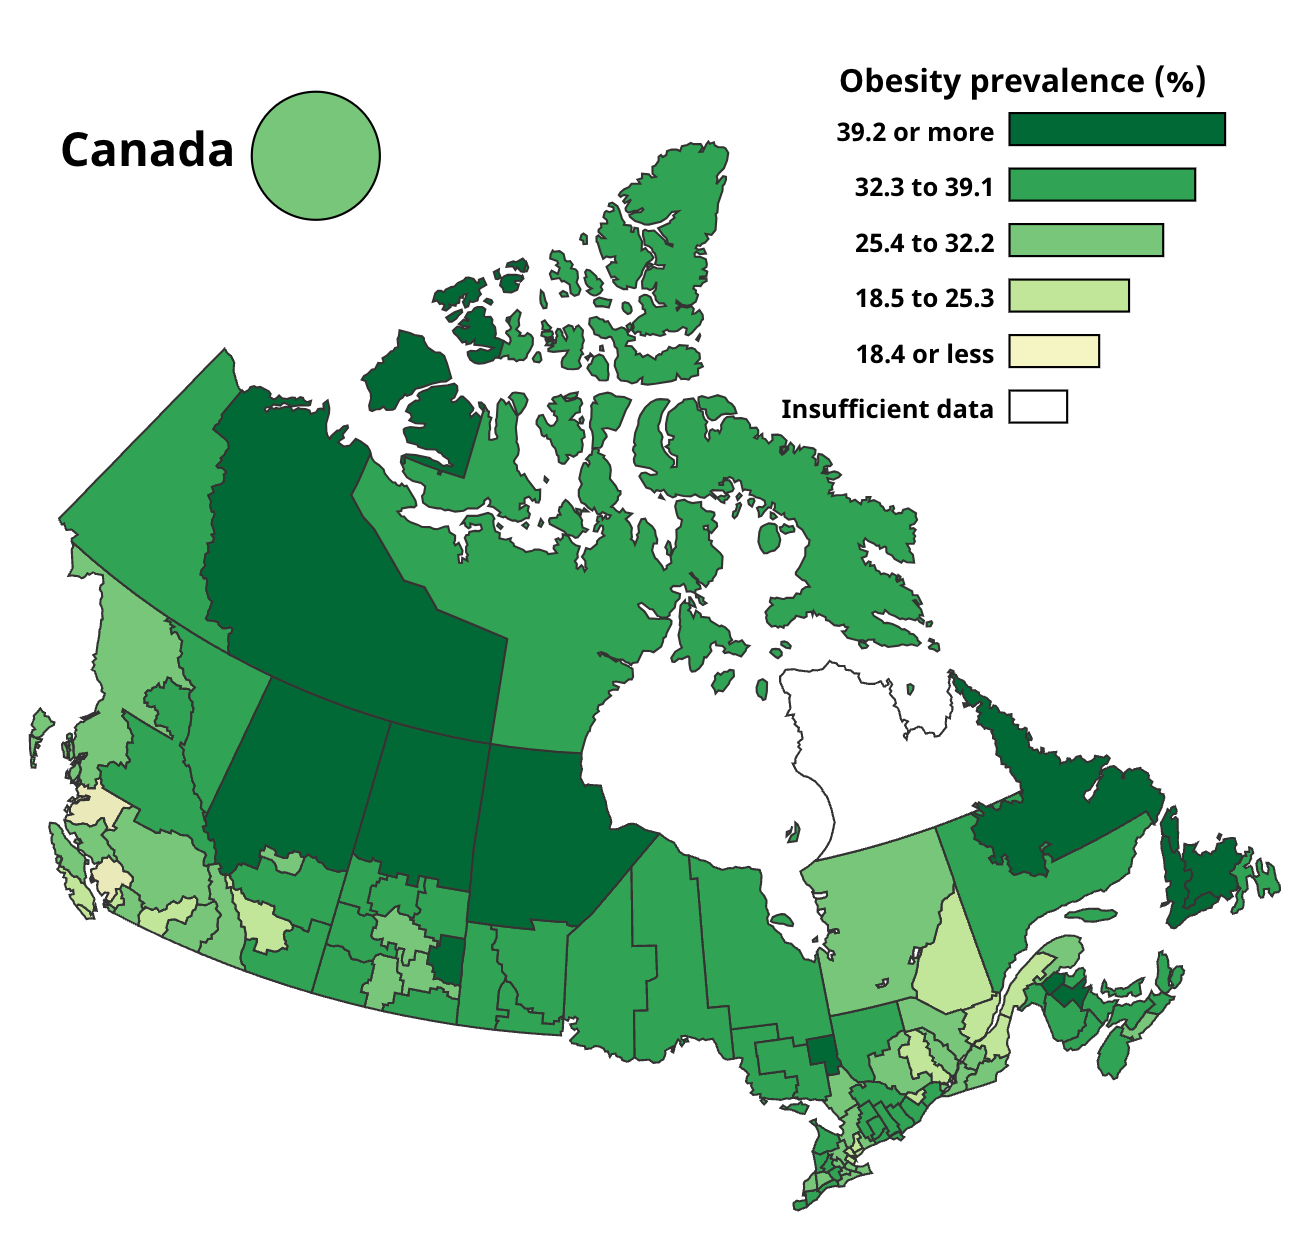
Figure 2.7 - Text description
Geography |
Prevalence (%) | 95% Confidence Interval |
|---|---|---|
| Canada | 26.7 | (26.3, 27.1) |
| Bas-Saint-Laurent | 25.3 | (22.3, 28.3) |
| Brant County HU | 31.9 | (28.3, 35.5) |
| Calgary Zone | 24.2 | (22.7, 25.7) |
| Capitale-Nationale | 22.4 | (20.4, 24.3) |
| Central Regional | 40.3 | (36.8, 43.9) |
| Central Vancouver Island HSDA | 22.9 | (20.0, 25.8) |
| Central Zone | 33.6 | (31.5, 35.8) |
| Chatham-Kent HU | 37.9 | (33.9, 41.9) |
| Chaudière-Appalaches | 22.5 | (20.1, 25.0) |
| City of Hamilton HU | 27.2 | (23.9, 30.5) |
| City of Ottawa HU | 23.1 | (20.9, 25.4) |
| City of Toronto HU | 19.6 | (17.9, 21.3) |
| Côte-Nord | 34.9 | (31.5, 38.3) |
| Cypress RHA | 36.6 | (31.3, 41.9) |
| Durham Regional HU | 29.2 | (25.8, 32.5) |
| East Kootenay HSDA | 29.0 | (24.3, 33.7) |
| Eastern Ontario HU | 32.6 | (28.6, 36.6) |
| Eastern Regional | 38.7 | (36.0, 41.3) |
| Edmonton Zone | 27.5 | (25.7, 29.4) |
| Elgin-St Thomas HU | 36.6 | (33.1, 40.1) |
| Five Hills RHA | 30.0 | (25.4, 34.6) |
| Fraser East HSDA | 30.3 | (27.1, 33.4) |
| Fraser North HSDA | 21.6 | (18.5, 24.6) |
| Fraser South HSDA | 26.3 | (23.7, 29.0) |
| Gaspésie - Îles-de-la-Madeleine | 31.0 | (28.1, 33.8) |
| Grey Bruce HU | 34.4 | (31.0, 37.9) |
| Haldimand-Norfolk HU | 28.7 | (25.6, 31.8) |
| Haliburton, Kawartha, Pine Ridge District HU | 34.7 | (30.8, 38.5) |
| Halton Regional HU | 23.9 | (21.5, 26.4) |
| Hastings and Prince Edward Counties HU | 35.2 | (31.4, 38.9) |
| Heartland RHA | 35.9 | (30.2, 41.7) |
| Huron County HU | 34.1 | (29.4, 38.9) |
| Interlake-Eastern Regional Health | 37.9 | (34.7, 41.2) |
| Kelsey Trail RHA | 37.6 | (30.2, 45.0) |
| Kingston, Frontenac and Lennox and Addington HU | 32.3 | (28.5, 36.1) |
| Kootenay-Boundary HSDA | 27.8 | (23.9, 31.7) |
| L'Abitibi-Témiscamingue | 34.0 | (31.3, 36.7) |
| L'Estrie | 26.4 | (24.2, 28.7) |
| L'Outaouais | 27.3 | (25.2, 29.4) |
| Labrador-Grenfell Regional | 46.1 | (42.3, 49.9) |
| Lambton HU | 30.5 | (26.9, 34.1) |
| Leeds, Grenville and Lanark District HU | 34.5 | (29.7, 39.4) |
| Mamawetan/Keewatin/Athabasca | 43.9 | (35.8, 52.1) |
| Mauricie et du Centre-du-Québec | 29.0 | (27.0, 30.9) |
| Middlesex-London HU | 26.5 | (23.4, 29.7) |
| Montérégie | 28.2 | (26.1, 30.3) |
| Northwest Territories | 40.2 | (36.9, 43.6) |
| Nunavut | 33.7 | (30.0, 37.5) |
| Niagara Regional Area HU | 29.8 | (26.7, 32.8) |
| Nord-du-Québec | 30.4 | (26.0, 34.7) |
| North Bay Parry Sound District HU | 31.7 | (28.3, 35.0) |
| North Shore/Coast Garibaldi HSDA | 16.0 | (12.5, 19.4) |
| North Vancouver Island HSDA | 29.6 | (26.4, 32.9) |
| North Zone | 39.2 | (36.8, 41.6) |
| Northeast HSDA | 36.8 | (31.4, 42.1) |
| Northern Interior HSDA | 32.4 | (28.8, 36.0) |
| Northern RHA | 40.3 | (36.7, 44.0) |
| Northwest HSDA | 32.1 | (27.0, 37.3) |
| Northwestern HU | 36.0 | (31.3, 40.7) |
| Okanagan HSDA | 24.9 | (21.7, 28.0) |
| Oxford County HU | 37.2 | (33.5, 40.8) |
| Peel Regional HU | 23.1 | (20.8, 25.4) |
| Perth District HU | 35.0 | (31.2, 38.8) |
| Peterborough County-City HU | 33.7 | (29.0, 38.4) |
| Porcupine HU | 38.8 | (34.0, 43.6) |
| Prairie Mountain Health | 37.0 | (33.6, 40.4) |
| Prairie North RHA | 32.9 | (29.1, 36.6) |
| Prince Albert Parkland RHA | 37.4 | (33.0, 41.8) |
| Prince Edward Island | 32.9 | (30.8, 35.0) |
| Regina Qu'Appelle RHA | 32.2 | (28.8, 35.5) |
| Région de Lanaudière | 28.9 | (25.8, 32.0) |
| Région de Laval | 25.2 | (22.9, 27.5) |
| Région de Montréal | 20.6 | (18.9, 22.3) |
| Région des Laurentides | 24.9 | (22.8, 26.9) |
| Renfrew County and District HU | 34.0 | (30.0, 38.0) |
| Richmond HSDA | 11.9 | (9.8, 14.0) |
| Saguenay - Lac-Saint-Jean | 24.5 | (21.8, 27.2) |
| Saskatoon RHA | 30.0 | (27.2, 32.8) |
| Simcoe Muskoka District HU | 31.7 | (28.3, 35.2) |
| South Vancouver Island HSDA | 19.9 | (17.3, 22.4) |
| South Zone | 32.6 | (30.2, 35.0) |
| Southern Health | 33.9 | (31.0, 36.7) |
| Sudbury and District HU | 33.0 | (29.8, 36.2) |
| Sun Country RHA | 34.9 | (30.7, 39.1) |
| Sunrise RHA | 41.9 | (36.6, 47.1) |
| The District of Algoma HU | 36.3 | (33.2, 39.4) |
| Thompson/Cariboo HSDA | 29.2 | (26.1, 32.3) |
| Thunder Bay District HU | 35.5 | (32.3, 38.7) |
| Timiskaming HU | 41.2 | (36.0, 46.4) |
| Vancouver HSDA | 11.6 | (9.7, 13.4) |
| Waterloo HU | 29.0 | (25.6, 32.3) |
| Wellington-Dufferin-Guelph HU | 29.0 | (26.1, 31.9) |
| Western Regional | 44.9 | (40.9, 48.9) |
| Windsor-Essex County HU | 32.7 | (29.6, 35.8) |
| Winnipeg RHA | 26.5 | (24.4, 28.5) |
| Yukon | 34.4 | (31.7, 37.2) |
| York Regional HU | 19.4 | (17.2, 21.7) |
| Zone 1 (Moncton area) | 37.9 | (34.3, 41.4) |
| Zone 1 - Western | 37.3 | (34.4, 40.3) |
| Zone 2 (Saint John area) | 38.2 | (34.2, 42.1) |
| Zone 2 - Northern | 37.7 | (34.4, 41.0) |
| Zone 3 (Fredericton area) | 37.0 | (33.3, 40.8) |
| Zone 3 - Eastern | 38.7 | (35.4, 42.0) |
| Zone 4 (Edmundston area) | 38.3 | (33.2, 43.5) |
| Zone 4 - Central | 30.5 | (28.1, 32.8) |
| Zone 5 (Campbellton area) | 39.7 | (32.3, 47.1) |
| Zone 6 (Bathurst area) | 33.2 | (29.5, 36.9) |
| Zone 7 (Miramichi area) | 41.2 | (35.4, 47.0) |
Data sources: 2015-2018 Canadian Community Health Survey. |
||
Indigenous Status
The CCHS lacks data collection among First Nations living on-reserve and Inuit living in Inuit Nunangat. Although CCHS provides information for self-identified First Nations living off-reserve, Inuit living outside of Inuit Nunangat, and Métis peoples, this data is known to have limitations. Table A2.16 in Appendix C presents the available CCHS data on Indigenous Peoples. However, it is recognized that the estimates provided do not deliver a full picture and do not address the wider needs for Indigenous peoples, primarily closing health gaps between Indigenous and non-Indigenous persons, as per the Truth and Reconciliation Calls to Action report Footnote 60. This report acknowledges the data gaps associated with obesity in Indigenous Peoples in addition to the lack of data on risk factors such as socioeconomic factors and the effects of colonialization.
Additional information on the prevalence of obesity among Indigenous peoples can be found in the Key Health Inequalities in Canada: A National Portrait – 2018 Footnote 61. This report sought to estimate the scale of inequality between Indigenous Peoples and the non-Indigenous population using data from 1) the 2008-2010 First Nations Regional Longitudinal Health Survey (RHS) for First Nations people living on-reserve and 2) the 2010-2014 CCHS for the non-Indigenous population and for First Nations people living off-reserve, Inuit living outside of Inuit Nunagat and Métis peoples. The First Nation Information Governance Centre (FNIGC) provided the analysis and data on health inequalities with respect to First Nations living on reserve Footnote 61. New data on measured obesity in Indigenous Peoples aged 18 to 79 years old is available in the Health Inequalities Data Tool Footnote 62, which combines the recent CHMS Cycles (2014 to 2019).
Other social determinants of health
The Health Inequalities Data Tool Footnote 62 presents data on over 100 indicators, including obesity, stratified by life course stage and by a range of social and economic characteristics. These socioeconomic determinants include, but are not limited to sexual orientation, cultural/racial background, employment status, occupation, etc. For adults, self-reported and measured obesity are presented by combining CCHS cycles (2015 to 2018) and CHMS cycles (2016 to 2019), respectively. The Health Inequalities Data Tool also provides rate ratios, to show the strength of the association, and rate differences, to show excess risk among groups.
Trends over time
According to a 2016 report from the NCD Risk Factor Collaboration, from 1975 to 2014, the global age-standardized prevalence of adult obesity rose from 3.2% to 10.8% among men and from 6.4% to 14.9% among women Footnote 17Footnote 63. Compared with other OECD nations, the prevalence of obesity in Canada is high, however Canada's rate of growth is one of the slowest among OECD countries Footnote 64.
For the first time since 1978-1979, the 2004 CCHS—Nutrition provided nationally representative BMI estimates using measured height and weight data. Based on these data, a significantly higher percentage of adults were classified in the obesity category in 2004 (23.1%) than in 1978-1979 (14%) Footnote 65.
Trends since 2000
Based on self-reported height and weight
At the time of publication, data from 2021-2022 were not available, as such, trend estimation ranges from 2000-2001 to 2019-2020. Adjusted self-reported data (BMIAdjSR) from the CCHS surveys show that between 2000-2001 and 2019-2020, the prevalence of obesity among adults rose steadily from 20.6% to 28.2% (see Figure 2.8). For more details, see Table A2.8a in Appendix C. Increases were similar among men and women: from 21.2% to 28.7% and from 20.0% to 27.7%, respectively. For both sexes, a significant upward trend was observed for all age groups (see Figure 2.9), household income quintiles (see Figure 2.10), and household education levels (see Figure 2.11). Their corresponding tables (Table A2.9, A2.10 and A2.11) can be found in Appendix C. Canadians aged between 35 and 49 years old show the largest increase in obesity prevalence with a rise of 9.4%: 21.6% in 2000-2001 to 31.0% in 2019-2020. For household income quintiles, the largest increase in the prevalence of self-reported obesity is seen in those in the highest income quintile (19.8% in 2000-2001 to 27.7% in 2019-2020). Regarding the household education levels, obesity prevalence increased by 11% between 2000 and 2020 (21.3% in 2000-2001 versus 32.3% in 2019-2020) for households where the highest level of education was secondary school graduation.

Figure 2.8 - Text description
| Time period | Both Sexes | Males | Females | |||
|---|---|---|---|---|---|---|
| % | 95% |
% | 95% |
% | 95% |
|
| 2000-2001 | 20.6 | (20.2, 21.0) | 21.2 | (20.6, 21.7) | 20.0 | (19.5, 20.5) |
| 2003 | 21.2 | (20.8, 21.6) | 22.2 | (21.7, 22.8) | 20.1 | (19.6, 20.6) |
| 2005 | 21.9 | (21.5, 22.3) | 23.1 | (22.5, 23.6) | 20.7 | (20.2, 21.2) |
| 2007-2008 | 23.2 | (22.8, 23.6) | 24.3 | (23.8, 24.9) | 22.1 | (21.6, 22.6) |
| 2009-2010 | 23.8 | (23.4, 24.3) | 25.2 | (24.6, 25.9) | 22.4 | (21.8, 23.0) |
| 2011-2012 | 24.8 | (24.3, 25.2) | 26.0 | (25.3, 26.6) | 23.6 | (22.9, 24.2) |
| 2013-2014 | 26.1 | (25.6, 26.6) | 27.9 | (27.1, 28.6) | 24.4 | (23.7, 25.0) |
| 2015-2016 | 26.4 | (26.0, 26.9) | 28.1 | (27.4, 28.8) | 24.8 | (24.1, 25.4) |
| 2017-2018 | 26.9 | (26.4, 27.4) | 27.9 | (27.2, 28.6) | 25.9 | (25.3, 26.6) |
| 2019-2020 | 28.2 | (27.7, 28.7) | 28.7 | (28.0, 29.5) | 27.7 | (26.9, 28.4) |
Data sources: 2000-2001 to 2019-2020 Canadian Community Health Survey (share files). |
||||||
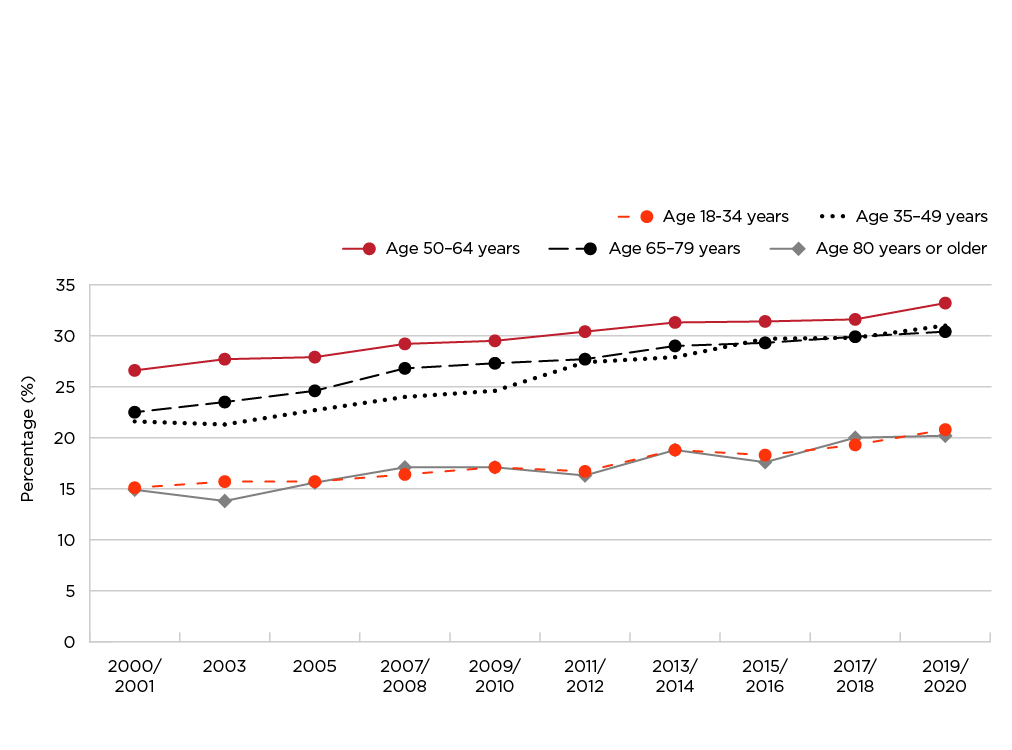
Figure 2.9 - Text description
| Time period | Both Sexes | |
|---|---|---|
| % | 95% |
|
| Aged 18 to 34 years | ||
| 2000-2001 | 15.1 | (14.5, 15.7) |
| 2003 | 15.7 | (15.1, 16.3) |
| 2005 | 15.7 | (15.2, 16.3) |
| 2007-2008 | 16.4 | (15.7, 17.0) |
| 2009-2010 | 17.1 | (16.3, 17.9) |
| 2011-2012 | 16.7 | (15.9, 17.5) |
| 2013-2014 | 18.8 | (18.0, 19.7) |
| 2015-2016 | 18.3 | (17.5, 19.2) |
| 2017-2018 | 19.3 | (18.4, 20.1) |
| 2019-2020 | 20.8 | (19.7, 21.9) |
| Aged 35 to 49 years | ||
| 2000-2001 | 21.6 | (20.9, 22.2) |
| 2003 | 21.3 | (20.6, 22.0) |
| 2005 | 22.7 | (22.0, 23.5) |
| 2007-2008 | 24.0 | (23.2, 24.8) |
| 2009-2010 | 24.6 | (23.7, 25.5) |
| 2011-2012 | 27.4 | (26.4, 28.4) |
| 2013-2014 | 27.9 | (26.7, 29.0) |
| 2015-2016 | 29.7 | (28.6, 30.8) |
| 2017-2018 | 29.8 | (28.7, 30.9) |
| 2019-2020 | 31.0 | (29.8, 32.2) |
| Aged 50 to 64 years | ||
| 2000-2001 | 26.6 | (25.7, 27.4) |
| 2003 | 27.7 | (26.9, 28.6) |
| 2005 | 27.9 | (27.0, 28.7) |
| 2007-2008 | 29.2 | (28.3, 30.0) |
| 2009-2010 | 29.5 | (28.4, 30.5) |
| 2011-2012 | 30.4 | (29.4, 31.5) |
| 2013-2014 | 31.3 | (30.4, 32.3) |
| 2015-2016 | 31.4 | (30.4, 32.3) |
| 2017-2018 | 31.6 | (30.6, 32.6) |
| 2019-2020 | 33.2 | (32.2, 34.3) |
| Aged 65 to 79 years | ||
| 2000-2001 | 22.5 | (21.6, 23.5) |
| 2003 | 23.5 | (22.6, 24.5) |
| 2005 | 24.6 | (23.7, 25.4) |
| 2007-2008 | 26.8 | (25.8, 27.8) |
| 2009-2010 | 27.3 | (26.4, 28.2) |
| 2011-2012 | 27.7 | (26.7, 28.7) |
| 2013-2014 | 29.0 | (28.1, 30.0) |
| 2015-2016 | 29.3 | (28.3, 30.4) |
| 2017-2018 | 29.9 | (28.9, 30.8) |
| 2019-2020 | 30.4 | (29.5, 31.3) |
| Aged 80 years or older | ||
| 2000-2001 | 14.9 | (13.3, 16.4) |
| 2003 | 13.8 | (12.6, 15.1) |
| 2005 | 15.6 | (14.1, 17.1) |
| 2007-2008 | 17.1 | (15.6, 18.5) |
| 2009-2010 | 17.1 | (15.7, 18.6) |
| 2011-2012 | 16.3 | (14.9, 17.7) |
| 2013-2014 | 18.8 | (17.3, 20.3) |
| 2015-2016 | 17.6 | (16.2, 19.0) |
| 2017-2018 | 20.0 | (18.4, 21.5) |
| 2019-2020 | 20.2 | (18.6, 21.8) |
Data sources: 2000-2001 to 2019-2020 Canadian Community Health Survey (share files). |
||
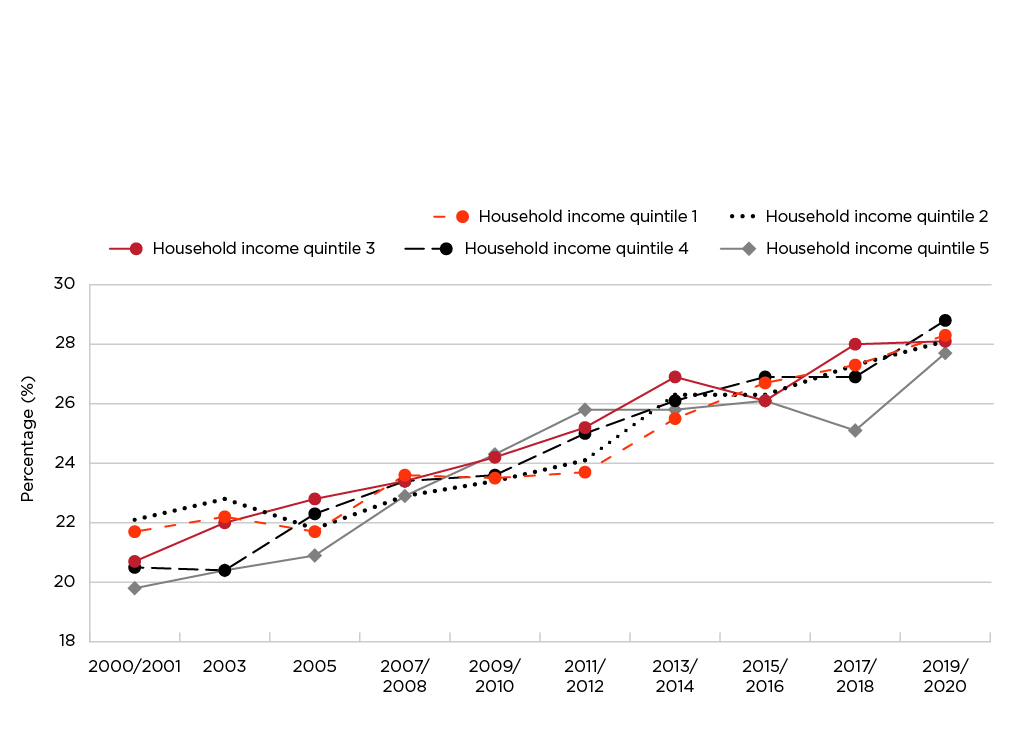
Figure 2.10 - Text description
| Time period | Both Sexes | |
|---|---|---|
| % | 95% |
|
| Household income quintile 1 | ||
| 2000-2001 | 21.7 | (20.9, 22.6) |
| 2003 | 22.2 | (21.3, 23.2) |
| 2005 | 21.7 | (20.9, 22.5) |
| 2007-2008 | 23.6 | (22.5, 24.6) |
| 2009-2010 | 23.5 | (22.5, 24.6) |
| 2011-2012 | 23.7 | (22.7, 24.7) |
| 2013-2014 | 25.5 | (24.4, 26.7) |
| 2015-2016 | 26.7 | (25.6, 27.9) |
| 2017-2018 | 27.3 | (26.3, 28.4) |
| 2019-2020 | 28.3 | (27.0, 29.5) |
| Household income quintile 2 | ||
| 2000-2001 | 22.1 | (21.3, 23.0) |
| 2003 | 22.8 | (21.8, 23.8) |
| 2005 | 21.8 | (20.9, 22.6) |
| 2007-2008 | 22.9 | (22.0, 23.8) |
| 2009-2010 | 23.4 | (22.3, 24.4) |
| 2011-2012 | 24.1 | (23.0, 25.2) |
| 2013-2014 | 26.3 | (25.2, 27.4) |
| 2015-2016 | 26.3 | (25.2, 27.4) |
| 2017-2018 | 27.3 | (26.2, 28.4) |
| 2019-2020 | 28.1 | (26.8, 29.5) |
| Household income quintile 3 | ||
| 2000-2001 | 20.7 | (19.8, 21.6) |
| 2003 | 22.0 | (21.1, 22.9) |
| 2005 | 22.8 | (21.9, 23.6) |
| 2007-2008 | 23.4 | (22.5, 24.2) |
| 2009-2010 | 24.2 | (23.2, 25.3) |
| 2011-2012 | 25.2 | (24.1, 26.3) |
| 2013-2014 | 26.9 | (25.8, 28.0) |
| 2015-2016 | 26.1 | (25.0, 27.2) |
| 2017-2018 | 28.0 | (26.9, 29.1) |
| 2019-2020 | 28.1 | (26.8, 29.4) |
| Household income quintile 4 | ||
| 2000-2001 | 20.5 | (19.7, 21.4) |
| 2003 | 20.4 | (19.5, 21.2) |
| 2005 | 22.3 | (21.4, 23.3) |
| 2007-2008 | 23.4 | (22.5, 24.3) |
| 2009-2010 | 23.6 | (22.7, 24.6) |
| 2011-2012 | 25.0 | (23.9, 26.1) |
| 2013-2014 | 26.1 | (25.1, 27.2) |
| 2015-2016 | 26.9 | (25.9, 28.0) |
| 2017-2018 | 26.9 | (25.9, 27.9) |
| 2019-2020 | 28.8 | (27.5, 30.0) |
| Household income quintile 5 | ||
| 2000-2001 | 19.8 | (19.0, 20.6) |
| 2003 | 20.4 | (19.5, 21.2) |
| 2005 | 20.9 | (20.1, 21.7) |
| 2007-2008 | 22.9 | (22.0, 23.7) |
| 2009-2010 | 24.3 | (23.3, 25.4) |
| 2011-2012 | 25.8 | (24.7, 26.9) |
| 2013-2014 | 25.8 | (24.8, 26.8) |
| 2015-2016 | 26.1 | (25.1, 27.1) |
| 2017-2018 | 25.1 | (24.1, 26.1) |
| 2019-2020 | 27.7 | (26.5, 28.9) |
Data sources: 2000-2001 to 2019-2020 Canadian Community Health Survey (share files). |
||

Figure 2.11 - Text description
| Time period | Both Sexes | |
|---|---|---|
| % | 95% |
|
| Less than secondary school graduation | ||
| 2000-2001 | 26.0 | (25.1, 26.9) |
| 2003 | 27.9 | (26.7, 29.0) |
| 2005 | 28.7 | (27.6, 29.8) |
| 2007-2008 | 29.3 | (27.9, 30.6) |
| 2009-2010 | 29.5 | (28.1, 30.9) |
| 2011-2012 | 31.7 | (30.0, 33.4) |
| 2013-2014 | 31.0 | (29.5, 32.6) |
| 2015-2016 | 32.8 | (31.3, 34.4) |
| 2017-2018 | 33.3 | (31.6, 34.9) |
| 2019-2020 | 33.6 | (31.7, 35.5) |
| Secondary school graduation | ||
| 2000-2001 | 21.3 | (20.5, 22.0) |
| 2003 | 23.3 | (22.4, 24.2) |
| 2005 | 25.2 | (24.3, 26.1) |
| 2007-2008 | 25.5 | (24.5, 26.5) |
| 2009-2010 | 26.5 | (25.3, 27.8) |
| 2011-2012 | 28.0 | (26.7, 29.3) |
| 2013-2014 | 30.2 | (29.0, 31.4) |
| 2015-2016 | 30.8 | (29.6, 32.0) |
| 2017-2018 | 30.3 | (29.1, 31.5) |
| 2019-2020 | 32.3 | (30.9, 33.7) |
| Post-secondary certificate, diploma or university degree | ||
| 2000-2001 | 19.4 | (18.9, 19.8) |
| 2003 | 19.8 | (19.3, 20.2) |
| 2005 | 20.7 | (20.2, 21.2) |
| 2007-2008 | 22.4 | (21.9, 22.8) |
| 2009-2010 | 22.8 | (22.2, 23.3) |
| 2011-2012 | 24.0 | (23.4, 24.6) |
| 2013-2014 | 24.9 | (24.3, 25.5) |
| 2015-2016 | 25.2 | (24.6, 25.7) |
| 2017-2018 | 25.8 | (25.2, 26.4) |
| 2019-2020 | 27.3 | (26.6, 27.9) |
Data sources: 2000-2001 to 2019-2020 Canadian Community Health Survey (share files). |
||
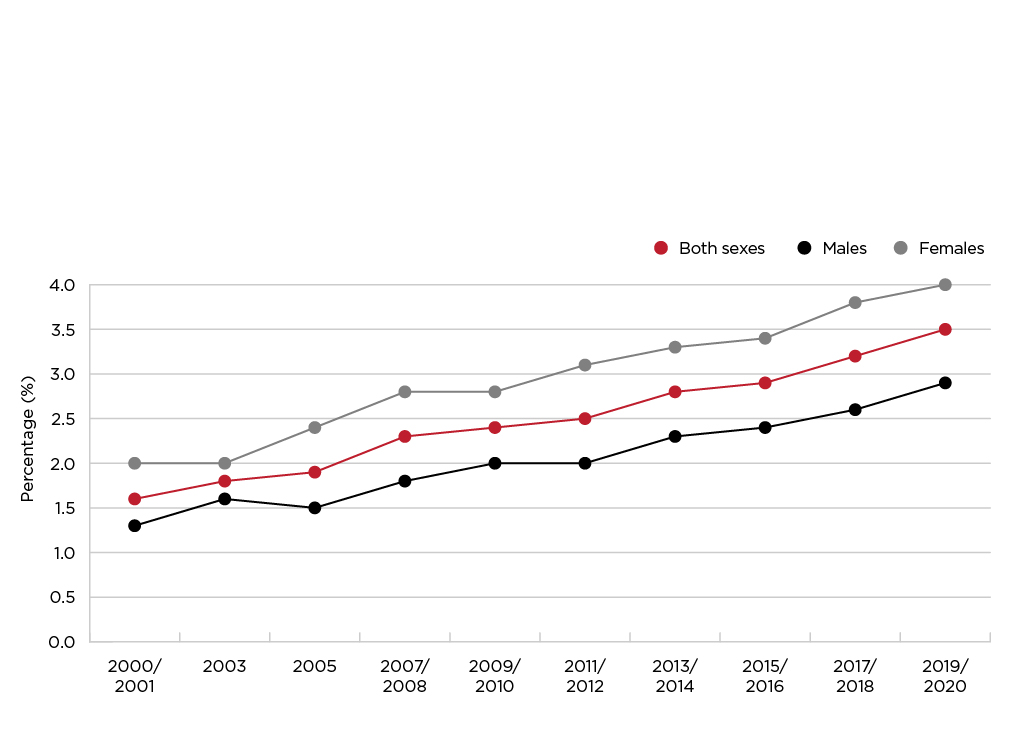
Figure 2.12 - Text description
| Time period | Both Sexes | Males | Females | |||
|---|---|---|---|---|---|---|
| % | 95% |
% | 95% |
% | 95% |
|
| Adults aged 18 years or older | ||||||
| 2000-2001 | 1.6 | (1.5, 1.7) | 1.3 | (1.1, 1.4) | 2.0 | (1.8, 2.1) |
| 2003 | 1.8 | (1.7, 1.9) | 1.6 | (1.4, 1.8) | 2.0 | (1.9, 2.2) |
| 2005 | 1.9 | (1.8, 2.1) | 1.5 | (1.4, 1.7) | 2.4 | (2.2, 2.5) |
| 2007-2008 | 2.3 | (2.2, 2.4) | 1.8 | (1.6, 2.0) | 2.8 | (2.6, 3.0) |
| 2009-2010 | 2.4 | (2.2, 2.5) | 2.0 | (1.8, 2.2) | 2.8 | (2.6, 3.0) |
| 2011-2012 | 2.5 | (2.4, 2.7) | 2.0 | (1.8, 2.2) | 3.1 | (2.8, 3.3) |
| 2013-2014 | 2.8 | (2.6, 3.0) | 2.3 | (2.1, 2.6) | 3.3 | (3.0, 3.5) |
| 2015-2016 | 2.9 | (2.7, 3.0) | 2.4 | (2.2, 2.6) | 3.4 | (3.1, 3.6) |
| 2017-2018 | 3.2 | (3.0, 3.4) | 2.6 | (2.4, 2.9) | 3.8 | (3.6, 4.1) |
| 2019-2020 | 3.5 | (3.2, 3.7) | 2.9 | (2.6, 3.2) | 4.0 | (3.6, 4.3) |
Data sources: 2000-2001 to 2019-2020 Canadian Community Health Survey (share files). |
||||||
Furthermore, the percentage of adults categorised in obesity class III doubled over this period, (see Figure 2.12, for additional information, see Table A2.12a in Appendix C) rising from 1.3% (in 2000-2001) to 2.9% (in 2019-2020) for men, and from 2.0% to 4.0% for women. Age standardized prevalence estimates of obesity and obesity class III were similar to crude rates (see Tables A2.8b and A2.12b in Appendix C).
Based on physical measurements
Trends in obesity based on physical measurements come from the following surveys: the CCHS—Nutrition (2004 and 2015); the CHMS; and the 2005 and 2008 CCHS (see Section 4 Data sources and methods).
Among men aged 18 to 79 years, the prevalence of measured obesity varied depending on the data source: 23.1% in the 2004-CCHS-Nutrition, 28.8% in the 2015-CCHS-Nutrition and 27.3% in the combined 2014-2019-CHMS (see Figure 2.13). Among women, estimates were not statistically different. For additional details, see Table A2.13a in Appendix C.

Figure 2.13 - Text description
| Time period | Both Sexes | Males | Females | |||
|---|---|---|---|---|---|---|
| % | 95% |
% | 95% |
% | 95% |
|
| Adults aged 18 to 79 years | ||||||
| 2004 | 23.2 | (21.7, 24.7) | 23.1 | (20.8, 25.4) | 23.3 | (21.3, 25.3) |
| 2005 | 24.6 | (22.3, 27.0) | 25.9 | (22.7, 29.2) | 23.3 | (20.4, 26.2) |
| 2008 | 25.3 | (23.4, 27.2) | 26.4 | (23.7, 29.1) | 24.2 | (21.5, 26.8) |
| 2007-2009/ 2009-2011/ 2012-2013 | 25.6 | (23.3, 27.8) | 26.0 | (23.5, 28.6) | 25.1 | (22.2, 28.0) |
| 2015 | 27.0 Footnote a | (25.2, 28.8) | 28.8 Footnote a | (26.1, 31.4) | 25.2 | (22.9, 27.5) |
| 2014-2015/ 2016-2017/ 2018-2019 | 26.5 Footnote a | (23.6, 29.3) | 27.3 Footnote a | (24.2, 30.5) | 25.5 | (22.3, 28.8) |
Data sources: 2004 and 2015 Canadian Community Health Survey—Nutrition (share files); 2005 and 2008 Canadian Community Health Survey (share files); 2007-2009/2009-2011/2012-2013/2014-2015/2016-2017/2018-2019 Canadian Health Measures Survey (Cycles 1 to 6). Footnotes
|
||||||
For obesity class III, the combined 2014-2019 CHMS estimate for men (3.2%) is not significantly different from the estimates from the 2015 CCHS‒Nutrition (2.0%), and marginally different from the 2008 CCHS (1.3%) (see Figure 2.14). Among women, the prevalence of obesity class III were similar across the different time periods from 2004 to 2019. For additional details, see Table A2.14a in Appendix C.
Age standardized prevalence estimates of obesity and obesity class III were similar to crude rates when examined (see Tables A2.13b and A2.14b in Appendix C).
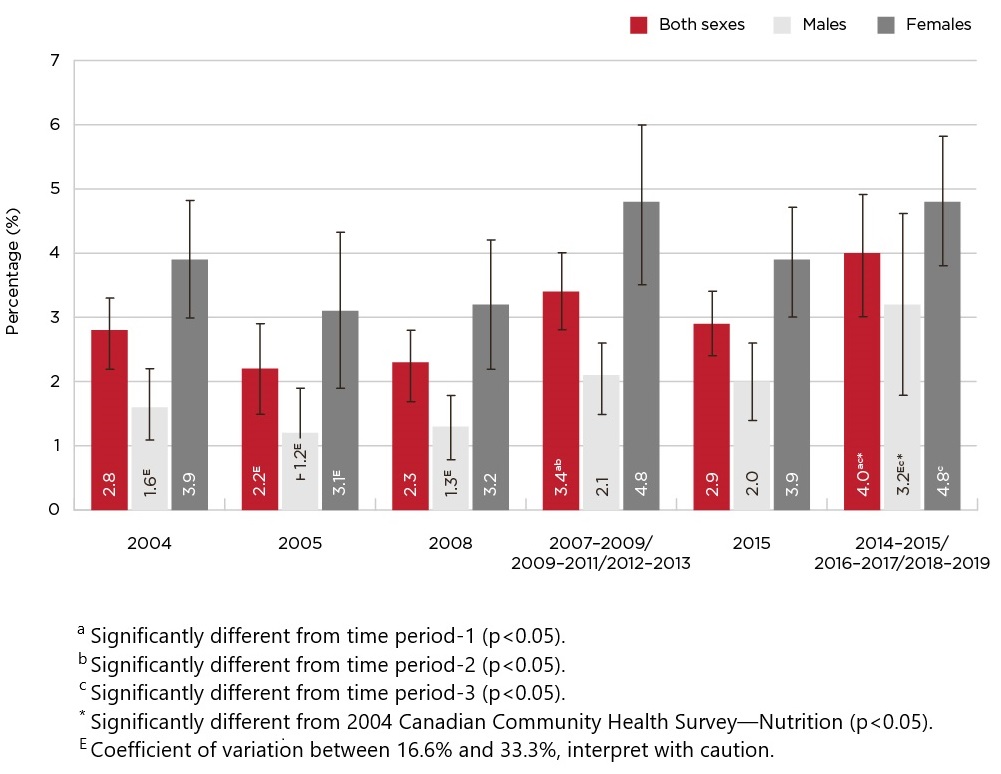
Figure 2.14 - Text description
| Time period | Both Sexes | Males | Females | |||
|---|---|---|---|---|---|---|
| % | 95% |
% | 95% |
% | 95% |
|
| Adults aged 18 to 79 years | ||||||
| 2004 | 2.8 | (2.2, 3.3) | 1.6 Footnote E | (1.1, 2.2) | 3.9 | (3.0, 4.8) |
| 2005 | 2.2 Footnote E | (1.5, 2.9) | 1.2 Footnote E | (0.5, 1.9) | 3.1 Footnote E | (1.9, 4.3) |
| 2008 | 2.3 | (1.7, 2.8) | 1.3 Footnote E | (0.8, 1.8) | 3.2 | (2.2, 4.2) |
| 2007-2009/ 2009-2011/ 2012-2013 | 3.4 Footnote aFootnote b | (2.8, 4.0) | 2.1 | (1.5, 2.6) | 4.8 | (3.5, 6.0) |
| 2015 | 2.9 | (2.4, 3.4) | 2.0 | (1.4, 2.6) | 3.9 | (3.0, 4.7) |
| 2014-2015/ 2016-2017/ 2018-2019 | 4.0 Footnote aFootnote cFootnote d | (3.0, 4.9) | 3.2 Footnote EFootnote cFootnote d | (1.8, 4.6) | 4.8 Footnote c | (3.8, 5.8) |
Data sources: 2004 and 2015 Canadian Community Health Survey—Nutrition (share files); 2005 and 2008 Canadian Community Health Survey (share files); 2007-2009/2009-2011/2012-2013/2014-2015/2016-2017/2018-2019 Canadian Health Measures Survey (Cycles 1 to 6). Footnotes
|
||||||
Projections
Forecasting the trajectory of the prevalence of obesity can help in planning and evaluating public health strategies. Statistics Canada's microsimulation Population Health Model (POHEM) uses multiple data sources to simulate the health status of the population over time, by combining the results of individual life course simulations for a large sample Footnote 66. See Section 4 - Data sources and methods for more information regarding POHEM. The model was created to predict the prevalence of obesity, in a way that accounts for interconnected factors such as socio-demographics and health behaviours (smoking, physical activity levels, chronic diseases) that may be associated with body weight Footnote 67. POHEM simulated the annual prevalence of obesity among adults aged 18 to 79 years, by sex, over two periods: 2001-to-2018, which was retrospectively compared with observed estimates, and 2018-to-2035, which was used to project future patterns (see Figure 2.15).
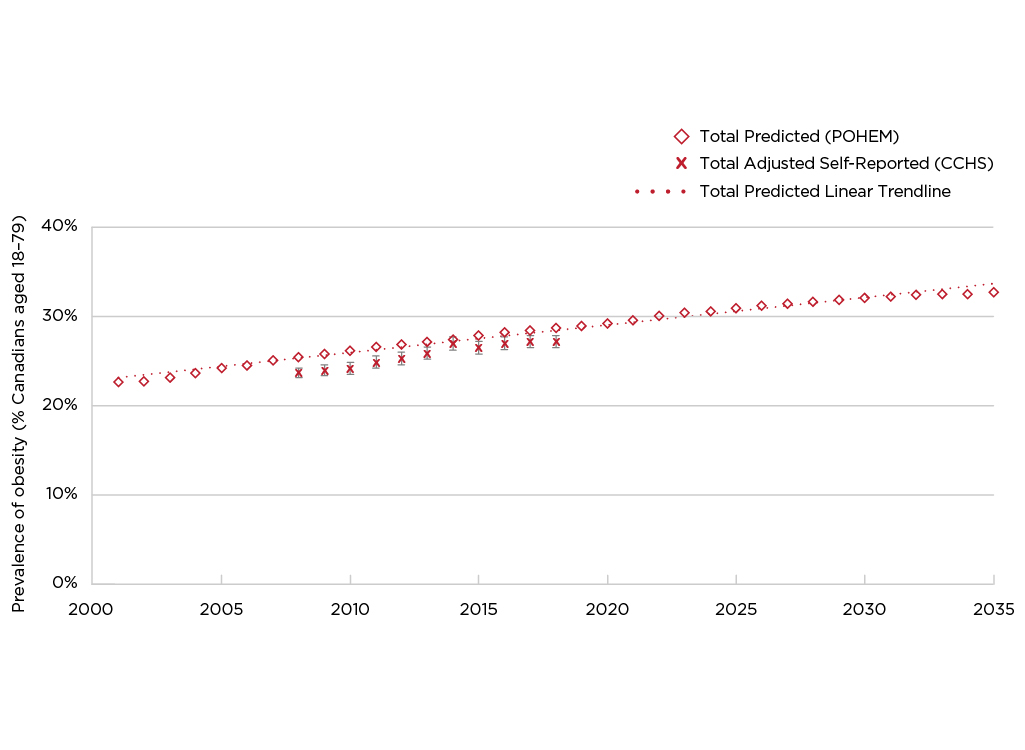
Figure 2.15 - Text description
Year |
Total Predicted % (POHEM) | Total Adjusted Self-Reported % (CCHS) | 95% Confidence Interval (CCHS) |
|---|---|---|---|
| 2001 | 22.69 | ||
| 2002 | 22.74 | ||
| 2003 | 23.16 | ||
| 2004 | 23.64 | ||
| 2005 | 24.26 | ||
| 2006 | 24.55 | ||
| 2007 | 25.08 | ||
| 2008 | 25.44 | 23.7 | (23.2, 24.3) |
| 2009 | 25.81 | 24.0 | (23.4, 24.6) |
| 2010 | 26.14 | 24.2 | (23.5, 24.8) |
| 2011 | 26.60 | 24.9 | (24.2, 25.6) |
| 2012 | 26.89 | 25.3 | (24.6, 26.0) |
| 2013 | 27.15 | 25.9 | (25.2, 26.6) |
| 2014 | 27.44 | 27.0 | (26.2, 27.7) |
| 2015 | 27.88 | 26.5 | (25.8, 27.2) |
| 2016 | 28.22 | 27.0 | (26.3, 27.7) |
| 2017 | 28.47 | 27.2 | (26.5, 27.9) |
| 2018 | 28.69 | 27.2 | (26.5, 27.9) |
| 2019 | 28.97 | ||
| 2020 | 29.26 | ||
| 2021 | 29.59 | ||
| 2022 | 30.07 | ||
| 2023 | 30.42 | ||
| 2024 | 30.56 | ||
| 2025 | 30.91 | ||
| 2026 | 31.20 | ||
| 2027 | 31.46 | ||
| 2028 | 31.67 | ||
| 2029 | 31.83 | ||
| 2030 | 32.05 | ||
| 2031 | 32.22 | ||
| 2032 | 32.46 | ||
| 2033 | 32.48 | ||
| 2034 | 32.53 | ||
| 2035 | 32.69 | ||
Data sources: POHEM projections for 2001 through 2035; 2008 to 2018 Canadian Community Health Survey (CCHS) (share files). |
|||
Note: POHEM projections for BMI account for age, physical activity, and smoking. The model does not account for diet quality or potential impacts of the COVID-19 pandemic.
POHEM results showed that during the 2001-to-2018 period, the prevalence of obesity in the total adult population rose from 22.7% to 28.7%, an average annual rate of 1.5%. These simulated numbers aligned relatively well with those derived from survey data (see Table A2.8a).
The predicted 2018-to-2035 time-series shows further increases in the prevalence of obesity among adults, but at a much slower annual pace: 0.8% rather than 1.5%. POHEM predictions do not account for all factors associated with BMI, diet being a notable exclusion Footnote 68, or consider the potential impacts of the COVID-19 pandemic. These are important limitations of the model given both the significant influence of diet on body weight and signals that the pandemic may have had lasting effects on behaviours and other factors related to body weight.
Obesity and the COVID-19 pandemic
On March 11th, 2020, COVID-19 was declared a pandemic. Initially, not a lot was known on this virus, but over the past few years, research has helped paint a picture of the association between COVID-19 and obesity.
Foremost, research has demonstrated that obesity is associated with increased severity of COVID-19 Footnote 69Footnote 70Footnote 71Footnote 72. For those living with obesity, the risk of COVID-19 infection and the severity of symptoms are increased Footnote 70. Obesity has been linked to impaired immune function and to a decrease in lung capacity and reserve, which result in difficulties breathing and the increased burden of COVID-19 observed among those living with obesity Footnote 71Footnote 72. One review differentiated between overweight and obesity: the first increases the risk of COVID-19-related hospitalisations, but not death; while the second would appear to increase the risk of both COVID-19-related hospitalisations and death Footnote 71. However, whether obesity significantly increases mortality remains a debate across studies Footnote 73.
Many environmental and social factors, which were impacted by COVID-19 related lockdowns and regulations, are known to be associated with obesity Footnote 70Footnote 74. For example, social distancing measures and lockdowns have been associated with reduced levels of daily physical activity, increased time spent sedentary, and contributed to feelings of stress and anxiety Footnote 75Footnote 76. Declines in mental health during the COVID-19 pandemic may have led to weight gain by disrupting sleep habits, releasing stress hormones associated with weight gain, changing dietary patterns, and delaying care seeking Footnote 75. Research to understand these wider health impacts of the pandemic is ongoing.
Data is still lacking to say with certainty that the COVID-19 pandemic has increased obesity prevalence, but it certainly exacerbated the risk factors of obesity Footnote 74Footnote 75. As outlined in the section above, the prevalence of obesity in Canada has been increasing steadily since 2000-2001. Data from 2021 appear to be higher than previous years, but additional data is required to determine if the increase is larger than would have been expected based on recent trends. Ongoing surveillance will help determine the trends of obesity in the context of a pandemic in the long term.
Section 3: Child and youth obesity
Key points
- In 2015, 12.4% of Canadian children and youth aged 5 to 17 years had a BMI that placed them in the obesity category, and another 19.4% were in the overweight range. As a result, close to 1 out of 3 children and youth (31.8%) were classified as having excess weight.
- A larger percentage of boys than girls were in the obesity category (14.9% versus 9.9%), while similar percentages of boys and girls were classified in the overweight range (19.6% and 19.1%).
- The prevalence of combined overweight/obesity was higher at ages 12 to 17 years than at ages 5 to 11 years (35.6% versus 28.4%).
- Among children aged 2 to 4 years, the prevalence of obesity was 3.4%. An additional 4.6% were classified as overweight, and 26.8%, "at risk of overweight."
- In 2004, the prevalence of obesity among children and youth (12.9%) was double the rate observed in 1978-1979. However, there is an indication of child and youth obesity and overweight/obesity rates plateauing in recent decades, with some exceptions.
- Among 5- to 11-year-olds, both obesity and combined overweight/obesity prevalence in 2014-2019 were lower than in 2004 (13.3% versus 10.4%, and 35.9% versus 26.6%).
- Among 12- to 17-year-olds, no significant differences in obesity or combined overweight/obesity were observed.
- Among girls (but not boys) aged 2 to 4 years, the prevalence of combined overweight/obesity decreased between 2004 and 2015 (11.1% versus 4.1%).
Box 6. BMI Estimates in Canadian Children and Youth
Accurate estimates of BMI among Canadian children and youth rely on direct measurements of height and weight. The use of self- or parent-reported data can result in significant misclassification Footnote 55. Studies based on adolescents and adults have found that the use of self-reported height and weight to calculate BMI yields a lower prevalence of obesity compared to estimates based on measured data Footnote 55. To explore this finding, data from the 2007 to 2009 CHMS where parent-reported height and weight of children aged 6 to 11 (n=854) was analysed.
On average, parents underestimated the height (by 3.3 cm) and weight (by 1.1 kg) of their children. Estimates of the prevalence of obesity were significantly higher when based on parent-reported versus measured values for children aged 6 to 8; while the two collection methods yielded similar estimates of obesity for children aged 9 to 11. For children in both age groups, misclassification errors for BMI categories were substantial when based on parent-reported values. It consequently weakened associations between obesity and health indicators such as aerobic fitness and systolic blood pressure. The variance explained by factors associated with the bias in parent-reported height and weight was small, particularly for height. The use of correction equations based on variables associated with the bias resulted in a very modest reduction in misclassification errors. Bias associated with parental reports of children's height and weight results in misclassification errors for obesity that affect relationships with other variables. Efforts to establish correction equations to adjust for this bias were unsuccessful. Direct measures are required to accurately calculate obesity estimates and their relationships with health indicators in children Footnote 55 (See Appendix B: Correction equations for adjusting BMI in the CCHS based on self-/parent-reported height and weight).
Reminder: For children and youth, measured height and weight is used to calculate BMI (versus adults where self-reported data was used).
Box 7. Data sources
Two recent national surveys collected measured height and weight data for children and youth:
- The CHMS measures the height and weight of 3- to 17-year-olds. The most recent cycles were conducted in 2014-2015, 2016-2017, and 2018-2019.
- The CCHS–Nutrition, which took place in 2004 and 2015, included measured height and weight for 2- to 17-year-olds.
Estimates of obesity among children and youth aged 5 to 17 years can be calculated with data from either survey (see Table A3.1a and A3.1b in Appendix C). However, for children aged 3 to 4 years, CHMS sample sizes are too small to produce reliable estimates of overweight and obesity; therefore data for this age group are available only from the CCHS‒Nutrition. For children and youth aged 5 to 17 years, the two surveys yield similar prevalence's of obesity and of combined overweight/obesity (see Table A3.1a and A3.1b in Appendix C). Prevalence estimates of normal weight differed significantly between the CHMS and CCHS-Nutrition cycle. For consistency with the estimates for younger children, and since CCHS‒Nutrition estimates have higher reliability (lower variance), most data in this chapter are from that survey.
Prevalence of obesity and overweight among children and youth
In 2015, 12.4% of Canadian children and youth aged 5 to 17 years had a BMI that placed them in the obesity category, and another 19.4% were classified as overweight (see Figure 3.1). As a result, 31.8% of children and youth had excess weight. Boys were more likely than girls to be in the obesity category (14.9% versus 9.9%), but similar percentages of boys and girls were classified in the overweight range (19.6% and 19.1%, respectively).

Figure 3.1 - Text description
| Measured BMI category (based on World Health Organization BMI cut-points) | Both Sexes | Males | Females | |||
|---|---|---|---|---|---|---|
| % | 95% Confidence Interval | % | 95% Confidence Interval | % | 95% Confidence Interval | |
| Age 5 to 17 years | ||||||
| Thin | 2.7 Footnote E | (1.8, 3.7) | 2.8 Footnote E | (1.5, 4.2) | 2.6 Footnote E | (1.2, 4.0) |
| Normal weight | 65.5 | (63.1, 68.0) | 62.7 | (59.2, 66.2) | 68.4 Footnote b | (64.8, 72.0) |
| Overweight | 19.4 | (17.2, 21.5) | 19.6 | (16.4, 22.8) | 19.1 | (16.2, 22.1) |
| Obesity | 12.4 | (10.7, 14.1) | 14.9 | (12.1, 17.6) | 9.9 Footnote b | (7.8, 12.0) |
| Overweight/Obesity | 31.8 | (29.4, 34.1) | 34.5 | (30.9, 38.0) | 29.0 Footnote b | (25.5, 32.5) |
Data source: 2015 Canadian Community Health Survey—Nutrition (share file). Footnotes
|
||||||
The prevalence of combined overweight/obesity was higher at ages 12 to 17 years than at ages 5 to 11 years (35.6% versus 28.4%). The difference was statistically significant among girls (34.0% versus 24.6%), but not among boys (37.1% versus 32.1%).
At ages 2 to 4 years, the prevalence of obesity was 3.4%. An additional 4.6% were classified as overweight, and 26.8%, "at risk of overweight." The prevalence of combined overweight/obesity was significantly higher among boys than girls: 12.6% versus 4.1%.
Household income and education
For children and youth aged 5 to 17 years, the association between household income quintile and prevalence of obesity was not as clear as in adults, and no differences can be observed (see Table 3a).
| Household income quintile | Both Sexes | Males | Females | |||
|---|---|---|---|---|---|---|
| % | 95% Confidence Interval | % | 95% Confidence Interval | % | 95% Confidence Interval | |
| Obesity | ||||||
| Total ages 5-17 | 12.4 | (10.7, 14.1) | 14.9 | (12.1, 17.6) | 9.9 Footnote a | (7.8, 12.0) |
| Quintile 1 (Lowest) | 13.5 | (9.4, 17.6) | 17.7 Footnote E | (11.1, 24.2) | 9.7 Footnote E | (4.7, 14.6) |
| Quintile 2 | 16.0 Footnote b | (11.9, 20.1) | 17.8 Footnote E | (11.6, 24.0) | 14.2 Footnote EFootnote b | (8.7, 19.6) |
| Quintile 3 | 10.1 | (7.0, 13.1) | 11.4 Footnote E | (6.6, 16.3) | 8.6 Footnote E | (4.9, 12.2) |
| Quintile 4 | 12.6 | (8.6, 16.6) | 15.1 Footnote E | (9.2, 21.1) | 9.6 Footnote E | (4.9, 14.4) |
| Quintile 5 (reference) | 9.5 Footnote E | (5.7, 13.2) | 12.1 Footnote E | (5.5, 18.6) | 7.0 Footnote E | (3.5, 10.4) |
| Overweight/Obesity | ||||||
| Total ages 5-17 | 31.8 | (29.4, 34.1) | 34.5 | (30.9, 38.0) | 29.0 Footnote a | (25.5, 32.5) |
| Quintile 1 (Lowest) | 31.8 | (26.4, 37.2) | 33.7 | (25.8, 41.7) | 30.0 | (21.8, 38.3) |
| Quintile 2 | 38.6 Footnote b | (32.8, 44.4) | 41.1 | (33.2, 49.1) | 36.0 Footnote b | (27.7, 44.3) |
| Quintile 3 | 31.1 | (26.5, 35.7) | 33.7 | (26.6, 40.8) | 28.2 | (21.7, 34.7) |
| Quintile 4 | 28.2 | (22.9, 33.5) | 31.1 | (23.7, 38.5) | 24.7 | (17.5, 31.9) |
| Quintile 5 (reference) | 28.5 | (22.8, 34.2) | 32.4 | (24.1, 40.7) | 24.7 | (17.5, 32.0) |
Data source: 2015 Canadian Community Health Survey—Nutrition (share file).
|
||||||
Among girls, the prevalence of obesity was significantly lower in households where the highest level of education was postsecondary graduation, compared with girls in households where the highest level of education was secondary graduation or less: 8.3% versus 17.2% (see Table 3b). For boys, the distribution of measured BMI was similar across the different levels of household education. When comparing boys to girls, the latter had significantly lower prevalence of obesity, as well as obesity and overweight combined, when they came from households where the highest level of education for the parents was postsecondary graduation (8.3% versus 14.3%, and 26.9% versus 33.4%, respectively).
| Highest level of education in the household | Both Sexes | Males | Females | |||
|---|---|---|---|---|---|---|
| % | 95% Confidence Interval | % | 95% Confidence Interval | % | 95% Confidence Interval | |
| Obesity | ||||||
| Total ages 5-17 | 12.4 | (10.7, 14.1) | 14.9 | (12.1, 17.6) | 9.9 Footnote a | (7.8, 12.0) |
| Secondary school graduation or less | 17.6 Footnote b | (12.6, 22.6) | 18.0 Footnote E | (11.6, 24.3) | 17.2 Footnote EFootnote b | (10.4, 24.1) |
| Post-secondary certificate, diploma or university degree (reference) | 11.4 | (9.6, 13.1) | 14.3 | (11.3, 17.2) | 8.3 Footnote a | (6.3, 10.3) |
| Overweight/Obesity | ||||||
| Total ages 5-17 | 31.8 | (29.4, 34.1) | 34.5 | (30.9, 38.0) | 29.0 | (25.5, 32.5) |
| Secondary school graduation or less | 39.6 Footnote b | (32.9, 46.2) | 39.9 | (31.0, 48.8) | 39.2 Footnote b | (29.2, 49.2) |
| Post-secondary certificate, diploma or university degree (reference) | 30.2 | (27.7, 32.7) | 33.4 | (29.5, 37.3) | 26.9 Footnote a | (23.4, 30.4) |
Data source: 2015 Canadian Community Health Survey—Nutrition (share file). Footnotes
|
||||||
Regional variations
In 2015, the prevalence of obesity and combined overweight/obesity among children and youth was generally similar by province (see Table 3c). The exception was Newfoundland and Labrador, where rates of combined overweight/obesity for children and youth exceeded rates for Canada overall (46.1% versus 31.8%).
Province |
Both Sexes |
Males |
Females |
|||
|---|---|---|---|---|---|---|
% |
95% |
% |
95% |
% |
95% |
|
Obesity |
||||||
Total ages 5-17 |
12.4 |
(10.7, 14.1) |
14.9 |
(12.1, 17.6) |
9.9 Footnote a |
(7.8, 12.0) |
Newfoundland and Labrador |
22.0 Footnote a |
(15.5, 28.5) |
23.6 Footnote E |
(14.7, 32.5) |
20.6 Footnote E |
(12.4, 28.9) |
Prince Edward Island |
17.2 Footnote E |
(11.6, 22.8) |
23.1 Footnote E |
(14.1, 32.2) |
10.7 Footnote EFootnote a |
(4.8, 16.6) |
Nova Scotia |
16.2 Footnote E |
(9.8, 22.6) |
13.6 Footnote E |
(5.0, 22.2) |
19.1 Footnote E |
(10.5, 27.7) |
New Brunswick |
16.8 Footnote E |
(11.3, 22.2) |
16.2 Footnote E |
(8.4, 24.0) |
17.4 Footnote E |
(10.0, 24.8) |
Quebec |
10.4 |
(7.2, 13.6) |
11.0 Footnote E |
(7.0, 15.0) |
9.6 Footnote E |
(4.7, 14.6) |
Ontario |
12.2 |
(9.2, 15.2) |
17.6 |
(12.4, 22.8) |
(3.7, 10.5) |
|
Manitoba |
11.9 Footnote E |
(7.1, 16.8) |
13.4 Footnote E |
(6.3, 20.5) |
10.1 Footnote E |
(3.7, 16.5) |
Saskatchewan |
19.8 |
(14.0, 25.6) |
18.8 Footnote E |
(10.7, 26.9) |
20.8 Footnote E |
(12.3, 29.4) |
Alberta |
13.1 Footnote E |
(8.3, 17.9) |
14.0 Footnote E |
(7.3, 20.6) |
12.2 Footnote E |
(5.9, 18.5) |
British Columbia |
11.3 |
(7.7, 15.0) |
12.8 Footnote E |
(7.9, 17.6) |
9.7 Footnote E |
(4.8, 14.6) |
Overweight/obesity |
||||||
Total ages 5-17 |
31.8 |
(29.4, 34.1) |
34.5 |
(30.9, 38.0) |
29.0 [a] |
(25.5, 32.5) |
Newfoundland and Labrador |
46.1 Footnote b |
(37.1, 55.1) |
45.2 |
(33.0, 57.4) |
46.9 Footnote b |
(35.8, 57.9) |
Prince Edward Island |
32.8 |
(25.8, 39.8) |
34.3 |
(24.1, 44.6) |
31.2 |
(21.8, 40.5) |
Nova Scotia |
38.6 |
(29.9, 47.4) |
41.3 |
(29.8, 52.9) |
35.6 Footnote E |
(23.9, 47.2) |
New Brunswick |
31.9 |
(24.0, 39.8) |
31.4 Footnote E |
(20.5, 42.3) |
32.5 Footnote E |
(21.8, 43.2) |
Quebec |
31.5 |
(26.9, 36.2) |
28.7 |
(22.6, 34.8) |
34.8 |
(26.8, 42.7) |
Ontario |
31.4 |
(26.9, 35.9) |
39.1 |
(31.8, 46.5) |
24.1 Footnote a |
(18.0, 30.2) |
Manitoba |
39.2 |
(31.9, 46.5) |
39.2 |
(27.7, 50.8) |
39.2 |
(30.6, 47.7) |
Saskatchewan |
32.4 |
(25.4, 39.5) |
30.2 Footnote E |
(20.1, 40.2) |
34.8 |
(24.4, 45.2) |
Alberta |
33.3 |
(27.7, 38.9) |
33.7 |
(26.4, 41.0) |
32.9 |
(24.8, 41.1) |
British Columbia |
26.2 |
(21.0, 31.4) |
29.4 |
(21.8, 36.9) |
22.6 |
(15.7, 29.5) |
Data source: 2015 Canadian Community Health Survey—Nutrition (share file). Footnotes
|
||||||
When looking at urban and regional settings, there is no significant differences in obesity among children and youth. However, the prevalence of combined overweight/obesity among children and youth was higher in rural areas than in population centres: 36.5% versus 30.7% (see Table 3d). In urban settings, the prevalence of obesity and combined overweight/obesity is significantly lower in girls compared to boys (9.7% versus 14.3%; 27.5% versus 33.8%).
Urban/rural area |
Both Sexes | Males | Females | |||
|---|---|---|---|---|---|---|
| % | 95% Confidence Interval |
% | 95% Confidence Interval |
% | 95% Confidence Interval |
|
| Obesity | ||||||
| Total ages 5-17 | 12.4 | (10.7, 14.1) | 14.9 | (12.1, 17.6) | 9.9 Footnote a | (7.8, 12.0) |
| Urban (reference) | 12.0 | (10.1, 14.0) | 14.3 | (11.3, 17.4) | 9.7 Footnote b | (7.2, 12.1) |
| Rural | 14.1 | (10.4, 17.8) | 17.1 Footnote E | (11.3, 22.9) | 10.8 Footnote E | (6.7, 14.8) |
| Overweight/obesity | ||||||
| Total ages 5-17 | 31.8 | (29.4, 34.1) | 34.5 | (30.9, 38.0) | 29.0 Footnote a | (25.5, 32.5) |
| Urban (reference) | 30.7 | (28.0, 33.4) | 33.8 | (29.7, 37.9) | 27.5 Footnote b | (23.6, 31.4) |
| Rural | 36.5 Footnote b | (31.6, 41.3) | 37.1 | (30.7, 43.6) | 35.8 | (28.1, 43.4) |
Data source: 2015 Canadian Community Health Survey—Nutrition (share file). Footnotes
|
||||||
Indigenous Status
The CCHS and the CCHS-Nutrition cycle lacks data collection among First Nations living on-reserve and Inuit living in Inuit Nunangat, but does provide data for Indigenous peoples living off reserve. As mentioned earlier (see Section 2 - Adult Obesity; Indigenous Status) health information on Indigenous peoples can be found in the Key Health Inequalities in Canada: A National Portrait – 2018 Footnote 61. New data on measured obesity in Indigenous Peoples aged 5 to 17 years old is also available in the Health Inequalities Data Tool Footnote 62, which combines the recent CHMS Cycles (2014 to 2019).
The focus of this report is to provide statistics and data where estimates are based on adjusted self-reported BMI data from the 2021 CCHS. Table A3.6 in Appendix C presents the available CCHS data on Indigenous children and youth. It is recognized that the estimates provided do not deliver a full picture of obesity in Indigenous Peoples and that data gaps continue to exist on risk factors such as SES and the effects of colonization.
Other social determinants of health
The Health Inequalities Data Tool provides crude prevalence rates of measured and self-reported obesity among school-aged children (grades 6-10), which can be stratified by a number of sociodemographic and economic factors Footnote 62. The Health Inequalities Data Tool Footnote 62 presents data on over 100 indicators, including obesity, stratified by life course stage and by a range of social and economic characteristics. The Health Inequalities Data Tool also provides rate ratios, to show the strength of the association, and rate differences, to show excess risk among groups. The self-reported data comes from two cycles of the Health Behaviours in School-aged Children Survey (2009-2010, 2013-2014) and the CCHS (2015-2018) Footnote 62. The measured data for children and youth comes from CHMS cycles 4, 5 and 6 (2014-2019).
Given the lack of a correction equation for children and youth, caution must be taken when interpreting the prevalence of obesity with self-reported rates in that population, as there is likely substantial misclassification.
Trends over time
Between 1975 and 2016, the global prevalence of obesity among boys aged 5 years and older rose from 0.9% to 7.8%, and among girls, from 0.7% to 5.6% Footnote 77. Several reports have suggested some plateauing of BMI rates among children and adolescents in high-income countries in recent years Footnote 63Footnote 77Footnote 78Footnote 79.
Similar trends in the prevalence of obesity in Canada have been observed, although the overall prevalence is higher in Canadian children. In 2004, 12.9% of Canadian children and youth aged 5 to 17 years had a BMI in the obesity category, double the percentage in 1978/1979 when using WHO cut-points Footnote 80. With the CCHS and CHMS data, since 2004, estimates of obesity among children and youth have tended to be stable (see Table A3.2 in Appendix C). Nevertheless, 5- to 11-year-olds are an exception since the prevalence of obesity decreased between 2004 and 2014-2019 (from 13.3% to 10.4%; see Figure 3.2).
Figure 3.2 - Text description
| Time period | Both Sexes | Males | Females | |||
|---|---|---|---|---|---|---|
| % | 95% |
% | 95% |
% | 95% |
|
| Age 5 to 11 years | ||||||
| 2004 | 13.3 | (11.4, 15.2) | 15.3 | (12.2, 18.4) | 11.2 | (8.6, 13.8) |
| 2009-2011/ 2012-2013 | 11.2 | (9.4, 13.0) | 14.3 | (11.5, 17.2) | 8.0 Footnote a | (6.0, 9.9) |
| 2015 | 10.7 | (8.3, 13.1) | 12.2 | (8.7, 15.7) | 9.2 | (6.2, 12.2) |
| 2014-2015/ 2016-2017/ 2018-2019 | 10.4 Footnote a | (8.5, 12.4) | 12.3 | (9.6, 15.1) | 8.4 | (6.4, 10.4) |
Data sources: 2004 and 2015 Canadian Community Health Survey—Nutrition (share files); 2005 and 2008 Canadian Community Health Survey (share files); 2007-2009/2009-2011/2012-2013/2014-2015/2016-2017/2018-2019 Canadian Health Measures Survey (Cycles 1 to 6). Footnotes
|
||||||
Over the same period, the prevalence of combined overweight/obesity among 5- to 11-year-olds also declined significantly from 35.9% to 26.6%. Combined overweight/obesity prevalence at ages 5 to 11 years decreased among boys from 39.0% to 27.5%, and from 32.8% to 25.7% among girls between 2004 and 2014-2019 (see Figure 3.3, for additional information, see Table A3.3 in Appendix C). The prevalence of combined overweight/obesity also decreased significantly among 2- to 4-year-old girls from 11.1% to 4.1% between 2004 and 2015. Among 12- to 17-year-olds, no significant differences in the prevalence of either obesity or combined overweight/obesity were apparent, between 2004 and 2014-2019.
Figure 3.3 - Text description
| Time period | Both Sexes | Males | Females | |||
|---|---|---|---|---|---|---|
| % | 95% |
% | 95% |
% | 95% |
|
| Age 5 to 11 years | ||||||
| 2004 | 35.9 | (33.3, 38.5) | 39.0 | (34.9, 43.1) | 32.8 | (29.3, 36.4) |
| 2009-2011/ 2012-2013 | 29.5 Footnote d | (27.0, 32.1) | 31.6 Footnote d | (27.6, 35.6) | 27.4 Footnote d | (24.0, 30.7) |
| 2015 | 28.4 Footnote d | (25.0, 31.8) | 32.1 Footnote d | (27.1, 37.0) | 24.6 Footnote d | (19.9, 29.2) |
| 2014-2015/ 2016-2017/ 2018-2019 | 26.6 Footnote d | (23.7, 29.5) | 27.5 Footnote d | (23.2, 31.7) | 25.7 Footnote d | (22.4, 29.0) |
Data sources: 2004 and 2015 Canadian Community Health Survey—Nutrition (share files); 2005 and 2008 Canadian Community Health Survey (share files); 2007-2009/2009-2011/2012-2013/2014-2015/2016-2017/2018-2019 Canadian Health Measures Survey (Cycles 1 to 6). Footnotes
|
||||||
We are awaiting nationally representative measured data for children and youth collected since the COVID-19 pandemic. Research is needed to fully understand the impact COVID-19 had on the health and movement behaviours of children (5–11 years) and youth (12–17 years) in Canada Footnote 16. The 2022 ParticipACTION Report Card on Physical Activity for Children and Youth highlights the many ways in which the pandemic had an impact on overall physical activity in children and youth: daily behaviours, physical literacy, school environment, active travel, etc. The negative consequence of that, combined with socioeconomic data and eating behaviours, would likely have an impact on children and youth obesity prevalence post-COVID-19. Ongoing research will help determine if obesity prevalence in children and youth remains at a plateau or if an increase will be observed following the COVID-19 pandemic.
Projections
As described in the Adult obesity section, modelling techniques that account for numerous interconnected factors associated with an individual's health can project future levels of obesity. Statistics Canada's microsimulation POHEM (see Section 4 - Data sources and methods) simulated the annual prevalence of obesity for three age groupings of children and youth (6 to 17 years, 6 to 11 years, and 12 to 17 years), by sex, over two periods: 2001-to-2018, which was used to retrospectively compare predicted and observed estimates, and 2018-to-2035, which was used to project future patterns Footnote 66.
POHEM results showed that during the 2001-to-2018 period, the prevalence of obesity among 6- to 17-year-olds decreased slightly from 11.6% to 11.3%, which represented an annual rate of change of 0.2% (see Figure 3.4 and 3.5). When children and youth were examined separately, the prevalence of obesity was stable among children aged 6 to 11 years (12.2%). A small decline from 10.8% to 10.2% for youth aged 12 to 17 years was the result of a drop from 13.9% to 12.0% among males. These simulated numbers align relatively well with those observed in survey data (see Table A3.2 in Appendix C).
The projected 2018-to-2035 time series for children and youth shows a stable trend, with a statistically insignificant annual rate of change—0.06%. However, POHEM predictions do not consider all factors associated with BMI, diet being a notable exclusion Footnote 68, or the potential impacts of the COVID-19 pandemic. These are important limitations of the model given both the significant influence of diet on body weight and signals that the pandemic may have had lasting effects on behaviours and other factors related to body weight.
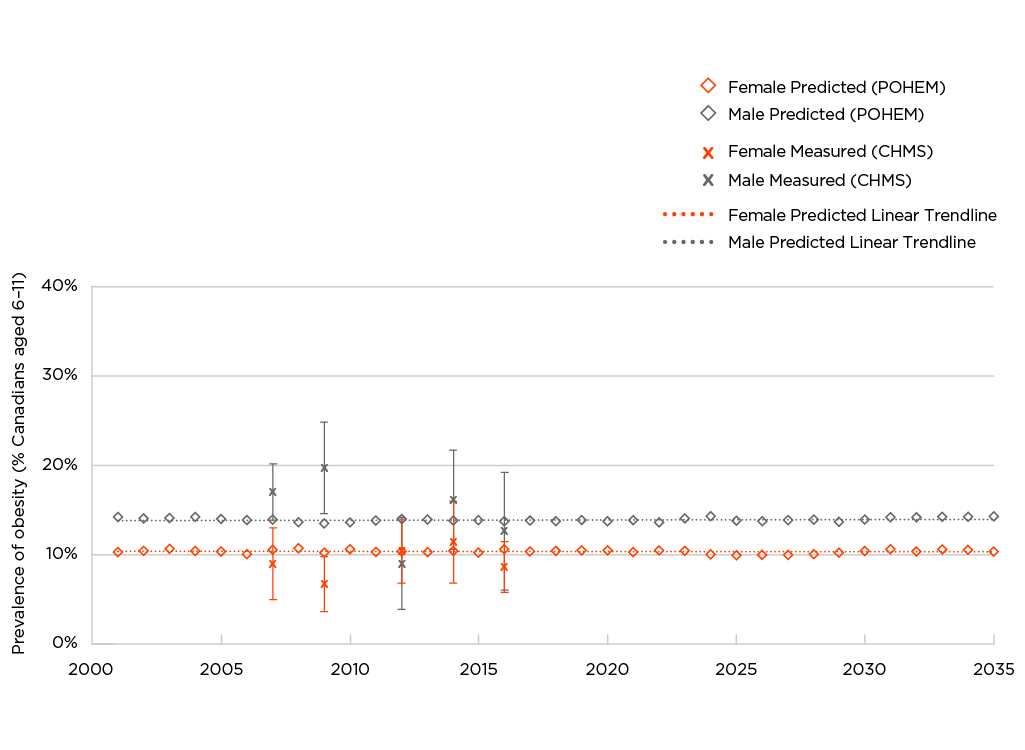
Figure 3.4 - Text description
| Year | Female | Male | ||||
|---|---|---|---|---|---|---|
| POHEM | CHMS | POHEM | CHMS | |||
| Predicted (%) | Measured (%) | 95% Confidence Interval | Predicted (%) | Measured (%) | 95% Confidence Interval | |
| 2001 | 10.17 | 14.11 | ||||
| 2002 | 10.28 | 13.95 | ||||
| 2003 | 10.57 | 14.00 | ||||
| 2004 | 10.29 | 14.08 | ||||
| 2005 | 10.20 | 13.88 | ||||
| 2006 | 9.90 | 13.73 | ||||
| 2007 | 10.39 | 8.9 | (4.9, 12.9) | 13.83 | 16.9 | (13.8, 20.1) |
| 2008 | 10.58 | 13.47 | ||||
| 2009 | 10.12 | 6.6 | (3.5, 9.7) | 13.40 | 19.6 | (14.5, 24.7) |
| 2010 | 10.46 | 13.50 | ||||
| 2011 | 10.15 | 13.70 | ||||
| 2012 | 10.24 | 10.3 | (6.8, 13.9) | 13.85 | 8.9 | (3.7, 14.0) |
| 2013 | 10.14 | 13.79 | ||||
| 2014 | 10.28 | 11.3 | (6.8, 15.9) | 13.70 | 16.0 | (10.5, 21.6) |
| 2015 | 10.10 | 13.72 | ||||
| 2016 | 10.46 | 8.5 | (5.7, 11.4) | 13.64 | 12.5 | (5.9, 19.1) |
| 2017 | 10.21 | 13.69 | ||||
| 2018 | 10.27 | 13.62 | ||||
| 2019 | 10.33 | 13.73 | ||||
| 2020 | 10.36 | 13.62 | ||||
| 2021 | 10.17 | 13.73 | ||||
| 2022 | 10.33 | 13.47 | ||||
| 2023 | 10.27 | 13.92 | ||||
| 2024 | 9.95 | 14.15 | ||||
| 2025 | 9.81 | 13.71 | ||||
| 2026 | 9.88 | 13.60 | ||||
| 2027 | 9.88 | 13.75 | ||||
| 2028 | 9.94 | 13.78 | ||||
| 2029 | 10.11 | 13.55 | ||||
| 2030 | 10.27 | 13.79 | ||||
| 2031 | 10.48 | 14.04 | ||||
| 2032 | 10.24 | 14.03 | ||||
| 2033 | 10.46 | 14.12 | ||||
| 2034 | 10.39 | 14.14 | ||||
| 2035 | 10.21 | 14.19 | ||||
Data sources: POHEM projections for 2001 through 2035; 2007-2009/2009-2011/2012-2013/2014-2015/2016-2017 Canadian Health Measures Survey (CHMS) (Cycles 1 to 5) |
||||||
Note: POHEM projections for BMI account for age, physical activity, and smoking. The model does not account for diet quality or potential impacts of the COVID-19 pandemic.
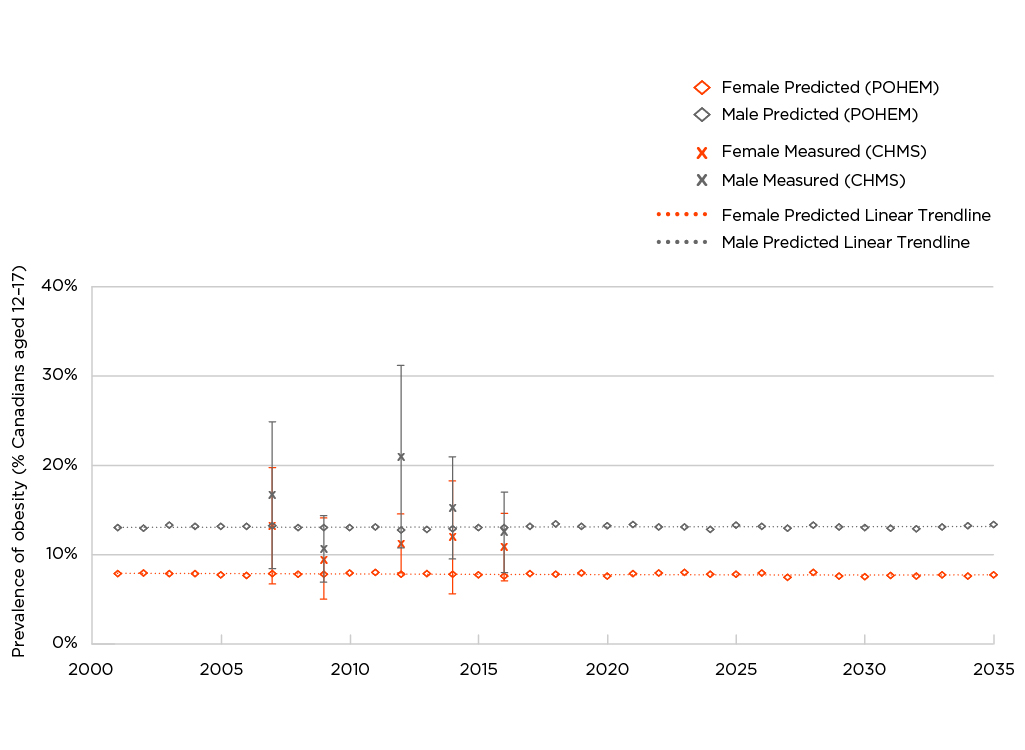
Figure 3.5 - Text description
| Year | Female | Male | ||||
|---|---|---|---|---|---|---|
| POHEM | CHMS | POHEM | CHMS | |||
| Predicted (%) | Measured (%) | 95% Confidence Interval | Predicted (%) | Measured (%) | 95% Confidence Interval | |
| 2001 | 7.92 | 13.10 | ||||
| 2002 | 8.04 | 13.03 | ||||
| 2003 | 7.97 | 13.39 | ||||
| 2004 | 7.92 | 13.23 | ||||
| 2005 | 7.81 | 13.20 | ||||
| 2006 | 7.76 | 13.25 | ||||
| 2007 | 7.91 | 13.3 | (6.8, 19.8) | 13.32 | 16.7 | (8.5, 24.9) |
| 2008 | 7.85 | 13.08 | ||||
| 2009 | 7.86 | 9.6 | (5.0, 14.1) | 13.12 | 10.7 | (7.0, 14.4) |
| 2010 | 8.00 | 13.11 | ||||
| 2011 | 8.10 | 13.14 | ||||
| 2012 | 7.89 | 11.3 | (8.0, 14.6) | 12.85 | 21.0 | (10.8, 31.2) |
| 2013 | 7.91 | 12.87 | ||||
| 2014 | 7.88 | 12.0 | (5.7, 18.3) | 12.97 | 15.3 | (9.6, 21.0) |
| 2015 | 7.81 | 13.08 | ||||
| 2016 | 7.68 | 10.9 | (7.2, 14.7) | 13.07 | 12.6 | (8.1, 17.1) |
| 2017 | 7.92 | 13.24 | ||||
| 2018 | 7.90 | 13.51 | ||||
| 2019 | 8.00 | 13.22 | ||||
| 2020 | 7.70 | 13.27 | ||||
| 2021 | 7.95 | 13.44 | ||||
| 2022 | 7.98 | 13.16 | ||||
| 2023 | 8.06 | 13.18 | ||||
| 2024 | 7.87 | 12.89 | ||||
| 2025 | 7.86 | 13.36 | ||||
| 2026 | 8.00 | 13.20 | ||||
| 2027 | 7.52 | 13.05 | ||||
| 2028 | 8.08 | 13.38 | ||||
| 2029 | 7.68 | 13.15 | ||||
| 2030 | 7.60 | 13.10 | ||||
| 2031 | 7.71 | 13.02 | ||||
| 2032 | 7.67 | 12.97 | ||||
| 2033 | 7.82 | 13.15 | ||||
| 2034 | 7.64 | 13.26 | ||||
| 2035 | 7.82 | 13.44 | ||||
Data sources: POHEM projections for 2001 through 2035; 2007-2009/2009-2011/2012-2013/2014-2015/2016-2017 Canadian Health Measures Survey (CHMS) (Cycles 1 to 5) |
||||||
Note: POHEM projections for BMI account for age, physical activity, and smoking. The model does not account for diet quality or potential impacts of the COVID-19 pandemic.
Section 4: Data sources and methods
Data sources
The Statistics Canada surveys used in this report collected data that can produce prevalence estimates and examine trends in excess weight. The target population for these surveys is household residents, excluding residents of reserves and other Aboriginal settlements, full-time members of the Canadian Forces, and institutionalized populations.
Canadian Community Health Survey (CCHS)
The CCHS, first conducted in 2000-2001, is an ongoing survey that provides comprehensive health data at the national level Footnote 81. The CCHS 2022 and 2023 have been collected, however the data was not available at the time this report was completed. CCHS 2024 is currently in the field. The CCHS covers the population aged 12 years or older, including residents of the three territories. The height and weight of a subsample of respondents (approximately 5,000) were measured in 2005 and 2008. With these data, it was possible to develop correction equations that could be applied to adults' self-reported height and weight data collected in these and other CCHS cycles Footnote 82Footnote 83. (See Appendix B: Correction equations for adjusting BMI in the CCHS based on self-/parent-reported height and weight). Throughout this report, the term "adjusted self-reported" is employed to indicate that data have undergone this correction.
Limitations of the CCHS: BMI estimates are based on self-reported height and weight. This bias can be corrected for adults, but not for youth. The CCHS underwent a major redesign in 2015. Therefore, care is warranted when making comparisons pre-/post-2015 Footnote 84. Additionally, response rates have declined over time, from 84.7% in 2000-2001 to 41.0% in 2019-2020 (see Table A4a in Appendix C).
Strengths of the CCHS: Because of large sample sizes, characteristics such as age group and SES variables can be examined and trends for obesity class III can be tracked. CCHS response rates are higher than those for surveys that take direct physical measurements.
In this report, the profile of obesity among adults aged 18 years or older by socio-demographic characteristics is based on adjusted self-reported BMI (BMIAdjSR) from the 2021 CCHS (data for the territories are not included in the single-year CCHS files).
Trends in the prevalence of obesity among adults aged 18 years or older are based on adjusted self-reported BMI, using two-year grouping of CCHS data for the 10 provinces (for example, 2007-2008, 2009-2010, 2017-2018) Footnote 82. Two-year data was used to methodologically add power to the trend estimation. Data from 2022 was not available at the time of this report, as such, a 2021-2022 file could not be create to examine more recent trends. Trend estimation ranges from 2000-2001 to 2019-2020. To examine trends over time in the prevalence of excess weight among adults and youth, estimates based on measured data from the 2005 and 2008 subsamples were used.
CCHS—Nutrition
The CCHS has supplementary components that focus on special topics every few years. In 2004 and 2015, the topic was Nutrition Footnote 85. The CCHS-Nutrition covered the population aged 1 year or older in the 10 provinces. It included measurements taken by trained interviewers of the height and weight of a sample of the population aged 2 years or older.
Limitations of the CCHS–Nutrition: The data are not collected regularly, and they exclude the territories. Response rates are 76.5% and 61.6% for the 2004 and 2015 CCHS–Nutrition cycles (see Table A4b in Appendix C). The height and weight measurements may be less accurate than those taken for the CHMS by kinesiologists using more precise (less portable) equipment.
Strengths of the CCHS–Nutrition: These data include measurements of height and weight for children and youth aged 2 years or older. Because sample sizes are large, subpopulations can be analyzed.
This report uses data from the 2015 CCHS—Nutrition to provide an up-to-date profile of excess weight among children and youth by socio-demographic characteristics. Estimates from both the 2004 and 2015 Nutrition cycles were also used to examine measurement-based BMI over time for adults, children, and youth.
Canadian Health Measures Survey (CHMS)
The CHMS, which began in 2007-2009, is an ongoing survey, collected over a period of two years, designed to provide comprehensive measured data at the national level Footnote 86. Six cycles have been conducted: 2007-2009, 2009-2011, 2012-2013, 2014-2015, 2016-2017 and 2018-2019. Cycle 7 began in fall 2022 and will end in fall 2024. Each cycle collected height and weight data measured by kinesiologists. The CHMS covers the population aged 3 to 79 years, excluding residents of the territories; except for cycle 1 which covered the population aged 6 to 79 years.
Limitations of the CHMS: Response rates are low, ranging from 45.9% (2018-2019) to 55.5% (2009-2011) (Table A4b in Appendix C). The territories are not included. Because of the high cost of collecting these data, the sample size for each cycle is small and highly clustered. Therefore, the CHMS is of limited value for reporting obesity trends by characteristics such as age group and socioeconomic variables.
Strengths of the CHMS: The CHMS includes height and weight measurements; it collects data on children and youth aged 2 years or older; and it is conducted regularly.
The CHMS estimates in this report are based on cycles 1 to 3 combined (2007-2009/2009-2011/2012-2013) and cycles 4, 5 and 6 combined (2014-2015/2016-2017/2018-2019).
Prevalence estimates of excess weight using CHMS data are presented for adults aged 18 to 79 years, children aged 5 (61 months) to 11 years, and adolescents aged 12 to 17 years. Sample size was insufficient to calculate estimates for younger children.
Tables A4a and A4b show the responding sample sizes for BMI for all three surveys. Response rates for the self-reported CCHS have fallen from 84.7% in 2000-2001 to 41.0% in 2019-2020, while response rates for the CHMS and CCHS-Nutrition have remained consistently low. Critically, this may reduce the generalizability of the sample, and impact researcher's ability to estimate prevalence rates for certain sub-groups or higher risk populations.
Variable definitions
In addition to age, sex, and province, the following variables were used in the analyses.
In Section1, BMI: BMI Classification for adults and BMI classification for children and youth explains how weight categories were derived for adults, youth, and children. BMI was not calculated for adults whose height was less than 0.91 metres (three feet) or more than 2.13 metres (7 feet), or for females who reported they were pregnant or who did not answer the question on pregnancy.
Indigenous Peoples: The variable refers to First Nations living off reserve, Inuit, and Métis. It is based on the question, "Are you an Aboriginal person, that is First Nations, Métis, or Inuk (Inuit)? First Nations includes Status and Non-Status Indians."
Household income quintiles: This variable was derived based on household income adjusted by Statistics Canada's low-income cut-offs, which are specific to the number of individuals in the household, the size of the community, and the survey year Footnote 87.
Highest level of education in household: This variable reflects the highest level of education attained by any household member. The education questions in the CCHS and CHMS were revised in 2015; therefore, caution should be exercised in examining trends by household education.
Population centre or rural residence: Individuals were classified as residing in population centres if they lived in an area with a population of 1,000 or more; otherwise, they were classified as rural residents.
Analyses
Descriptive analyses were used to estimate the prevalence of obesity and overweight among adults, children and youth, by sociodemographic characteristics. To account for the complex sampling designs of the CCHS and the CHMS, all estimates were based on weighted data. Weights were created by Statistics Canada to ensure that the data are representative of the population living in the 10 provinces when the survey was conducted. Variance estimates and 95% confidence intervals (CIs) were calculated, and significance testing was conducted, using the bootstrap technique to account for the complex designs of the surveys Footnote 88. The test for trends across time was based on logistic regression, using time as a continuous variable, and controlling for age group. The age-standardized estimates of excess weight among adults by province and over time, which are presented in the appendix, were standardized to the Canadian population in 2011 (based on Census data), using age groups 18 to 34 years, 35 to 49 years, 50 to 64 years, and 65 years or older.
Limitations of survey data
Although all estimates were based on weighted data that account for survey non-response, some limitations related to non-response should be noted (Tables A4a and A4b show response rates to the self-reported and measured datasets used in this report). An adjustment to the measured CCHS and CHMS data was made to compensate for those whose height and weight were not measured because of non-response. For self-reported CCHS data, no adjustment was made for non-response to height and weight since respondents with missing values were excluded from estimates. Table A4a shows the number of respondents with a missing value for self-reported BMI. If these respondents were more (or less) likely to have excess body weight, estimates would be biased.
Caution is necessary when interpreting trends if survey response rates changed over time. A 2015 Statistics Canada data quality study reported steady declines in CCHS response rates from 2000 to 2012 Footnote 89. The characteristics of respondents and non-respondents differed, and these differences cannot be fully corrected via weighting. As a result, trends may be affected by uncorrected biases.
All estimates from the CCHS in this report are based on "share files." CCHS respondents were asked for permission to share their information with Statistics Canada's partners, which included the Public Health Agency of Canada (Tables A4a and A4b). An adjustment was made to account for respondents who declined to share.
For the CHMS, the percentage agreeing to share was sufficiently high that share files were not created, and the CHMS response rates incorporate agreement to share.
Comparing estimates across surveys
Caution is necessary when comparing measured estimates from different surveys. The content and methodology of the three surveys varied considerably.
Before they agreed to participate, potential CHMS respondents were told that they would visit a mobile clinic where physical measurements, including height and weight, would be taken to evaluate their health. They were also told that they would receive a report of the results. For potential CCHS—Nutrition respondents, they were told that they would have to answer questions about their eating habits and other factors that may relate to health and nutritional well-being. They were not aware that physical measurements would be taken at the end of the interview. If the introduction to the surveys affected the likelihood that a person with obesity would participate, comparisons of estimates from the datasets would be less meaningful.
People with obesity might not respond to the CCHS—Nutrition because they knew they would be asked about their eating habits, but they might respond to the CHMS because they knew they would get a report about their health. Differences in the prevalence of obesity may reflect these differential non-response biases, but more research is needed to understand the impact of these biases.
As well, the data based on physical measurements are from surveys with small sample sizes, making it less likely that statistically significant differences between estimates will emerge.
If the nature of the bias in BMI based on self-reported height and weight had changed over time, this would have an impact on the trends based on adjusted self-reported BMI.
Microsimulation Population Health Model (POHEM)
Statistics Canada's microsimulation POHEM uses multiple sources of microdata to simulate longitudinal profiles of health status and its determinants for a large sample of synthetic persons Footnote 66. Population health outcomes are the aggregates of these microsimulations.
The Public Health Agency of Canada collaborated with Statistics Canada to develop the POHEM BMI model from height and weight data self-reported in the first seven cycles of the longitudinal National Population Health Survey Footnote 68. Longitudinal change in individual BMI is sensitive to sociodemographic characteristics and health behaviours Footnote 68. Bancej et al. (2015) used POHEM to simulate the trajectory of obesity for adults (aged 19 to 79 years) and youth (aged 6 to 12 years) Footnote 67. Ongoing quality assurance by Statistics Canada, Public Health Agency of Canada, and academic researchers ensures the predictive validity of POHEM against objective estimates of self-reported and measured obesity.
Appendixes
Appendix A : BMI, mortality and the obesity paradox
Studies of associations between BMI and incident disease (newly diagnosed cases) typically find a J-shaped relationship Footnote 2Footnote 40Footnote 41. People whose BMI is in the normal range have the lowest risk of disease; individuals whose BMI is in the underweight or overweight range have an increased risk; and those in the obesity range have the highest risk, with incremental increases over the three obesity classes.
By contrast, studies of associations between BMI and mortality have found a U-shaped relationship, known as the "obesity paradox." Individuals with a BMI in the overweight range have the lowest risk of mortality. The risk for people in obesity class I is similar to, or even lower, than that for people with a BMI in the normal range. This U-shaped relationship has been reported by studies based on the general population Footnote 90, and by studies examining people diagnosed with diseases such as stroke Footnote 46, coronary artery disease Footnote 47, chronic heart failure Footnote 45, type 2 diabetes Footnote 44, and cancer Footnote 48.
It has been suggested that the paradox is real, and that excess weight might create a metabolic or nutrition reserve that may be protective from mortality and cardiovascular disease events after the onset of a chronic disease Footnote 91Footnote 92.
More plausibly, methodological shortcomings, notably, reverse causation and failure to account for confounding variables, may be responsible for the obesity paradox.
Reverse causation Footnote 44Footnote 91Footnote 92 occurs when an underlying illness results in weight loss due to the disease process itself or to a conscious effort to lose weight after a diagnosis (wake-up call). If the baseline BMI measurement is taken after this weight loss, individuals in the normal weight range could be diverse, consisting of people who have always been lean and those who lost weight owing to disease. The latter group is at a substantially higher risk of mortality. To untangle this complication, it is recommended that analyses exclude patients who had already been diagnosed with obesity-related diseases at baseline or who died early in the follow-up period Footnote 92.
Failure to account for confounding variables such as cardiorespiratory fitness, nutrition and smoking can also distort associations between BMI and mortality Footnote 44Footnote 91Footnote 92. Smoking is of particular concern owing to smokers' higher likelihood of having a BMI in the normal range, but at the same time, a higher likelihood of premature mortality. Because the adverse effects of smoking are so strong, it has been suggested that studies of associations between BMI and mortality stratify the analysis by smoking status; simply controlling for smoking status in statistical models is not adequate Footnote 92.
A meta-analysis of 230 cohort studies with a total of 30.3 million participants demonstrated this conundrum Footnote 93. When the analysis was performed on the total population, a U-shaped association emerged between BMI and mortality, similar to that observed in a previous meta-analysis Footnote 43. However, when the analysis was restricted to never-smokers, the relationship was J-shaped, with the lowest mortality risk for BMIs of 23-24 kg/m2 (within the normal range). When the analysis was further restricted to healthy never-smokers, the lowest risk was among BMIs of 22-23 kg/m2, and when restricted to never-smokers with long follow-up (≥ 20 years), the lowest risk was for BMIs of 20-22 kg/m2. This final restriction reduces potential confounding due to weight loss associated with pre-diagnosed conditions. By contrast, among current-, former- and ever-smokers, a U-shaped association emerged between BMI and mortality.
Other large-scale studies also "debunked" the obesity paradox and found that people classified in the obesity category were at a higher risk of all-cause mortality and cardiovascular disease events Footnote 41Footnote 94Footnote 95.
Appendix B : Correction equations for adjusting BMI in the CCHS based on self-/parent-reported height and weight in the CCHS
A study based on the CCHS‒Nutrition, which collected both self-reported and measured height and weight, found that correction factors could be generated to adjust adults' self-reports to yield more accurate BMI estimates Footnote 82. These correction factors were successfully applied to self-reported values from the 2008 CCHS, and have since been applied to BMI estimates derived from the annual CCHS Footnote 83.
Figures 4.1 and 4.2 incorporate data from all available cycles of the CCHS, the CCHS-Nutrition, and the CHMS to show Canadian trends in obesity among men and women based on self-reported data, adjusted self-reported data, and measured data. For the most recent years, BMI estimates for both sexes based on adjusted self-reported data (BMIAdjSR) are similar to estimates based on measured data.
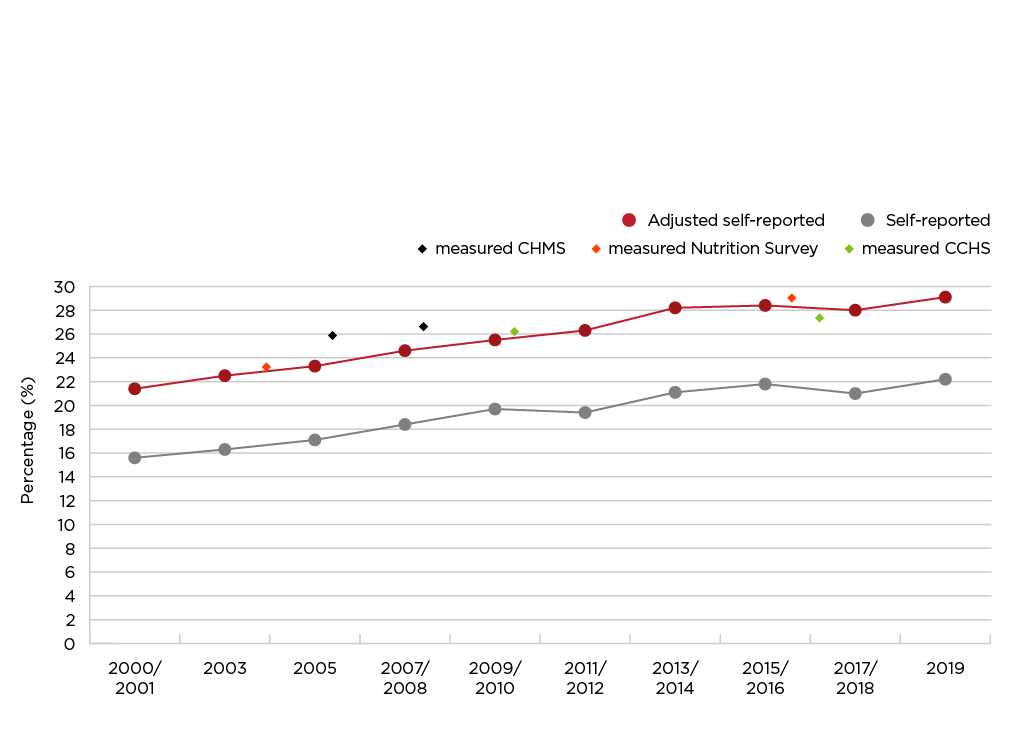
Figure 4.1 - Text description
| Time Period | Unadjusted Self-Reported Obesity Prevalence (%) | Adjusted Self-Reported Obesity Prevalence (%) | Measured Obesity Prevalence (%) |
|---|---|---|---|
| 2000-2001 | 15.6 | 21.4 | - |
| 2003 | 16.3 | 22.5 | - |
| 2004 | - | - | 23.1 |
| 2005 | 17.1 | 23.3 | 25.9 |
| 2007-2008 | 18.4 | 24.6 | - |
| 2008 | - | - | 26.4 |
| 2009-2010 | 19.7 | 25.5 | - |
| 2007-2009/2009-2011/2012-2013 | - | - | 26.0 |
| 2011-2012 | 19.4 | 26.3 | - |
| 2013-2014 | 21.1 | 28.2 | - |
| 2015 | - | - | 28.8 |
| 2015-2016 | 21.8 | 28.4 | - |
| 2014-2015/2016-2017/2018-2019 | - | - | 27.3 |
| 2017-2018 | 21.0 | 28.0 | - |
| 2019 | 22.2 | 29.1 | - |
Data sources: 2000/01-2019 Canadian Community Health Survey (share files); 2004 and 2015 Canadian Community Health Survey—Nutrition (share files); 2007-2009/2009-2011/2012-2013/2014-2015/2016-2017/2018-2019 Canadian Health Measures Survey (Cycles 1 to 6) |
|||
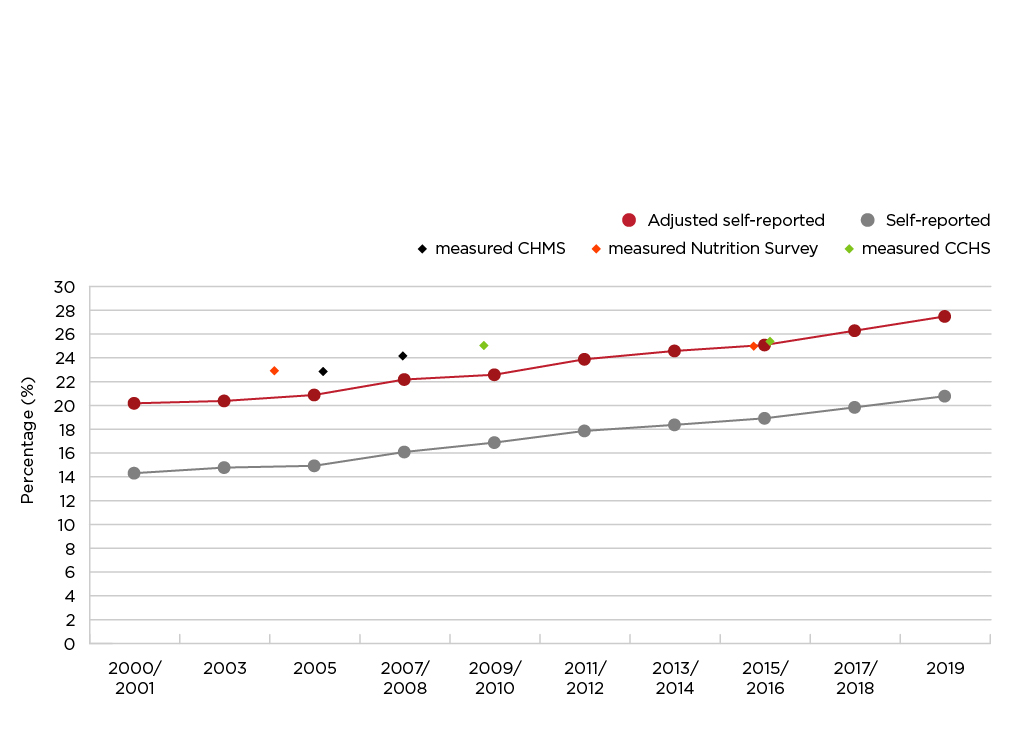
Figure 4.2 - Text description
| Time Period | Unadjusted Self-Reported Obesity Prevalence (%) | Adjusted Self-Reported Obesity Prevalence (%) | Measured Obesity Prevalence (%) |
|---|---|---|---|
| 2000-2001 | 14.3 | 20.2 | - |
| 2003 | 14.8 | 20.4 | - |
| 2004 | - | - | 23.3 |
| 2005 | 14.95 | 20.9 | 23.3 |
| 2007-2008 | 16.11 | 22.2 | - |
| 2008 | - | - | 24.2 |
| 2009-2010 | 16.9 | 22.6 | - |
| 2007-2009/2009-2011/2012-2013 | - | - | 25.1 |
| 2011-2012 | 17.88 | 23.9 | - |
| 2013-2014 | 18.39 | 24.6 | - |
| 2015 | - | - | 25.2 |
| 2015-2016 | 18.94 | 25.1 | - |
| 2014-2015/2016-2017/2018-2019 | - | - | 25.5 |
| 2017-2018 | 19.86 | 26.3 | - |
| 2019 | 20.8 | 27.5 | - |
Data sources: 2000/01-2019 Canadian Community Health Survey (share files); 2004 and 2015 Canadian Community Health Survey—Nutrition (share files); 2007-2009/2009-2011/2012-2013/2014-2015/2016-2017/2018-2019 Canadian Health Measures Survey (Cycles 1 to 6) |
|||
Care must be exercised when applying these correction factors to datasets other than the CCHS. The bias in self-reported data can be affected by factors such as data collection method, study population, and survey context. Additionally, the bias may change over time. Future research may seek to examine such changes.
Survey context may influence the extent of bias in a survey. For example, the bias in BMI based on self-reported values was similar in the 2005 and 2008 CCHS. In both surveys, respondents did not know that height and weight would subsequently be measured Footnote 83. The bias was much smaller in the 2007-2009 CHMS—when respondents self-reported their height and weight, they knew that they would later be measured Footnote 83. It may not be appropriate to apply correction factors derived from a survey of respondents who knew that they would subsequently be measured to data from a survey that relied solely on self-reports.
Some studies suggest that the bias in self-reported height and weight can change over time. Based on Canadian data collected in 1986-1992 and 2005, biases in BMI increased because of growing tendencies for women to underreport their weight and for men to over report their height Footnote 96.
Additional work is needed to create correction factors to adjust adolescents' (aged 12 to 17 years) self-reported height and weight Footnote 82.
A study of obesity estimates for children aged 6 to 11 years based on parent-reported and measured data found that correction equations for parent-reported values could not be successfully developed Footnote 55.
As national surveys move toward online data collection, it will be important to re-evaluate correction factors.
Appendix C: Accompanying data tables
| Adjusted BMI category (range kg/m2) | Both Sexes | Males | Females | ||||||
|---|---|---|---|---|---|---|---|---|---|
Population |
% | 95% |
Population |
% | 95% |
Population |
% | 95% |
|
| Adults aged 18 years or older | |||||||||
| Total | 28,425.8 | 14,249.4 | 14,176.4 | ||||||
| Underweight (< 18.5) | 472.6 | 1.7 | (1.4, 1.9) | 185.9 | 1.3 Footnote E | (0.9, 1.7) | 286.7 | 2.0 Footnote a | (1.6, 2.4) |
| Normal weight (18.5 to 24.9) | 9,488.9 | 33.4 | (32.5, 34.2) | 4,124.2 | 28.9 | (27.7, 30.1) | 5,364.7 | 37.8 Footnote a | (36.7, 39.0) |
| Overweight (25.0 to 29.9) | 10,084.0 | 35.5 | (34.6, 36.4) | 5,652.1 | 39.7 | (38.3, 41.0) | 4,431.9 | 31.3 Footnote a | (30.1, 32.4) |
| Obesity Class I (30.0 to 34.9) | 5,385.3 | 18.9 | (18.3, 19.6) | 2,832.8 | 19.9 | (18.9, 20.9) | 2,552.5 | 18.0 Footnote a | (17.1, 18.9) |
| Obesity Class II (35.0 to 39.9) | 1,952.0 | 6.9 | (6.4, 7.3) | 945.1 | 6.6 | (6.0, 7.3) | 1,006.9 | 7.1 | (6.5, 7.7) |
| Obesity Class III (≥ 40.0) | 1,042.9 | 3.7 | (3.3, 4.0) | 509.2 | 3.6 | (3.1, 4.1) | 533.7 | 3.8 | (3.4, 4.2) |
| Obesity (≥ 30.0) | 8,380.2 | 29.5 | (28.6, 30.3) | 4,287.1 | 30.1 | (28.9, 31.3) | 4,093.1 | 28.9 | (27.8, 30.0) |
| Overweight/Obesity (≥ 25.0) | 18,464.2 | 65.0 | (64.1, 65.8) | 9,939.2 | 69.8 | (68.5, 71.0) | 8,525.0 | 60.1 Footnote a | (58.9, 61.3) |
Data source: 2021 Canadian Community Health Survey (share file).
Note: The percentages are based on records with a valid value for BMI. Excluded from the total population counts are pregnant women (n=284, estimated population 278.2 thousand and individuals with a missing value for BMI (n=828 for males, estimated population 613.9 thousand; n=1,138 for females, estimated population 812.9 thousand). |
|||||||||
| Age group (in years) | Both Sexes | Males | Females | |||
|---|---|---|---|---|---|---|
| % | 95% |
% | 95% |
% | 95% |
|
| Total (18+) | 29.5 | (28.6, 30.3) | 30.1 | (28.9, 31.3) | 28.9 | (27.8, 30.0) |
| 18-34 | 22.5 Footnote b | (20.7, 24.3) | 22.3 Footnote b | (19.8, 24.8) | 22.7 Footnote b | (20.3, 25.2) |
| 35-49 | 32.9 | (31.1, 34.6) | 33.8 | (31.3, 36.3) | 31.9 | (29.7, 34.1) |
| 50-64 (reference) | 33.7 | (32.1, 35.3) | 36.4 | (34.0, 38.8) | 31.1 Footnote a | (28.9, 33.3) |
| 65-79 | 31.5 | (30.1, 32.8) | 30.9 Footnote b | (28.8, 32.9) | 32.0 | (30.1, 33.8) |
| 80 or older | 21.2 Footnote b | (18.7, 23.7) | 19.6 Footnote b | (15.9, 23.3) | 22.4 Footnote b | (19.0, 25.9) |
|
||||||
| Household income quintile | Both Sexes | Males | Females | |||
|---|---|---|---|---|---|---|
| % | 95% |
% | 95% |
% | 95% |
|
| Total (18+) | 29.5 | (28.6, 30.3) | 30.1 | (28.9, 31.3) | 28.9 | (27.8, 30.0) |
| Quintile 1 (Lowest) | 29.7 | (27.8, 31.5) | 28.3 | (25.4, 31.2) | 30.8 Footnote b | (28.5, 33.2) |
| Quintile 2 | 29.2 | (27.4, 31.0) | 30.0 | (27.2, 32.8) | 28.4 | (26.2, 30.7) |
| Quintile 3 | 29.2 | (27.3, 31.0) | 28.8 | (26.3, 31.4) | 29.5 | (26.9, 32.0) |
| Quintile 4 | 30.2 | (28.4, 32.1) | 31.6 | (28.9, 34.3) | 28.8 | (26.1, 31.4) |
| Quintile 5 (reference) | 29.1 | (27.4, 30.9) | 31.2 | (28.8, 33.6) | 26.6 Footnote a | (24.4, 28.8) |
Data source: 2021 Canadian Community Health Survey (share file).
|
||||||
| Highest level of education in the household | Both Sexes | Males | Females | |||
|---|---|---|---|---|---|---|
| % | 95% |
% | 95% |
% | 95% |
|
| Total (18+) | 29.5 | (28.7, 30.3) | 30.2 | (29.0, 31.4) | 28.8 | (27.8, 29.9) |
| Less than secondary school graduation | 35.1 Footnote b | (31.9, 38.2) | 33.5 | (29.1, 37.9) | 36.5 Footnote b | (32.1, 40.9) |
| Secondary school graduation | 36.7 Footnote b | (34.4, 39.0) | 36.5 Footnote b | (32.9, 40.1) | 36.9 Footnote b | (33.9, 39.8) |
| Post-secondary certificate, diploma or university degree (reference) | 28.3 | (27.4, 29.2) | 29.2 | (27.9, 30.5) | 27.3 Footnote a | (26.2, 28.5) |
|
||||||
| Province | Both Sexes | Males | Females | |||
|---|---|---|---|---|---|---|
| % | 95% |
% | 95% |
% | 95% |
|
| Total (18+) | 28.1 | (27.5, 28.6) | 28.8 | (28.0, 29.6) | 27.4 | (26.6, 28.1) |
| Newfoundland and Labrador | 40.3 Footnote a | (36.9, 43.7) | 40.9 Footnote a | (36.3, 45.4) | 39.8 Footnote a | (35.3, 44.3) |
| Prince Edward Island | 35.9 Footnote a | (31.8, 40.0) | 34.4 | (28.6, 40.2) | 37.1 Footnote a | (31.8, 42.3) |
| Nova Scotia | 34.6 Footnote a | (31.8, 37.4) | 35.4 Footnote a | (30.7, 40.1) | 33.8 Footnote a | (30.6, 37.0) |
| New Brunswick | 36.3 Footnote a | (33.4, 39.2) | 33.2 | (28.9, 37.4) | 39.4 Footnote a | (35.4, 43.4) |
| Quebec | 25.8 Footnote a | (24.6, 27.1) | 26.5 | (24.9, 28.2) | 25.0 | (23.5, 26.6) |
| Ontario | 28.2 | (27.3, 29.2) | 28.5 | (27.1, 30.0) | 27.9 | (26.7, 29.2) |
| Manitoba | 33.2 Footnote a | (30.9, 35.5) | 33.1 Footnote a | (29.7, 36.5) | 33.4 Footnote a | (30.2, 36.6) |
| Saskatchewan | 35.9 Footnote a | (33.4, 38.5) | 37.8 Footnote a | (34.3, 41.3) | 34.0 Footnote a | (30.4, 37.7) |
| Alberta | 29.8 | (28.3, 31.3) | 31.9 Footnote a | (29.7, 34.0) | 27.4 | (25.4, 29.5) |
| British Columbia | 23.2 Footnote a | (21.8, 24.6) | 24.6 Footnote a | (22.5, 26.6) | 21.8 Footnote a | (19.9, 23.8) |
| Yukon | 32.2 | (26.5, 37.8) | 32.2 | (26.5, 37.8) | 33.9 | (25.6, 42.3) |
| Northwest Territories | 36.6 Footnote a | (30.2, 43.1) | 36.6 | (28.6, 44.7) | 37.9 Footnote a | (29.5, 46.2) |
| Nunavut | 32.1 Footnote E | (20.1, 44.2) | 24.5 Footnote E | (10.3, 38.7) | 41.8 Footnote E | (26.2, 57.5) |
Note: Rates are age-standardized to the 2011 Canadian population. |
||||||
| Urban/rural area | Both Sexes | Males | Females | |||
|---|---|---|---|---|---|---|
| % | 95% |
% | 95% |
% | 95% |
|
| Total | 29.5 | (28.6, 30.3) | 30.1 | (28.9, 31.3) | 28.9 | (27.8, 30.0) |
| Urban (reference) | 28.6 | (27.7, 29.6) | 29.0 | (27.6, 30.4) | 28.3 | (27.0, 29.5) |
| Rural | 33.6 Footnote b | (32.1, 35.1) | 35.0 Footnote b | (32.8, 37.3) | 32.0 Footnote aFootnote b | (30.1, 34.0) |
Data source: 2021 Canadian Community Health Survey (share file).
|
||||||
| Geography | Prevalence (%) | 95% Confidence Interval |
|---|---|---|
| Canada | 26.7 | (26.3, 27.1) |
| Bas-Saint-Laurent | 25.3 | (22.3, 28.3) |
| Brant County HU | 31.9 | (28.3, 35.5) |
| Calgary Zone | 24.2 | (22.7, 25.7) |
| Capitale-Nationale | 22.4 | (20.4, 24.3) |
| Central Regional | 40.3 | (36.8, 43.9) |
| Central Vancouver Island HSDA | 22.9 | (20.0, 25.8) |
| Central Zone | 33.6 | (31.5, 35.8) |
| Chatham-Kent HU | 37.9 | (33.9, 41.9) |
| Chaudière-Appalaches | 22.5 | (20.1, 25.0) |
| City of Hamilton HU | 27.2 | (23.9, 30.5) |
| City of Ottawa HU | 23.1 | (20.9, 25.4) |
| City of Toronto HU | 19.6 | (17.9, 21.3) |
| Côte-Nord | 34.9 | (31.5, 38.3) |
| Cypress RHA | 36.6 | (31.3, 41.9) |
| Durham Regional HU | 29.2 | (25.8, 32.5) |
| East Kootenay HSDA | 29.0 | (24.3, 33.7) |
| Eastern Ontario HU | 32.6 | (28.6, 36.6) |
| Eastern Regional | 38.7 | (36.0, 41.3) |
| Edmonton Zone | 27.5 | (25.7, 29.4) |
| Elgin-St Thomas HU | 36.6 | (33.1, 40.1) |
| Five Hills RHA | 30.0 | (25.4, 34.6) |
| Fraser East HSDA | 30.3 | (27.1, 33.4) |
| Fraser North HSDA | 21.6 | (18.5, 24.6) |
| Fraser South HSDA | 26.3 | (23.7, 29.0) |
| Gaspésie - Îles-de-la-Madeleine | 31.0 | (28.1, 33.8) |
| Grey Bruce HU | 34.4 | (31.0, 37.9) |
| Haldimand-Norfolk HU | 28.7 | (25.6, 31.8) |
| Haliburton, Kawartha, Pine Ridge District HU | 34.7 | (30.8, 38.5) |
| Halton Regional HU | 23.9 | (21.5, 26.4) |
| Hastings and Prince Edward Counties HU | 35.2 | (31.4, 38.9) |
| Heartland RHA | 35.9 | (30.2, 41.7) |
| Huron County HU | 34.1 | (29.4, 38.9) |
| Interlake-Eastern Regional Health | 37.9 | (34.7, 41.2) |
| Kelsey Trail RHA | 37.6 | (30.2, 45.0) |
| Kingston, Frontenac and Lennox and Addington HU | 32.3 | (28.5, 36.1) |
| Kootenay-Boundary HSDA | 27.8 | (23.9, 31.7) |
| L'Abitibi-Témiscamingue | 34.0 | (31.3, 36.7) |
| L'Estrie | 26.4 | (24.2, 28.7) |
| L'Outaouais | 27.3 | (25.2, 29.4) |
| Labrador-Grenfell Regional | 46.1 | (42.3, 49.9) |
| Lambton HU | 30.5 | (26.9, 34.1) |
| Leeds, Grenville and Lanark District HU | 34.5 | (29.7, 39.4) |
| Mamawetan/Keewatin/Athabasca | 43.9 | (35.8, 52.1) |
| Mauricie et du Centre-du-Québec | 29.0 | (27.0, 30.9) |
| Middlesex-London HU | 26.5 | (23.4, 29.7) |
| Montérégie | 28.2 | (26.1, 30.3) |
| Northwest Territories | 40.2 | (36.9, 43.6) |
| Nunavut | 33.7 | (30.0, 37.5) |
| Niagara Regional Area HU | 29.8 | (26.7, 32.8) |
| Nord-du-Québec | 30.4 | (26.0, 34.7) |
| North Bay Parry Sound District HU | 31.7 | (28.3, 35.0) |
| North Shore/Coast Garibaldi HSDA | 16.0 | (12.5, 19.4) |
| North Vancouver Island HSDA | 29.6 | (26.4, 32.9) |
| North Zone | 39.2 | (36.8, 41.6) |
| Northeast HSDA | 36.8 | (31.4, 42.1) |
| Northern Interior HSDA | 32.4 | (28.8, 36.0) |
| Northern RHA | 40.3 | (36.7, 44.0) |
| Northwest HSDA | 32.1 | (27.0, 37.3) |
| Northwestern HU | 36.0 | (31.3, 40.7) |
| Okanagan HSDA | 24.9 | (21.7, 28.0) |
| Oxford County HU | 37.2 | (33.5, 40.8) |
| Peel Regional HU | 23.1 | (20.8, 25.4) |
| Perth District HU | 35.0 | (31.2, 38.8) |
| Peterborough County-City HU | 33.7 | (29.0, 38.4) |
| Porcupine HU | 38.8 | (34.0, 43.6) |
| Prairie Mountain Health | 37.0 | (33.6, 40.4) |
| Prairie North RHA | 32.9 | (29.1, 36.6) |
| Prince Albert Parkland RHA | 37.4 | (33.0, 41.8) |
| Prince Edward Island | 32.9 | (30.8, 35.0) |
| Regina Qu'Appelle RHA | 32.2 | (28.8, 35.5) |
| Région de Lanaudière | 28.9 | (25.8, 32.0) |
| Région de Laval | 25.2 | (22.9, 27.5) |
| Région de Montréal | 20.6 | (18.9, 22.3) |
| Région des Laurentides | 24.9 | (22.8, 26.9) |
| Renfrew County and District HU | 34.0 | (30.0, 38.0) |
| Richmond HSDA | 11.9 | (9.8, 14.0) |
| Saguenay - Lac-Saint-Jean | 24.5 | (21.8, 27.2) |
| Saskatoon RHA | 30.0 | (27.2, 32.8) |
| Simcoe Muskoka District HU | 31.7 | (28.3, 35.2) |
| South Vancouver Island HSDA | 19.9 | (17.3, 22.4) |
| South Zone | 32.6 | (30.2, 35.0) |
| Southern Health | 33.9 | (31.0, 36.7) |
| Sudbury and District HU | 33.0 | (29.8, 36.2) |
| Sun Country RHA | 34.9 | (30.7, 39.1) |
| Sunrise RHA | 41.9 | (36.6, 47.1) |
| The District of Algoma HU | 36.3 | (33.2, 39.4) |
| Thompson/Cariboo HSDA | 29.2 | (26.1, 32.3) |
| Thunder Bay District HU | 35.5 | (32.3, 38.7) |
| Timiskaming HU | 41.2 | (36.0, 46.4) |
| Vancouver HSDA | 11.6 | (9.7, 13.4) |
| Waterloo HU | 29.0 | (25.6, 32.3) |
| Wellington-Dufferin-Guelph HU | 29.0 | (26.1, 31.9) |
| Western Regional | 44.9 | (40.9, 48.9) |
| Windsor-Essex County HU | 32.7 | (29.6, 35.8) |
| Winnipeg RHA | 26.5 | (24.4, 28.5) |
| Yukon | 34.4 | (31.7, 37.2) |
| York Regional HU | 19.4 | (17.2, 21.7) |
| Zone 1 (Moncton area) | 37.9 | (34.3, 41.4) |
| Zone 1 - Western | 37.3 | (34.4, 40.3) |
| Zone 2 (Saint John area) | 38.2 | (34.2, 42.1) |
| Zone 2 - Northern | 37.7 | (34.4, 41.0) |
| Zone 3 (Fredericton area) | 37.0 | (33.3, 40.8) |
| Zone 3 - Eastern | 38.7 | (35.4, 42.0) |
| Zone 4 (Edmundston area) | 38.3 | (33.2, 43.5) |
| Zone 4 - Central | 30.5 | (28.1, 32.8) |
| Zone 5 (Campbellton area) | 39.7 | (32.3, 47.1) |
| Zone 6 (Bathurst area) | 33.2 | (29.5, 36.9) |
| Zone 7 (Miramichi area) | 41.2 | (35.4, 47.0) |
Data sources: 2015-2018 Canadian Community Health Survey. |
||
| Time period | Both Sexes | Males | Females | |||
|---|---|---|---|---|---|---|
| % | 95% |
% | 95% |
% | 95% |
|
| Adults aged 18 years or olderFootnote d | ||||||
| 2000-2001 | 20.6 | (20.2, 21.0) | 21.2 | (20.6, 21.7) | 20.0 | (19.5, 20.5) |
| 2003 | 21.2 Footnote a | (20.8, 21.6) | 22.2 Footnote a | (21.7, 22.8) | 20.1 | (19.6, 20.6) |
| 2005 | 21.9 Footnote aFootnote b | (21.5, 22.3) | 23.1 Footnote aFootnote b | (22.5, 23.6) | 20.7 | (20.2, 21.2) |
| 2007-2008 | 23.2 Footnote aFootnote bFootnote c | (22.8, 23.6) | 24.3 Footnote aFootnote bFootnote c | (23.8, 24.9) | 22.1 Footnote aFootnote bFootnote c | (21.6, 22.6) |
| 2009-2010 | 23.8 Footnote aFootnote bFootnote c | (23.4, 24.3) | 25.2 Footnote aFootnote bFootnote c | (24.6, 25.9) | 22.4 Footnote bFootnote c | (21.8, 23.0) |
| 2011-2012 | 24.8 Footnote aFootnote bFootnote c | (24.3, 25.2) | 26.0 Footnote bFootnote c | (25.3, 26.6) | 23.6 Footnote aFootnote bFootnote c | (22.9, 24.2) |
| 2013-2014 | 26.1 Footnote aFootnote bFootnote c | (25.6, 26.6) | 27.9 Footnote aFootnote bFootnote c | (27.1, 28.6) | 24.4 Footnote bFootnote c | (23.7, 25.0) |
| 2015-2016 | 26.4 Footnote bFootnote c | (26.0, 26.9) | 28.1 Footnote bFootnote c | (27.4, 28.8) | 24.8 Footnote bFootnote c | (24.1, 25.4) |
| 2017-2018 | 26.9 Footnote bFootnote c | (26.4, 27.4) | 27.9 Footnote c | (27.2, 28.6) | 25.9 Footnote aFootnote bFootnote c | (25.3, 26.6) |
| 2019-2020 | 28.2 Footnote aFootnote bFootnote c | (27.7, 28.7) | 28.7 | (28.0, 29.5) | 27.7 Footnote aFootnote bFootnote c | (26.9, 28.4) |
| Adults aged 18 to 79 yearsFootnote d | ||||||
| 2000-2001 | 20.8 | (20.4, 21.2) | 21.4 | (20.8, 21.9) | 20.2 | (19.7, 20.7) |
| 2003 | 21.4 Footnote a | (21.0, 21.8) | 22.5 Footnote a | (21.9, 23.0) | 20.4 | (19.9, 20.9) |
| 2005 | 22.1 Footnote aFootnote b | (21.7, 22.5) | 23.3 Footnote aFootnote b | (22.8, 23.9) | 20.9 | (20.4, 21.4) |
| 2007-2008 | 23.4 Footnote aFootnote bFootnote c | (23.0, 23.8) | 24.6 Footnote aFootnote bFootnote c | (24.0, 25.2) | 22.2 Footnote aFootnote bFootnote c | (21.7, 22.8) |
| 2009-2010 | 24.1 Footnote aFootnote bFootnote c | (23.6, 24.5) | 25.5 Footnote bFootnote c | (24.8, 26.2) | 22.6 Footnote bFootnote c | (22.0, 23.2) |
| 2011-2012 | 25.1 Footnote aFootnote bFootnote c | (24.6, 25.6) | 26.3 Footnote bFootnote c | (25.6, 26.9) | 23.9 Footnote aFootnote bFootnote c | (23.2, 24.6) |
| 2013-2014 | 26.4 Footnote aFootnote bFootnote c | (25.9, 26.9) | 28.2 Footnote aFootnote bFootnote c | (27.4, 29.0) | 24.6 Footnote bFootnote c | (23.9, 25.2) |
| 2015-2016 | 26.7 Footnote bFootnote c | (26.3, 27.2) | 28.4 Footnote bFootnote c | (27.6, 29.1) | 25.1 Footnote bFootnote c | (24.4, 25.7) |
| 2017-2018 | 27.2 Footnote bFootnote c | (26.7, 27.7) | 28.2 Footnote c | (27.5, 28.9) | 26.1 Footnote aFootnote bFootnote c | (25.4, 26.8) |
| 2019-2020 | 28.5 Footnote aFootnote bFootnote c | (28.0, 29.1) | 29.1 | (28.3, 29.9) | 28.0 Footnote aFootnote bFootnote c | (27.2, 28.7) |
Data sources: 2000-2001 to 2019-2020 Canadian Community Health Survey (share files).
|
||||||
| Time period | Both Sexes | Males | Females | |||
|---|---|---|---|---|---|---|
| % | 95% |
% | 95% |
% | 95% |
|
| Adults aged 18 years or older | ||||||
| 2000-2001 | 20.9 | (20.6, 21.3) | 21.4 | (20.8, 21.9) | 20.4 | (19.9, 20.9) |
| 2003 | 21.5 | (21.1, 21.8) | 22.4 | (21.8, 22.9) | 20.4 | (19.9, 20.9) |
| 2005 | 22.1 | (21.7, 22.4) | 23.1 | (22.6, 23.7) | 20.9 | (20.3, 21.4) |
| 2007-2008 | 23.3 | (22.9, 23.6) | 24.4 | (23.8, 25.0) | 22.1 | (21.5, 22.6) |
| 2009-2010 | 23.8 | (23.4, 24.3) | 25.3 | (24.6, 25.9) | 22.3 | (21.7, 22.9) |
| 2011-2012 | 24.7 | (24.2, 25.2) | 25.9 | (25.3, 26.6) | 23.4 | (22.8, 24.1) |
| 2013-2014 | 26.0 | (25.5, 26.5) | 27.9 | (27.1, 28.6) | 24.1 | (23.4, 24.7) |
| 2015-2016 | 26.3 | (25.8, 26.8) | 28.0 | (27.3, 28.8) | 24.5 | (23.9, 25.2) |
| 2017-2018 | 26.8 | (26.3, 27.3) | 27.9 | (27.2, 28.5) | 25.6 | (24.9, 26.3) |
| 2019-2020 | 28.1 | (27.5, 28.6) | 28.8 | (28.0, 29.6) | 27.3 | (26.6, 28.1) |
Data sources: 2000-2001 to 2019-2020 Canadian Community Health Survey (share files). |
||||||
| Time period | Both Sexes | Males | Females | |||
|---|---|---|---|---|---|---|
| % | 95% |
% | 95% |
% | 95% |
|
| Age 18-34 yearsFootnote d | ||||||
| 2000-2001 | 15.1 | (14.5, 15.7) | 16.3 | (15.4, 17.2) | 13.8 | (13.0, 14.6) |
| 2003 | 15.7 | (15.1, 16.3) | 17.5 | (16.6, 18.5) | 13.7 | (12.8, 14.5) |
| 2005 | 15.7 | (15.2, 16.3) | 17.2 | (16.4, 18.0) | 14.1 | (13.4, 14.9) |
| 2007-2008 | 16.4 Footnote c | (15.7, 17.0) | 17.8 Footnote c | (16.9, 18.8) | 14.8 | (14.0, 15.6) |
| 2009-2010 | 17.1 Footnote bFootnote c | (16.3, 17.9) | 18.8 Footnote b | (17.7, 20.0) | 15.2 Footnote c | (14.2, 16.2) |
| 2011-2012 | 16.7 | (15.9, 17.5) | 17.3 | (16.1, 18.5) | 16.0 Footnote c | (15.0, 17.1) |
| 2013-2014 | 18.8 Footnote aFootnote bFootnote c | (18.0, 19.7) | 21.1 Footnote aFootnote bFootnote c | (19.7, 22.4) | 16.4 Footnote c | (15.3, 17.4) |
| 2015-2016 | 18.3 Footnote bFootnote c | (17.5, 19.2) | 19.2 Footnote aFootnote b | (17.9, 20.4) | 17.4 Footnote c | (16.3, 18.5) |
| 2017-2018 | 19.3 Footnote c | (18.4, 20.1) | 20.0 Footnote c | (18.7, 21.2) | 18.5 Footnote bFootnote c | (17.3, 19.6) |
| 2019-2020 | 20.8 Footnote aFootnote bFootnote c | (19.7, 21.9) | 20.8 | (19.2, 22.3) | 20.9 Footnote aFootnote bFootnote c | (19.4, 22.3) |
| Age 35-49 yearsFootnote d | ||||||
| 2000-2001 | 21.6 | (20.9, 22.2) | 23.0 | (22.1, 23.9) | 20.1 | (19.2, 21.0) |
| 2003 | 21.3 | (20.6, 22.0) | 23.1 | (22.1, 24.1) | 19.4 | (18.4, 20.4) |
| 2005 | 22.7 Footnote aFootnote b | (22.0, 23.5) | 25.4 Footnote aFootnote b | (24.2, 26.6) | 19.9 | (19.0, 20.9) |
| 2007-2008 | 24.0 Footnote aFootnote bFootnote c | (23.2, 24.8) | 26.1 Footnote bFootnote c | (24.9, 27.2) | 21.9 Footnote aFootnote bFootnote c | (20.7, 23.0) |
| 2009-2010 | 24.6 Footnote bFootnote c | (23.7, 25.5) | 27.3 Footnote bFootnote c | (25.9, 28.7) | 21.8 Footnote bFootnote c | (20.6, 23.1) |
| 2011-2012 | 27.4 Footnote aFootnote bFootnote c | (26.4, 28.4) | 30.3 Footnote aFootnote bFootnote c | (28.9, 31.7) | 24.3 Footnote aFootnote bFootnote c | (22.9, 25.7) |
| 2013-2014 | 27.9 Footnote bFootnote c | (26.7, 29.0) | 31.3 Footnote bFootnote c | (29.5, 33.0) | 24.3 Footnote bFootnote c | (22.9, 25.7) |
| 2015-2016 | 29.7 Footnote aFootnote bFootnote c | (28.6, 30.8) | 32.9 Footnote bFootnote c | (31.3, 34.4) | 26.4 Footnote aFootnote bFootnote c | (25.1, 27.8) |
| 2017-2018 | 29.8 Footnote bFootnote c | (28.7, 30.9) | 31.3 | (29.8, 32.8) | 28.3 Footnote bFootnote c | (26.8, 29.7) |
| 2019-2020 | 31.0 Footnote c | (29.8, 32.2) | 32.1 | (30.4, 33.8) | 29.8 Footnote bFootnote c | (28.2, 31.4) |
| Age 50-64 yearsFootnote d | ||||||
| 2000-2001 | 26.6 | (25.7, 27.4) | 26.5 | (25.3, 27.7) | 26.7 | (25.5, 27.8) |
| 2003 | 27.7 | (26.9, 28.6) | 28.0 | (26.8, 29.2) | 27.4 | (26.3, 28.6) |
| 2005 | 27.9 Footnote b | (27.0, 28.7) | 28.4 Footnote b | (27.2, 29.7) | 27.3 | (26.1, 28.4) |
| 2007-2008 | 29.2 Footnote aFootnote bFootnote c | (28.3, 30.0) | 30.2 Footnote aFootnote bFootnote c | (29.0, 31.5) | 28.1 | (27.0, 29.2) |
| 2009-2010 | 29.5 Footnote bFootnote c | (28.4, 30.5) | 30.5 Footnote bFootnote c | (29.0, 32.0) | 28.4 | (27.1, 29.7) |
| 2011-2012 | 30.4 Footnote bFootnote c | (29.4, 31.5) | 31.8 Footnote c | (30.3, 33.3) | 29.1 Footnote c | (27.7, 30.6) |
| 2013-2014 | 31.3 Footnote bFootnote c | (30.4, 32.3) | 32.5 Footnote c | (31.1, 33.9) | 30.2 Footnote bFootnote c | (28.9, 31.5) |
| 2015-2016 | 31.4 Footnote c | (30.4, 32.3) | 33.6 Footnote c | (32.3, 35.0) | 29.0 | (27.7, 30.3) |
| 2017-2018 | 31.6 | (30.6, 32.6) | 33.5 | (32.2, 34.8) | 29.6 | (28.2, 30.9) |
| 2019-2020 | 33.2 [a]Footnote bFootnote c | (32.2, 34.3) | 34.3 | (32.8, 35.8) | 32.1 Footnote aFootnote b | (30.6, 33.6) |
| Age 65-79 yearsFootnote d | ||||||
| 2000-2001 | 22.5 | (21.6, 23.5) | 20.9 | (19.6, 22.3) | 23.9 | (22.5, 25.2) |
| 2003 | 23.5 | (22.6, 24.5) | 22.5 | (21.1, 23.9) | 24.5 | (23.3, 25.7) |
| 2005 | 24.6 Footnote b | (23.7, 25.4) | 22.9 Footnote b | (21.7, 24.2) | 26.0 Footnote b | (24.8, 27.2) |
| 2007-2008 | 26.8 Footnote aFootnote bFootnote c | (25.8, 27.8) | 26.3 Footnote aFootnote bFootnote c | (24.8, 27.8) | 27.2 Footnote bFootnote c | (26.0, 28.5) |
| 2009-2010 | 27.3 Footnote bFootnote c | (26.4, 28.2) | 26.6 Footnote bFootnote c | (25.2, 28.1) | 27.9 Footnote bFootnote c | (26.7, 29.2) |
| 2011-2012 | 27.7 Footnote c | (26.7, 28.7) | 27.0 Footnote c | (25.5, 28.5) | 28.2 Footnote c | (26.9, 29.6) |
| 2013-2014 | 29.0 Footnote aFootnote bFootnote c | (28.1, 30.0) | 29.0 Footnote aFootnote bFootnote c | (27.7, 30.4) | 29.1 Footnote c | (27.8, 30.4) |
| 2015-2016 | 29.3 Footnote bFootnote c | (28.3, 30.4) | 29.1 Footnote bFootnote c | (27.7, 30.6) | 29.5 | (28.1, 31.0) |
| 2017-2018 | 29.9 Footnote c | (28.9, 30.8) | 29.6 Footnote c | (28.3, 31.0) | 30.1 | (28.8, 31.4) |
| 2019-2020 | 30.4 Footnote c | (29.5, 31.3) | 30.9 | (29.4, 32.3) | 30.0 | (28.8, 31.2) |
| Age 80 years or olderFootnote d | ||||||
| 2000-2001 | 14.9 | (13.3, 16.4) | 12.7 | (10.4, 15.0) | 16.2 | (14.1, 18.3) |
| 2003 | 13.8 | (12.6, 15.1) | 12.7 | (10.6, 14.8) | 14.5 | (12.9, 16.0) |
| 2005 | 15.6 | (14.1, 17.1) | 13.4 | (11.2, 15.5) | 17.0 Footnote a | (15.0, 18.9) |
| 2007-2008 | 17.1 Footnote bFootnote c | (15.6, 18.5) | 14.0 | (11.7, 16.3) | 19.1 Footnote bFootnote c | (17.2, 21.0) |
| 2009-2010 | 17.1 Footnote c | (15.7, 18.6) | 15.6 | (13.5, 17.8) | 18.0 Footnote c | (16.1, 19.9) |
| 2011-2012 | 16.3 | (14.9, 17.7) | 15.9 | (13.6, 18.2) | 16.6 | (14.7, 18.4) |
| 2013-2014 | 18.8 Footnote a | (17.3, 20.3) | 16.6 | (14.5, 18.6) | 20.3 Footnote a | (18.2, 22.4) |
| 2015-2016 | 17.6 | (16.2, 19.0) | 17.4 | (15.0, 19.7) | 17.8 | (15.9, 19.7) |
| 2017-2018 | 20.0 Footnote aFootnote c | (18.4, 21.5) | 18.1 | (15.7, 20.5) | 21.4 Footnote aFootnote c | (19.3, 23.4) |
| 2019-2020 | 20.2 Footnote b | (18.6, 21.8) | 19.2 | (16.9, 21.6) | 21.0 Footnote b | (18.8, 23.1) |
|
||||||
| Time period | Both Sexes | Males | Females | |||
|---|---|---|---|---|---|---|
| % | 95% |
% | 95% |
% | 95% |
|
| Household income quintile 1Footnote d | ||||||
| 2000-2001 | 21.7 | (20.9, 22.6) | 19.1 | (17.8, 20.4) | 23.6 | (22.5, 24.7) |
| 2003 | 22.2 | (21.3, 23.2) | 20.6 | (19.2, 22.1) | 23.4 | (22.2, 24.6) |
| 2005 | 21.7 | (20.9, 22.5) | 20.1 | (18.8, 21.4) | 22.9 | (21.8, 24.0) |
| 2007-2008 | 23.6 Footnote aFootnote c | (22.5, 24.6) | 22.5 Footnote aFootnote c | (20.7, 24.4) | 24.3 | (23.1, 25.6) |
| 2009-2010 | 23.5 Footnote b | (22.5, 24.6) | 21.4 | (19.8, 22.9) | 25.1 Footnote b | (23.7, 26.5) |
| 2011-2012 | 23.7 Footnote c | (22.7, 24.7) | 21.6 | (20.0, 23.2) | 25.2 Footnote c | (23.8, 26.7) |
| 2013-2014 | 25.5 Footnote aFootnote bFootnote c | (24.4, 26.7) | 24.8 Footnote aFootnote b | (22.9, 26.7) | 26.1 | (24.6, 27.6) |
| 2015-2016 | 26.7 Footnote bFootnote c | (25.6, 27.9) | 25.5 Footnote bFootnote c | (23.7, 27.3) | 27.7 Footnote bFootnote c | (26.3, 29.2) |
| 2017-2018 | 27.3 Footnote bFootnote c | (26.3, 28.4) | 24.6 Footnote c | (23.1, 26.2) | 29.5 Footnote bFootnote c | (28.0, 30.9) |
| 2019-2020 | 28.3 Footnote c | (27.0, 29.5) | 26.2 | (24.3, 28.1) | 29.9 Footnote bFootnote c | (28.4, 31.5) |
| Household income quintile 2Footnote d | ||||||
| 2000-2001 | 22.1 | (21.3, 23.0) | 21.6 | (20.3, 22.8) | 22.7 | (21.5, 23.9) |
| 2003 | 22.8 | (21.8, 23.8) | 23.1 | (21.7, 24.5) | 22.5 | (21.2, 23.8) |
| 2005 | 21.8 | (20.9, 22.6) | 21.1 Footnote a | (20.0, 22.3) | 22.3 | (21.2, 23.4) |
| 2007-2008 | 22.9 | (22.0, 23.8) | 22.1 | (20.8, 23.5) | 23.6 | (22.4, 24.8) |
| 2009-2010 | 23.4 Footnote b | (22.3, 24.4) | 24.0 Footnote b | (22.4, 25.5) | 22.8 | (21.5, 24.1) |
| 2011-2012 | 24.1 Footnote c | (23.0, 25.2) | 23.6 Footnote c | (22.0, 25.2) | 24.5 Footnote c | (23.0, 25.9) |
| 2013-2014 | 26.3 Footnote aFootnote bFootnote c | (25.2, 27.4) | 26.5 Footnote aFootnote bFootnote c | (24.8, 28.3) | 26.0 Footnote bFootnote c | (24.6, 27.5) |
| 2015-2016 | 26.3 Footnote bFootnote c | (25.2, 27.4) | 27.2 Footnote bFootnote c | (25.6, 28.8) | 25.5 Footnote c | (24.0, 27.0) |
| 2017-2018 | 27.3 Footnote c | (26.2, 28.4) | 26.8 Footnote c | (25.1, 28.5) | 27.9 Footnote aFootnote c | (26.4, 29.3) |
| 2019-2020 | 28.1 Footnote bFootnote c | (26.8, 29.5) | 27.6 | (25.6, 29.7) | 28.6 Footnote bFootnote c | (26.9, 30.2) |
| Household income quintile 3Footnote d | ||||||
| 2000-2001 | 20.7 | (19.8, 21.6) | 21.5 | (20.3, 22.8) | 19.8 | (18.5, 21.0) |
| 2003 | 22.0 Footnote a | (21.1, 22.9) | 23.1 | (21.8, 24.4) | 20.8 | (19.5, 22.2) |
| 2005 | 22.8 Footnote b | (21.9, 23.6) | 24.8 Footnote b | (23.4, 26.1) | 20.8 | (19.7, 21.8) |
| 2007-2008 | 23.4 Footnote bFootnote c | (22.5, 24.2) | 24.2 Footnote c | (22.8, 25.6) | 22.5 Footnote c | (21.3, 23.8) |
| 2009-2010 | 24.2 Footnote bFootnote c | (23.2, 25.3) | 25.0 | (23.5, 26.5) | 23.5 Footnote bFootnote c | (22.1, 24.9) |
| 2011-2012 | 25.2 Footnote bFootnote c | (24.1, 26.3) | 26.0 | (24.5, 27.5) | 24.4 Footnote bFootnote c | (23.0, 25.8) |
| 2013-2014 | 26.9 Footnote aFootnote bFootnote c | (25.8, 28.0) | 28.4 Footnote aFootnote bFootnote c | (26.7, 30.1) | 25.4 Footnote bFootnote c | (24.0, 26.8) |
| 2015-2016 | 26.1 Footnote c | (25.0, 27.2) | 27.7 Footnote c | (26.2, 29.3) | 24.5 | (23.0, 26.0) |
| 2017-2018 | 28.0 Footnote aFootnote c | (26.9, 29.1) | 29.1 Footnote c | (27.5, 30.7) | 26.8 Footnote aFootnote c | (25.3, 28.3) |
| 2019-2020 | 28.1 Footnote b | (26.8, 29.4) | 28.6 | (26.8, 30.4) | 27.6 Footnote b | (25.9, 29.4) |
| Household income quintile 4Footnote d | ||||||
| 2000-2001 | 20.5 | (19.7, 21.4) | 22.0 | (20.9, 23.2) | 18.8 | (17.7, 20.0) |
| 2003 | 20.4 | (19.5, 21.2) | 22.6 | (21.4, 23.8) | 17.7 | (16.5, 19.0) |
| 2005 | 22.3Footnote aFootnote b | (21.4, 23.3) | 24.5 Footnote aFootnote b | (23.2, 25.9) | 19.9 Footnote a | (18.6, 21.2) |
| 2007-2008 | 23.4 Footnote bFootnote c | (22.5, 24.3) | 25.9 Footnote bFootnote c | (24.6, 27.3) | 20.6 Footnote bFootnote c | (19.4, 21.7) |
| 2009-2010 | 23.6 Footnote bFootnote c | (22.7, 24.6) | 27.1 Footnote bFootnote c | (25.7, 28.6) | 19.7 Footnote c | (18.4, 20.9) |
| 2011-2012 | 25.0 Footnote bFootnote c | (23.9, 26.1) | 27.0 Footnote c | (25.6, 28.5) | 22.7 Footnote aFootnote bFootnote c | (21.2, 24.1) |
| 2013-2014 | 26.1 Footnote bFootnote c | (25.1, 27.2) | 28.8 Footnote c | (27.2, 30.5) | 23.1 Footnote bFootnote c | (21.7, 24.6) |
| 2015-2016 | 26.9 Footnote bFootnote c | (25.9, 28.0) | 29.8 Footnote bFootnote c | (28.3, 31.4) | 23.8 Footnote c | (22.4, 25.1) |
| 2017-2018 | 26.9 Footnote c | (25.9, 27.9) | 30.1 Footnote c | (28.6, 31.6) | 23.4 | (22.1, 24.8) |
| 2019-2020 | 28.8 Footnote aFootnote bFootnote c | (27.5, 30.0) | 30.6 | (28.8, 32.4) | 26.7 Footnote aFootnote bFootnote c | (25.1, 28.4) |
| Household income quintile 5Footnote d | ||||||
| 2000-2001 | 19.8 | (19.0, 20.6) | 22.5 | (21.4, 23.5) | 16.1 | (15.0, 17.2) |
| 2003 | 20.4 | (19.5, 21.2) | 23.1 | (21.9, 24.2) | 16.6 | (15.4, 17.7) |
| 2005 | 20.9 Footnote b | (20.1, 21.7) | 23.8 | (22.7, 24.9) | 17.0 | (16.0, 18.1) |
| 2007-2008 | 22.9 Footnote aFootnote bFootnote c | (22.0, 23.7) | 26.0 Footnote aFootnote bFootnote c | (24.8, 27.2) | 18.7 Footnote aFootnote bFootnote c | (17.5, 19.8) |
| 2009-2010 | 24.3 Footnote aFootnote bFootnote c | (23.3, 25.4) | 27.4 Footnote bFootnote c | (26.0, 28.7) | 20.3 Footnote bFootnote c | (18.9, 21.7) |
| 2011-2012 | 25.8 Footnote bFootnote c | (24.7, 26.9) | 29.8 Footnote aFootnote bFootnote c | (28.3, 31.4) | 20.7 Footnote bFootnote c | (19.2, 22.1) |
| 2013-2014 | 25.8 Footnote bFootnote c | (24.8, 26.8) | 29.6 Footnote bFootnote c | (28.2, 31.1) | 20.6 Footnote c | (19.3, 21.8) |
| 2015-2016 | 26.1 Footnote c | (25.1, 27.1) | 29.2 | (27.8, 30.6) | 21.9 | (20.6, 23.2) |
| 2017-2018 | 25.1 | (24.1, 26.1) | 28.2 | (26.8, 29.5) | 21.5 | (20.2, 22.7) |
| 2019-2020 | 27.7 Footnote aFootnote bFootnote c | (26.5, 28.9) | 30.0 | (28.4, 31.6) | 25.0 Footnote aFootnote bFootnote c | (23.3, 26.6) |
Data sources: 2000-2001 to 2019-2020 Canadian Community Health Survey (share files).
|
||||||
| Highest level of education in household Time period |
Both Sexes | Males | Females | |||
|---|---|---|---|---|---|---|
| % | 95% |
% | 95% |
% | 95% |
|
| Less than secondary school graduationFootnote d | ||||||
| 2000-2001 | 26.0 | (25.1, 26.9) | 23.8 | (22.3, 25.2) | 27.9 | (26.7, 29.1) |
| 2003 | 27.9 Footnote a | (26.7, 29.0) | 25.8 | (24.1, 27.6) | 29.5 | (28.0, 30.9) |
| 2005 | 28.7 Footnote b | (27.6, 29.8) | 26.3 Footnote b | (24.6, 28.1) | 30.5 Footnote b | (28.9, 32.1) |
| 2007-2008 | 29.3 Footnote c | (27.9, 30.6) | 27.0 Footnote c | (24.7, 29.3) | 31.1 Footnote c | (29.5, 32.8) |
| 2009-2010 | 29.5 | (28.1, 30.9) | 26.6 | (24.5, 28.7) | 31.8 | (29.9, 33.7) |
| 2011-2012 | 31.7 Footnote aFootnote bFootnote c | (30.0, 33.4) | 28.8 | (26.4, 31.2) | 34.0 Footnote bFootnote c | (31.8, 36.2) |
| 2013-2014 | 31.0 | (29.5, 32.6) | 29.0 | (26.6, 31.3) | 32.7 | (30.7, 34.8) |
| 2015-2016 | 32.8 Footnote c | (31.3, 34.4) | 32.1 Footnote c | (29.6, 34.6) | 33.4 | (31.4, 35.4) |
| 2017-2018 | 33.3 Footnote b | (31.6, 34.9) | 30.8 | (28.1, 33.4) | 35.4 | (33.2, 37.6) |
| 2019-2020 | 33.6 Footnote c | (31.7, 35.5) | 31.5 | (28.9, 34.0) | 35.3 | (32.9, 37.8) |
| Secondary school graduationFootnote d | ||||||
| 2000-2001 | 21.3 | (20.5, 22.0) | 21.8 | (20.6, 23.0) | 20.8 | (19.7, 21.8) |
| 2003 | 23.3 Footnote a | (22.4, 24.2) | 24.4 Footnote a | (23.0, 25.7) | 22.3 | (21.0, 23.6) |
| 2005 | 25.2 Footnote aFootnote bFootnote c | (24.3, 26.1) | 25.4 Footnote b | (24.1, 26.7) | 25.1 Footnote aFootnote b | (23.8, 26.3) |
| 2007-2008 | 25.5 Footnote bFootnote c | (24.5, 26.5) | 25.7 Footnote c | (24.3, 27.2) | 25.3 Footnote bFootnote c | (23.9, 26.7) |
| 2009-2010 | 26.5 Footnote c | (25.3, 27.8) | 26.2 | (24.4, 28.0) | 26.8 Footnote c | (25.2, 28.4) |
| 2011-2012 | 28.0 Footnote bFootnote c | (26.7, 29.3) | 27.5 | (25.7, 29.3) | 28.5 Footnote bFootnote c | (26.7, 30.3) |
| 2013-2014 | 30.2 Footnote aFootnote bFootnote c | (29.0, 31.4) | 31.2 Footnote aFootnote bFootnote c | (29.4, 33.0) | 29.2 Footnote bFootnote c | (27.6, 30.8) |
| 2015-2016 | 30.8 Footnote bFootnote c | (29.6, 32.0) | 30.7 Footnote bFootnote c | (28.9, 32.5) | 30.9 Footnote c | (29.2, 32.5) |
| 2017-2018 | 30.3 Footnote c | (29.1, 31.5) | 30.8 Footnote c | (29.0, 32.5) | 29.8 | (28.2, 31.4) |
| 2019-2020 | 32.3 Footnote aFootnote c | (30.9, 33.7) | 32.3 | (30.3, 34.3) | 32.3 Footnote c | (30.4, 34.2) |
| Post-secondary certificate, diploma or university degreeFootnote d | ||||||
| 2000-2001 | 19.4 | (18.9, 19.8) | 20.5 | (19.8, 21.1) | 18.2 | (17.6, 18.8) |
| 2003 | 19.8 | (19.3, 20.2) | 21.2 | (20.5, 21.9) | 18.3 | (17.7, 18.8) |
| 2005 | 20.7 Footnote aFootnote b | (20.2, 21.2) | 22.6 Footnote aFootnote b | (21.9, 23.3) | 18.9 | (18.3, 19.4) |
| 2007-2008 | 22.4 Footnote aFootnote bFootnote c | (21.9, 22.8) | 24.1 Footnote aFootnote bFootnote c | (23.4, 24.9) | 20.6 Footnote aFootnote bFootnote c | (20.0, 21.2) |
| 2009-2010 | 22.8 Footnote bFootnote c | (22.2, 23.3) | 25.1 Footnote bFootnote c | (24.3, 25.9) | 20.4 Footnote bFootnote c | (19.8, 21.1) |
| 2011-2012 | 24.0 Footnote aFootnote bFootnote c | (23.4, 24.6) | 25.7 Footnote bFootnote c | (24.9, 26.5) | 22.3 Footnote aFootnote bFootnote c | (21.5, 23.1) |
| 2013-2014 | 24.9 Footnote aFootnote bFootnote c | (24.3, 25.5) | 27.1 Footnote aFootnote bFootnote c | (26.2, 28.0) | 22.6 Footnote bFootnote c | (21.9, 23.3) |
| 2015-2016 | 25.2 Footnote bFootnote c | (24.6, 25.7) | 27.4 Footnote bFootnote c | (26.6, 28.2) | 22.9 Footnote c | (22.2, 23.6) |
| 2017-2018 | 25.8 Footnote bFootnote c | (25.2, 26.4) | 27.3 Footnote c | (26.5, 28.1) | 24.3 Footnote aFootnote bFootnote c | (23.5, 25.1) |
| 2019-2020 | 27.3 Footnote aFootnote bFootnote c | (26.6, 27.9) | 28.1 | (27.2, 29.0) | 26.4 Footnote aFootnote bFootnote c | (25.6, 27.2) |
Data sources: 2000-2001 to 2019-2020 Canadian Community Health Survey (share files).
|
||||||
| Time period | Both Sexes | Males | Females | |||
|---|---|---|---|---|---|---|
| % | 95% |
% | 95% |
% | 95% |
|
| Adults aged 18 years or olderFootnote d | ||||||
| 2000-2001 | 1.6 | (1.5, 1.7) | 1.3 | (1.1, 1.4) | 2.0 | (1.8, 2.1) |
| 2003 | 1.8 Footnote a | (1.7, 1.9) | 1.6 Footnote a | (1.4, 1.8) | 2.0 | (1.9, 2.2) |
| 2005 | 1.9 Footnote b | (1.8, 2.1) | 1.5 Footnote b | (1.4, 1.7) | 2.4 Footnote aFootnote b | (2.2, 2.5) |
| 2007-2008 | 2.3 Footnote aFootnote bFootnote c | (2.2, 2.4) | 1.8 Footnote aFootnote c | (1.6, 2.0) | 2.8 Footnote aFootnote bFootnote c | (2.6, 3.0) |
| 2009-2010 | 2.4 Footnote bFootnote c | (2.2, 2.5) | 2.0 Footnote bFootnote c | (1.8, 2.2) | 2.8 Footnote bFootnote c | (2.6, 3.0) |
| 2011-2012 | 2.5 Footnote bFootnote c | (2.4, 2.7) | 2.0 Footnote c | (1.8, 2.2) | 3.1 Footnote c | (2.8, 3.3) |
| 2013-2014 | 2.8 Footnote aFootnote bFootnote c | (2.6, 3.0) | 2.3 Footnote aFootnote bFootnote c | (2.1, 2.6) | 3.3 Footnote bFootnote c | (3.0, 3.5) |
| 2015-2016 | 2.9 Footnote bFootnote c | (2.7, 3.0) | 2.4 Footnote bFootnote c | (2.2, 2.6) | 3.4 Footnote c | (3.1, 3.6) |
| 2017-2018 | 3.2 Footnote aFootnote bFootnote c | (3.0, 3.4) | 2.6 Footnote c | (2.4, 2.9) | 3.8 Footnote aFootnote bFootnote c | (3.6, 4.1) |
| 2019-2020 | 3.5 Footnote bFootnote c | (3.2, 3.7) | 2.9 Footnote bFootnote c | (2.6, 3.2) | 4.0 Footnote bFootnote c | (3.6, 4.3) |
Data sources: 2000-2001 to 2019-2020 Canadian Community Health Survey (share files).
|
||||||
| Time period | Both Sexes | Males | Females | |||
|---|---|---|---|---|---|---|
| % | 95% |
% | 95% |
% | 95% |
|
| Adults aged 18 years or older | ||||||
| 2000-2001 | 1.6 | (1.5, 1.7) | 1.3 | (1.1, 1.4) | 2.0 | (1.8, 2.1) |
| 2003 | 1.8 | (1.7, 2.0) | 1.6 | (1.4, 1.8) | 2.1 | (1.9, 2.3) |
| 2005 | 1.9 | (1.8, 2.0) | 1.5 | (1.3, 1.6) | 2.4 | (2.2, 2.5) |
| 2007-2008 | 2.3 | (2.1, 2.4) | 1.8 | (1.6, 1.9) | 2.8 | (2.6, 3.0) |
| 2009-2010 | 2.4 | (2.2, 2.5) | 2.0 | (1.8, 2.2) | 2.8 | (2.5, 3.0) |
| 2011-2012 | 2.5 | (2.4, 2.7) | 2.0 | (1.8, 2.2) | 3.0 | (2.8, 3.3) |
| 2013-2014 | 2.8 | (2.6, 3.0) | 2.3 | (2.1, 2.6) | 3.3 | (3.0, 3.5) |
| 2015-2016 | 2.9 | (2.7, 3.0) | 2.4 | (2.2, 2.6) | 3.4 | (3.1, 3.6) |
| 2017-2018 | 3.2 | (3.0, 3.4) | 2.6 | (2.4, 2.9) | 3.9 | (3.6, 4.1) |
| 2019-2020 | 3.5 | (3.2, 3.7) | 3.0 | (2.6, 3.3) | 4.0 | (3.6, 4.3) |
Data sources: 2000-2001 to 2019-2020 Canadian Community Health Survey (share files). |
||||||
| Time period | Both Sexes | Males | Females | |||
|---|---|---|---|---|---|---|
| % | 95% |
% | 95% |
% | 95% |
|
| Adults aged 18 years or older | ||||||
| 2004 | 23.1 | (21.7, 24.6) | 22.9 | (20.6, 25.1) | 23.4 | (21.4, 25.3) |
| 2005 | 24.3 | (22.0, 26.6) | 25.6 | (22.4, 28.8) | 23.0 | (20.3, 25.8) |
| 2008 | 25.4 Footnote a | (23.6, 27.2) | 26.4 Footnote a | (23.7, 29.0) | 24.4 | (21.9, 27.0) |
| 2015 | 26.6 Footnote a | (24.9, 28.4) | 28.4 Footnote a | (25.8, 31.0) | 24.9 | (22.7, 27.1) |
| Adults aged 18 to 79 years | ||||||
| 2004 | 23.2 | (21.7, 24.7) | 23.1 | (20.8, 25.4) | 23.3 | (21.3, 25.3) |
| 2005 | 24.6 | (22.3, 27.0) | 25.9 | (22.7, 29.2) | 23.3 | (20.4, 26.2) |
| 2008 | 25.3 | (23.4, 27.2) | 26.4 | (23.7, 29.1) | 24.2 | (21.5, 26.8) |
| 2007-2009/ 2009-2011/ 2012-2013 | 25.6 | (23.3, 27.8) | 26.0 | (23.5, 28.6) | 25.1 | (22.2, 28.0) |
| 2015 | 27.0 Footnote a | (25.2, 28.8) | 28.8 Footnote a | (26.1, 31.4) | 25.2 | (22.9, 27.5) |
| 2014-2015/ 2016-2017/ 2018-2019 | 26.5 Footnote a | (23.6, 29.3) | 27.3 Footnote a | (24.2, 30.5) | 25.5 | (22.3, 28.8) |
Data sources: 2004 and 2015 Canadian Community Health Survey—Nutrition (share files); 2005 and 2008 Canadian Community Health Survey (share files); 2007-2009/2009-2011/2012-2013/2014-2015/2016-2017/2018-2019 Canadian Health Measures Survey (Cycles 1 to 6).
|
||||||
| Time period | Both Sexes | Males | Females | |||
|---|---|---|---|---|---|---|
| % | 95% Confidence Interval | % | 95% Confidence Interval | % | 95% Confidence Interval | |
| 2004 | 23.6 | (22.1, 25.1) | 23.7 | (21.4, 26.0) | 23.5 | (21.6, 25.4) |
| 2005 | 24.8 | (22.5, 27.1) | 26.2 | (23.0, 29.5) | 23.3 | (20.4, 26.1) |
| 2008 | 25.1 | (23.3, 27.0) | 26.5 | (23.8, 29.2) | 23.6 | (21.1, 26.2) |
| 2007-2009/2009-2011/2012-2013 | 25.5 | (23.4, 27.7) | 26.2 | (23.7, 28.7) | 25.0 | (22.1, 27.8) |
| 2015 | 26.3 | (24.5, 28.2) | 28.4 | (25.7, 31.1) | 24.4 | (22.1, 26.7) |
| 2014-2015/2016-2017/2018-2019 | 26.1 | (23.4, 28.9) | 27.2 | (24.1, 30.3) | 25.1 | (21.9, 28.2) |
Data sources: 2004 and 2015 Canadian Community Health Survey—Nutrition (share files); 2005 and 2008 Canadian Community Health Survey (share files); 2007-2009/2009-2011/2012-2013/2014-2015/2016-2017/2018-2019 Canadian Health Measures Survey (Cycles 1 to 6). |
||||||
| Time period | Both Sexes | Males | Females | |||
|---|---|---|---|---|---|---|
| % | 95% |
% | 95% |
% | 95% |
|
| Adults aged 18 years or older | ||||||
| 2004 | 2.7 | (2.2, 3.2) | 1.6 Footnote E | (1.1, 2.1) | 3.8 | (2.9, 4.7) |
| 2005 | 2.1 | (1.5, 2.8) | 1.2 Footnote E | (0.5, 1.9) | 3.1 Footnote E | (1.9, 4.3) |
| 2008 | 2.4 | (1.8, 2.9) | 1.3 Footnote E | (0.8, 1.8) | 3.5 | (2.4, 4.5) |
| 2015 | 2.8 | (2.3, 3.3) | 1.9 | (1.3, 2.5) | 3.7 | (2.9, 4.5) |
| Adults aged 18 to 79 years | ||||||
| 2004 | 2.8 | (2.2, 3.3) | 1.6 Footnote E | (1.1, 2.2) | 3.9 | (3.0, 4.8) |
| 2005 | 2.2 Footnote E | (1.5, 2.9) | 1.2 Footnote E | (0.5, 1.9) | 3.1 Footnote E | (1.9, 4.3) |
| 2008 | 2.3 | (1.7, 2.8) | 1.3 Footnote E | (0.8, 1.8) | 3.2 | (2.2, 4.2) |
| 2007-2009/ 2009-2011/ 2012-2013 | 3.4 Footnote aFootnote b | (2.8, 4.0) | 2.1 | (1.5, 2.6) | 4.8 | (3.5, 6.0) |
| 2015 | 2.9 | (2.4, 3.4) | 2.0 | (1.4, 2.6) | 3.9 | (3.0, 4.7) |
| 2014-2015/ 2016-2017/ 2018-2019 | 4.0 Footnote aFootnote cFootnote d | (3.0, 4.9) | 3.2 Footnote EFootnote cFootnote d | (1.8, 4.6) | 4.8 Footnote c | (3.8, 5.8) |
Data sources: 2004 and 2015 Canadian Community Health Survey—Nutrition (share files); 2005 and 2008 Canadian Community Health Survey (share files); 2007-2009/2009-2011/2012-2013/2014-2015/2016-2017/2018-2019 Canadian Health Measures Survey (Cycles 1 to 6).
|
||||||
| Time period | Both Sexes | Males | Females | |||
|---|---|---|---|---|---|---|
| % | 95% Confidence Interval | % | 95% Confidence Interval | % | 95% Confidence Interval | |
| 2004 | 2.8 | (2.3, 3.3) | 1.7 | (1.1, 2.2) | 3.9 | (3.0, 4.7) |
| 2005 | 2.2 Footnote E | (1.5, 2.9) | 1.3 Footnote E | (0.5, 2.0) | 3.1 Footnote E | (1.9, 4.4) |
| 2008 | 2.2 | (1.7, 2.8) | 1.3 Footnote E | (0.8, 1.8) | 3.2 | (2.2, 4.2) |
| 2007-2009/2009-2011/2012-2013 | 3.4 | (2.8, 4.0) | 2.1 | (1.5, 2.6) | 4.8 | (3.6, 5.9) |
| 2015 | 2.9 | (2.4, 3.4) | 2.0 Footnote E | (1.3, 2.6) | 3.9 | (3.0, 4.8) |
| 2014-2015/2016-2017/2018-2019 | 4.0 | (3.1, 4.9) | 3.2 Footnote E | (1.9, 4.6) | 4.8 | (3.8, 5.7) |
Data sources: 2004 and 2015 Canadian Community Health Survey—Nutrition (share files); 2005 and 2008 Canadian Community Health Survey (share files); 2007-2009/2009-2011/2012-2013/2014-2015/2016-2017/2018-2019 Canadian Health Measures Survey (Cycles 1 to 6).
Note: Rates were age-standardized using the 2011 Canadian population. |
||||||
| Age group (in years) | Both Sexes | Males | Females | |||
|---|---|---|---|---|---|---|
| % | 95% |
% | 95% |
% | 95% |
|
| Total (18+) | ||||||
| Indigenous peoples | 43.8 Footnote b | (39.2, 48.5) | 45.6 Footnote b | (38.1, 53.0) | 41.9 Footnote b | (36.7, 47.2) |
| Non-Indigenous | 29.1 | (28.3, 30.0) | 29.6 | (28.4, 30.9) | 28.6 | (27.5, 29.7) |
| 18-34 | ||||||
| Indigenous peoples | 36.3 Footnote b | (28.9, 43.7) | 36.2 Footnote EFootnote b | (25.5, 47.0) | 36.4 Footnote b | (26.7, 46.1) |
| Non-Indigenous | 22.1 | (20.3, 23.9) | 21.9 | (19.3, 24.4) | 22.3 | (19.8, 24.8) |
| 35-49 | ||||||
| Indigenous peoples | 56.4 Footnote b | (46.5, 66.4) | 58.4 Footnote b | (43.0, 73.8) | 54.2 Footnote b | (43.2, 65.2) |
| Non-Indigenous | 32.2 | (30.5, 33.9) | 33.0 | (30.5, 35.6) | 31.4 | (29.2, 33.6) |
| 50-64 | ||||||
| Indigenous peoples | 43.7 Footnote b | (34.7, 52.6) | 47.0 Footnote E | (31.6, 62.3) | 40.3 | (31.2, 49.5) |
| Non-Indigenous | 33.5 | (31.8, 35.1) | 36.0 | (33.5, 38.4) | 31.0 Footnote a | (28.7, 33.2) |
| 65 or older | ||||||
| Indigenous peoples | 37.7 Footnote b | (30.9, 44.5) | 41.7 Footnote b | (30.6, 52.7) | 34.8 | (26.2, 43.3) |
| Non-Indigenous | 29.3 | (28.1, 30.5) | 28.5 | (26.7, 30.3) | 30.1 | (28.4, 31.7) |
Data source: 2021 Canadian Community Health Survey (share file).
|
||||||
| Age group | Both Sexes | Males | Females | ||||||
|---|---|---|---|---|---|---|---|---|---|
| Population (in thousands) | % | 95% Confidence Interval | Population (in thousands) | % | 95% Confidence Interval | Population (in thousands) | % | 95% Confidence Interval | |
| Measured BMI category (%) (based on World Health Organization BMI cut-points) | |||||||||
| Age 2 to 4 years | |||||||||
| Total | 1 220.8 | 552.1 | 668.6 | ||||||
| Thin | - | Footnote F | - | - | Footnote F | - | - | Footnote F | - |
| Normal weight | 776.0 | 63.6 | (57.9, 69.2) | 353.6 | 64.0 | (56.4, 71.7) | 422.4 | 63.2 | (54.9, 71.4) |
| At risk of overweight | 327.2 | 26.8 | (21.4, 32.2) | 118.2 | 21.4 | (15.3, 27.5) | 209.1 | 31.3 | (23.0, 39.5) |
| Overweight | 55.8 | 4.6 Footnote E | (2.5, 6.7) | 38.8 | 7.0 Footnote E | (3.0, 11.1) | - | Footnote F | - |
| Obesity | 41.1 | 3.4 Footnote E | (1.2, 5.5) | - | Footnote F | - | - | Footnote F | - |
| Overweight/Obesity | 96.9 | 7.9 Footnote E | (5.0, 10.9) | 69.5 | 12.6 Footnote E | (6.9, 18.2) | 27.4 | 4.1 Footnote EFootnote b | (1.9, 6.3) |
| Age 5 to 17 years | |||||||||
| Total | 4 822.9 | 2.452.3 | 2.370.6 | ||||||
| Thin | 130.8 | 2.7 Footnote E | (1.8, 3.7) | 69.5 | 2.8 Footnote E | (1.5, 4.2) | 61.4 | 2.6 Footnote E | (1.2, 4.0) |
| Normal weight | 3 159.3 | 65.5 | (63.1, 68.0) | 1.537.8 | 62.7 | (59.2, 66.2) | 1.621.6 | 68.4 Footnote b | (64.8, 72.0) |
| Overweight | 934.5 | 19.4 | (17.2, 21.5) | 480.9 | 19.6 | (16.4, 22.8) | 453.6 | 19.1 | (16.2, 22.1) |
| Obesity | 598.3 | 12.4 | (10.7, 14.1) | 364.2 | 14.9 | (12.1, 17.6) | 234.1 | 9.9 Footnote b | (7.8, 12.0) |
| Overweight/Obesity | 1 532.8 | 31.8 | (29.4, 34.1) | 845.1 | 34.5 | (30.9, 38.0) | 687.7 | 29.0 Footnote b | (25.5, 32.5) |
| Age 5 to 11 years | |||||||||
| Total | 2 535.0 | 1.288.6 | 1.246.4 | ||||||
| Thin | 45.1 | 1.8 Footnote E | (0.7, 2.9) | - | Footnote F | - | - | Footnote F | - |
| Normal weight | 1 770.7 | 69.8 | (66.4, 73.3) | 853.5 | 66.2 | (61.3, 71.2) | 917.1 | 73.6 Footnote b | (68.7, 78.4) |
| Overweight | 447.4 | 17.6 | (14.8, 20.5) | 256.3 | 19.9 | (15.5, 24.2) | 191.2 | 15.3 | (11.4, 19.2) |
| Obesity | 271.8 | 10.7 | (8.3, 13.1) | 157.0 | 12.2 | (8.7, 15.7) | 114.8 | 9.2 | (6.2, 12.2) |
| Overweight/Obesity | 719.3 | 28.4 | (25.0, 31.8) | 413.2 | 32.1 | (27.1, 37.0) | 306.0 | 24.6 Footnote b | (19.9, 29.2) |
| Age 12 to 17 years | |||||||||
| Total | 2 287.9 | 1.163.7 | 1.124.2 | ||||||
| Thin | 85.7 | 3.7 Footnote EFootnote a | (2.2, 5.3) | 47.6 | 4.1 Footnote E | (1.9, 6.3) | 38.0 | 3.4 Footnote E | (1.2, 5.5) |
| Normal weight | 1 388.7 | 60.7 Footnote a | (57.3, 64.1) | 684.2 | 58.8 Footnote a | (53.6, 64.0) | 704.4 | 62.7 Footnote a | (58.0, 67.3) |
| Overweight | 487.1 | 21.3 | (18.3, 24.2) | 224.6 | 19.3 | (15.2, 23.4) | 262.5 | 23.3 Footnote a | (19.1, 27.6) |
| Obesity | 326.5 | 14.3 | (11.7, 16.8) | 207.2 | 17.8 | (13.5, 22.1) | 119.2 | 10.6 Footnote b | (7.8, 13.4) |
| Overweight/Obesity | 813.5 | 35.6 Footnote a | (32.3, 38.9) | 431.8 | 37.1 | (31.9, 42.3) | 381.7 | 34.0 Footnote a | (29.4, 38.5) |
Data source: 2015 Canadian Community Health Survey—Nutrition (share file).
|
|||||||||
| Measured BMI category (%) (based on World Health Organization BMI cut-points) | Both Sexes | Males | Females | |||
|---|---|---|---|---|---|---|
| % | 95% |
% | 95% |
% | 95% |
|
| Age 5 to 17 years | ||||||
| Thin | 2.2 | (1.5, 2.8) | 2.8 Footnote E | (1.6, 4.1) | 1.5 Footnote EFootnote c | (0.9, 2.1) |
| Normal weight | 68.9 Footnote b | (66.7, 71.1) | 66.8 | (63.7, 70.0) | 71.0 Footnote c | (68.0, 73.9) |
| Overweight | 17.7 | (16.4, 19.0) | 17.0 | (15.0, 19.0) | 18.4 | (15.9, 20.8) |
| Obesity | 11.3 | (9.6, 12.9) | 13.3 | (11.0, 15.7) | 9.1 Footnote c | (7.4, 10.9) |
| Overweight/Obesity | 28.9 | (26.9, 31.0) | 30.3 | (27.3, 33.4) | 27.5 | (24.4, 30.7) |
| Age 5 to 11 years | ||||||
| Thin | 2.3 Footnote E | (1.3, 3.3) | 2.6 Footnote E | (0.9, 4.3) | 2.0 Footnote E | (1.1, 2.8) |
| Normal weight | 71.1 | (68.1, 74.1) | 69.9 | (65.4, 74.4) | 72.4 | (69.1, 75.6) |
| Overweight | 16.2 | (14.3, 18.1) | 15.1 | (12.4, 17.8) | 17.3 | (14.3, 20.3) |
| Obesity | 10.4 | (8.5, 12.4) | 12.3 | (9.6, 15.1) | 8.4 Footnote c | (6.4, 10.4) |
| Overweight/Obesity | 26.6 | (23.7, 29.5) | 27.5 | (23.2, 31.7) | 25.7 | (22.4, 29.0) |
| Age 12 to 17 years | ||||||
| Thin | 2.1 Footnote E | (1.0, 3.1) | 3.1 Footnote E | (1.2, 5.1) | Footnote F | - |
| Normal weight | 66.3 Footnote aFootnote b | (63.2, 69.3) | 63.2 Footnote a | (58.7, 67.6) | 69.4 Footnote bFootnote c | (65.0, 73.8) |
| Overweight | 19.4 Footnote a | (17.3, 21.6) | 19.2 | (15.8, 22.7) | 19.6 | (15.9, 23.3) |
| Obesity | 12.2 | (9.9, 14.6) | 14.5 | (10.5, 18.4) | 10.0 | (7.4, 12.5) |
| Overweight/Obesity | 31.6 Footnote a | (28.7, 34.5) | 33.7 | (28.8, 38.6) | 29.6 | (25.0, 34.1) |
Data sources: 2014-2015, 2016-2017, and 2018-2019 Canadian Health Measures Survey (Cycles 4, 5, and 6).
|
||||||
| Time period | Both Sexes | Males | Females | |||
|---|---|---|---|---|---|---|
| % | 95% |
% | 95% |
% | 95% |
|
| Age 2-4 years | ||||||
| 2004 | 4.0 Footnote E | (2.4, 5.7) | 3.3 Footnote E | (1.6, 5.1) | 4.7 Footnote E | (1.8, 7.6) |
| 2015 | 3.4 Footnote E | (1.2, 5.5) | Footnote F | - | Footnote F | - |
| Age 5-17 years | ||||||
| 2004 | 12.9 | (11.7, 14.1) | 15.3 | (13.3, 17.4) | 10.3 | (8.7, 12.0) |
| 2009-2011/ 2012-2013 | 12.2 | (10.6, 13.8) | 14.8 | (12.2, 17.4) | 9.4 | (7.6, 11.2) |
| 2015 | 12.4 | (10.7, 14.1) | 14.9 | (12.1, 17.6) | 9.9 | (7.8, 12.0) |
| 2014-2015/ 2016-2017/ 2018-2019 | 11.3 | ( 9.6, 12.9) | 13.3 | (11.0, 15.7) | 9.1 | ( 7.4, 10.9) |
| Age 5-11 years | ||||||
| 2004 | 13.3 | (11.4, 15.2) | 15.3 | (12.2, 18.4) | 11.2 | (8.6, 13.8) |
| 2009-2011/ 2012-2013 | 11.2 | (9.4, 13.0) | 14.3 | (11.5, 17.2) | 8.0 Footnote a | (6.0, 9.9) |
| 2015 | 10.7 | (8.3, 13.1) | 12.2 | (8.7, 15.7) | 9.2 | (6.2, 12.2) |
| 2014-2015/ 2016-2017/ 2018-2019 | 10.4 Footnote a | ( 8.5, 12.4) | 12.3 | ( 9.6, 15.1) | 8.4 | ( 6.4, 10.4) |
| Age 12-17 years | ||||||
| 2004 | 12.5 | (10.8, 14.2) | 15.4 | (12.7, 18.0) | 9.4 | (7.3, 11.5) |
| 2005 | 11.6 Footnote E | (7.7, 15.5) | 16.0 Footnote E | (9.7, 22.3) | 7.0 Footnote E | (3.0, 11.0) |
| 2008 | 10.8 Footnote E | (7.2, 14.4) | 13.6 Footnote E | (8.4, 18.8) | 7.8 Footnote E | (3.4, 12.3) |
| 2007-2009 /2009-2011/ 2012-2013 | 13.9 | (11.0, 16.8) | 16.0 | (11.7, 20.2) | 11.6 | (9.0, 14.2) |
| 2015 | 14.3 | (11.7, 16.8) | 17.8 | (13.5, 22.1) | 10.6 | (7.8, 13.4) |
| 2014-2015/ 2016-2017/ 2018-2019 | 12.2 | ( 9.9, 14.6) | 14.5 | (10.5, 18.4) | 10.0 | ( 7.4, 12.5) |
Data sources: 2004 and 2015 Canadian Community Health Survey—Nutrition (share files); 2005 and 2008 Canadian Community Health Survey (share files); 2007-2009/2009-2011/2012-2013/2014-2015/2016-2017/2018-2019 Canadian Health Measures Survey (Cycles 1 to 6).
|
||||||
| Time period | Both Sexes | Males | Females | |||
|---|---|---|---|---|---|---|
| % | 95% |
% | 95% |
% | 95% |
|
| Age 2-4 years | ||||||
| 2004 | 11.8 | (9.2, 14.4) | 12.4 | (8.5, 16.2) | 11.1 | (7.5, 14.7) |
| 2015 | 7.9 Footnote E | (5.0, 10.9) | 12.6 Footnote E | (6.9, 18.2) | 4.1 Footnote EFootnote d | (1.9, 6.3) |
| Age 5-17 years | ||||||
| 2004 | 34.5 | (32.7, 36.3) | 37.9 | (35.1, 40.7) | 31.0 | (28.5, 33.4) |
| 2009-2011/ 2012-2013 | 31.5 | (29.0, 34.0) | 34.0 | (30.5, 37.5) | 28.8 | (24.5, 33.1) |
| 2015 | 31.8 | (29.4, 34.1) | 34.5 | (30.9, 38.0) | 29.0 | (25.5, 32.5) |
| 2014-2015/ 2016-2017/ 2018-2019 | 28.9 Footnote d | (26.9, 31.0) | 30.3 Footnote d | (27.3, 33.4) | 27.5 | (24.4, 30.7) |
| Age 5-11 years | ||||||
| 2004 | 35.9 | (33.3, 38.5) | 39.0 | (34.9, 43.1) | 32.8 | (29.3, 36.4) |
| 2009-2011/ 2012-2013 | 29.5 Footnote d | (27.0, 32.1) | 31.6 Footnote d | (27.6, 35.6) | 27.4 Footnote d | (24.0, 30.7) |
| 2015 | 28.4 Footnote d | (25.0, 31.8) | 32.1 Footnote d | (27.1, 37.0) | 24.6 Footnote d | (19.9, 29.2) |
| 2014-2015/ 2016-2017/ 2018-2019 | 26.6 Footnote d | (23.7, 29.5) | 27.5 Footnote d | (23.2, 31.7) | 25.7 Footnote d | (22.4, 29.0) |
| Age 12-17 years | ||||||
| 2004 | 33.0 | (30.6, 35.4) | 36.7 | (33.2, 40.2) | 28.9 | (25.5, 32.2) |
| 2005 | 34.6 | (28.4, 40.9) | 40.2 | (31.3, 49.0) | 28.8 | (20.1, 37.6) |
| 2008 | 34.4 | (28.7, 40.0) | 34.1 | (25.9, 42.3) | 34.7 | (26.0, 43.3) |
| 2007-2009/ 2009-2011/ 2012-2013 | 32.7 | (28.8, 36.6) | 35.7 | (30.6, 40.7) | 29.3 | (24.2, 34.5) |
| 2015 | 35.6 | (32.3, 38.9) | 37.1 | (31.9, 42.3) | 34.0 | (29.4, 38.5) |
| 2014-2015/ 2016-2017/ 2018-2019 | 31.6 | (28.7, 34.5) | 33.7 | (28.8, 38.6) | 29.6 | (25.0, 34.1) |
Data sources: 2004 and 2015 Canadian Community Health Survey—Nutrition (share files); 2005 and 2008 Canadian Community Health Survey (share files); 2007-2009/2009-2011/2012-2013/2014-2015/2016-2017/2018-2019 Canadian Health Measures Survey (Cycles 1 to 6).
|
||||||
| Indigenous status | Both Sexes | Males | Females | |||
|---|---|---|---|---|---|---|
| % | 95% |
% | 95% |
% | 95% |
|
| Obesity | ||||||
| Total (5-17 years) | 12.4 | (10.7, 14.1) | 14.9 | (12.1, 17.6) | 9.9 Footnote a | (7.8, 12.0) |
| First Nations living off reserve, Inuit peoples, and Métis | 26.0 Footnote EFootnote b | (17.3, 34.7) | 23.9 Footnote E | (12.5, 35.3) | 28.3 Footnote EFootnote b | (15.7, 41.0) |
| Non-Indigenous | 11.9 | (10.2, 13.6) | 14.5 | (11.7, 17.2) | 9.2 Footnote a | (7.1, 11.4) |
| Overweight/obesity | ||||||
| Total (5-17 years) | 31.8 | (29.4, 34.1) | 34.5 | (30.9, 38.0) | 29.0 Footnote a | (25.5, 32.5) |
| First Nations living off reserve, Inuit peoples, and Métis | 48.4 Footnote b | (39.1, 57.7) | 45.6 | (32.5, 58.7) | 51.4 Footnote b | (38.7, 64.2) |
| Non-Indigenous | 31.2 | (28.8, 33.7) | 34.0 | (30.3, 37.6) | 28.4 Footnote a | (24.8, 31.9) |
Data source: 2015 Canadian Community Health Survey—Nutrition (share file).
|
||||||
| Time period | Response |
% agreeing to |
Sample size: |
Number and percent of respondents 18+ with a missing value for BMIFootnote c |
|
|---|---|---|---|---|---|
| Number | % | ||||
| 2000-2001 | 84.7 | 95.9 | 107,682 | 2,190 | 2.0 |
| 2003 | 80.7 | 95.2 | 108,240 | 2,736 | 2.5 |
| 2005 | 78.9 | 95.5 | 108,195 | 2,437 | 2.2 |
| 2007-2008 | 76.4 | 94.6 | 105,695 | 4,792 | 4.3 |
| 2009-2010 | 72.3 | 94.0 | 99,297 | 4,438 | 4.3 |
| 2011-2012 | 68.4 | 94.5 | 100,010 | 5,061 | 4.8 |
| 2013-2014 | 66.2 | 94.7 | 102,812 | 5,358 | 5.0 |
| 2015-2016 | 59.5 | 94.3 | 87,370 | 4,714 | 5.1 |
| 2017-2018 | 60.8 | 91.9 | 90,881 | 4,938 | 5.2 |
| 2019-2020 | 41.0 | 93.6 | 88,383 | 5,308 | 5.7 |
|
|||||
| Time period | Response rateFootnote a | Percent agreeing to share responsesFootnote b | Sample size: Number of respondents for whom BMI was calculated by age groupFootnote c | ||||
|---|---|---|---|---|---|---|---|
| % | % | 18 or older | 18-79 | 12-17 | 5-11Footnote d | 2-4Footnote e | |
| 2004 CCHS-Nutrition | 76.5 | 95.3 | 11,909 | 10,986 | 3,942 | 3,266 | 1,187 |
| 2005 CCHS measured | 55.9 | 95.5 | 4,039 | 3,814 | 473 | ||
| 2007-2009 CHMS | 51.7 | 3,691 | 804 | ||||
| 2008 CCHS measured | 50.7 | 94.6 | 4,052 | 3,823 | 428 | ||
| 2009-2011 CHMS | 55.5 | 3,832 | 846 | 1,267 | |||
| 2012-2013 CHMS | 51.7 | 3,354 | 802 | 1,182 | |||
| 2014-2015 CHMS | 53.7 | 3,352 | 798 | 1,203 | |||
| 2015 CCHS-Nutrition | 61.6 | 96.0 | 9,265 | 8,664 | 1,879 | 1,692 | 778 |
| 2016-2017 CHMS | 48.5 | 3,272 | 832 | 1,219 | |||
| 2018-2019 CHMS | 45.9 | 3,349 | 802 | 1,179 | |||
|
|||||||
Bibliography
- Footnote 1
-
Avila C, Holloway AC, Hahn MK, Morrison KM, Restivo M, Anglin R, et al. An overview of links between obesity and mental health. Curr Obes Rep. 2015 Sep;4(3):303–10.
- Footnote 2
-
Guh DP, Zhang W, Bansback N, Amarsi Z, Birmingham CL, Anis AH. The incidence of co-morbidities related to obesity and overweight: a systematic review and meta-analysis. BMC Public Health. 2009 Mar 25;9(1):88.
- Footnote 3
-
Kelsey MM, Zaepfel A, Bjornstad P, Nadeau KJ. Age-related consequences of childhood obesity. Gerontology. 2014;60(3):222–8.
- Footnote 4
-
Llewellyn A, Simmonds M, Owen CG, Woolacott N. Childhood obesity as a predictor of morbidity in adulthood: a systematic review and meta-analysis. Obes Rev. 2016 Jan;17(1):56–67.
- Footnote 5
-
Quek YH, Tam WWS, Zhang MWB, Ho RCM. Exploring the association between childhood and adolescent obesity and depression: a meta-analysis. Obes Rev. 2017 Jul;18(7):742–54.
- Footnote 6
-
Rankin J, Matthews L, Cobley S, Han A, Sanders R, Wiltshire HD, et al. Psychological consequences of childhood obesity: psychiatric comorbidity and prevention. Adolesc Health Med Ther. 2016;7:125–46.
- Footnote 7
-
Simmonds M, Burch J, Llewellyn A, Griffiths C, Yang H, Owen C, et al. The use of measures of obesity in childhood for predicting obesity and the development of obesity-related diseases in adulthood: a systematic review and meta-analysis. Health Technol Assess Winch Engl. 2015 Jun;19(43):1–336.
- Footnote 8
-
Singh AS, Mulder C, Twisk JWR, Van Mechelen W, Chinapaw MJM. Tracking of childhood overweight into adulthood: a systematic review of the literature. Obes Rev. 2008;9(5):474–88.
- Footnote 9
-
Statistics Canada. Overweight and obese adults, 2018 [Internet]. 2019 [cited 2023 Mar 20]. Available from: https://www150.statcan.gc.ca/n1/pub/82-625-x/2019001/article/00005-eng.htm
- Footnote 10
-
Connor Gorber S, Tremblay M, Moher D, Gorber B. A comparison of direct vs. self-report measures for assessing height, weight and body mass index: a systematic review. Obes Rev. 2007 Jul;8(4):307–26.
- Footnote 11
-
de Onis M, editor. WHO Child Growth Standards - Length/height-for-age, weight-for-age, weight-for-length, weight-for-height and body mass index-for-age: methods and development. Geneva: WHO Press; 2006. 312 p. (WHO child growth standards).
- Footnote 12
-
de Onis M, Onyango AW, Borghi E, Siyam A, Nishida C, Siekmann J. Development of a WHO growth reference for school-aged children and adolescents. Bull World Health Organ. 2007 Sep;85(9):660–7.
- Footnote 13
-
de Onis M, Lobstein T. Defining obesity risk status in the general childhood population: which cut-offs should we use? Int J Pediatr Obes. 2010 Dec;5(6):458–60.
- Footnote 14
-
He J, Cai Z, Fan X. How accurate is the prevalence of overweight and obesity in children and adolescents derived from self-reported data? A meta-analysis. Public Health Nutr. 2018 Jul;21(10):1865–73.
- Footnote 15
-
Sherry B, Jefferds ME, Grummer-Strawn LM. Accuracy of adolescent self-report of height and weight in assessing overweight status: a literature review. Arch Pediatr Adolesc Med. 2007 Dec;161(12):1154–61.
- Footnote 16
-
ParticipACTION. Lost and found: pandemic-related challenges and opportunities for physical activity [Internet]. Toronto: ParticipACTION; 2022. (2022 ParticipACTION Report Card on Physical Activity for Children and Youth). Available from: https://www.participaction.com/wp-content/uploads/2022/10/2022-Children-and-Youth-Report-Card.pdf
- Footnote 17
-
World Health Organization. World Health Organization. 2021 [cited 2023 Feb 21]. Obesity and overweight. Available from: https://www.who.int/news-room/fact-sheets/detail/obesity-and-overweight
- Footnote 18
-
Health Canada, Public Health Agency of Canada. Obesity [Internet]. Ottawa, ON; 2006 [cited 2023 Mar 20]. 3 p. (It's Your Health). Available from: https://www.canada.ca/en/health-canada/services/healthy-living/your-health/lifestyles/obesity.html
- Footnote 19
-
Adab P, Pallan M, Whincup PH. Is BMI the best measure of obesity? BMJ. 2018 Mar 29;360:k1274.
- Footnote 20
-
Health Canada. Government of Canada. 2004 [cited 2023 Mar 20]. Canadian guidelines for body weight classification in adults. Available from: https://www.canada.ca/en/health-canada/services/food-nutrition/healthy-eating/healthy-weights/canadian-guidelines-body-weight-classification-adults.html
- Footnote 21
-
WHO Expert Committee on Physical Status, World Health Organization. Physical status : the use of and interpretation of anthropometry [Internet]. Geneva, Switzerland: World Health Organization; 1995 [cited 2023 Mar 20]. 463 p. (WHO Technical Report Series). Available from: https://apps.who.int/iris/handle/10665/37003
- Footnote 22
-
Caleyachetty R, Barber TM, Mohammed NI, Cappuccio FP, Hardy R, Mathur R, et al. Ethnicity-specific BMI cutoffs for obesity based on type 2 diabetes risk in England: a population-based cohort study. Lancet Diabetes Endocrinol. 2021 Jul;9(7):419–26.
- Footnote 23
-
WHO Expert Consultation. Appropriate body-mass index for Asian populations and its implications for policy and intervention strategies. The Lancet. 2004 Jan 10;363(9403):157–63.
- Footnote 24
-
Nevill AM, Metsios GS. The need to redefine age- and gender-specific overweight and obese body mass index cutoff points. Nutr Diabetes. 2015 Nov;5(11):e186.
- Footnote 25
-
Charbonneau-Roberts G, Saudny-Unterberger H, Kuhnlein HV, Egeland GM. Body mass index may overestimate the prevalence of overweight and obesity among the Inuit. Int J Circumpolar Health. 2005 Apr 1;64(2):163–9.
- Footnote 26
-
Galloway T, Chateau-Degat ML, Egeland GM, Young TK. Does sitting height ratio affect estimates of obesity prevalence among Canadian Inuit? results from the 2007–2008 Inuit health survey. Am J Hum Biol. 2011;23(5):655–63.
- Footnote 27
-
Dietitians of Canada, Canadian Paediatric Society, College of Family Physicians of Canada, Community Health Nurses of Canada. Promoting optimal monitoring of child growth in Canada: using the new WHO growth charts. Can J Diet Pract Res Publ Dietit Can Rev Can Prat Rech En Diet Une Publ Diet Can. 2010;71(1):e1-3.
- Footnote 28
-
Hu FB. Obesity Epidemiology. Reprint. Oxford: Oxford Univ. Press; 2008. 498 p.
- Footnote 29
-
Carmienke S, Freitag MH, Pischon T, Schlattmann P, Fankhaenel T, Goebel H, et al. General and abdominal obesity parameters and their combination in relation to mortality: a systematic review and meta-regression analysis. Eur J Clin Nutr. 2013 Jun;67(6):573–85.
- Footnote 30
-
Chen GC, Chen SJ, Zhang R, Hidayat K, Qin JB, Zhang YS, et al. Central obesity and risks of pre- and postmenopausal breast cancer: a dose-response meta-analysis of prospective studies. Obes Rev, 2016 Nov;17(11):1167–77.
- Footnote 31
-
De Ridder J, Julián-Almárcegui C, Mullee A, Rinaldi S, Van Herck K, Vicente-Rodríguez G, et al. Comparison of anthropometric measurements of adiposity in relation to cancer risk: a systematic review of prospective studies. Cancer Causes Control CCC. 2016 Mar;27(3):291–300.
- Footnote 32
-
Huxley R, Mendis S, Zheleznyakov E, Reddy S, Chan J. Body mass index, waist circumference and waist:hip ratio as predictors of cardiovascular risk--a review of the literature. Eur J Clin Nutr. 2010 Jan;64(1):16–22.
- Footnote 33
-
Qiao Q, Nyamdorj R. Is the association of type II diabetes with waist circumference or waist-to-hip ratio stronger than that with body mass index? Eur J Clin Nutr. 2010 Jan;64(1):30–4.
- Footnote 34
-
Vazquez G, Duval S, Jacobs DR, Silventoinen K. Comparison of body mass index, waist circumference, and waist/hip ratio in predicting incident diabetes: a meta-analysis. Epidemiol Rev. 2007;29:115–28.
- Footnote 35
-
Shields M, Tremblay MS, Connor Gorber S, Janssen I. Abdominal obesity and cardiovascular disease risk factors within body mass index categories. Health Rep. 2012 Jun;23(2):7–15.
- Footnote 36
-
Lau DCW, Douketis JD, Morrison KM, Hramiak IM, Sharma AM, Ur E. 2006 Canadian clinical practice guidelines on the management and prevention of obesity in adults and children [summary]. CMAJ Can Med Assoc J. 2007 Apr 10;176(8):S1–13.
- Footnote 37
-
World Health Organization. Waist circumference and waist-hip ratio: report of a WHO expert consultation [Internet]. Geneva, Switzerland: World Health Organization; 2008 [cited 2023 Mar 20]. 39 p. Available from: https://www.who.int/publications-detail-redirect/9789241501491
- Footnote 38
-
Health Canada. Government of Canada. 2003 [cited 2023 Mar 20]. Canadian guidelines for body weight classification in adults - quick reference tool for professionals. Available from: https://www.canada.ca/en/health-canada/services/food-nutrition/healthy-eating/healthy-weights/canadian-guidelines-body-weight-classification-adults/quick-reference-tool-professionals.html
- Footnote 39
-
Lean ME, Han TS, Morrison CE. Waist circumference as a measure for indicating need for weight management. BMJ. 1995 Jul 15;311(6998):158–61.
- Footnote 40
-
Ganz ML, Wintfeld N, Li Q, Alas V, Langer J, Hammer M. The association of body mass index with the risk of type 2 diabetes: a case-control study nested in an electronic health records system in the United States. Diabetol Metab Syndr. 2014 Apr 3;6(1):50.
- Footnote 41
-
Khan SS, Ning H, Wilkins JT, Allen N, Carnethon M, Berry JD, et al. Association of body mass index with lifetime risk of cardiovascular disease and compression of morbidity. JAMA Cardiol. 2018 Apr 1;3(4):280–7.
- Footnote 42
-
Arterburn DE, Maciejewski ML, Tsevat J. Impact of morbid obesity on medical expenditures in adults. Int J Obes 2005. 2005 Mar;29(3):334–9.
- Footnote 43
-
Flegal KM, Kit BK, Orpana H, Graubard BI. Association of all-cause mortality with overweight and obesity using standard body mass index categories. JAMA. 2013 Jan 2;309(1):71–82.
- Footnote 44
-
Han SJ, Boyko EJ. The evidence for an obesity paradox in type 2 diabetes mellitus. Diabetes Metab J. 2018 Jun;42(3):179–87.
- Footnote 45
-
Horwich TB, Fonarow GC, Clark AL. Obesity and the obesity paradox in heart failure. Prog Cardiovasc Dis. 2018 Jul 1;61(2):151–6.
- Footnote 46
-
Oesch L, Tatlisumak T, Arnold M, Sarikaya H. Obesity paradox in stroke – myth or reality? A systematic review. PLoS ONE. 2017 Mar 14;12(3):e0171334.
- Footnote 47
-
Romero-Corral A, Montori VM, Somers VK, Korinek J, Thomas RJ, Allison TG, et al. Association of bodyweight with total mortality and with cardiovascular events in coronary artery disease: a systematic review of cohort studies. Lancet. 2006 Aug 19;368(9536):666–78.
- Footnote 48
-
Shachar SS, Williams GR. The obesity paradox in cancer – moving beyond BMI. Cancer Epidemiol Biomark Prev Publ Am Assoc Cancer Res Cosponsored Am Soc Prev Oncol. 2017 Jan;26(1):13–6.
- Footnote 49
-
Allison DB, Zhu SK, Plankey M, Faith MS, Heo M. Differential associations of body mass index and adiposity with all-cause mortality among men in the first and second National Health and Nutrition Examination Surveys (NHANES I and NHANES II) follow-up studies. Int J Obes Relat Metab Disord. 2002 Mar;26(3):410–6.
- Footnote 50
-
Lin TY, Lim PS, Hung SC. Impact of misclassification of obesity by body mass index on mortality in patients With CKD. Kidney Int Rep. 2017 Dec 23;3(2):447–55.
- Footnote 51
-
Grier T, Canham-Chervak M, Sharp M, Jones BH. Does body mass index misclassify physically active young men. Prev Med Rep. 2015 Jun 11;2:483–7.
- Footnote 52
-
Prentice AM, Jebb SA. Beyond body mass index. Obes Rev. 2001;2(3):141–7.
- Footnote 53
-
OECD. The heavy burden of obesity: the economics of prevention [Internet]. Paris: OECD Publishing; 2019 [cited 2023 Mar 20]. (OECD Health Policy Studies). Available from: https://www.oecd.org/health/the-heavy-burden-of-obesity-67450d67-en.htm
- Footnote 54
-
Anis AH, Zhang W, Bansback N, Guh DP, Amarsi Z, Birmingham CL. Obesity and overweight in Canada: an updated cost-of-illness study. Obes Rev. 2010 Jan;11(1):31–40.
- Footnote 55
-
Shields M, Connor Gorber S, Janssen I, Tremblay MS. Obesity estimates for children based on parent-reported versus direct measures. Health Rep. 2011 Sep;22(3):47–58.
- Footnote 56
-
McKee AM, Morley JE. Obesity in the elderly. In: Feingold KR, Anawalt B, Blackman MR, Boyce A, Chrousos G, Corpas E, et al., editors. Endotext [Internet]. South Dartmouth (MA): MDText.com, Inc.; 2000 [cited 2023 Mar 20]. Available from: http://www.ncbi.nlm.nih.gov/books/NBK532533/
- Footnote 57
-
Pietrzykowska N. Obesity Action Coalition. 2014 [cited 2023 Mar 20]. Obesity in the elderly. Available from: https://www.obesityaction.org/resources/obesity-in-the-elderly/
- Footnote 58
-
Pampel FC, Denney JT, Krueger PM. Obesity, SES, and economic development: a test of the reversal hypothesis. Soc Sci Med 1982. 2012 Apr;74(7):1073–81.
- Footnote 59
-
Public Health Agency of Canada (PHAC). Government of Canada. 2020 [cited 2023 Feb 21]. Canadian Risk Factor Atlas (CRFA), 2020 edition. Available from: https://health-infobase.canada.ca/canadian-risk-factor-atlas/
- Footnote 60
-
Truth and Reconciliation Commission of Canada. Truth and Reconciliation Commission of Canada: calls to action [Internet]. Winnipeg, Manitoba: Truth and Reconciliation Commission of Canada; 2015 [cited 2023 Feb 21] p. 20. Available from: https://ehprnh2mwo3.exactdn.com/wp-content/uploads/2021/01/Calls_to_Action_English2.pdf
- Footnote 61
-
Public Health Agency of Canada (PHAC), Pan-Canadian Public Health Network. Key health inequalities in Canada: a national portrait [Internet]. Canada; 2018 [cited 2023 Feb 20]. 437 p. Available from: https://www.canada.ca/content/dam/phac-aspc/documents/services/publications/science-research/key-health-inequalities-canada-national-portrait-executive-summary/key_health_inequalities_full_report-eng.pdf
- Footnote 62
-
Public Health Agency of Canada, Pan-Canadian Public Health Network, Statistics Canada and the Canadian Institute for Health Information. Government of Canada. 2022 [cited 2023 Mar 6]. Pan-Canadian Health Inequalities Data Tool. Available from: https://health-infobase.canada.ca/health-inequalities/data-tool/index
- Footnote 63
-
NCD Risk Factor Collaboration. Trends in adult body-mass index in 200 countries from 1975 to 2014: a pooled analysis of 1698 population-based measurement studies with 19.2 million participants. Lancet. 2016 Apr 2;387(10026):1377–96.
- Footnote 64
-
OECD. OECD - Better Policies for Better Lives. Obesity and the economics of prevention: fit not fat - Canada key facts - OECD. [Internet]. 2014 [cited 2023 Feb 21]. Available from: https://www.oecd.org/canada/obesityandtheeconomicsofpreventionfitnotfat-canadakeyfacts.htm
- Footnote 65
-
Tjepkema M. Adult obesity. Health Rep. 2006 Aug;17(3):9–25.
- Footnote 66
-
Wolfson MC. POHEM : a framework for understanding and modelling the health of human populations. World Health Stat Q. 1994;47(3/4):157–76.
- Footnote 67
-
Bancej C, Jayabalasingham B, Wall RW, Rao DP, Do MT, de Groh M, et al. Trends and projections of obesity among Canadians. Health Promot Chronic Dis Prev Can Res Policy Pract. 2015 Sep;35(7):109–12.
- Footnote 68
-
Hennessy D, Garner R, Flanagan WM, Wall R, Nadeau C. Development of a population-based microsimulation model of body mass index. Health Rep. 2017;28(6):13.
- Footnote 69
-
Gao M, Piernas C, Astbury NM, Hippisley-Cox J, O'Rahilly S, Aveyard P, et al. Associations between body-mass index and COVID-19 severity in 6.9 million people in England: a prospective, community-based, cohort study. Lancet Diabetes Endocrinol. 2021 Jun 1;9(6):350–9.
- Footnote 70
-
Ho JSY, Fernando DI, Chan MY, Sia CH. Obesity in COVID-19: A Systematic Review and Meta-analysis. Ann Acad Med Singapore. 2020 Dec;49(12):996–1008.
- Footnote 71
-
Sawadogo W, Tsegaye M, Gizaw A, Adera T. Overweight and obesity as risk factors for COVID-19-associated hospitalisations and death: systematic review and meta-analysis. BMJ Nutr Prev Health. 2022 Jun 1;5(1):10–8.
- Footnote 72
-
Singh R, Rathore SS, Khan H, Karale S, Chawla Y, Iqbal K, et al. Association of obesity with COVID-19 severity and mortality: an updated systemic review, meta-analysis, and meta-regression. Front Endocrinol [Internet]. 2022 [cited 2023 Feb 22];13. Available from: https://www.frontiersin.org/articles/10.3389/fendo.2022.780872
- Footnote 73
-
Zhang X, Lewis AM, Moley JR, Brestoff JR. A systematic review and meta-analysis of obesity and COVID-19 outcomes. Sci Rep. 2021 Mar 30;11(1):7193.
- Footnote 74
-
Daniels NF, Burrin C, Chan T, Fusco F. A systematic review of the impact of the first year of COVID-19 on obesity risk factors: a pandemic fueling a pandemic? Curr Dev Nutr. 2022 Apr 8;6(4):nzac011.
- Footnote 75
-
Aghili SMM, Ebrahimpur M, Arjmand B, Shadman Z, Pejman Sani M, Qorbani M, et al. Obesity in COVID-19 era, implications for mechanisms, comorbidities, and prognosis: a review and meta-analysis. Int J Obes. 2021 Feb;45(5):998–1016.
- Footnote 76
-
World Obesity. World Obesity Federation. 2020 [cited 2023 Feb 22]. Obesity and COVID-19: policy statement. Available from: https://www.worldobesity.org/news/obesity-and-covid-19-policy-statement
- Footnote 77
-
NCD Risk Factor Collaboration. Worldwide trends in body-mass index, underweight, overweight, and obesity from 1975 to 2016: a pooled analysis of 2416 population-based measurement studies in 128.9 million children, adolescents, and adults. Lancet. 2017 Dec 16;390(10113):2627–42.
- Footnote 78
-
Olds T, Maher C, Zumin S, Péneau S, Lioret S, Castetbon K, et al. Evidence that the prevalence of childhood overweight is plateauing: data from nine countries. Int J Pediatr Obes. 2011 Oct;6(5–6):342–60.
- Footnote 79
-
Rokholm B, Baker JL, Sørensen TIA. The levelling off of the obesity epidemic since the year 1999--a review of evidence and perspectives. Obes Rev. 2010 Dec;11(12):835–46.
- Footnote 80
-
Shields M, Tremblay MS. Canadian childhood obesity estimates based on WHO, IOTF and CDC cut-points. Int J Pediatr Obes. 2010 May 3;5(3):265–73.
- Footnote 81
-
Statistics Canada. Statistics Canada. 2022 [cited 2023 Mar 8]. Canadian Community Health Survey – Annual component (CCHS). Available from: https://www.statcan.gc.ca/en/survey/household/3226
- Footnote 82
-
Connor Gorber S, Shields M, Tremblay MS, McDowell I. The feasibility of establishing correction factors to adjust self-reported estimates of obesity. Health Rep. 2008 Sep;19(3):71–82.
- Footnote 83
-
Shields M, Connor Gorber S, Janssen I, Tremblay MS. Bias in self-reported estimates of obesity in Canadian health surveys: an update on correction equations for adults. Health Rep. 2011 Sep;22(3):35–45.
- Footnote 84
-
Statistics Canada. Statistics Canada. 2016 [cited 2023 Mar 8]. Canadian Community Health Survey (CCHS) - summary of changes. Available from: https://www23.statcan.gc.ca/imdb/p2SV.pl?Function=getMainChange&Id=4995
- Footnote 85
-
Statistics Canada. Canadian Community Health Survey - Nutrition (CCHS) [Internet]. 2017 [cited 2023 Mar 8]. Available from: https://www23.statcan.gc.ca/imdb/p2SV.pl?Function=getSurvey&SDDS=5049
- Footnote 86
-
Statistics Canada. Statistics Canada. 2023 [cited 2023 Mar 8]. Canadian Health Measures Survey (CHMS). Available from: https://www.statcan.gc.ca/en/survey/household/5071
- Footnote 87
-
Statistics Canada. Statistics Canada. 2021 [cited 2023 Mar 8]. Canadian Community Health Survey - Annual Component (CCHS): household total income of person, category. Available from: https://www23.statcan.gc.ca/imdb/p2SV.pl?Function=assembleDESurv&DECId=252475&RepClass=591&Id=1314175&DFId=180541
- Footnote 88
-
Y Yeo D, Mantel H, Liu TP, Yeo D. Bootstrap variance estimation for the national population health survey. 1999: 778-783.
- Footnote 89
-
Baribeau B. Could non response be biasing trends of health estimates? J Surv Methodol. 2014;4285–93.
- Footnote 90
-
Flegal KM, Ogden CL. Childhood obesity: are we all speaking the same language? Adv Nutr. 2011 Mar 1;2(2):159S-166S.
- Footnote 91
-
Braun N, Gomes F, Schütz P. "The obesity paradox" in disease – is the protective effect of obesity true? Swiss Med Wkly. 2015 Dec 13;145(5152):w14265–w14265.
- Footnote 92
-
Tobias DK, Hu FB. Does being overweight really reduce mortality? Obes Silver Spring Md. 2013 Sep;21(9):1746–9.
- Footnote 93
-
Aune D, Sen A, Prasad M, Norat T, Janszky I, Tonstad S, et al. BMI and all cause mortality: systematic review and non-linear dose-response meta-analysis of 230 cohort studies with 3.74 million deaths among 30.3 million participants. BMJ. 2016 May 4;353:i2156.
- Footnote 94
-
Iliodromiti S, Celis-Morales CA, Lyall DM, Anderson J, Gray SR, Mackay DF, et al. The impact of confounding on the associations of different adiposity measures with the incidence of cardiovascular disease: a cohort study of 296;535 adults of white European descent. Eur Heart J. 2018 May 1;39(17):1514–20.
- Footnote 95
-
Eckel N, Li Y, Kuxhaus O, Stefan N, Hu FB, Schulze MB. Transition from metabolic healthy to unhealthy phenotypes and association with cardiovascular disease risk across BMI categories in 90 257 women (the Nurses' Health Study): 30 year follow-up from a prospective cohort study. Lancet Diabetes Endocrinol. 2018 Sep;6(9):714–24.
- Footnote 96
-
Connor Gorber S, Tremblay MS. The bias in self-reported obesity from 1976 to 2005: a Canada-US comparison. Obes Silver Spring Md. 2010 Feb;18(2):354–61.