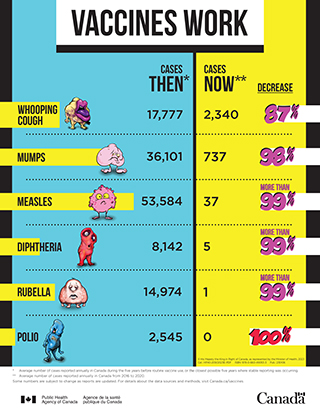
Infographic: Vaccines Work

This table illustrates the effectiveness of vaccination by comparing the number of cases of six vaccine-preventable diseases in Canada before and after the introduction of each vaccine.
Disease Cases THENTable 1 - Footnote * Cases NOWTable 1 - Footnote ** Decrease
Whooping Cough 17,777 2,332 87%
Measles 53,584 292 99%
Mumps 36,101 103 99%
Rubella 14,974 1 99%
Diphtheria 8,142 1 99%
Polio 2,545 0 100%

Some numbers are subject to change as reports are updated.

Data sources: Measles and rubella data were obtained from the Canadian Measles and Rubella Surveillance System, while data for all other diseases was obtained from the Canadian Notifiable Disease Surveillance System.

For whooping cough (pertussis), the five years prior to vaccine use in Canada were defined as 1938 to 1942; the whole cell pertussis vaccine was authorized in Canada in 1943.

The five years used for the pre-vaccine era were defined as 1950-1954 for measles, mumps and rubella. This is due to the fact that these diseases were temporarily suspended from national surveillance for varying time periods between 1959 and 1985, with declines in physician reporting in the years leading up to 1959. Mumps and rubella vaccines were authorized in Canada in 1969 and measles live vaccine was authorized in 1963.

For polio, the five years prior to routine vaccine use in Canada were defined as 1950-1954; the vaccine was introduced in 1955.

For diphtheria, the five years prior to routine vaccine use in Canada were defined as 1925-1929; the vaccine was routinely used beginning in 1930.

thumbnail

Download the alternative format
(PDF format, 144 KB, 1 page)

Order a copy

Organization: Public Health Agency of Canada

Type: Poster

Date published: 2018-04

Related Topics

Report a problem or mistake on this page
Please select all that apply:

Thank you for your help!

You will not receive a reply. For enquiries, contact us.

Date modified: