
Inequalities in diabetes and related risk factors: Comparing Canadian adults by income level
Download in PDF format
(360 KB, 2 page)
Organization: Public Health Agency of Canada
Date published: 2022-07-07
Diabetes is a chronic health condition in which the body cannot produce or process insulin, leading to issues in glucose (sugar) regulation. There are three types of diabetes. Type 2 is the most common1. Other types include type 1 and gestational diabetes, which occurs during pregnancy.
Here we describe income inequalities in self-reported chronic disease risk factors as well as self-reported diabetes, looking specifically at type 1 and type 2 diabetes combined, excluding gestational diabetes2.
Diabetes prevalence
The prevalence of diabetes is 2.1 times higher among adults living in the lowest income group, compared to those living in the highest income group3.
Overall, men are 1.5 times more likely to have diabetes than women. However, inequalities in diabetes prevalence rates observed between lowest and highest income groups are more pronounced for women4.
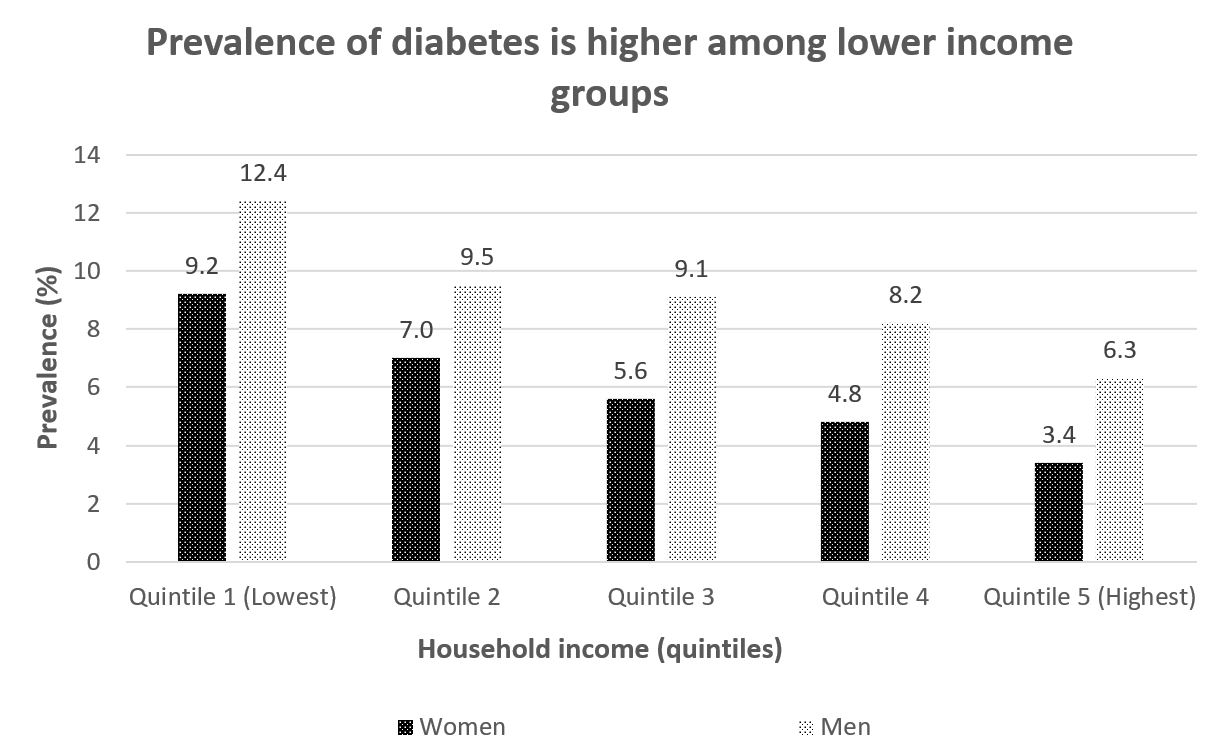
Table 1 –Prevalence (%) of diabetes, by income and by sex
| Women | Men | |
| Quintile 1 (lowest) | 9.2* | 12.4* |
| Quintile 2 | 7.0* | 9.5* |
| Quintile 3 | 5.6* | 9.1* |
| Quintile 4 | 4.8* | 8.2* |
| Quintile 5 (highest) (reference) | 3.4 | 6.3 |
*: Significantly different from reference category
Source: Canadian Community Health Survey 2015-16, 2017-18
Chronic conditions – risk factors
Inequalities persist between income groups in self-reported risk factors for chronic conditions.
Hypertension
- The proportion of people with high blood pressure in the lowest income group is 1.3 times higher than that in the highest income group.
- This corresponds to 5 more people per 100 in the lowest income group that have high blood pressure, compared to the highest income group.
Obesity
- Compared to the highest income group, obesity prevalence is 1.2 times higher among the lowest income group.
- For women, the income inequality is larger. There are 9 more women with obesity in the lowest income group compared to the highest income group, per 100 people.
Cigarette smoking
- Adults in the lowest income group are 2.1 times more likely to smoke, compared to adults in the highest income group.
- This corresponds to 13 more people per 100 in the lowest income group that smoked, compared to the highest income group.
Heavy alcohol consumption
- Among both men and women, heavy alcohol consumption increases with income.
- For every 100 people, there are 13 more people with heavy alcohol consumption in the highest income group, compared to the lowest.
Physical activity
Meeting the Canadian Physical Activity Guidelines' recommended level of physical activity (at least 150 minutes of moderate to vigorous physical activity per week, in bouts of 10 minutes or more) can help reduce the risk of chronic conditions.
Income level can influence one's capacity to meet this recommendation56. Income inequalities affect access to recreational and green spaces, safe built environment, and competing demands on personal time, for work or caregiving56. All these factors influence physical activity.
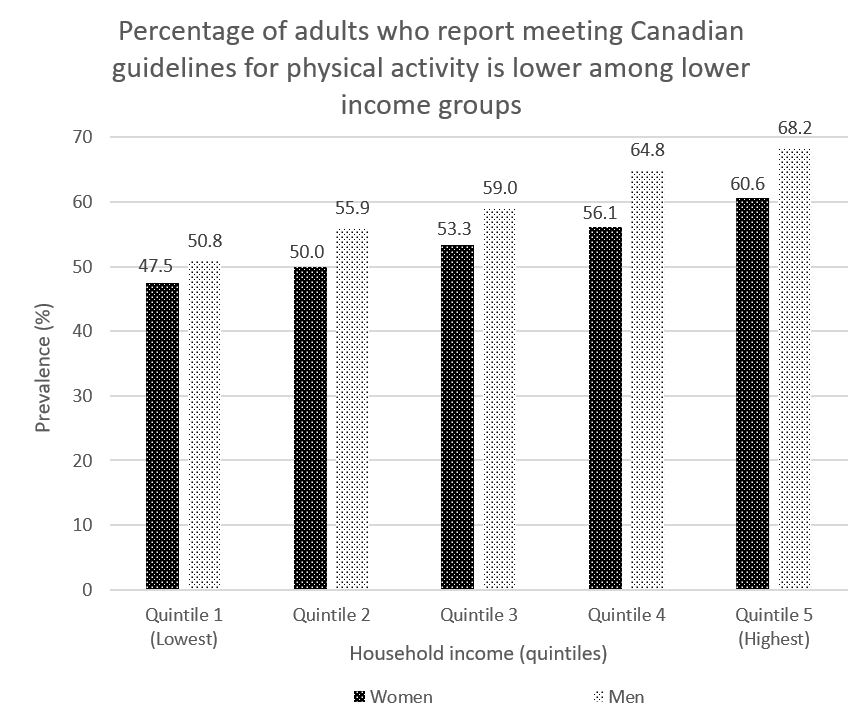
Table 2 – Percentage (%) of adults who report meeting Canadian guidelines for physical activity, by income and by sex
| Women | Men | |
| Quintile 1 (lowest) | 47.5* | 50.8* |
| Quintile 2 | 50.0* | 55.9* |
| Quintile 3 | 53.3* | 59.0* |
| Quintile 4 | 56.1* | 64.8* |
| Quintile 5 (highest) (reference) | 60.6 | 68.2 |
*: Significantly different from reference category
Source: Canadian Community Health Survey 2015-16, 2017-18
Fruit and vegetable consumption
The consumption of fruits and vegetables can reduce the risk of chronic conditions. Fruit and vegetable consumption at least 5 times per day is influenced in part by food security - that is, one's income capacity to purchase the variety or quantity of food they need 2.
- Across all income levels, fruit and vegetable consumption is lower among men, compared to women
- For both sexes, the association between fruit and vegetable consumption and income follows a gradient, with higher prevalence of fruit and vegetable consumption among higher income groups.
- This gradient is strongest for women: The prevalence of women in the lowest income group is 0.7 times that of women in the highest income group – compared to a ratio of 0.8 for men.
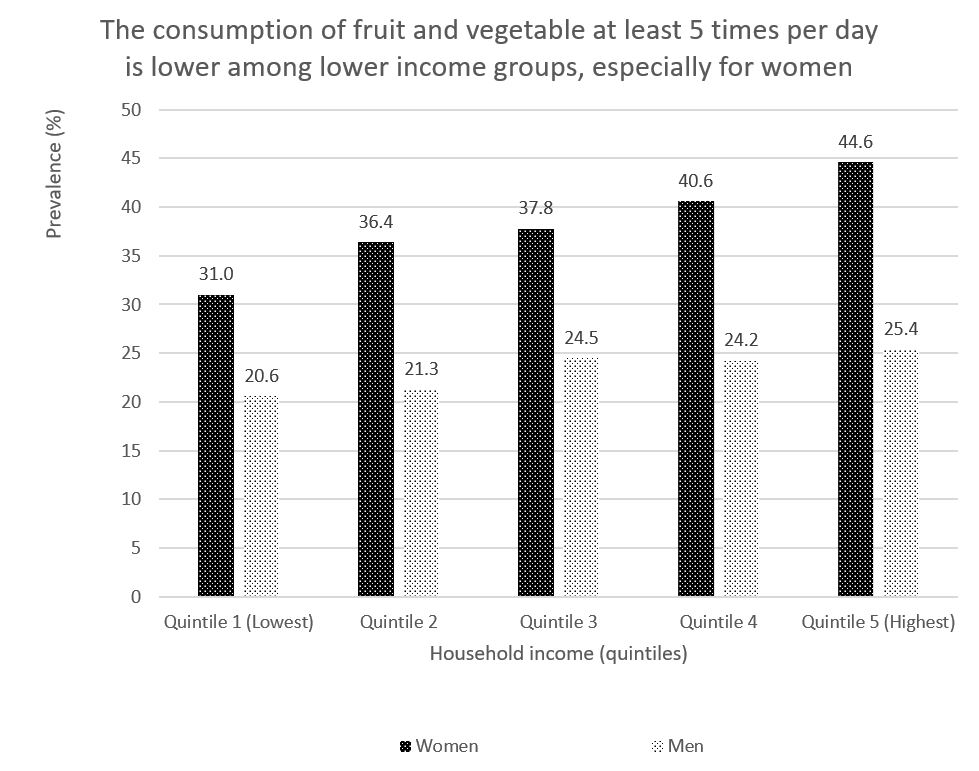
Table 3 – Percentage (%) of adults who report consuming fruit and vegetable at least 5 times per day, by income and by sex
| Women | Men | |
| Quintile 1 (lowest) | 31.0* | 20.6* |
| Quintile 2 | 36.4* | 21.3* |
| Quintile 3 | 37.8* | 24.5 |
| Quintile 4 | 40.6* | 24.2 |
| Quintile 5 (highest) (reference) | 44.6 | 25.4 |
*: Significantly different from reference category
Source: Canadian Community Health Survey 2015-16
Inequalities in diabetes risk are driven in part by social determinants of health, including inequalities in income, social support or built environment7. These determinants influence opportunities and access to health promoting resources, including access to health care, food security and healthy eating and physical activity7.
To view these data and others on health inequalities in Canada, visit: https://health-infobase.canada.ca/health-inequalities/data-tool/
To explore the latest data on diabetes incidence, prevalence and all-cause mortality in Canada, visit: https://health-infobase.canada.ca/ccdss/data-tool/
- Footnote 1
-
Public Health Agency of Canada. (2021). Diabetes in Canada in review, 2021. Retrieved from https://www.canada.ca/en/public-health/services/publications/diseases-conditions/diabetes-canada-review-2021.html
- Footnote 2
-
Rates presented in this infographic are age-standardized based on the 2016 Canadian population.
- Footnote 3
-
In this infographic: 'income' refers to 'household total income'. This stratifier (income quintiles – provincial) represents a distribution of the household income adequacy ranking for the residents of each of the 10 provinces. This stratifier provides, for each respondent, a measure of their household income relative to the household incomes of all other respondents in the same province. The territories are excluded. It is derived from the total before-tax household income adjusted for household size and community size for CCHS. An income quintile is a measure of neighbourhood socioeconomic status that divides the population into five income groups (from lowest income to highest income) so that approximately 20% of the population is in each group.
- Footnote 4
-
No data were available among people who identify as Non-binary, as information on gender was not collected prior in CCHS 2015-2018. For more information, visit: https://www150.statcan.gc.ca/n1/en/catalogue/982000012021001
- Footnote 5
-
Public Health Agency of Canada. (2018). Key Health Inequalities in Canada: A National Portrait. Retrieved from https://www.canada.ca/en/public-health/services/publications/science-research-data/key-health-inequalities-canada-national-portrait-executivesummary.html
- Footnote 6
-
Gordon-Larsen P, Nelson MC, Page P, Popkin BM. Inequality in the built environment underlies key health disparities in physical activity and obesity. Pediatrics. 2006;117(2):417-424.
- Footnote 7
-
Kalenkoski, C. M., & Hamrick, K. S. (2013). How does time poverty affect behavior? A look at eating and physical activity. Applied Economic Perspectives and Policy, 35(1), 89-105.