
Inequalities in food insecurity in Canada: The experience of youth, adults and older adults
Download in PDF format
(360 KB, 2 page)
Organization: Public Health Agency of Canada
Date published: 2022-07-07
Food insecurity occurs when at least one member of the household does not have the variety or quantity of food they need due to lack of money12. Here, food insecurity includes moderate and severe food insecurity, as defined in the Canadian Community Health Survey (CCHS).
Large inequalities in food insecurity exist in Canada for a number of communities3.
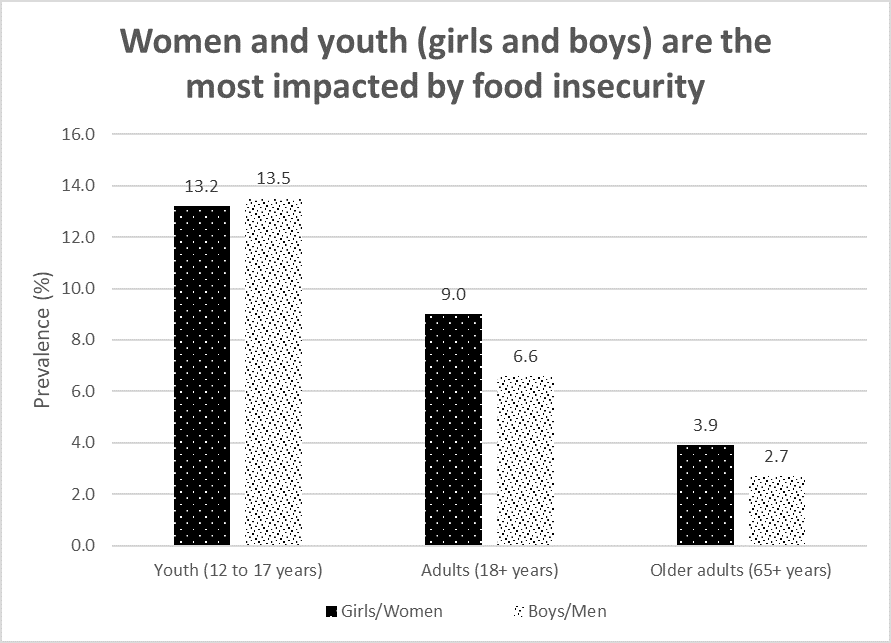
Table 1 – Prevalence (%) of Food insecurity over the life course by Sex
| Girls/Women | Boys/Men (reference) | |
| Youth (12 to 17 years) | 13.2 | 13.5 |
| Adults (18+ years) | 9.0* | 6.6 |
| Older adults (65+ years) | 3.9* | 2.7 |
*: Significantly different from reference category
There are inequalities in food insecurity for youth and older adults related to living arrangement:
Prevalence of household food insecurity is:
- 2.8 times higher for youth living with a single parent, compared to youth living with both parents
- 3.0 times higher for single parents living with children, compared to couples without children
- 2.0 times higher for older adults living alone, compared to older adults in other living arrangements
Household education level is a strong determinant of food insecurity, for all age groups:
Compared to people living in a household with university level education, the proportion of people with food insecurity living in a household with a lower than high school education is:
- 5.0 times higher among youth
- 6.8 times higher among adults
- 3.2 times higher among older adults
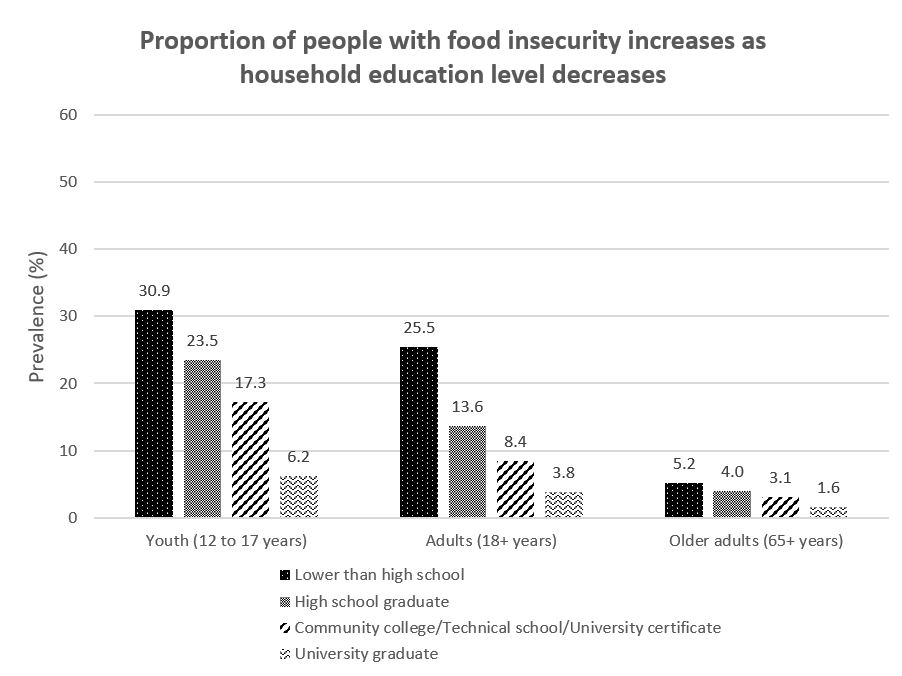
Table 2 – Prevalence (%) of Food insecurity over the life course by Household education level
| Youth (12 to 17 years) | Adults (18+ years) | Older adults (65+ years) | |
| Less than high school | 30.9* | 25.5* | 5.2* |
| High school graduate | 23.5* | 13.6* | 4.0* |
| Community college/Technical school/University certificate | 17.3* | 8.4* | 3.1* |
| University graduate (reference) | 6.2 | 3.8 | 1.6 |
*: Significantly different from reference category
Through the life course, the proportion of people experiencing food insecurity is higher among First Nations, Métis and especially Inuit communities, compared to non-Indigenous
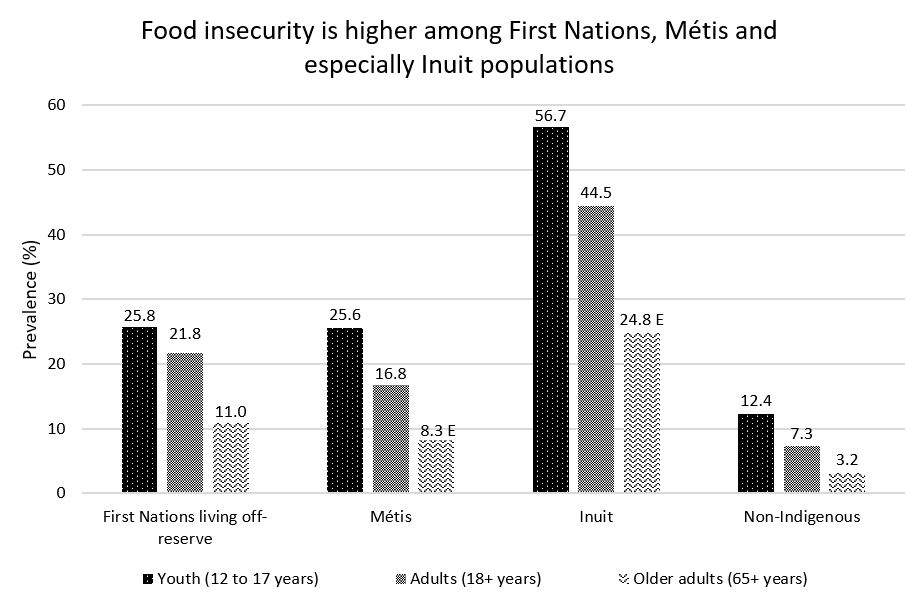
Table 3 – Prevalence (%) of Food insecurity over the life course by Indigenous identity
| First Nations living off-reserve | Métis | Inuit | Non-Indigenous (reference) | |
| Youth (12 to 17 years) | 25.8* | 25.6* | 56.7* | 12.4 |
| Adults (18+ years) | 21.8* | 16.8* | 44.5* | 7.3 |
| Older adults (65+ years) | 11.0* | 8.3* E | 24.8* E | 3.2 |
*: Significantly different from reference category
E: Interpret with caution
Inequities experienced by First Nations, Inuit and Métis populations are anchored in colonial policies and practices that began with Residential Schools, loss of cultural continuity, territories and languages. Unaddressed intergenerational trauma adds to the ongoing challenges faced by Indigenous peoples.
Remoteness:
Remoteness refers to an area’s geographic proximity to service centres and population centres4. In Canada, areas are considered:
- easily accessible
- accessible
- less accessible
- remote
- very remote
Across all ages, people living in ‘very remote areas’ are more likely to experience food insecurity, compared to those living in all other areas.
Compared to people living in easily accessible areas, the proportion of food insecurity for people living in very remote areas is:
- 2.7 times higher for youth
- 4.3 times higher for adults
- 5.1 times higher for older adults
Interventions aimed at the social determinants of food insecurity (for example, Universal Child Care Benefit, poverty reduction strategies, affordable housing) are promising solutions for reducing the overall prevalence and severity of food security, but also inequalities between Canadian populations1.
Source: Canadian Community Health Survey 2015-16, 2017-18
For more data on health inequalities in Canada, visit: https://health-infobase.canada.ca/health-inequalities/data-tool/
- Footnote 1
-
PROOF: Food Insecurity Policy Research. (2022). Household Food Insecurity in Canada. Retrieved from https://proof.utoronto.ca/food-insecurity/#policy.
- Footnote 2
-
Public Health Agency of Canada. (2018). Key Health Inequalities in Canada: A National Portrait. Inequalities in Household Food Insecurity in Canada. Retrieved from https://www.canada.ca/content/dam/phac-aspc/documents/services/publications/science-research/key-health-inequalities-canada-national-portrait-executive-summary/hir-full-report-eng.pdf.
- Footnote 3
-
Rates presented in this infographic for adults are age-standardized based on the 2016 Canadian population. No data were available among people who identify as Non-binary, as information on gender was not collected in CCHS 2015-2018. For more information, visit: https://www150.statcan.gc.ca/n1/en/catalogue/982000012021001
- Footnote 4
-
Statistics Canada. (2022). Index of Remoteness. Retrieved from https://www150.statcan.gc.ca/n1/en/catalogue/17260001.