
Monitoring changes in health inequalities through time: A scan of international initiatives and a rapid review of scientific literature

Download in PDF format
(694 KB, 70 pages)
Organization: Public Health Agency of Canada
Published: 2022-11-22
Cat.: HP35-155/2022E-PDF
ISBN: 978-0-660-41814-8
Pub.: 210621
Highlights
On this page
Overview
The burden of diseases and health conditions isn't shared equally among all Canadians. Some people are less likely to experience well-being. Others will be more likely to get sick or die. These differences are often because of individuals’ social and economic conditions. We call these "health inequalities".
The Pan-Canadian Health Inequities Reporting Initiative (or "HIRI") aims to track and report on health inequalities in Canada. It does so to inform health and social policy, to ensure health and well-being for all.
To date, HIRI has produced several reports. It has also produced an interactive Data Tool online. Readers can also browse the Initiative's many infographics. These reporting tools provide an important summary of key health inequalities in Canada. A next step is to explore how these inequalities have changed over time.
Tracking changes in health inequalities over time offers many benefits. It can help us find out if our prevention efforts are working. It can also tell us where to focus our health promotion interventions.
As the lead of HIRI, the Public Health Agency of Canada (PHAC) aims to begin tracking changes in health inequalities over time. First, we needed to establish the best practices to do so.
This report helps fill this gap in evidence. It summarizes a literature review of Canadian studies and international initiatives. The review helped to identify best practices to track inequalities over time.
Method
PHAC performed a rapid literature review. In total, we looked at 19 international initiatives. We also reviewed 14 Canadian studies that tracked health inequalities over time.
We looked at their objectives and aims. We explored what types of data and measures they used. We noted how they measured time, and what types of analyses they performed. We also catalogued the types of data visualization tools they applied. Then, we synthesized our findings.
Key findings
Most (68%) of the international initiatives reviewed explore changes in inequalities over time. By moving in this direction, PHAC will align Canada with its peer-countries.
We identified over 20 promising practices from the international initiatives and 14 Canadian studies. These included:
- Stating the purpose and objectives of the analysis
- Tracking changes in absolute and relative inequalities
- Measuring the determinants of changes over time
- Providing enough methodological detail to allow replication
- Using various data visualization techniques to convey key findings
These are but a few examples. We summarize the top "Recommendations" for HIRI at the outset of the report.
Conclusion
Tracking health inequalities over time is a top priority for health equity reporting. Doing so will align Canada's HIRI with the highest-caliber reporting initiatives of the world.
This review identified over 20 promising practices to use when tracking changes in inequalities. Applying these practices can ensure a high level of rigour and excellence. This is essential for guiding public health prevention and health promotion efforts.
Table of contents
- Index of tables
- Index of figures
- Executive summary
- Recommendations for HIRI analyses
- 1. Background
- 2. Methods
- 3. Results
- 4. Discussion
- 5. Conclusion
- 6. References
- 7. Supplemental material
- 8. Acknowledgements and authors
Index of tables
- Table 1: Search terms used to identify relevant references in the literature search on health inequalities monitoring through time
- Table 2: International initiatives to monitor health inequalities through time
- Table 3: Canadian studies of changes in health inequality through time (n=14)
- Table 4: Selection of jurisdictions for international scan
- Table 5: Search strings used to identify Canadian studies of health inequalities through time
Index of figures
- Figure 1: Number of outcomes (indicators) studied across international initiatives monitoring changes in inequalities through time
- Figure 2: Social stratification (exposure) measures used across international initiatives monitoring changes in inequalities through time
- Figure 3: Inequality measures used across international initiatives that monitor changes in inequalities through time
- Figure 4: Types of data visualization tools and frequency (n) of use across international initiatives that monitor changes in inequalities through time
- Figure 5: Rapid review of Canadian literature selection flow chart
- Figure 6: Coverage of NIH Quality Assessment Checklist items in studies reviewed (n=14)
- Figure 7: Outcomes (indicators) studied across Canadian studies (n=14) of changes in inequalities through time
- Figure 8: Social stratification measures used Canadian studies (n=14) of changes in inequalities through time
- Figure 9: Inequality measures used in Canadian studies (n=14) of changes in inequalities through time
- Figure 10: Types of data visualization tools and frequency (n) of use in the identified Canadian studies (n=14)
- Figure 11: Time periods covered international reporting on changes in health inequalities over time
- Figure 12: Time periods covered in Canadian studies of changes in health inequalities over time (n=14)
Executive summary
Background
The monitoring of changes in Canadian health inequalities over time and across groups and settings is currently missing from the Pan-Canadian Health Inequities Reporting (HIR) Initiative. This topic of analysis has been identified as a priority for the Initiative and Canadian health inequality surveillance. There is a need for an up-to-date portrait of the promising practices implemented by international initiatives and Canadian scientific literature, to assess changes in health inequalities over time.
Importance
Expanding health inequality monitoring to integrate a dimension of time can provide a better understanding of the pathways linking markers of social position to health outcomes upon which health and social policy can intervene, enable the tracking of potential health equity-related targets, and assess the effectiveness of existing interventions at meeting equity objectives.
Objective
We aimed to identify and summarize the key elements from international reporting initiatives and Canadian research assessing changes in health inequalities over time, including: stated purpose and analytic objectives; social stratification (exposure) measures; health indicator (outcome) measures; health inequality metrics; temporal data operationalization; statistical analyses; and data visualization approaches.
Purpose and Intended Audience
The primary purpose of this technical report is to guide future enhanced quantitative data analysis for the Pan-Canadian Health Inequalities Reporting (HIR) Initiative. This report is therefore intended for an audience of public health professionals with epidemiology and biostatistics training. More succinct knowledge dissemination products, adapted for diverse audiences are to come.
Methods
We conducted a review in two stages, each requiring a distinct search and data extraction strategy. Stage 1 involved an environmental scan of international surveillance and reporting initiatives that reported on changes in inequalities through time. Information on initiatives’ design and reporting practices was obtained by scanning countries’ official websites. No timeframe was imposed. Stage 2 involved a rapid scientific literature review. Articles were identified through a search of MEDLINE and Google databases for English- and French-language Canadian peer-reviewed and grey literature works published after 2010. Information from relevant publications was extracted and summarized using a narrative synthesis approach.
Findings
We found that a majority of international initiatives that were previously identified as reporting on health inequalities (N=19 scanned), also included a reporting component that explored changes in health inequalities through time (n=13/19, 68%). Among the promising practices identified were the inclusion of clear statements of purpose and analytic objectives, the use of both absolute and relative inequality metrics, the application of rigorous statistical methods to both assess the magnitude of inequalities, their determinants, and their potential changes over time, and lastly, the use of data visualization tools to convey findings. A principle gap in many of the international reports as well as in some of the Canadian scientific literature reviewed (N=14 studies reviewed) was an absence of sufficient detail regarding the methodological steps and analyses taken, to allow for analytic replication. Detailed technical reporting is an essential component of rigorous epidemiologic analysis and will represent a useful resource for other jurisdictions to draw from, for their regional, provincial, or national analyses.
Conclusions and relevance
Expanding Canada’s health inequality monitoring to include a temporal dimension represents a key priority to align the HIR Initiative with the highest calibre reporting initiatives of the world, and promote Canada’s public health leadership on the world stage. This review identifies over 20 promising practices as well as practices to avoid, to ensure the highest levels of relevance, excellence, and rigour of future enhanced Canadian analyses of changes in inequalities through time.
Recommendations for HIRI analyses
Summary of identified promising practices for enhanced reporting by the Pan-Canadian Health Inequalities Reporting Initiative (HIRI) on changes in inequalities through time:
Purpose
- 1. Specify the overall purpose of the enhanced temporal analyses before designing and performing analyses.
- 2. The scope of the specified purpose should focus on a transformative action cycle: from improved epidemiologic and etiologic understanding, to priority setting, to the monitoring of progress, to supporting and guiding policy action, and evaluating the impact of interventions.
Objectives
- 3. Align objectives with the overall purpose of the initiative.
- 4. Explore both descriptive and analytic objectives: aim to both describe overall outcome rates and inequalities in outcome rates over time, and to understand the determinants of these inequalities across time.
Outcomes
- 5. Identify and describe a process for health outcome selection.
- 6. Avoid grouping outcomes that may be shaped by heterogeneous etiological factors, or treatment or intervention strategies.
- 7. Include intermediary social and environmental conditions as outcomes of the analysis.
Social stratification (exposure) measures
- 8. Determine and justify the choice of stratification measures based on existing literature and guiding theories and conceptual frameworks.
- 9. The use of income, education, and area-level deprivation exposure measures is aligned with existing international monitoring initiatives and would allow cross-national comparisons. However, when used, their limitations must be acknowledged.
- 10. The use of additional sociodemographic measures such as race/ethnicity, immigrant status, is necessary to take into account the racialization of poverty.
Health inequality metrics
- 11. Estimate inequalities on an additive (absolute) and relative scale, using rate difference and ratio metrics.
- 12. If estimating concentration curves or coefficients (GINI), slope or relative indexes of inequalities measures (SII, RII), describe how these estimates should be interpreted.
- 13. When estimating SII or RII metrics using linear regression modelling, perform sensitivity analyses to test the validity of linearity assumptions. Alternatively, a hazard modelling approach can be applied to avoid making these assumptions.
Operationalization of time
- 14. Group years as needed for statistical power (e.g., 2- or 5-year averages) and consider the use of rolling or moving averages if data are severely limited. When using moving averages, analyses should be adapted to accommodate this form of data.
- 15. Consider integrating other time dimensions than calendar years (e.g. age or birth cohorts, captured by year of birth).
- 16. Use sufficient timeframes to be able to feasibly observe a change in inequalities (e.g. 5 years or more)
- 17. Differences in inequalities between two time points can be assessed. If seeking to test the significance of a temporal trend, the use of multiple time points (e.g., ≥ 5) is recommended.
Temporal analysis
- 18. Provide a systematic description of rates and inequalities, by group and time periods, respectively.
- 19. Test statistical differences in outcomes between groups and changes in inequalities between periods, using descriptive or regression-based analyses (using interaction terms between exposures and periods).
- 20. Perform decomposition analysis to explore drivers of changes in inequalities.
- 21. Provide sufficient methodological information to enable replication of all analytic steps.
Data visualization
- 22. Leverage both tables and data visualization tools such as connected scatter plots or stratified bar charts to describe changes in the outcomes across groups, and in the magnitude of inequalities, over time, respectively.
- 23. Include metrics of variance (95% CI) within tables and figures. If they cannot be depicted in figures (e.g. in choropleth maps), provide data in a supplemental table.
- 24. Ensure that data visualizations are accompanied by clear written interpretations of the findings on how inequalities changed over time.
1. Background
Through its endorsement of the 2012 Rio Political Declaration on Social Determinants of HealthFootnote 1, the Canadian Government has recognized that underlying social conditions play an important role in influencing population health and well-beingFootnote 2, and has pledged to act on the social determinants of health in order to promote health equity. A critical step towards improving health equity in Canada has been the need to understand the degree and distribution of health inequalities in the countryFootnote 3. To fill this gap, the Public Health Agency of Canada (PHAC), in collaboration with the Pan-Canadian Public Health Network, Statistics Canada, the First Nations Information Governance Centre (FNIGC) and the Canadian Institute for Health Information (CIHI), has led the Pan-Canadian Health Inequities Reporting Initiative (HIR Initiative), which aims to strengthen the measurement, monitoring and reporting of health inequalities in Canada.
This initiative has resulted in the development of an online, interactive Health Inequalities Data ToolFootnote 4 and the 2018 Key Health Inequalities in Canada: A National Portrait reportFootnote 5, as well as several related knowledge productsFootnote 6. These resources summarize the key associations that exist between social determinants and health outcomes in Canada as well as the population groups that bear a disproportionate burden of the conditions that shape health and well-being. As such, they provide a comprehensive baseline measure of the state of health inequalities in Canada.
However, the HIR Initiative has not yet begun monitoring changes in Canadian health inequalities over time. Expanding health inequality monitoring to include a temporal dimension has been identified as a key priority for the Initiative. This enhanced reporting component would be beneficial for several reasons. First, temporal analyses can help assess progress towards the WHO’s Sustainable Development Goals, particularly Goal 10 of reducing inequalitiesFootnote 3. Second, leveraging temporal data can allow for a better understanding of the timing and ordering of associations that link social determinants of health to health outcomes, upon which health and social policy can interveneFootnote 3. This information can offer the opportunity to assess whether and how (in what contexts, populations, and through which mechanisms) policies have influenced health determinants and outcomes overall as well as health inequalities.
To guide the scope and methods for enhanced monitoring of temporal trends in health inequalities in Canada, there is a need to first identify leading monitoring practices that have been successfully tested and implemented on the world stage. A recent environmental scan by Frank and Matsunaga (2020) explored the national monitoring systems of socioeconomic inequalities of health in 36 high-income OECD countries. Their review summarized the health indicators, socioeconomic social stratification variables, and the health inequality metrics that are used in seven countries that published reports on socioeconomic inequalities in healthFootnote 3. Missing from the latter scan, however, was a review of social stratification measures used beyond those of income, education or material deprivation—such as gender, country of birth or race/ethnicity—as well as an in-depth summary of the overall objectives and analytic methodologies used to assess changes in inequalities through time. With this rapid review, we aim to build on Frank and Matsunaga’s scanFootnote 3 to establish a methodology-focused updated portrait of the promising practices to assess changes in health inequalities over time, used across the international monitoring landscape.
However, the scope of international public health reporting initiatives can be limited due to operational realities of public health institutions, such as time constraints, regional variability in policy priorities, scientific capacity, or data availability. Given these potential limitations, and since the operational reality in Canada is unique, particularly with regards to data availability and accessibility, there is also a need to explore promising practices to assess changes in health inequalities over time within extant Canadian scientific literature. This information will be essential to ensure that future enhanced analyses and reporting by the HIR Initiative meet the highest standards of excellence and rigour.
The objective of this rapid review was, therefore, to review existing methodologies and identify promising practices used in international public health surveillance efforts in country settings similar to Canada, such as those of other high-income member countries of the Organisation for Economic Co-operation and Development (OECD), and Canadian research studies. We aimed to identify and summarize the stated purpose or aims, analytic objectives, as well as the social stratification (exposure) measures, health indicator (outcome) measures, health inequality metrics, temporal data operationalization, statistical analyses, and data visualization approaches used to monitor changes in inequalities through time. We did so through an environmental scan of international inequality monitoring systems (stage 1) and a rapid review of existing Canadian scientific literature (stage 2), respectively.
2. Methods
2.1 Review design
This review was conducted in two stages, each requiring a distinct search and data extraction strategy. In Stage 1, an environmental scan was performed to build on the previously identified evidence summarized by Frank and Matsunaga (2020)Footnote 3. This scan focused specifically on the analysis and reporting practices of countries that monitored changes in health inequalities through time. In Stage 2, a rapid literature review of individual Canadian studies or reports was conducted to identify additional methodologies that may not have been identified in existing national monitoring systems.
We used a rapid review design in this second phase, rather than a systematic review approachFootnote 7. Rapid reviews offer an approach to evidence synthesis that shares the same structure as a systematic review, but with an abridged, non-exhaustive evidence search component, that enables a faster synthesis of knowledge. Governmental actors often use a rapid review approach in contexts where time and personnel resources are limitedFootnote 7.
2.2 Stage 1: International scan
a) Eligibility criteria
In the first phase of the review, which involved a scan of high-income OECD countries’ reporting initiatives and practices, we included initiatives that 1) reported on at least one health inequality measure (relative or absolute) (e.g. rate difference, rate ratio, indices of inequalities, etc.) and described or assessed changes in that inequality across time 2) for a nationally representative sample (e.g. national estimates). Eligible reporting initiatives were 3) published in English or French—or available on an online platform that would allow for web-based translation into English or French (due to the authors’ languages of expertise). We excluded country initiatives that 4) reported on inequalities at a singular time-point (cross-sectional assessment), or 5) describe changes through time for a single group (within-group changes through time) rather than changes in the inequality between groups.
b) Search strategy
The countries selected for the international scan were identified in two steps. First, based on Frank and Matsunaga (2020)Footnote 3 scan of 36 countries’ reporting initiatives, we included the 12 countries that were observed to have published a retrievable report on social inequalities in health on their official websiteFootnote 3. Second, in addition to the latter, we performed an additional hand search of the websites of five countries and two international, multilateral organizations (WHO Europe, OECD), based on our (the author team)’s a priori awareness of previous, relevant reports that may have been missed by Frank and Matsunaga’s scanFootnote 3. Aligned with the rapid review design, this search was non-exhaustive but designed to capture a representative highlight of countries’ reporting practices. Additional details on the country selection for the present scan are provided in the Supplemental Material’s Section 7.1a’s Table 4. In total, 19 jurisdictions were reviewed, using the web-links (URLs) that Frank and Matsunaga (2020)Footnote 3 provided in their supplementary materials files:
- 1. Australia
- 2. Belgium
- 3. England
- 4. Germany
- 5. Israel
- 6. Italy
- 7. Japan
- 8. New Zealand
- 9. Northern Ireland
- 10. Norway
- 11. Mexico
- 12. Republic of Ireland
- 13. Scotland
- 14. Slovenia
- 15. Sweden
- 16. United States
- 17. Wales
- 18. WHO Europe
- 19. OECD
c) Evidence identification, data extraction and synthesis
Two reviewers independently screened identified countries’ public health websites (either AES or MA, with an independent review by AB). After a full-text review, two reviewers (AES, MA) extracted data on each initiative. If technical reports accompanied the main publications, these were identified and reviewed for additional details.
Past reviews on this topic have identified that tracking trends in health inequalities require at least four key components: indicators of health and well-being, social position variables, absolute and/or relative measures of health inequality, and a time horizonFootnote 8. Information on each of these elements were therefore extracted for each initiative. Elements extracted were: the publications’ country setting, authors and year of publication, aim(s), health indicators (outcomes), stratification (exposure) measures, health inequality metrics, and analytic methods. The content of the data extracted was reviewed by an independent reviewer (AB). A narrative synthesis of findings was performed, and described below.
2.3 Stage 2: Rapid review of Canadian literature
a) Eligibility criteria
In the second phase of the review of peer-reviewed and grey literature, we included works that 1) assessed changes in health inequality patterns through time—using at least one social stratification (exposure) measure that is meaningful for health equity. For example, measures could include socioeconomic or sociodemographic variables such as income, education, occupation, race/ethnicity or Indigenous identity. Works were restricted to 2) those set in Canada. Eligible works were 3) published in English or French—or available on an online platform that would allow for web-based translation into English or French (due to the authors’ languages of expertise)—4) since 2010 (i.e. between January 2010 and February 2021 when the search was conducted), 5) in peer-reviewed or grey literature sources, and 6) utilizing a population-representative sample.
We excluded works that 1) documented simulation- or prediction-based trends in health inequalities, as well as works that 2) were designed to evaluate programs or policies, 3) had a cross-sectional design with only a single time point, or 4) had a longitudinal design but followed only a single cohort (rather than multiple cohorts through time). Works were also excluded if 5) they focused on health outcomes that were beyond the scope of Canada’s Data Tool indicators (e.g. those that were biomedical or clinical focused, such as surgery outcomes or primary care wait-times)Footnote 4, or 6) if they were not available through the online Health Canada Library Network.
b) Search strategy
In the second stage, MEDLINE (through the PubMed interface) and Google databases were searched to identify additional studies and reports. The search strings that were applied are summarized in Table 1 (the exact search strings are summarized in the Appendix’s Table 5). The latter were applied in French in Google, of which the first five pages of results were reviewed. A snowball search was also applied, based on the reference list of identified publications and the Key Health Inequalities in Canada 2018 report: A National Portrait.
| Database | Search terms |
|---|---|
| Via EMBASE/PubMed | In titles/abstracts: (health) (Filters: full text, published between 2010-2021) |
| Via Google/Google Scholar | English terms: National, Monitoring, Surveillance, Health, Inequality, Inequalities, Trends, Time, Temporal, Socioeconomic, Social determinants, Deprivation, Education, Income, Occupation, Indigenous, First Nations, Métis, Inuit, Race, Ethnicity, Gender, Sex French terms: National, Surveillance, Santé, Inégalités, Iniquité, Équité, Tendances, Temps, Temporel, Série chronologique, Changement, Socioéconomique, Déterminants sociaux, Défavorisation, Éducation, Revenu, Occupation, Autochtones, Premières Nations, Métis, Inuit, Race, Ethnicité, Genre, Sexe (Filter: Jan 1, 2010, onwards) |
c) Data extraction, quality appraisal and synthesis
One reviewer (AB) screened the titles and abstracts of identified works, and applied the defined eligibility criteria to identify works to be reviewed in full. Screening was conducted using the Rayyan web interfaceFootnote 9. After full text review, one reviewer (AB) extracted data on publications’ country setting, authors and year of publication, aim(s), health indicators, stratifying measures, health inequality measures, and analytic methods.
One reviewer (EV) evaluated the quality and risk of bias of included works using an adapted scoring scheme based on items of the NIH quality checklist for observational cohort and cross-sectional studies, adapted for repeated surveysFootnote 10. NIH quality checklist items were adapted to be applied to repeat cross-sectional studies.
Points were awarded if the checklist item was present and 0 points were awarded if it was absent or unclear (total possible score of 12 for cross-sectional studies, 13 for cohort studies). Dividing scores by total items, summary scores were estimated. Summary scores of “low”, “moderate”, and “high” quality were assigned if up 70% of items, between 71% and 84% of items, and 85% of items and above were included, respectively. This is not a validated scoring system, but rather an approach to enable a quantitative synthesis of works’ rigour. A narrative synthesis of the works’ objectives, methodologies and quality was then performed and described below.
3. Results
3.1 Stage 1: International monitoring initiatives
In the first phase of the review, the websites of 19 jurisdictions were reviewed. Of these, 13 (68%) met the inclusion criteria of reporting on changes in health inequalities through time. These included Australia, Belgium, England, Germany Northern Ireland, Norway, Scotland, Slovenia, Sweden, the United States, Wales, WHO Europe (2 initiatives were identified for this jurisdiction, but it is counted once here) and the OECD. Detailed characteristics of included initiative reports (N=14) are summarized in Table 2.
There were several reasons why other jurisdictions’ initiative were excluded. For example, New Zealand, reported on indicator prevalence trends for distinct population strata, but only described the inequality between groups at a single time point (i.e. without assessing whether the inequality changed through time)Footnote 11. Similarly, the Republic of Ireland provides yearly, cross-sectional reports on health inequalities, but no explicit reports on how these health inequalities changed through time. The remaining countries (Israel, Italy, Mexico, and Japan) were excluded because they did not appear to publish English or French-language reports (or reports in formats that could be translated into English or French using online automated translation tools) on changes in health inequalities through time.
a) Objectives
Purpose
Though all jurisdictions stated specific analytic objectives (described in detail below), only seven described the overarching purpose of their analyses. These included:
- To identify and prioritise practical actions to reduce the most significant and widening health inequalitiesFootnote 12Footnote 13Footnote 14
- To better understand drivers of health inequalities across populations and areasFootnote 13Footnote 15
- To guide and support public health actionFootnote 15Footnote 16Footnote 17
- To monitor progress in tackling health inequalitiesFootnote 14Footnote 17
- To better understand the impact of interventions on health inequalities and health and well-beingFootnote 18
- To help set priority health indicatorsFootnote 18
- To gather information to foster political support for actionFootnote 12
- Explore how inequalities build up from childhood to adulthoodFootnote 13
Objectives
Many of the initiatives shared similar objectives. Although the exact wording of objectives varied across initiatives, the following objective structures were most common:
- 1. To describe an outcome (indicator) measure, for each social strata, and at two or more time points, respectively
- 2. To describe the absolute and/or relative inequality in an outcome between groups, for each year or period studied, respectively
- 3. To describe and assess the statistical significance of the change in outcome values between two time points, for each social group, respectively
- 4. To describe and assess the statistical significance of the change in inequality between two groups, across two time points
In addition, two other objectives were specified in WHO EuropeFootnote 12 initiatives were:
- 5. To assess determinants of the inequalities between groups, at two or more time points, respectively
- 6. Identify the most significant, persistent inequalities over time
b) Data sources
All initiatives used survey-based data, often drawing from several survey sources to obtain the data necessary for the multiple indicators studied. Eight of the initiatives also utilized registry-based data, namely to obtain data on births and deaths.
c) Measures
Outcome (indicator) measures
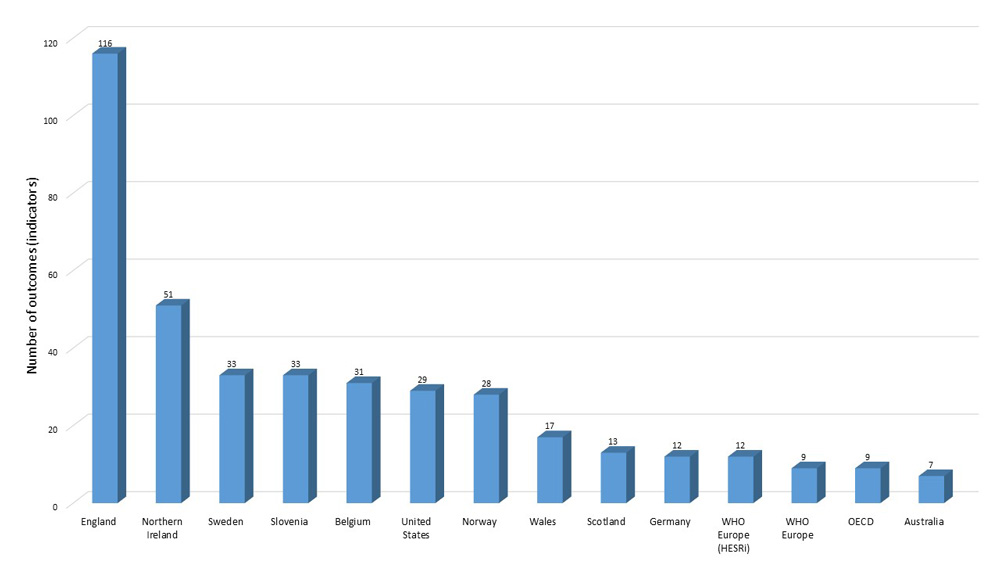
International initiatives tended to report on changes through time for a cluster of outcomes (or “indicators”). The number of indicators studied ranged from under tenFootnote 12Footnote 13Footnote 17 to 116Footnote 19 (Figure 1). The average number of indicators studied was 29 (Figure 1). Key indicator themes, studied across initiatives, included life expectancy and premature mortality, perinatal outcomes (birth weight, mortality), health conditions including mental health and disability, self-rated health, health behaviours, and living conditions (including poverty, social support, housing quality), and health care access.
Text description
This figure presents the number of outcomes (indicators) studied across international initiatives monitoring changes in inequalities through time. The horizontal axis describes the country or international organization, while the vertical axis describes the number of outcomes that were assessed. We found that England reported on 116 indicators. Northern Ireland reported on 51 indicators. Sweden reported on 33 indicators, as did Slovenia. Belgium reported on 31 indicators. The United States reported on 29 indicators. Norway reported on 28 indicators. Wales reported on 17 indicators. Scotland reported on 13 indicators. Germany reported on 12, as did the WHO Europe’s European Health Equity Status Report initiative. In another reporting initiative, WHO Europe explored 9 indicators, as did the Organisation for Economic Co-operation and Development (OECD). Lastly, Australia reported on 7 indicators.
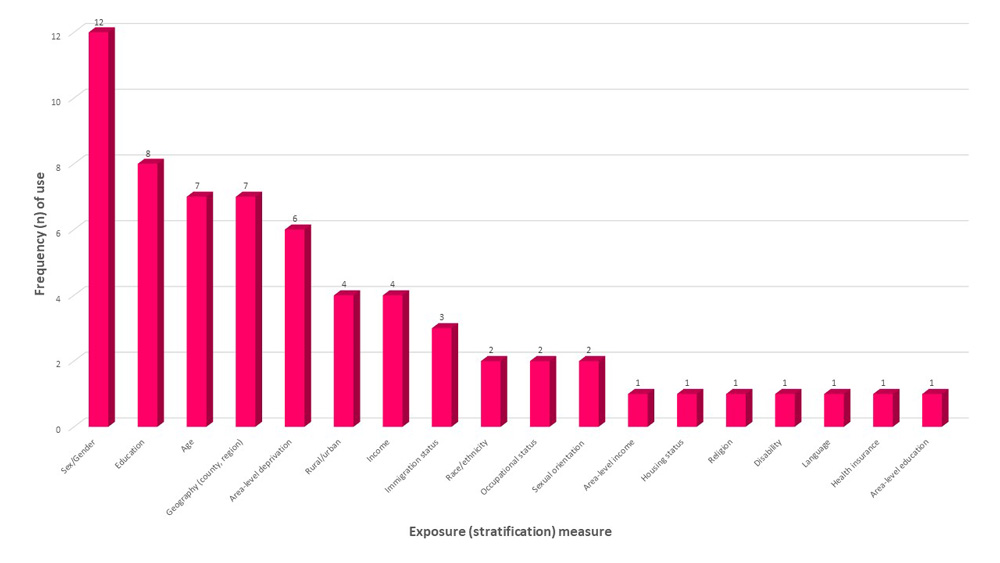
Social stratification (exposure) measures
International reporting initiatives tended to explore outcomes across two or more social stratification or exposure measures. Above and beyond sex/gender, age and jurisdictionally-relevant geographies, the five most commonly used social or economic stratification measures were educational attainment, area-level deprivation or disadvantage, rural/urban residence, income, and immigrant status (Figure 2). All income, education and deprivation measures were categorical, and either structured using quantiles or ordinal values (e.g. low, moderate, high).
Text description
This figure presents the social stratification or “exposure” measures that were used in the international initiatives monitoring changes in inequalities through time that were reviewed in the scan. The horizontal axis describes the exposure measures, while the vertical axis describes the number of initiatives that used each measure. Overall, 12 initiatives used exposure measures of sex or gender; 8 initiatives used measures of educational attainment; 7 initiatives used, respectively, measures of age or geography (county, region); 6 initiatives used measures of area-level deprivation; 4 initiatives used measures of rural/urban residence; 4 initiatives used measures of income; 3 initiatives used measures of immigration status; 2 initiatives used, respectively, measures of race or ethnicity, occupational status, or sexual orientation; lastly, 1 initiative used, respectively, measures of area-level income, housing status, religion, disability, language, health insurance coverage, or area-level education.
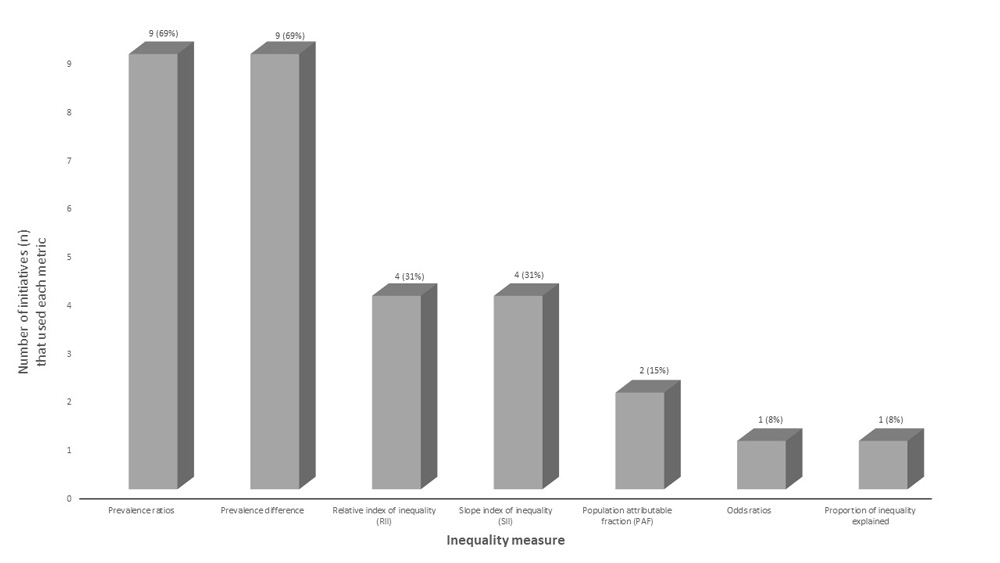
d) Inequality metrics
International reporting initiatives used a range of measures of inequality. The most common of which were rate ratios and differences between groups, followed by slope index of inequality (SII) and relative index of inequality (RII) measures (Figure 3). Eight (62%) of the reports employed both relative and absolute measures of inequality. Presenting either rate ratio and differences (e.g.Footnote 12Footnote 20Footnote 21, SIIs and RIIsFootnote 16Footnote 22, a combination of rate differences and RIIsFootnote 14, rate ratios and SIIsFootnote 18, or rate ratios and rate differences and RIIsFootnote 17). Two jurisdictions (Australia, Slovenia) also reported on changes in population impact using the population attributable fraction.
Text description
This figure presents the inequality measures or metrics that were used in the international initiatives monitoring changes in inequalities through time reviewed in the scan. The horizontal axis describes the inequality measures, while the vertical axis describes the number of initiatives that used each metric. Overall, 9 initiatives (69%) used prevalence ratios and prevalence difference metrics, respectively; 4 initiatives (31%) used relative index of inequality (RII) or slope index of inequality (SII) metrics, respectively; 2 initiatives (15%) used population attributable fraction (PAF) metrics; lastly, 1 initiative (8%) used odds ratios and proportions of inequality explained metrics, respectively.
Of the initiatives that estimated rate ratios, the majority did not specify how these inequality measures were computed. The three initiatives that did provide a minimum of information appeared to have obtained ratios either through Poisson regression modeling, or through simple division of rates between various groups and a referent group. Models were rarely adjusted for other factors beyond ageFootnote 22. Similarly, the initiatives that estimated rate differences largely obtained difference estimates through simple subtraction of rates between various groups and a referent group.
SII estimates were obtained using simple linear regression models. Very few details were provided regarding the models used, or whether any sensitivity analyses were applied. The RII estimates were produced using the SII linear regression modeling output. The initiative that estimated odds ratios used adjusted logistic modelsFootnote 21. However, the associated report did not explain why certain covariates (e.g. marital status) were included in the model. The proportion explained estimates were estimated using regression-based Oaxaca-Blinder decomposition methods. Lastly, the initiative that estimated GINI coefficients did not specify how these obtained these coefficients. Overall, the methodological sections of many of the reports were often severely limited.
e) Operationalization of time
Most initiatives reported on inequalities over a decade or more. Time periods studied were largely based on data availability (details on time periods studied, by country, presented in Appendix I). In a majority of reports (n=9), outcome rates and inequalities were presented by year within the studied period. However, to deal with limited data availability, several initiatives (n=7) also presented pooled averages of rates and inequalities across years. Additionally, analyses from most countries were based on three or more time periods, three jurisdictionsFootnote 12Footnote 17Footnote 23 had a portion of indicators with only 2 time periods available. Additionally, one initiative presented rolling averages of outcomes and inequalities across grouped years (e.g. for 2010-2014, 2011-2015, 2012-2016)Footnote 16. A rolling average is a useful tool when data are severely limited (e.g. when population sub-group samples are very small). The initiative in question presented descriptive statistics for each overlapping period. Lastly, one initiative operationalized time using birth cohorts (based on population’s year of birth), rather than calendar timeFootnote 13.
f) Temporal analyses
Although all reviewed initiatives described inequalities across time, only 8 initiatives performed statistical analyses of differences in inequalities across time periods. That is, they reported on whether the observed increase or decrease in the magnitude of inequalities was statistically significant between two or more periods. For these analyses, a baseline (reference) period was selected. However, of these 8 initiatives, four did not provide methodological details on how differences between two time periods were tested. The four initiatives that did provide details on the statistical analyses they performed each used a distinct method. The methods used were 1) a z-score based approach to test differences between two time periodsFootnote 23, 2) a regression-based approach in which an interaction term between time and the stratification measure(s) was usedFootnote 22Footnote 24, 3) Cochran-Armitage test for trendFootnote 22, and 4) a conservative approach of assessing for potential overlap in 95% confidence intervals between study periodsFootnote 16Footnote 22. Additionally, one initiative applied a joinpoint regression approachFootnote 22, which enabled both an identification of inflection points in trend line (e.g., when rates started to increase or decrease) and an average percent change over identified time periods.
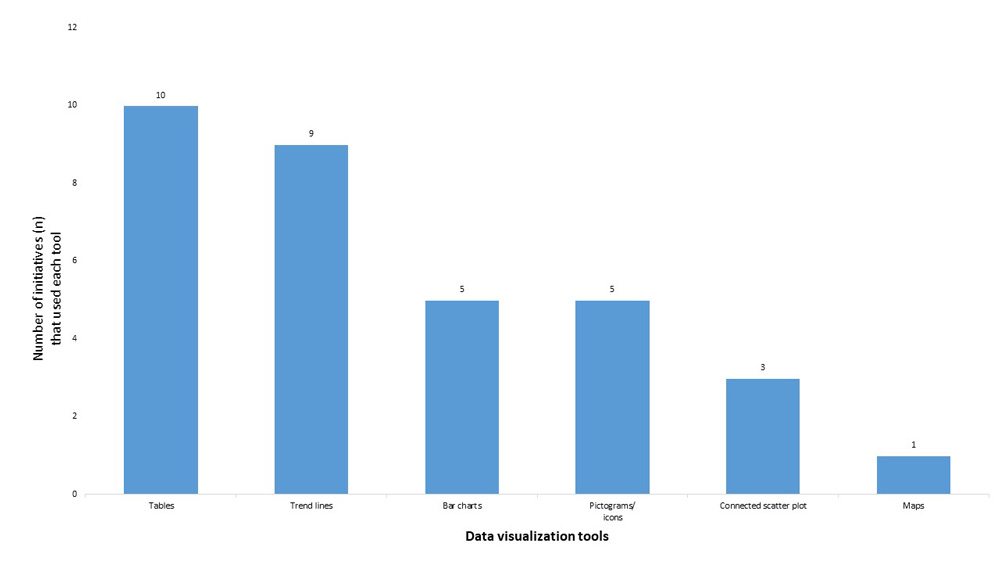
g) Data visualization
Ten of the initiatives reported their findings in table format. The next most common types of data visualization tools used were trend lines and bar charts, with rates and inequalities in rates presented by year or period. Other methods used included connected scatter plots and choropleth maps (Supplemental Material Section 7.2c). Examples of the data visualization techniques that were used across initiatives are described in the (Supplemental Material Section 7.2c). A majority of trend line figures did not include 95% confidence intervals.
Text description
This figure presents a histogram (bar chart) of the types of data visualization tools used across international initiatives monitoring changes in inequalities through time. The horizontal axis lists the types of data visualization tools while the vertical axis describes how many initiatives used these tools. 10 initiatives used tables to present data; 9 used trend line figures; 5 presented bar charts or histograms; 5 presented results using icons or pictograms to represent direction of change; 3 presented connected scatter plots, and 1 presented a choropleth map.
| Country (URL, Access date) |
Purpose/ Aim/ Objective |
Data source(s) |
Outcome Variables (health outcomes and indicators) |
Stratifier Variables (risk factors used to define groups) |
Inequality measure(s) (measures of inequality between groups) |
Time horizon |
Analyses | Data visualization(s) |
Comments |
|---|---|---|---|---|---|---|---|---|---|
Australia Indicators of socioeconomic inequalities in cardiovascular disease*, diabetes and chronic kidney disease** (2019) *CVD Accessed: 2021-11-18 |
Aim: Objective: |
ABS 2011–12 Australian Health Survey ABS Death Registrations to Census linked dataset AIHW National Mortality Database AIHW National Hospital Morbidity Database Australia and New Zealand Dialysis and Transplant Registry National Diabetes Services Scheme |
Indicators reporting change over time:
|
Stratifiers used for reporting change over time:
|
Summary measures used for reporting change over time: Rate ratio Rate difference Relative index of inequality (RII) Population attributable fraction (PAF) |
Mortality inequalities: Disease incidence: Disease prevalence: |
No statistical tests were conducted to ascertain the direction of a trend RII: |
Presentation of results for change over time: table form only Direction of trends: Arrows (icons) used to indicate if inequalities are increasing, decreasing or no change (where 3+ time points available, based on 2 consecutive falls/rises in given summary measure). |
|
Belgium Sciensano (National Public Research Institute) report Accessed: 2021/03/19 Interactive data site: |
|
1997-2013 Health Interview Surveys (HIS) 2014 Food Consumption Survey Belgium censuses 2001 and 2011 linked with the mortality were used |
31 indicators, including:
|
|
Difference in years of life expectancy between high and low education groups, by sex/gender, by year (2001, 2011) Prevalence ratios and Prevalence differences of other indicators (between “low” and “high” education groups) Note: population attributable fractions (PAFs) and “composite index of inequality” (CII) measures were also estimated, but only for 1 period (no change in time estimated) |
Difference in years of life expectancy between high and low education groups, by sex/gender, by year (2001, 2011) Mental health Prevalence differences and ratios, by year (2001, 2004, 2008, 2013) Smoking, obesity Prevalence differences and ratios estimated by year (1997, 2001, 2004, 2008, 2013) |
Frequency-based estimation of prevalence ratios and differences [details on analytic methods are lacking] A “test for statistically significant change” was reported, however no details on statistical analyses are provided |
Connected scatter plots of difference in life expectancy or prevalence differences or ratios (y axis) by year (x axis); |
|
England Public Health Outcomes Framework (PHOF) Data Tool – England URL: Accessed: 2021-03-22 |
|
NHS Digital Office for National Statistics data Department for Work and Pensions / HM Revenue and Customs Index of Multiple Deprivation And other governmental data sources |
116 indicators reported through time, falling under 5 themes:
Additional indicators also report health inequalities; however, they are not reported through time |
Primary stratifier:
Secondary stratifiers: For select indicators (e.g. well-being):
|
By strata: Slope Index of inequality (SII) for deprivation deciles in England, ONLY for life expectancy at birth and life expectancy at 65 (for males and females, separately) (e.g. life expectancy) |
Times horizons vary according to the indicators and stratifiers. Most of the indicators are reported by year, approximately from 2010 to 2019; although some are reported since 2006-2007, and others starting around 2014-2015 |
Many rates (e.g. cause-specific mortality rates) were age-standardized through indirect standardization; SII estimation through least-squares linear regression, based on rates for each decile of deprivation by year |
Tables Trend lines of rates or SII (y-axis) by year (x-axis), for each strata Bar charts of rates (y-axis) by according to deprivation deciles (x-axis), stratified by year Several bar charts are presented for each year, which allows analyzing data through time |
|
Germany “Health Inequalities in Germany and in international comparison” 2018 report by Robert Koch Institute URL: Accessed: 2021/03/17 |
Describe temporal trends in health inequalities | European Statistics on Income and Living Conditions (EU-SILC); The German Cardiovascuar Prevention Study (DHP); German National Health Interview and Examination Survey 1998 (GNHIES98) Epidemiological Survey of Substance Abuse (ESA); National Food Consumption Study (NVS); German Oral Health Study (DMS); German Socio-Economic Panel (SOEP); German General Social Survey (ALLBUS) |
12 indicators:
|
Regional-level Socio-economic deprivation(Low, Middle, High) Sex (males, females) Income (from SOEP) – individual or household level. Strata used were:
Educational level Low (<High school), middle, (High school), high (>High school) |
Overall prevalence and incidence, by year, by strata Odds ratio (95% CI) measuring relative income inequalities (quintile 1 versus quintile 5) for men & women, by year period Rate difference (RD), Rate ratio (RR) (all-cause mortality comparing low vs high educational group) |
Self-rated health: 1994-1999, 2000-2004, 2005-2008, 2009-2014 Income inequalities: 1984 to 2000 (data grouped 2-year periods 1984-1985, 1989-1990, 1994-1995, 1999-2000) Smoking: 2003, 2009, 2010, 2012 Life expectancy at age 63: 1995 to 2008 (grouped by 1995-1996, 2007-2008) Life expectancy at birth: 1998 to 2013 separated into 4 groups in 3-year increments; 1998-2000, 2003-2005, 2008-2010, 2011-2013) Mortality: 1980 and 2010 Diabetes: 1988 to 2012 (data grouped as 1988-1994, 1999-2000, 2001-2002, 2003-2004, 2005-2006, 2007-2008, 2009-2010, 2011-2012) Sporting activity: 2003 to 2012 (single-year data for 2003, 2009,2010, and 2012) |
Odds ratio estimation was not described in the report RR / RD estimated by dividing and subtracting, respectively, rates for each group; 95% CI estimated using 1000 sample replicates (bootstrap); details largely missing in the article and the Koch report] Differences in RR and RD between two time periods estimated through subtraction (no 95% CI provided, just p-values) [details were missing on how these changes were estimated; details are largely missing from this article and the Koch report] |
Connected scatterplot of prevalence/rates (y axis) for each subgroup) across time (x axis) Odds ratio plot: Bar charts Tables (All cause mortality) |
|
Northern Ireland Health Inequalities Annual Report (report and data tables) URL: Accessed: 2021/03/30 |
Overall aims:
Objectives: |
General Register Office data NI Health Survey: Public Health Information & Research Branch Vital Statistics & Administrative Research and Support Branch Northern Ireland Statistics and Research Agency (NISRA) Information Analysis Directorate (Department of Health) NI Cancer Registry, NI Maternity System |
Inequalities reported for 51 indicators through time, related to:
Several indicators were age-standardized, using the direct method, taking the 2013 European Standard Population (ESP) as standard population |
Primary stratifier:
Secondary stratifiers: (only for certain indicators)
|
By strata: Prevalence and rates (%, per 1000, per 100 000 population): for the least and the most deprived areas “Absolute gap” rate difference between the least and the most deprived areas Slope Index of Inequality (SII): to calculate the absolute inequalities between the least and the most deprived areas accounting for the distribution across all deciles (only for life expectancy at birth and age 65) Relative Index of Inequality (RII): to calculate the relative inequalities between the least and the most deprived areas accounting for the distribution across all deciles (for all indicators except those related to life expectancy) The SII and RII were not systematically estimated for all indicators |
For Life expectancy and General health: by rolling 3-year periods (2012-14; 2013-15; etc. to 2015-2018) Premature Mortality: rolling 3- to 5- year periods (2010-14; 2011-15; […] 2016-18) Major diseases: Cancer: rolling 7-year periods: 2007-13; 2008-14; […] 2011-17 Other indicators: rolling 4-year periods: 2012-15; 2013-16; […] to 2016-19) For Hospital activity: rolling 2-year periods: 2014-15; 2015-16; […] to 2018-19) Self-harm: rolling 6-year periods: 2010-15; 2011-16; […] 2014-19 Suicide rate: rolling 3-year periods: 2012-2014; 2013-15; […] 2016-18 Mood & Anxiety prescription rate: 2014-2018, yearly Lung cancer incidence: 2007 to 2017, yearly Infant mortality rate: 2010 to 2018 (5-year periods: 2010-14; 2011-15; etc.) Diet and Dental Health: 2014 to 2019 (2-year periods: 2014-15; 2015-16; etc.) |
“Absolute inequality” appears to be the crude difference between rates in the least and the most deprived areas [no specific details were provided] SII estimation: through linear regression [very few details provided in the report, see p.54] RII estimation: calculated by dividing SII by the population average (mean) outcome Changes in estimates through time were estimated by comparing 95% confidence intervals [few details were provided, see p. 9] |
Tables in the Excel sheet and in the Report Bar Charts: Trend lines *Throughout the report and the Data Tables (Excel sheet), pictograms are displayed for every indicator in order to illustrate changes in gaps between disadvantaged and advantaged areas of NI |
|
Norway Reports from the Norwegian Institute of Public Health (NIPH) Norhealth database, containing exhaustive data on the health of Norwegians: URL: Accessed: 2022-04-25 NIPH reports on Social inequalities, URL: Social inequalities in health. Report in PDF format, URL: Report 2018. |
Overall aim: to better understand drivers of health inequalities across populations and counties in Norway in order to guide public health action. Objectives:
|
National surveys from Statistics Norway; updated every 3 to 4 years National health registries (9 registries other than the one from Statistics Norway) All the data is gathered in a Municipal Statistics Bank that general Public Health Profiles for all Norway, based on selected indicators |
28 indicators reported through time, falling under 4 themes:
Additional indicators also report health inequalities; however, there are not reported through time |
Educational attainment – 3 levels Age – 2 or 3 groups Gender – Men, Women and Both Genders Geography – Disaggregating by Counties (n=18) or by Regions (n=4) For Childhood indicators : Grade level (5th or 8th Grade) Not all 28 indicators are disaggregated by education, gender, age and geography. Education is the one that is systematically used when evaluating health outcomes through time |
Prevalence (% or rate per 100 000 people per year) Numerator (number of people) Standard ratio (for Geography only): Ratio between county and national average for a given year; E.g. A ratio of 87 means that the county's percentage is 13% lower than the national level |
Times horizons vary according to the indicators and stratifiers, e.g.: For indicators related to life expectancy and cause-specific mortality, time horizons approximately between 1981 and 2005; For indicators related to childhood, time horizons approximately between 2014 and 2018; For indicators related to living habits, environment and morbidity, time horizon approximately between 1998 and 2015 |
Indirect standardization for age and gender distribution | Interactive tables; Trend lines (y axis: rates; x axis: time; stratifiers: Gender, Age, Educational attainment and Geography); Bar charts are also used to display rates of several indicators across certain stratifiers; however, this data visualization does not allow to follow the evolution of trends through time |
|
Scotland “Long-term monitoring of health inequalities” report (December 2018) URL: Accessed: 2021-03-30 |
Overall aim: to identify and prioritise practical actions to reduce the most significant and widening health inequalities in Scotland. Objective: |
National Records of Scotland Scottish Health Survey NHS Information Services Division (ISD) Scottish Cancer Registry |
Inequalities reported for 13 indicators related to:
Indicators were age-standardized, using the direct method, taking the 2013 European Standard Population (ESP) as standard population |
Area-level Deprivation index based on the Scottish Index of Multiple Deprivation decile groups (estimated based on equal weighting of area-level income and employment) |
By strata:
|
For premature mortality: RII estimates for each year between 1997 to 2017 [report p.8] For Mental wellbeing, Limiting long-term conditions for adults and Self-assessed health: RII for 2-year periods between 2008 to 2017 (2008-2009, 2010-2011, etc.) For CHD, Cancer Alcohol and Low birthweight: RII for each year between 1996 to 2017 |
“Absolute inequality” appears to be the crude difference between the least and the most deprived areas [no specific details were provided] RII estimation: |
Trend lines Overall non-stratified estimates for each year are also reported in table format |
|
Slovenia Inequalities in Health: Future Challenges for Intersectoral Cooperation URL: Accessed: 2021-11-17 |
No explicit objectives provided (generally: describing inequalities between groups) | Mortality Database Perinatal Information System of the Republic of Slovenia Slovenian Registry of Prescription Drug Consumption The Cancer Registry of the Republic of Slovenia European Health Interview Survey (2007, 2014 and 2019), Health Behaviour in School-Aged Children (2002, 2006, 2010, 2014 and 2018) Living Conditions (EU-SILC) Household Consumption (Household Budget Survey) |
33 indicators covering:
|
Stratifiers used for reporting change over time: Educational attainment (Lower i.e. less than high school, Higher, i.e. post-secondary and higher) Sex (males, females) |
Rate difference (RD), ratio (RR) Relative index of inequality Slope index of inequality Population attributable fraction |
Mortality and fertility: 2006-2019 (3 time points using 3 year aggregation) Prescription drugs: 2012-2019 (annual time points) Cancer: 2012-2017 (annual time points) HBSC: 2002-2018 (5 time points) |
RD estimation: absolute difference in rates between groups (subtraction) RR estimation: ratio of rates between groups (division) Change in inequality over time: Joingpoint regression for cancer Cochrane-Armitage trend test for survey-based outcomes (EHIS and HBSC) SII, RII, PAF: |
Trend lines of outcomes (Y axis) across time(X axis), by education and for each sex Colour coded icons to represent trend in low/high education gap by indicator based on improvement / deterioration / no change or inconclusive |
|
Sweden Public Health Authority Website URL: ref English summary, URL: Accessed: 2021/02/03 |
Assess for potential changes in inequality between groups across time |
Open Comparisons Public Health Study | 33 indicators Themes:
|
Education Pre-upper secondary Upper-secondary Post-secondary (Age- or gender-adjusted) – individual level Immigration / Country of birth (Nordic region, Rest of Europe Outside Europe, Sweden) overall and by gender Sex (males, females) Age (15-year groups) overall and by gender |
Prevalence and incidence ratios (relative risk – RR) (age- and sex adjusted) Overall prevalence estimated. |
Prevalence / incidence estimation for: Differences tested: |
RR estimation: Poisson regression models *Complete-case analyses Changes through time: Assessed through Poisson regression modeling of prevalence difference, with interaction terms between group variables and time (two analyses: continuous- and indicator-based time measure used) [ref] |
Connected scatter plot of prevalence (Y axis) for each subgroup) across time (X axis) Change analysis results only reported in-text |
|
United States Health Disparities and Inequalities Report – United States, 2013 (189p.) URL: Accessed: 2021-04-14 |
|
Current Population Survey Behavioral Risk Factor Surveillance System; National Immunization Survey National Health Interview Survey National Vital Statistics System National Survey on Drug Use and Health National HIV Surveillance System National HIV Behavioral Surveillance System Medical Monitoring Project; National Health and Nutrition Examination Survey Agency for Healthcare Research and Quality, Healthcare Cost and Utilization Project U.S. Census Bureau’s Federated Research |
Health inequalities reported for 29 indicators through time, falling under 5 themes:
Additional inequalities are reported for other indicators; however, they are not reported through time (cross-sectional only) Estimates were age-standardized for a 12 indicators (education level, income/poverty and all 10 leading causes of Death) |
Primary stratifier
Secondary stratifiers:
|
By strata:
|
Life expectancy Yearly, 1999-2008 HIV Infections Yearly, 1999-2017 Preventable hospitalizations Yearly, 2001-2009 Obesity 3-year periods, 1999-2002, 2003-2006 and 2007-2010 Diabetes, Heart disease, Alzheimer. Cancer Chronic Lower Respiratory Disease, Cerebro-vascular disease Influenza & Pneumonia Unintentional injury, Suicide, Nephritis Disaggregated data only for 1999 and 2010 Infant mortality 2005 and 2008 Motor vehicle-related deaths 2005 and 2009 Health-related quality of life; Self-rated physical health; Self-rated mental health; Employment status; Pre-term births 2006 and 2010 Homicides 2007 and 2009 Teenage births 2007 and 2010: Health insurance 2008 and 2010: Education level; Income/poverty 2009 and 2011: Cigarette smoking 2006-2008 and 2009-2010: Seasonal influenza vaccination coverage 2009-2010 and 2010-2011 |
“Absolute difference” estimated by taking the difference in rate between exposed referent group. Statistical significance tested using two-tailed z test with Bonferroni correction for multiple comparisons. No 95% CI computed. “Relative difference” estimated by dividing the absolute difference by the rate value for the referent category, multiplied by 100: [R1-R0]/[R0]*100 (i.e. the proportion (%) by which the group’s rate is higher or lower than the reference) Changes in “relative difference” through time estimated by taking the difference between estimates at two time points. Standard errors (SE) for the change estimates are estimated using a multi-step formula process, using SE data on both groups, and z-score calculation [CDC’s 2010 Health People Technical Appendix A p.10, available from Appendix A: Technical Appendix] |
Most of data is shown in Table format. For 4 indicators (life expectancy, obesity, potentially preventable hospitalizations and homicides), trend lines are presented for each stratifier (education, race/ethnicity) of rates (y-axis) by years (x-axis) |
|
Wales Public Health Wales Observatory data reporting (Tableau – PHOF2017 Characteristics – Area). URL: Accessed: 2021-03-30 Trends and interactive data, URL: |
Overall aims:
Objective: |
Welsh Health Surveys (managed by the Welsh Govt) Welsh Index of Multiple Deprivation (managed by the Welsh Govt’s Statistical Directorate and the Local Govt Data Unit) Mid-year populations estimates and Public Health Mortality (managed by the Office for National Statistics (ONS)) Details on data sources available via the accompanying Technical Guide |
Health inequalities reported for 17 indicators through time, falling under 4 themes:
Additional inequalities are reported for other indicators; however, they are not reported through time (cross-sectional only) |
Primary stratifiers:
Secondary stratifiers:
|
By strata:
|
For indicators related to Overarching outcomes: Life expectancy: 2005 to 2014 (4-year periods: 2005 to 2009; 2009 to 2014) Preventable mortality: 2005 to 2014 (3-year periods: 2005-2007 to 2012-2014) For indicators related to Living conditions: 2008 to 2017; For indicators related to Ways of living: For indicators related to Health throughout the life-course: |
Rate ratio CI 95% (differences between least and most deprived): only calculated and presented for all-cause mortality SII CI 95% (inequality gap in years): only for life expectancy at birth and healthy life expectancy No statistical analyses for trends in inequalities were found for the other indicators |
The majority of the data are available via an Excel sheet tables Trend lines graphs and bar charts of rates (y-axis) across time (x-axis) for each deprivation quintile (strata) |
Several links must be consulted to gather the information about health inequalities monitoring through time.
|
WHO Europe - Health Equity Status Report initiative (HESRi) Healthy, prosperous lives for all: the European Health Equity Status Report (2019) URL: Accessed: 2021-04-14 |
Overall aim:
Objectives:
|
European Union Statistics on Income and Living Conditions (EU-SILC); Eurostat Organisation for Economic Co-operation and Development (OECD) databases Global Data Lab; European Quality of Life Survey; Health Behaviour in School-aged Children Data Management Centre; World Values Survey |
Health inequalities reported for 12 indicators through time, falling under 3 themes
Estimates were age-standardized using the direct method with the WHO World Standard Population There are 96 additional indicators for which inequalities were reported however, those indicators are not reported through time (cross-sectional only) |
Primary stratifiers:
Secondary stratifiers:
|
By strata: Indicator estimates (prevalence (%), life expectancy, etc.) Absolute difference in prevalence/rates between the most and least disadvantaged groups Proportion of inequality explained (cross-sectional assessment) |
Life expectancy: 2005 to 2016 Self-reported health and life satisfaction – Children: 2002 to 2014 Self-reported health and life satisfaction - Adults: 2003 to 2016; 2005 to 2017 Self-reported mental health: 2007 to 2016 Infant deaths: 2005 to 2016 Poverty status: 2005 to 2017 Temporary employment status: 2000 to 2017 Access to green spaces: 2011 to 2016 Long-standing limitations in daily activities due to health problems: 2004 to 2016 [It is unclear if many years were included between the two periods identified] |
Absolute difference estimated by taking the difference between the most and least disadvantaged groups [No details provided – simple difference computation assumed] Change in inequality through time assessed by estimating the “linear trend across all the data [time] point” (p.158) and estimating the p-value for the trend (alpha = 0.10; p<0.10) [It is unclear how the trend was estimated; we assume a linear regression model was used] Proportion of inequality explained estimated using Neumark and Oaxaca-Ransom regression-based decomposition |
Only pictograms were provided illustrate whether inequities have widened (red arrow: slope > 0, p<0.10), narrowed (green arrow; slope <0, p<0.10) or remained the same (yellow circle, slope=0 or p>0.10) No trend lines nor tables to show disaggregated data through time |
|
WHO – Europe Environmental health inequalities in Europe: Second assessment report Europe (2019) URL: Accessed : 2021-11-18 |
Objectives:
|
Eurostat WHO and UNICEF reports European Topic Center on Air Pollution and Climate Change Mitigation (ETC/ACM) |
Health inequalities reported for 9 indicators through time, falling under 2 broad themes
Estimates were age-standardized using the direct method with the WHO European region population [standard population year not specified] Disaggregated data are available for 10 additional indicators, however, these inequalities are only reported cross-sectionally |
Primary stratifier:
Secondary stratifiers:
|
By strata:
|
Sanitation: 2000, 2005, 2010 and 2015 Drinking-water services: 2000, 2005, 2010 and 2015 Noise: 2007 to 2016 (yearly) Air pollution: 2007-2008, 2010-2011, 2013-2014 Road traffic injuries - rates: 2002 and 2011 Road traffic injuries - mortality: 2006 and 2016 Ability to pay energy bills: 2008 and 2016 Ability to keep the home cool during summer: 2007 and 2012 Overcrowding: 2009 and 2016 |
Absolute difference estimated by taking the difference between the most and least disadvantaged groups [No details provided – simple difference computation assumed] Rate ratio is calculated and presented: most disadvantaged compared to the least disadvantaged [No details provided – simple difference computation assumed] |
Tables Box plots of estimates (y-axis) across strata groups (x-axis), stratified by period (e.g. Figure 28) Trend lines of estimates (Y-axis) by year (x-axis), with lines for each strata or combined strata Graphs used to depict a connected line (with arrow-head direction) between the magnitude of the inequality at two time points, respectively. (e.g. Figure 63) Maps (only for air pollution exposure) – showing absolute changes between European regions (See Fig. 27); but inequalities not represented Other maps show estimates across regions, for two separate time periods (e.g. Figure 39 for road traffic incidents); but inequalities not presented |
|
OECD Preventing Ageing Unequally 25 OECD countries and 9 other major economy and G20 countries (2017) URL: Accessed: 2021-11-18 |
Overall aim:
|
Health and Retirement Survey (HRS) in the USA 2000-2014 English Longitudinal Study of Ageing (ELSA) 2002-2012 Household Income and Labour Dynamics in Australia (HILDA) Survey 2001-2014 European Community Household Panel (ECHP) 1994-2001 European Union Statistics on Income and Living Conditions (EU-SILC) survey 2004-2014 Panel Study of Income Dynamics (PSID) 1970-2013 Global FEM |
Socioeconomic health inequalities reported for 9 indicators through time falling under 2 themes:
|
Main stratifier:
Secondary stratifiers:
|
By strata:
|
For 8 of the 9 indicators, time is based on birth cohorts not calendar years: The number of cohorts or time periods used vary depending on the indicator For 2 of the 9 indicators (Disability and Real hourly wages), time periods are used to track inequalities through time. For example, for the disaggregation of Disability by education level (and other stratifiers), time horizons are from 2002 to 2012 (data available bi-yearly) Note: for the indicator Real hourly wages, data are presented using both birth cohorts (see Fig 4.10) and time horizons (see Fig 4.9) |
Stratified estimates are presented without an estimation of absolute differences (e.g. Real expected lifetime earnings, Fig 4.11, p. 152 and Remaining life years, Table 4.1, p. 165) Rate ratio, between highest and lowest education [No details provided – simple ratio computation assumed] Education premium: GINI coefficients were estimated for countries across time periods (no methods for GINI estimation were provided) Changes in income Gini coefficients (in percentage points) are presented [No analytical details provided – simple difference computation assumed]. (see p. 26 of the report – Figure 1.5) |
Trend lines of estimates or $USD (Y-axis) by year – bi-yearly, (x-axis), with lines for each strata or combined strata e.g. Figure 2.10 and Figure 4.9 Bar charts Tables (e.g. Table 4.2 p. 167) Note: Additional graphs (histograms) are provided to describe cross-sectional inequalities |
Following a life-course based approach, birth cohorts were used to report changes in inequalities through time Birth cohort-based analyses can be hard to understand at first, require careful interpretation Most indicators only present data disaggregated by country, age groups and gender; only a few use a socioeconomic stratifier Underlying (stratified) rate estimates were often missing when inequalities were presented. For example, changes in GINI coefficients were presented, without a description of GINI coefficients at each time point compared (see p.26 of the report – Figure 1.5.) |
3.2 Stage 2: Canadian studies
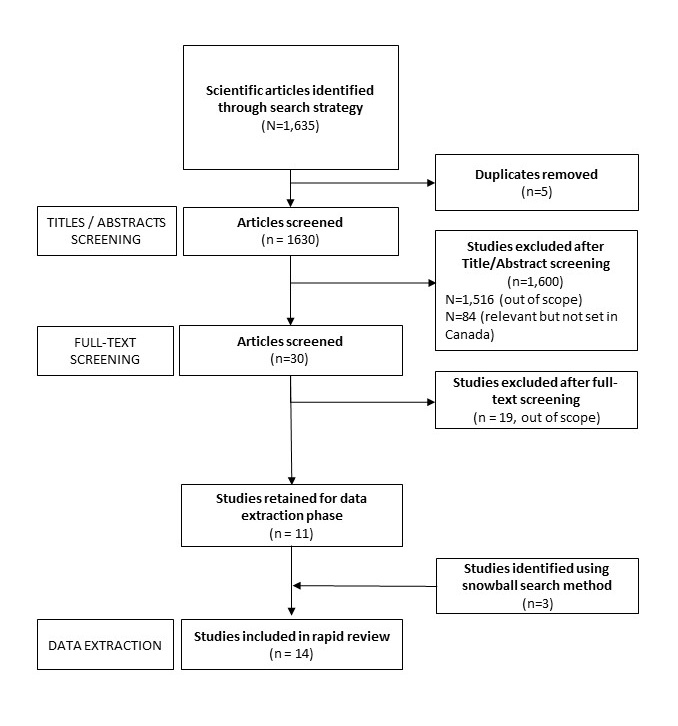
In the second phase of the review, 1635 titles and abstracts of scientific manuscripts were retrieved and screened. Of these, 14 were set in Canada and met all eligibility criteria (See Section 2.3 a) Eligibility criteria). Detailed characteristics of selected Canadian works are summarized in Table 3.
Text description
First, 1635 articles were identified through database searches. 5 of these articles were duplicates. The titles and abstracts of the remaining 1630 articles were screened for relevance. 1600 articles did not meet the review’s eligibility criteria, and therefore 30 articles remained. Of the articles excluded, 1516 were deemed irrelevant or out of scope and 84 were relevant but were not set in Canada. We reviewed the full text of these 30 articles to perform a more complete eligibility verification. This resulted in the exclusion of 19 articles because they were out of scope. The final 11 studies were included in the review for data extraction. Reviewing the references of these 11 studies, 3 additional relevant articles were identified using a snowball hand-search. Thus, a final 14 studies were included in the review.
On average, reviewed works included 78% of the quality appraisal checklist items (79% “High” quality, 21% “Moderate” quality). The most commonly missing features missing were sample size justification/power description, assessment of exposure over time for the same individual (e.g. whether incomes were different in childhood versus adulthood) and the measurement of exposure prior to the outcome being measured (Figure 6).
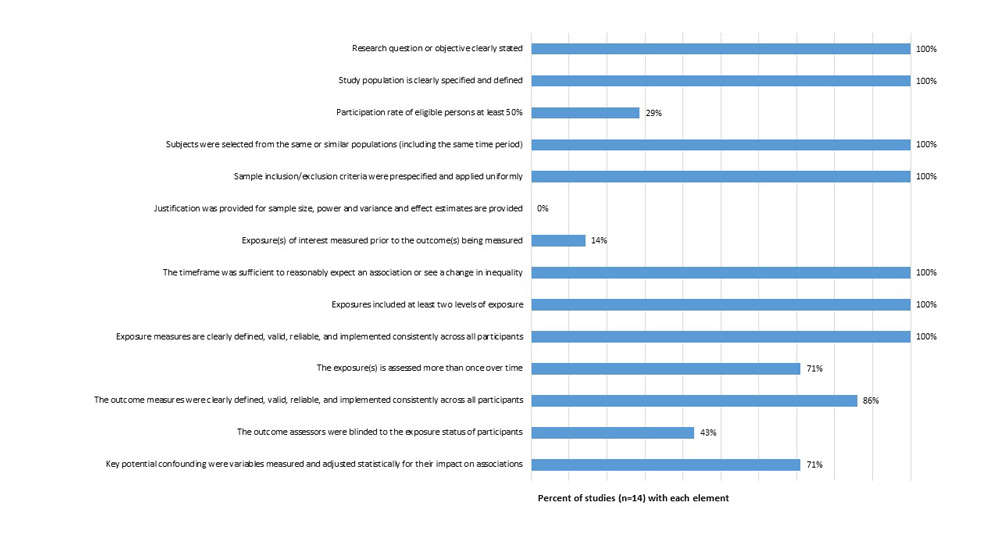
Text description
This figure presents the quality appraisal results for 14 Canadian studies reviewed. The vertical axis describes each of the 14 quality appraisal checklist elements. The horizontal axis describes the percent of initiatives that presented each quality appraisal checklist element. Overall, 100% of initiatives included each of the following checklist elements: the research question or objective was clearly stated; the study population is clearly specified and defined; study subjects were selected from the same or similar populations (including the same time period); the sample inclusion/exclusion criteria were pre-specified and applied uniformly; the timeframe was sufficient to reasonably expect an association or see a change in inequality; the exposure measures included at least two levels of exposure; and the exposure measures were clearly defined, valid, reliable, and implemented consistently across all participants.
For the other elements, 29% of studies had a participation rate of eligible persons was at least 50%; 0% of studies provided a justification for sample size or power estimates; 14% of studies measured the exposure(s) of interest measured prior to the outcomes; 71% assessed the exposure(s) more than once over time; 86% ensured that the outcome measures were clearly defined, valid, reliable, and implemented consistently across all participants; 43% ensured that the outcome assessors were blinded to the exposure status of participants; and lastly, 71% measured and adjusted for key potential confounding variables.
Other limitations of reviewed studies included the lack of participation rate for each survey and limited adjustment for potential confounding variables, other than age and sex/gender. Detailed quality assessment results are presented in Section 7.2 Quality evaluation: Scientific studies.
a) Objectives
Many of the studies shared similar objectives. Although the exact wording of objectives varied across studies, the following objective structures were most common:
- 1. To describe the absolute and/or relative inequality in an outcome between groups, for each year or period studied, respectively (n=14/14 studies)
- 2. To describe and assess the statistical significance of the change in inequality between two groups, across two time points (n=9/14 studies)
Building on the latter description-focused objectives, other works also sought to understand the etiology of inequalities, and changes therein, over time, as well as potential heterogeneity in inequality patterns across groups:
- 3. To assess determinants of the inequalities between groups, at two or more time points, respectively (n=3/14 studies)
- 4. To assess if the magnitude of the inequalities between groups varied (differed) based on groups’ age and/or sex (n=1/14 studies)
b) Data sources
In the fourteen Canadian studies reviewed, eight data sources were used, six of which were national in scope. The two most commonly used data sources were the Canadian Community Health Survey (CCHS) (n=7, 50% of studies) and Ontario’s ICES provincial health data (n=2, 14%). The remaining sources were used in only one of the reviewed studies. At the national level, pan-Canadian data sources included the National Population Health Survey (NPHS), the Aboriginal Peoples Survey (soon to be called the Indigenous Peoples Survey, IPS), the Canadian Tobacco Use Monitoring Survey (CTUMS), the CanCHEC cohorts, and the Discharge Abstract database data. One study used data from Ontario’s Integrated Public Health Information System (iPHIS).
c) Measures
Outcome (indicator) measures
A majority of studies focused on one to three outcomes. The outcomes most commonly studied were diabetes, premature mortality, obesity, self-rated health and smoking (Figure 7). One of the studies, a report on health status for the City of Toronto (Ontario, Canada), explored 13 outcomes including lung cancer incidence, physical inactivity, chlamydia, gonorrhea, low birth weight, childhood injury, and risk of falls among the elderly. None of the studies explored outcomes pertaining to living conditions such as receipt of social support or housing quality.
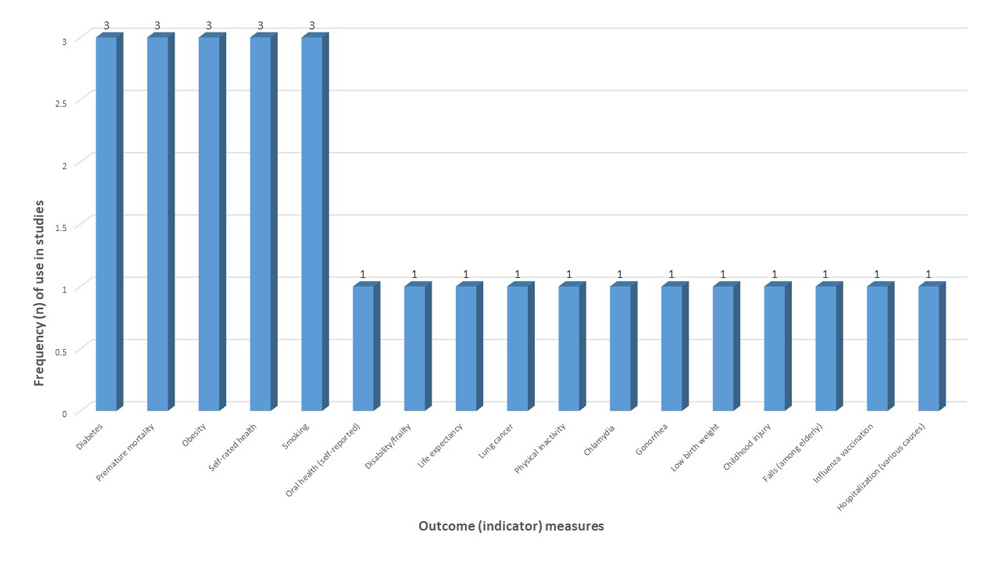
Text description
This figure presents the outcome or indicator measures that were used in the 14 Canadian studies reviewed. The horizontal axis describes the outcome measures, while the vertical axis describes the number of studies that used each measure. Overall, 3 studies explored, respectively, measures of diabetes, premature mortality, obesity, self-rated health, and smoking. One study explored, respectively, oral health, disability or frailty, life expectancy, lung cancer, physical inactivity, chlamydia, gonorrhea, low birth weight, childhood injury, fall risk (among the elderly), influenza vaccination, and hospitalization.
Social stratification (exposure) measures
The five most commonly used exposure measures used in the Canadian studies were income, sex/gender, educational attainment, age, and a measure of geography (Figure 8). Other measures included marital status (e.g. married or in common-law status, divorced/widowed, single), area-level deprivation (quintiles), homeownership (yes, no), immigrant status (including time since immigration), urban or rural residence, receipt of social assistance, and occupational status.
Several operationalisations of occupational status were used. These included a dichotomous measure of employed or unemployedFootnote 25, a measure of ability to work (yes, no)Footnote 26 and a measure of work sector (e.g. white collar, blue collar, sales work, student, unemployed)Footnote 26.
Income was mostly studied quintile values. Both individual- and area-level income measures were used (e.g.Footnote 27). Income values were also often equivalized, based on household sizeFootnote 25Footnote 26Footnote 28Footnote 29. Educational attainment was operationalized based on grade groupings and degree obtained. Geography measures included both categorical measures of province or territory of residenceFootnote 26 and regional groupings of provinces and territories, such as: “Western” Canada (British Columbia, Alberta, Saskatchewan, Manitoba), “Atlantic” Canada (New Brunswick, Prince Edward Island, Nova Scotia and Newfoundland and Labrador), “Central” Canada (Ontario and Quebec), and the TerritoriesFootnote 28Footnote 30Footnote 31.
Individual-level measures of race/ethnicity, including measures of Indigeneity, were used in three studies. These included a dichotomous measure of white versus non-whiteFootnote 29, and a categorical measure of white, Black, Indigenous, Asian, multiple/other groupsFootnote 25. One study explored First Nation, Inuit and Metis populationsFootnote 28.
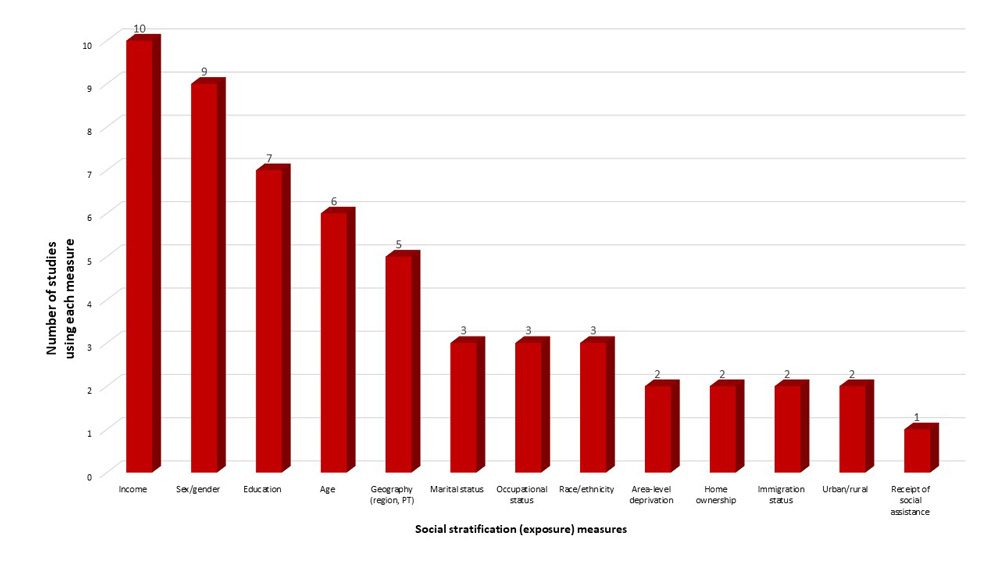
Text description
This figure presents the social stratification or “exposure” measures that were used in the 14 Canadian studies that were reviewed. The horizontal axis describes the exposure measures, while the vertical axis describes the number of studies that used each measure. Overall, 10 studies used exposure measures of income; 9 studies used measures of sex or gender; 7 studies used measures of education; 6 studies used measures of age; 5 used measures of geography such as region or province; 3 used measures of marital status, occupational status, and race or ethnicity, respectively; and 2 studies used, respectively, measures of area-level deprivation, home ownership, immigration status, and rural versus urban residence. Lastly, 1 study used a measure of receipt of social assistance.
Note: PT” refers to Province or Territory
d) Inequality metrics
In Canadian studies, seven measures of inequality were used. These included, in descending order of frequency: rate differences, slope index of inequality (SII) and relative index of inequality (RII) measures, rate ratios, concentration indexes, odds ratios and population attributable fractions (Figure 9)
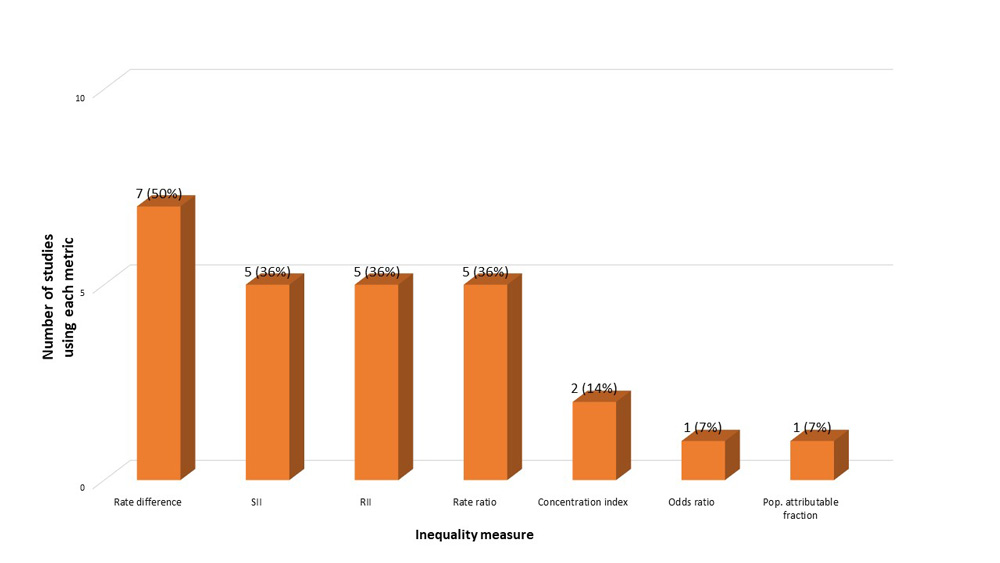
Text description
This figure presents the inequality measures or metrics that were used in the 14 reviewed studies. The horizontal axis describes the inequality measures used while the vertical axis describes the number of studies that used each metric. Overall, 7 studies (50%) used rate difference metrics; 5 studies (36%) used, respectively, relative index of inequality (RII), slope index of inequality (SII), and rate ratio metrics; 2 studies (14%) used concentration index metrics; and 1 study (7%) used odds ratios and population attributable fraction metrics, respectively.
Note: “SII” slope index of inequality. “RII” relative index of inequality. “Pop” population.
The most common metric used as an absolute measure of outcome difference (e.g. prevalence, incidence or life expectancy difference) between groupsFootnote 25Footnote 27Footnote 32Footnote 33Footnote 34Footnote 35. Not all works reviewed explicitly described how they measured outcome differences, or the variance associated with difference estimates (e.g. 95% confidence internals)Footnote 33. Differences were mostly computed descriptively using crude numerator and denominator values, and subtracting the value for one group from a reference group. No regression modeling was used.
In the works that estimated both Slope index of inequality (SII) and Relative index of inequality (RII) valuesFootnote 29Footnote 30Footnote 34Footnote 36Footnote 37, several analytic approaches were used. The most common approach was the use of generalized linear models, with log binomial- and identity-links applied for RII and SII estimation, respectivelyFootnote 29Footnote 37. Another approach was the specification of a logistic regression model for RII estimation, with subsequent use of post-estimation predicted probabilities for SII estimationFootnote 30. Both of the latter approaches relied on an assumption of linearity of the inequality across the social marker studied. A third approach that was used, that does rely on the assumption of linearity, was Moreno-Betancur’s hazard modeling approach, in which Cox proportional hazard and additive hazard models are used for RII and SII estimation, respectivelyFootnote 36. None of the studies appeared to have applied sensitivity analyses for their RII or SII estimations.
Works that estimated inequalities using outcomes ratios (e.g. rate ratios, relative risk measures)Footnote 27Footnote 33Footnote 34Footnote 35Footnote 38 either estimated these ratios descriptively using crude numerator and denominator values, and taking the ratio between groups of interestFootnote 27Footnote 38, or simply did not specify how ratios were estimated.
Two studies used concentration index measuresFootnote 26Footnote 28. These measures are estimated using ordinary least squares regression. One study estimated odds ratios using logistic regression models. Lastly, one study estimated population attributable fractions, but did not specify how this metric was computedFootnote 34.
e) Operationalization of time
On average, the studies reported on inequalities over a period of 14 years (ranging from 8Footnote 31 to 21 years Footnote 38). None of the reviewed studies examined outcomes after 2017. Time periods studied were largely based on data availability (details on time periods studied, by study, are presented the Appendix’s Figure 12). Descriptive results were presented by year or by grouped years (as a pooled average). No rolling averages were presented.
f) Temporal analyses
Although all reviewed initiatives described inequalities across time, the methods used to do so varied across studies. Three of the studiesFootnote 26Footnote 28Footnote 36 provided graphical depictions of outcomes across groups, over time, with no formal test of significance in inequalities across time. Three studies performed decomposition analyses, to study the determinants of inequalities across timeFootnote 25Footnote 26Footnote 28. The latter studies conducted decomposition analyses that were stratified by time period, and discussed differences in the estimates of proportion of inequalities explained across time period. Three studiesFootnote 27Footnote 33Footnote 34 assessed whether inequalities changed over time by examining whether 95% confidence intervals overlapped across study periods. Three studies used regression-analyses, using models that were adjusted for a continuous or categorical time measure, as well as interaction terms between exposure measures and timeFootnote 29Footnote 31. Two studies used descriptive test statistics (t-tests, z-tests) to test differences in inequalities between time periodsFootnote 35Footnote 37.
g) Data visualization and interpretation
All of the studies reported their findings in table format. The next most common types of data visualization tools used were connected scatter plots and trend lines, with rates and inequalities in rates presented by year or period (Figure 10). In the three studies that applied decomposition analyses to estimate the proportion of inequalities explained by various social determinants of health, cumulative bar charts were used to depict the proportions of inequalities explained. Lastly, bar charts were used in one of the studiesFootnote 34, as was Blakely’s three-way compass to describe the direction of absolute and relative inequalities through timeFootnote 36. Examples of the latter data visualization techniques are described in the (Supplemental Material Section 7.2c). A majority of graphic representations of trend lines or connected scatter plots of outcomes over time did not include 95% confidence intervals.
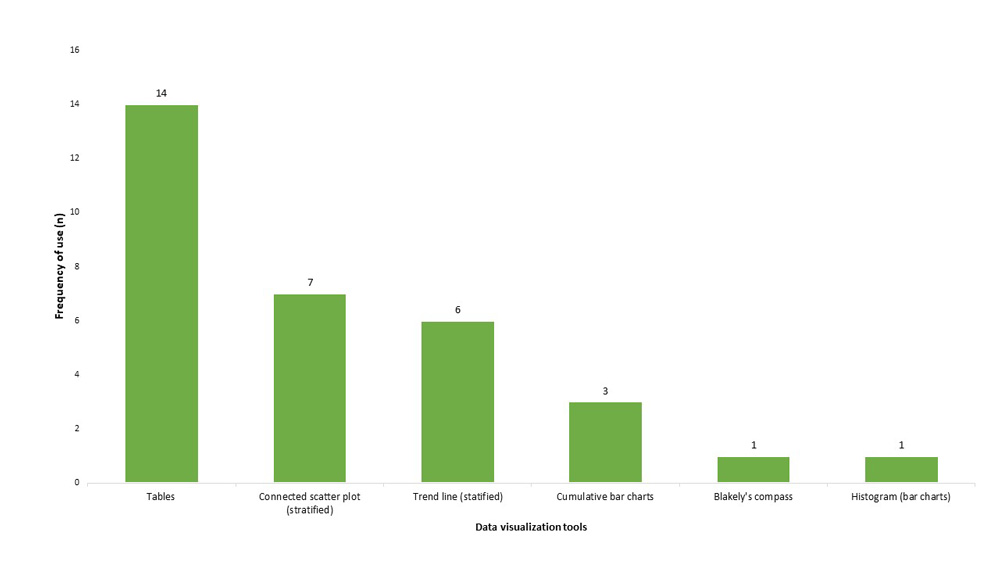
Text description
This figure presents a histogram (bar chart) of the types of data visualization tools used across the 14 Canadian studies that were reviewed. All 14 studies used tables to present data; 7 used connected scatter plots; 6 used trend line figures; 3 used cumulative bar charts; and 1 study used, respectively, bar charts (or histograms) or Blakely’s compass diagram.
Beyond presenting findings using visual aids, authors provided written interpretations of whether and how inequalities changed over time. The direction of inequality changes were described. Additionally, several reports explained how underlying outcome rates changes in the specific sub-populations to shape the direction and scope of the inequalityFootnote 27 (key take-home message interpretations are summarized in Table 3).
Authors interpreted the coefficient estimates of regression models on SII and RII as indicating the “absolute and relative changes in the SII and RII respectively for each additional year”, where negative values indicated an increase in outcome burden in least advantaged groups compared to those in most advantaged groups, over timeFootnote 30. For example, in a study of inequalities in type 2 diabetes, negative regression coefficients in SII or RII models were interpreted as indicating that “the absolute inequality in type 2 diabetes has increased over time”Footnote 30. In contrast, an absence of a statistically significant change in RII or SII values was interpreted as follows in another study: “our findings also suggested that the severity of this inequality has not improved over the course of ten years”Footnote 37.
Studies that applied decomposition methods described which factors significantly contributed to the observed inequalities. For example, one study’s key take-home message was that “factors such as occupation status, drinking habits and educational attainment […] contribute negatively to the observed inequality in obesity risk in Canada”Footnote 26.
| Author, Year, Title |
Objective(s) | Data source(s) | Outcome Variables |
Stratifier Variables |
Inequality measure(s) |
Time horizon |
Analyses | Data Visualization |
Quality | Interpretation |
|---|---|---|---|---|---|---|---|---|---|---|
Brown et al. (2015) Growing social inequality in the prevalence of type 2 diabetes in Canada, 2004-2012. |
|
CCHS 2004/05 and 2007/08, 2009/10, 2011/2012 Adults age 25 years and above (N=413453) |
Self-reported Type 2 diabetes diagnosis prevalence | Stratifier variables:
|
Slope index of inequality (SII) Relative index of inequality (RII) stratified by sex, by year and by region |
Change in trends between 2004 and 2012 | RII/SII estimation:
Change over time: Regress SII and the natural log of RII on time (7 time points, using random effects of meta-regression analyses; using Metafor package in R), weighted by inverse of SE of gender-specific SII or RII. |
Trend line plots of SII and RII (Y) across year (X), by region and sex, with 95% CI Scatter plot (95% CI) of SII and RII (Y) across time (X) with beta coefficients for relative change in SII or RII across time, by sex Tables |
Low | Coefficients represent absolute and relative changes in SII/RII for each additional year (2004-2012): “The difference in the prevalence of type 2 diabetes between individuals with the highest level of educational attainment compared to the lowest, as reflected by the SII, expanded from approximately 2.5% to 4.5% for women and 1.4% to 2.3% for men between 2004 and 2012.” |
Buajitti et al. (2020) Changing relative and absolute socioeconomic health inequalities in Ontario, Canada: A population-based cohort study of adult premature mortality, 1992 to 2017. |
|
Ontario population cohort (ICES administrative data) linked with Vital Statistics Database | All-cause premature mortality (among aged 18-74 years; rates per 1000) Hazard Age- (18-34, 35-44, 45-55, 55-64, 65-74) and sex-specific |
Stratifier variable:
|
Slope index of inequality (SII) (deaths per 1000) Relative index of inequality (RII) stratified by year |
Rates per year (1997 to 2017) | SII/RII estimated using unadjusted Cox proportional hazard models (for RII) and additive hazard models (SII) (Moreno-Betancur approach), stratified by sex and year. Change over time: visually depict SII and RII simultaneously (Blakely et al.) “SII values are a transformed representation of the estimated RII values, based on the following mathematical relationship between rate, RII and SII: SII = 2 × rate × (RII– 1) ÷ (RII + 1)” |
Trend line plots of mortality per 1000, stratified by deprivation quintile Blakely’s three-way “compass” plot: RII (Y) by mortality rates (X), mapped with SII contour bands Tables |
High | Visuzalization: RII paths in relation to SII contour lines and rates: “adult premature mortality rates steadily decreased (decreasing values along x axis) while relative inequalities steadily increased (increasing values along y). For much of the study period, absolute inequalities remained fairly static; here the paths move in parallel to the SII contour lines. Approaching 2017, there is a demonstrable increase in absolute inequalities, above and beyond what is expected from the simple algebraic relationship between overall rate and SII, as the trend-line paths diverge vertically upwards from the SII contours.” |
Bushnik et al. (2020) Socioeconomic disparities in life and health expectancy among the household population in Canada. |
|
CanCHEC 1996, 2011 cohorts N = 4,526,300 |
Five-year mortality follow-up:
at ages 25 and 65, based on person-years of follow-up |
Stratifier variables:
|
Difference in LE between groups Change in LE difference between groups |
Change between LE in 1996 and 2011 | Z-test (Z-score based testing of equality between two estimates) | Scatterplot of LE and HALE (Y) by education group (X), stratified by income, for 2011. All other reporting via tables. |
High | Take-home message: “A distinct stepwise gradient in LE and HALE also exists by level of education within and across income quintiles. There is evidence that disparities are wider than they were 15 years ago, but not necessarily to the same extent for both sexes or at different ages.” |
CIHI (2015) Trends in Income-Related Health Inequalities in Canada — Methodology Notes |
|
CCHS Survey of Labour and Income Dynamics |
16 indicators, including – age standardized: All age-standardized |
Stratifier variables:
|
“Disparity” rate ratio (RR) “Disparity” rate difference (RD) Between Quintile 1 and Quintile 5 Potential rate reduction (population attributable fraction) Potential impact number (prevented fraction) |
Change between 1993 and 2011 (2 time-points) | Crude rate estimation, 95% CI estimated using CIHI variance formula Crude difference calculation for changes over time, statistical difference estimating by assessing for overlapping confidence intervals [insufficient information to know how variance of the difference was estimated] Change over time only estimated if estimate at time 1 did not approach null. |
Tables Stratified trend lines of outcomes on y-axis, years on x-axis, with a line per group |
Moderate | Take-home message: “this report identified increased inequality over time for the following 3 indicators: |
Fang et al. (2020) Changes in income-related inequalities in oral health status in Ontario, Canada. |
|
CCHS 2003, 2007, 2013/14 | Self-reported oral health (“poor” vs. higher) | Social stratifiers for inequality:
Additional strata:
|
Slope index of inequality (SII) (multiplied by 100 for intepretation as % point difference) Relative index of inequality (RII) stratified by year, and by age and sex |
Change between 2003 and 2013/14 (2 time-points) | Index of inequality estimated by first estimating prevalence in each income group, and ranking income into ridit scores (0 to 1). SII and RII estimated using GLM (log-binomial with identity link for SII estimation and log link for RII estimation). Sex- and age-stratified analyses. Change in SII and RII over time estimated by taking the % change between first and last survey waves (simple calculation only. |
Tables Connected scatter plots with SII and RII on y-axis, years on x-axis |
Moderate | Finding no statistically significant difference in SII or RII over time, authors write: “Our findings also suggested that the severity of this inequality has not improved over the course of ten years.” |
Hajizadeh et al. (2014) Socioeconomic inequalities in adult obesity risk in Canada: trends and decomposition analyses |
|
CCHS 2000/01 to 2009/10 N= ~130,000 | Obesity (assessed via BMI) | Inequality stratifier:
Decomposition predictors:
|
Concentration Index in relation to income, stratified by year and age Overall and by sex |
Descriptive analyses of changes between 2000/01 and 2009/2010 (2-points) | Descriptive analyses of exposure and outcome means across time (table and trend line graphs) C index estimated by ordinary least squares (OLS) regression Wagstaff decomposition of C index using a linear probability model (for the absolute contribution of exposures to inequality), in 2000/01 and 2009/10 respectively (stacked bar chart) |
Tables Stratified trend lines of outcomes on y-axis, years on x-axis, with a line per group Cumulative bar charts for % explained, stratified by time and group |
Moderate | Interpretation of C index findings: “The results showed that obesity is concentrated among the poor in Canada. The inequality, however, decreased over the study period.” Decomposition analyses are stratified by time (not explaining change through time, rather differences in determinants of the inequality at various time points). Finding interpretation: “Factors such as occupation status, drinking habits and educational attainment are other determinants that contribute negatively to the observed inequality in obesity risk in Canada.” |
Hajizadeh et al. (2016) Socioeconomic gradient in health in Canada: Is the gap widening or narrowing? |
|
NPHS 1998 to 2011 | Health Utility Index Frailty Index |
Inequality stratifier:
Adjustment variables
|
Relative index of inequality (RII) Slope index of inequality (SII) Adjusted for sex, age, race/ethnicity |
RII and SII estimation, stratified by year: |
SII/RII estimated using GLM models for SII and RII estimation (log and identity link) Unadjusted and adjusted for age, sex, race/ethnicity Change in inequality through time assessed using GLM model with interaction term between fractional rank and time (continuous measure) |
Tables |
High | Interpretation: “The statistically significant decreases in the relative and absolute indices suggested that income- and education-related inequalities in health widened among Canadian adults.” |
Hajizadeh et al. (2018) Socioeconomic inequalities in health among Indigenous Peoples living off-reserve in Canada: trends and determinants |
|
Aboriginal Peoples Survey (3 cycles; 2001, 2006, 2012) N=68,040 | Self-rated health (poor/fair) | Inequality stratifiers:
Decomposition predictors:
|
Relative concentration index Absolute concentration index in relation to income Stratified by year, sex, Indigenous group (FN, Inuit, Metis), region |
Descriptive analyses of changes between 2001 and 2012 (2-points) | Descriptive analyses, stratified by year (2001, 2006, 2012), chi-squared for difference between 2001-2012) (table and trend line graphs) C index estimated by ordinary least squares (OLS) regression. Wagstaff decomposition of C index using a linear probability model (for the absolute contribution of exposures to inequality), in 2000/01 and 2009/10 respectively (stacked bar chart) |
Tables Cumulative bar charts for % explained, stratified by time and group |
Moderate | Intepretation: “Analyses revealed significant increases in the prevalence of poor/fair health status, and persistent and growing pro-rich relative and absolute inequalities in health when the three Indigenous groups of Canada (First Nations, Métis, Inuit) were considered collectively.” |
Pichora et al. (2018) Comparing individual and area-based income measures: impact on analysis of inequality in smoking, obesity, and diabetes rates in Canadians 2003–2013 |
|
CCHS 2003, 2005, 2007/08, 2009/10, 2011/12, 2013 | Self-reported diagnosed diabetes prevalence Self-reported current (daily or occasional) smoking prevalence Self-reported Obesity (BMI > 30) Age-standardized (2011 census) |
Inequality stratifiers:
|
Prevalence rate ratio (RR) Prevalence rate difference (RD) Between Quintile 1 and Quintile 5, with 95% CI |
Estimates stratified by CCHS year | Descriptive estimation of prevalence, prevalence rate ratios and rate differences, stratified by year [analytic method not specified] Change over time: Difference estimation based on overlapping 95% CI. |
Tables Stratified trend lines of outcomes on y-axis, years on x-axis, with a line per group |
Low | Key take-home: “We documented higher rates of each health indicator within both the lower individual-level and lower area-level income quintiles, which persisted over time.” |
Reid et al. (2010) Socio-economic status and smoking in Canada, 1999-2006: has there been any progress on disparities in tobacco use? |
|
Canadian Tobacco Use Monitoring Survey (CTUMS) waves 1999 and 2006 adults 25 and older (n = 86,971) |
Smoking status: “current smokers” (smoked 100+ cigarettes, currently smokes daily or occasionally) vs. “non-smoker (incudes “former smokers” (smoked 100+ cigarettes, does not currently smoke) and and “never-smokers” (smoked <100 cigarettes, does not currently smoke)) |
Inequality stratifiers:
|
Odds ratio | Change between 1999 and 2006 (2 points) | Change over time: Logistic regression for OR estimation, adjusted for age, sex, region, education, stratified by year and with interaction of time (continuous) and education (table format of ORs by year, and reporting of Chi-squared statistic and p-value of interaction term. | Tables Stratified connected scatter plots of outcomes on y-axis, years on x-axis, with a line per group (no 95% CIs presented in the figures) |
Moderate | Key take home: “The decline in smoking among Canadians between 1999 and 2006 represents a major public health achievement. However, considerable smoking-related disparities exist between socio-economic groups, and have changed very little.” |
Vahid Shahidi et al. (2018) Widening health inequalities between the employed and the unemployed: A decomposition of trends in Canada (2000-2014). |
|
CCHS 2000, 2003, 2005, 2007, 2009, 2011, 2013 N=337,880 | Self rated health (excellent, very good, good vs. fair or poor) | Inequality stratifier:
|
Difference in proportions | Decomposition of change in predictor between 2000 and 2013 (two time points) | Descriptive analyses proportions, stratified by time (table, trend line graphs) Decomposition using Fairlie Oaxaca-Blinder Extension |
Tables Stratified trend lines of outcomes on y-axis, years on x-axis, with a line per group |
Low | Key take-home: “Our results indicate that relative and absolute inequalities in poor self-rated health increased between the two groups over the study period.” |
Zygmunt et al. (2020) Avoidable Mortality Rates Decrease but Inequity Gaps Widen for Marginalized Neighborhoods: A Population-Based Analysis in Ontario, Canada from 1993 to 2014 |
|
Ontario population cohort (ICES administrative data) linked with data from the Office of the Registrar General-Deaths database (1993-2014). Aged less than 75 years. |
Avoidable mortality—overall, preventable, and treatable (premature deaths occurring among those under 75 years of age with a preventable or treatable cause of death, as defined by CIHI) Standardized by age and sex. |
Inequality stratifier:
Quintile groups |
Rate ratio (RR) between Quintile 5 and Quintile 1 (95% CI) Absolute difference in rate ratios between 1993 and 2014 |
Change between 1993 and 2014 (2 time points) | Descriptive analyses of rates per marginalization quintile, per year (trend line graph) Descriptive rate-ratio estimation [analytic method not specified] Descriptive calculation of difference in rate-ratios |
Tables Stratified connected scatter plots of outcomes on y-axis, years on x-axis, with a line per group |
High | Key take-home: “Despite declining AM, the inequity gap between the most and least marginalized neighborhoods widened for all four marginalization dimensions over time, and these gaps were generally greater for treatable AM than preventable AM.” |
Van Ingen et al (2015) The Unequal City 2015: Income and Health Inequalities in Toronto - Technical Report Technical Report URL: Accessed: 2022-04-25 |
Since an initial baseline report in 2008,
|
Toronto Ontario’s Integrated Public Health Information System (iPHIS) public health surveillance data (which draws from Canadian Community Health Survey) | 34 health status indicators: CVD, Premature Mortality, Diabetes, Self-rated health, Life expectancy, Lung Cancer, Physical Inactivity, Premature Mortality, Smoking, Chlamydia, Gonorrhea, Low birth weight, Life expectancy, Obesity, Childhood Injury, Falls among older adults |
Inequality stratifier:
|
Outcome rate differences (RD) Outcome rate ratios (RR) Population attributable fraction (PAR) Slope index of inequality (SII) Relative index of inequality (RII) |
Change between 2005 and 2015 (2 time points) | RII/SII estimation via linear regression model [no information provided] Description of outcomes by income group, stratified by year. Descriptive analyses of RII, per year, stratified by sex Change over time estimated via graphical interpretation of confidence intervals (overlapping between years or not) |
Histogram plots of rates across income quartiles (with 95% CI), stratified by period Connected line plot of SII and RII (Y) by year (X) Combined scatter plot of RII (X) [one point for each time period]; health indicators on Y axis Graphs stratified by sex |
Moderate | Key take-home: “Overall, health inequities in Toronto have not improved over time. For the first years of data analyzed, low income groups had worse health for 21 of the 34 health status indicators analyzed. Over approximately ten years, health inequities persisted for 16 indicators, became worse for four indicators and improved for one indicator.” (p.4) |
Plante et al. (2020) Urban Public Health Network Urban Income-Related Health Inequalities in Canada: City-Level Results in Health System Use and Self-Reported Indicators Report URL: Accessed: 2022-04-25 |
|
Canadian Community Health Survey (2001-2015) Discharge Abstract Database (2006-2015) |
Changes through time explored for indicators:
Hospitalization for -alcohol-related harm
|
Inequality stratifier:
|
Rate ratio between quintile 1 and quintile 5 Rate difference between quintile 1 and quintile 5 |
Outcomes stratified by calendar year groups: Flu shots: 2001-2005, 2006-2010, 2011-2015 Falls: 2006-2010, 2011-2015 |
Statistical significance of change in rates assessed using two-sample t-tests (p.58) | Connected line plot of Outcome rates (Y) by year groups (X), stratified by income quintiles Tables |
Moderate | Key take-home: “Although overall rates may have improved over time for some indicators since the early 2000s, inequalities therein have either not improved or, in a handful of instances, increased. Overall, health inequalities are highly variable between cities.” (p.5) |
4. Discussion
To ensure the highest levels of relevance, excellence, and rigour of future enhanced Canadian analyses of changes in inequalities through time, the objective of this review was to summarize the aims and methods of both international reporting initiatives and Canadian scientific literature that explore this topic and identify promising practices for future reporting. We found that a majority of international initiatives that reported on health inequalities also reported on changes in health inequalities through time. Expanding Canada’s health inequality monitoring to include a temporal dimension, therefore, represents a key priority to align the HIR Initiative (HIRI) with the highest calibre reporting initiatives of the world, and to enhance Canadian leadership in health inequalities reporting.
We identified both promising practices as well as practices to avoid in future enhanced analyses. A principle gap in many of the international reports as well as in some of the Canadian scientific literature was an absence of sufficient detail regarding the methodological steps and analyses taken, to allow for analytic replication. This finding is aligned with limitations identified by Frank et al.Footnote 3 in their environmental scan of international health inequality reporting initiatives. Detailed methodological and technical reporting is an essential component of rigorous epidemiologic analysisFootnote 39, and represents a useful resource for other jurisdictions to draw from, for their regional, provincial, or national analyses. Other observed gaps in the scientific studies reviewed were missing information on survey participation and response rates, description of power based on available sample size. Most of the studies were cross-sectional and therefore could not confirm that the outcome occurred after the exposure. Almost none of the studies explored how the exposures (e.g. income) may have changed throughout participants’ life course. Nor did most of the studies adjust for potential confounding variables beyond age or sex.
Among the promising practices identified were the inclusion of clear statements of purpose and analytic objectives, the use of both absolute and relative inequality metrics, the application of rigorous statistical methods to both assess the magnitude of inequalities, their determinants, and their potential changes over time, and lastly, the use of data visualization tools to convey findings. In the studies reviewed, timeframes used (> 5 years) were likely sufficient to reasonably expect a change in the association between exposures and the outcome of interest.
4.1 Promising practices and recommendations for HIRI
a) Purpose
The overall objectives and stated purpose of the reviewed international reporting initiatives varied. However, several themes emerged. The stated purpose of these initiatives tended to focus on a range of priorities across a transformative action cycle: from improved epidemiologic understanding to priority setting, monitoring of progress, supporting and guiding policy action, and enabling the evaluation of the impact of interventions. The scientific literature that we reviewed tended to focus more specifically on the first of the latter components; that is, the improvement of our epidemiologic understanding of the scope and magnitude of inequalities as well as their etiology. However, unlike academic or scientific researchers, governmental bodies such as public health institutions tend to have a much broader mandate beyond surveillance, including both the capacity and explicit mandate to enact health programs and policies. It, therefore, makes sense that health inequality surveillance initiatives would be designed to help guide, or evaluate the effectiveness of these policies and programs, to reduce health inequalities.
Recommendations:
- 1. Specify the overall purpose of the enhanced temporal analyses before designing and performing analyses.
- 2. The scope of the specified purpose should focus on a transformative action cycle: from improved epidemiologic and etiologic understanding, to priority setting, to the monitoring of progress, to supporting and guiding policy action, and evaluating the impact of interventions. For example:
- To better understand drivers of health inequalities across populations and areas
- To explore how inequalities build up from childhood to adulthood
- To help set priority health indicators
- To monitor progress in tackling health inequalities
- To guide and support public health action
- To better understand the impact of interventions on health inequalities and health and well-being
b) Objectives
The analytic objectives of both initiatives and scientific studies were aligned. Two broad themes emerged from the aims and objectives of reviewed works: initiatives and works aimed to either describe inequality patterns over time and/or to understand the causes or drivers of these inequalities across time.
First, initiatives and Canadian works aimed to either describe inequality patterns over time. These included objectives such as 1) “to describe health outcomes, across time points, for each social strata, respectively,” 2) “to describe health inequalities, at each time point, respectively” and 3) “assess for a statistically significant change in the magnitude or direction of the absolute or relative inequalities between time points”. The first of the latter two objectives are necessary descriptive building blocks before exploring the third of these objectives.
Second, several initiatives and works had objectives to better understand the determinants of these inequalities across time. These included objectives such as (4) “to determine the relative contribution of various determinants on observed inequalities, two or more time points, respectively”, 5) “to determine the relative contribution of various determinants on observed changes in inequalities between two or more time points”, and (6) an intersectionality-focused aim of assessing “whether inequalities varied across population sub-groups”. Of note, including the two latter types of questions represents a bridging between goals of monitoring changes in health inequalities through time, and of identifying potential areas for policy intervention.
Recommendations
- 3. Align objectives with the overall purpose of the initiative.
- 4. Explore both descriptive and analytic objectives: aim to both describe overall outcome rates and inequalities in outcome rates over time, and to understand the determinants of these inequalities across time. For example, objectives to consider in future monitoring of health inequalities through time could include:
- to describe indicators/outcomes stratified by groups and time
- to describe and test the statistical significance of relative and absolute inequalities between groups, stratified by time;
- to describe and test the statistical significance of changes in inequalities through time.
- To assess determinants of the inequalities between groups, and changes therein, over time (i.e. assess whether there has been a change in the association between social stratification measures and health or behavioural outcomes across time points, and what factors may explain these changes).
c) Outcomes
Health outcomes monitored tended to vary across international jurisdictions, the most common being life expectancy, certain cause-specific mortality rates (cancer, cardiovascular disease), and survey-based self-reported conditions. Previous studies have provided critiques of grouped outcomes such as cancer-related mortality, as the etiology and treatment strategies of cancer incidence across cancer sites can vary significantlyFootnote 3. Few if any described why certain outcome indicators were selected over others. To note, previous scans have described Canada’s HIR Initiative report’s process to identify and select priority indicators as “exemplary” and “unique among all the countries with SIH [social inequalities in health] reports, a model for other countries”Footnote 3.
Compared to international monitoring initiatives, the scope of outcomes measured in the Canadian studies was much more limited. A majority of scientific studies focused on one to three outcomes. Common between international monitoring initiatives and the studies reviewed were outcomes of life expectancy and premature mortality, perinatal outcomes such as low birth weight, self-rated health, health behaviours such as smoking, and physical health conditions such as diabetes and obesity. Unlike international monitoring initiatives, none of the Canadian studies explored outcomes pertaining to living conditions such as receipt of social support or housing quality, despite the fact that these represent intermediary factors with the WHO’s Social Determinants of Health FrameworkFootnote 5Footnote 40.
Recommendations
- 5. Identify and describe a process for health outcome selection.
- 6. Avoid grouping outcomes that may be shaped by heterogeneous etiological factors, or treatment or intervention strategies.
- 7. Include intermediary social and environmental conditions.
d) Social stratification (exposure) measures
In both international initiatives and scholarly works, beyond demographic measures of sex/gender or age, the most commonly used socioeconomic stratification variables included local area-level deprivation (based on income and employment levels, etc.) and individual-level educational attainment and income. This finding is aligned with those of past reviews of international reporting initiativesFootnote 3.
Area-level measures such as neighbourhood deprivation indexes are particularly useful when individual-level measures of socioeconomic status are not availableFootnote 14. They measure experiences of deprivation at the local area-level, which can be used as a proxy for exposure to stressors and limited access to health promoting resourcesFootnote 41Footnote 42. As such, they capture distinct social constructs from individual-based measuresFootnote 33. They also can be updated on a regular basisFootnote 14. For reporting initiatives that seek to identify outcomes for which largest inequalities exist or persist, use of a consistent measure, such as area-level deprivation, for all indicator assessments can help achieve this aim. However, they have been criticized for their vulnerability to ecological fallaciesFootnote 3. Further, since community- or neighbourhood- characteristics can change over timeFootnote 43Footnote 44Footnote 45Footnote 46, it may be that certain neighbourhoods fall in one quintile group (for example) at one time point, and in another group at a later time point. As such, reporting on changes in health outcomes over time across area-level socioeconomic measures such as income or deprivation quintiles, must clarify for readers that these analyses provide information on the magnitude of inequalities across neighbourhood characteristics, rather than tracking differences between specific communities or neighbourhoods.
At the individual level, measures such as education or income tend to be unavailable in data sources outside of health surveys (e.g. birth and death registries, etc.), thus limiting their systematic use in monitoring initiatives that draw from a wide array of data sourcesFootnote 3. Further, measures of educational attainment have been criticized for their limited use when studying outcomes across long periods of time (e.g. decades), as occupational needs, educational policy and investment, and mandatory schooling legislation have changed significantly since the start of the twentieth century, shaping secular trends in educational outcomes across birth cohortsFootnote 3. Further, in the Canadian context, educational success does not always equate with economic success, especially among racialized populationsFootnote 47.The poverty rate among racialized populations and immigrants has been increasing while it has decreased or stayed stable among Canadian-born populations—a phenomenon that has been described as the “racialization of poverty”Footnote 47. However, at an operational scale, these issues can be overcome by studying shorter time frames, effect modification across other social measures such as race/ethnicity or immigrant status and/or generation, and assessing for potential age-period-cohort trends in exposure distributions. Regarding the latter point, few of the reviewed international reporting initiatives and scientific studies explored changes in exposure distributions. These types of analyses are useful to tease out whether changes in the magnitude of outcome inequalities through time are due to changes in the distribution exposures (e.g. poverty becoming more prevalent) or the effect of the exposure on the outcome (e.g. experiences of poverty more strongly determine smoking risk over time).
Recommendations
- 8. Determine and justify the choice of stratification measures based on existing literature and guiding theories and conceptual frameworks.
- 9. The use of measures such as income, education, or area-level deprivation is aligned with existing international monitoring initiatives and would allow cross-national comparisons. However, when used, their limitations must be acknowledged.
- 10. The use of additional sociodemographic measures such as race/ethnicity, immigrant status, is necessary to take into account the racialization of poverty. The use of a cluster of exposure measures can be applied to capture heterogeneity across sub-groups, and potential vulnerability to systems of power and oppression.
e) Health inequality metrics
Several but not all of the reviewed works met the scientific guidelines’Footnote 39 recommendation of assessing both absolute and relative inequalities. As Frank and Matsunaga noted in their reviewFootnote 3, the most common metrics studied across international reporting initiatives were rate difference (RD) and ratio (RR) metrics as well as Slope Index of Inequality (SII) and Relative Index of Inequality (RII) metrics. A similar pattern was observed in the scientific works.
Although SII and RII measures have the advantage of accounting both for the magnitude of inequality as well as the size and relative distribution of population sub-groups across exposure categories or measures (e.g. across the entire distribution of income), they have two major limitations. First, SII and RII metrics require modelling that regress the outcome on the ordered and weighted rank (e.g. ridit scores) of observations, based on their standing along a continuous or ordinal social measure (most often years of educational attainment, income quantile groupings, or area-level deprivation quantile groupings). SII and RII estimates cannot be estimated for individual-level categorical stratification measures such as race/ethnicity, Indigeneity, employment or marital status, etc. For these reasons, rate difference and ratio measures, therefore, hold a clear advantage when seeking to explore inequalities across a range of stratification measures, regardless of measure type. However, the latter categorical measures can be operationalized at an area-level to create continuous measures of population density e.g. area-level population proportions of residents who are Indigenous), in which case SII and RII metrics could be computed. Lastly, as others have noted, SII and RII metrics rely on an assumption of linearity between the exposure and outcome, which may not always hold, and is often not testedFootnote 3Footnote 48. One of the reviewed studies applied a hazard modelling approach (Cox proportional and additive hazard modelling) to avoid this assumption and overcome this limitationFootnote 36.
Recommendations
- 11. Estimate inequalities on an additive (absolute) and relative scale, using rate difference and ratio metrics
- 12. If estimating concentration curves or coefficients (GINI), slope or relative indexes of inequalities measures (SII, RII) describe how these estimates should be interpreted.
- 13. When estimating SII or RII metrics using linear regression modelling, perform sensitivity analyses to test the validity of linearity assumptions. Alternatively, a hazard modelling approach can be applied to avoid making these assumptions.
f) Operationalization of time
A majority of the international reports and Canadian studies examined changes in health inequalities over 5 or more years, which enabled sufficient time to elapse to feasibly see changes in the outcomes at a population level. Some works assessed the magnitude in the change in inequalities between the earliest and latest time points, others tested a time trend across data points. When testing the statistical significance of a temporal trend, the use of multiple time points (e.g., ≥ 4-5) is recommendedFootnote 49.
The operationalization of time measurement was largely determined by data availability. Pooling data across time periods or constructing rolling (or moving) averages enabled analyses when sample sizes were small. The latter was done in international reporting initiatives that presented simple descriptive statistics of inequalities across overlapping time periods (moving averages). If more complex analyses were planned, analyses would need to be adapted to this form of data, to account for autoregressive errorsFootnote 50.
Lastly, works reviewed operationalized time based on calendar years as well as birth cohorts, highlighting the need to consider secular and policy changes across time and an individual’s lifecourse.
Recommendations
- 14. Group years as needed for statistical power (e.g. 2- or 5- year averages) and consider the use of rolling or moving averages if data are severely limited. When using moving averages, analyses should be adapted to this form of data.
- 15. Use sufficient timeframes to be able to feasibly observe a change in inequalities (e.g. 5 years or more)
- 16. Consider integrating other time dimensions than calendar years (e.g. age or birth cohorts, captured by year of birth).
- 17. Differences in inequalities between two time points can be assessed. If seeking to test the significance of a temporal trend, the use of multiple time points (e.g., ≥ 5) is recommended.
g) Temporal analyses
Many of the reviewed initiatives and Canadian studies did not provide methodological details on how inequalities as well as differences in inequalities across periods were tested, or simply did not test the statistical significance of potential changes. These are important gaps for any future initiatives to avoid when reporting on health inequalities through time. Ranging from least to the most complex, methods employed to compare inequalities between time periods included descriptive test statistics (t-tests, z-tests), comparison of variance estimate bounds (95% CIs) between estimates at different time points, as well as regression-based analyses that include interaction terms between exposure measures and time (e.g. measured as calendar years or periods).
Statistical analyses can be adapted to specific analytic objectives. In addition to descriptive aims, several studies aimed to better understand determinants of observed inequalities and changes therein. These types of objectives require a distinct set of analyses, and indeed, both international reporting initiatives and Canadian studies conducted decomposition analyses (e.g. Oaxaca-Blinder decomposition) to meet these types of objectives. Used initially in the field of Economics, this frequency of the use type of analysis in epidemiologic studies, particularly in the field of social epidemiology, is growingFootnote 51. Decomposition analyses have also been identified for their utility in integrating social and public theories, including those pertaining to fundamental determinants of healthFootnote 52 and intersectionalityFootnote 51. Including a decomposition analysis of health inequalities would also represent a bridging element between goals of monitoring changes in health inequalities through time, and of identifying potential areas for policy intervention.
Recommendations
- 18. Provide a systematic description of rates and inequalities, by group and time periods, respectively.
- 19. Test statistical differences in the distribution of exposures, the outcomes between groups, and changes in inequalities between time periods, respectively, using descriptive or regression-based analyses (using interaction terms between exposures and periods).
- 20. Perform decomposition analyses to explore drivers of changes in inequalities.
- 21. Provide sufficient methodological information so that all analytic steps may be replicated.
h) Data visualization
All of the studies reported their findings in table format. The next most common types of data visualization tools used were connected scatter plots and trend lines, with rates and inequalities in rates presented by year or period (Figure 10). In the three studies that applied decomposition analyses to estimate the proportion of inequalities explained by various social determinants of health, cumulative bar charts were used to depict the proportions of inequalities explained. Lastly, bar charts were used in one of the studiesFootnote 34, as was Blakely’s three-way compass to describe the direction of absolute and relative inequalities through timeFootnote 36.
Blakely’s compass is the only data visualization technique that describes change in the overall underlying rates, as well as in relative and absolute inequalities. However, its featuring of dual scales (for RII and SII, respectively) can make it difficult to interpretFootnote 53. For this reason, data visualization experts have recommended against the use of dual scale graphs Footnote 54. Instead, side-by-side charts can be used.
Examples of the data visualization techniques used are described in the Supplemental Material Section 7.2b. A majority of graphic representations of trend lines or connected scatter plots of outcomes over time did not include 95% confidence intervals.
Most reviewed reports and studies provided data in table format. Although tables provide complete information, they do not always allow for a rapid visual assessment of differences in the magnitude of inequalities. Trend lines, connected scatter plots, stratified bar charts and choropleth maps all represent valuable data visualization tools to depict changes in rates across groups, over time, as well as changes in the magnitude of inequalities. These formats have been identified as more useful for policymakers and in the general publicFootnote 3. However, unlike maps, the other three figure types are more compatible with a visualization of variance (e.g. 95% confidence intervals)—an aspect that was missing from a majority of the figures reviewed.
Lastly, beyond presenting findings using visual aids, authors of the reviewed studies provided written interpretations of whether and how inequalities changed over time. This element enables the identification of key “take-home messages” for public health decision-makers.
Recommendations
- 22. Leverage both tables and data visualization tools such as connected scatter plots or stratified bar charts to describe changes in the outcomes across groups, and in the magnitude of inequalities, over time.
- 23. Include metrics of variance (95% CI) within tables and figures. If they cannot be depicted in figures (e.g. choropleth maps), provide them in a supplemental table.
- 24. Ensure that data visualizations are accompanied by clear written interpretations of the findings on how inequalities changed over time.
4.2 Limitations
The findings of this review should be interpreted within the context of certain limitations. Primarily, the search strategy was non-exhaustive and therefore likely missed other examples of international reports or Canadian studies that explored changes in health inequalities over time. Further, the reviewed materials focus primarily on the measurement of health inequalities through time, between population sub-groups. They are informed by epidemiological theory and methods. However, several other scientific initiatives in Canada, such as the One Society NetworkFootnote 55, launched during the COVID-19 pandemic, draw from other substantive areas, including those of economics and social sciences to explore changes in outcomes such as air quality, food supply chains, or gross domestic product. These topics were beyond the scope of the present review, but may merit consideration in future assessments. Additionally, it was beyond the scope of this review to appraise how future reporting in Canada should interpret concurrent changes in underlying population rates, as well as relative and absolute inequalities. Additional engagement and discussion is needed to pursue that objective in future analyses.
5. Conclusion
Canada is currently missing a national monitoring strategy of changes in health inequalities over time. This topic of analysis has been identified as a priority for the Pan-Canadian Health Inequities Reporting (HIR) Initiative and for Canadian health inequality surveillance. This review provides an up-to-date portrait of the promising practices implemented by international initiatives and Canadian scientific literature, to assess changes in health inequalities over time. It provides recommendations on promising practices to implement, from the stage of setting aims and objectives to data visualization. This review provides a road map to align the HIR Initiative with the highest calibre reporting initiatives of the world, and to promote Canada’s public health leadership and excellence on the global stage.
6. References
- Footnote 1
-
World Health Organization (WHO), “Rio political declaration on social determinants of health,” 2011. https://www.who.int/publications/m/item/rio-political-declaration-on-social-determinants-of-health (accessed Apr. 26, 2022).
- Footnote 2
-
Public Health Agency of Canada, “Social determinants of health and health inequalities,” Government of Canada, 2020. https://www.canada.ca/en/public-health/services/health-promotion/population-health/what-determines-health.html (accessed Apr. 26, 2022).
- Footnote 3
-
J. W. Frank and E. Matsunaga, “National monitoring systems for health inequalities by socioeconomic status–an OECD snapshot,” Crit. Public Health, 2020, doi: 10.1080/09581596.2020.1862761.
- Footnote 4
-
Public Health Agency of Canada, “Health Inequalities Data Tool,” Government of Canada, 2021. https://health-infobase.canada.ca/health-inequalities/ (accessed Apr. 26, 2022).
- Footnote 5
-
Public Health Agency of Canada, “Key health inequalities in Canada: A national portrait,” Government of Canada, 2018. https://www.canada.ca/en/public-health/services/publications/science-research-data/understanding-report-key-health-inequalities-canada.html (accessed Apr. 26, 2022).
- Footnote 6
-
Public Health Agency of Canada, “Health Inequalities Data Tool: Publications,” Government of Canada, 2021. https://health-infobase.canada.ca/health-inequalities/Publications (accessed Apr. 26, 2022).
- Footnote 7
-
National Collaborating Centre for Methods and Tools (NCCMT), “Rapid Review Guidebook,” 2017. https://www.nccmt.ca/tools/rapid-review-guidebook (accessed Apr. 25, 2022).
- Footnote 8
-
R. Carr-Hill and P. Chalmers-Dixon, “The Public Health Observatory Handbook of Health Inequalities Measurement,” South East England Public Health Observatory, 2005. http://snspms.ro/UserFiles/File/doc/the_public_health_observatory_handbook.pdf (accessed Apr. 26, 2022).
- Footnote 9
-
M. Ouzzani, H. Hammady, Z. Fedorowicz, and A. Elmagarmid, “Rayyan — a web and mobile app for systematic reviews,” Syst. Rev., vol. 5, no. 210, 2016, doi: 10.1186/s13643-016-0384-4.
- Footnote 10
-
National Heart Lung and Blood Institute (NIH), “Study Quality Assessment Tools,” 2021. https://www.nhlbi.nih.gov/health-topics/study-quality-assessment-tools (accessed Apr. 26, 2022).
- Footnote 11
-
Ministry of Health of New Zealand, “New Zealand Health Survey: Annual Data Explorer,” Ministry of Health of New Zealand. https://minhealthnz.shinyapps.io/nz-health-survey-2020-21-annual-data-explorer/_w_a2898d01/#!/ (accessed Apr. 26, 2022).
- Footnote 12
-
World Health Organization Europe, “Healthy, prosperous lives for all: the European Health Equity Status Report ,” World Health Organization Europe, 2019. https://www.euro.who.int/en/health-topics/health-determinants/social-determinants/health-equity-status-report-initiative (accessed Nov. 24, 2021).
- Footnote 13
-
OECD, “Preventing Ageing Unequally,” OECD, 2017. https://www.oecd.org/health/preventing-ageing-unequally-9789264279087-en.htm (accessed Nov. 24, 2021).
- Footnote 14
-
Scottish Government, “Long-term monitoring of health inequalities: December 2018 report,” Scottish Government, 2018. https://www.gov.scot/publications/long-term-monitoring-health-inequalities-december-2018-report/ (accessed Nov. 24, 2021).
- Footnote 15
-
Norwegian Institute of Public Health, “Social inequalities in health,” Norwegian Institute of Public Health, 2018. https://www.fhi.no/en/op/hin/groups/social-inequalities/ (accessed Nov. 24, 2021).
- Footnote 16
-
Department of Health Northern Ireland, “Health Inequalities Annual Report ,” Department of Health Northern Ireland, 2020. https://www.health-ni.gov.uk/publications/health-inequalities-annual-report-2020 (accessed Nov. 24, 2021).
- Footnote 17
-
Australian Institute of Health and Welfare, “Indicators of socioeconomic inequalities in cardiovascular disease, diabetes and chronic kidney disease,” Australian Institute of Health and Welfare, 2019. https://www.aihw.gov.au/reports/social-determinants/indicators-socioeconomic-inequalities/summary (accessed Nov. 24, 2021).
- Footnote 18
-
Public Health Wales, “Public Health Wales Observatory data reporting,” Public Health Wales, 2017. https://public.tableau.com/app/profile/publichealthwalesobservatory/vizhome#!/ (accessed Nov. 24, 2021).
- Footnote 19
-
Public Health England, “Public Health Outcomes Framework (PHOF) Data Tool,” Public Health England, 2021. https://fingertips.phe.org.uk/profile/public-health-outcomes-framework (accessed Nov. 24, 2021).
- Footnote 20
-
Healthy Belgium, “Sciensano (National Public Research Institute) report,” For a Healthy Belgium, 2021. https://www.healthybelgium.be/en/health-status/health-inequalities (accessed Nov. 24, 2021).
- Footnote 21
-
T. Lampert, L. E. Kroll, B. Kuntz, and J. Hoebel, “Health inequalities in Germany and in international comparison: trends and developments over time,” J. Heal. Monit., vol. 3, no. S1, 2018, doi: https://doi.org/10.17886/RKI-GBE-2018-036.
- Footnote 22
-
National Institute of Public Health Slovenia, “Inequalities in Health: Future Challenges for Intersectoral Cooperation,” National Institute of Public Health Slovenia, 2021. https://www.nijz.si/en/publikacije/inequalities-in-health-future-challenges-intersectoral-cooperation (accessed Nov. 24, 2021).
- Footnote 23
-
Centers for Disease Control and Prevention, “Health Disparities and Inequalities Report ,” Centers for Disease Control and Prevention, 2013. https://www.cdc.gov/mmwr/pdf/other/su6203.pdf (accessed Nov. 24, 2021).
- Footnote 24
-
Public Health Sweden, “Public Health Authority Website ,” Public Health Sweden, 2021. https://www.folkhalsomyndigheten.se/folkhalsorapportering-statistik/tolkad-rapportering/folkhalsans-utveckling/resultat/ (accessed Nov. 24, 2021).
- Footnote 25
-
F. V. Shahidi, C. Muntaner, K. Shankardass, C. Quiñonez, and A. Siddiqi, “Widening health inequalities between the employed and the unemployed: A decomposition of trends in Canada (2000-2014),” PLoS One, vol. 13, no. 11, 2018, doi: 10.1371/journal.pone.0208444.
- Footnote 26
-
M. Hajizadeh, M. Karen Campbell, and S. Sarma, “Socioeconomic inequalities in adult obesity risk in Canada: Trends and decomposition analyses,” Eur. J. Heal. Econ., vol. 15, no. 2, 2014, doi: 10.1007/s10198-013-0469-0.
- Footnote 27
-
Canadian Institute for Health Information (CIHI), “Trends in Income-Related Health Inequalities in Canada,” CIHI, 2015. https://www.cihi.ca/en/trends-in-income-related-health-inequalities-in-canada (accessed Nov. 24, 2021).
- Footnote 28
-
M. Hajizadeh, M. Hu, A. Bombay, and Y. Asada, “Socioeconomic inequalities in health among Indigenous peoples living off-reserve in Canada: Trends and determinants,” Health Policy (New. York)., vol. 122, no. 8, 2018, doi: 10.1016/j.healthpol.2018.06.011.
- Footnote 29
-
M. Hajizadeh, A. Mitnitski, and K. Rockwood, “Socioeconomic gradient in health in Canada: Is the gap widening or narrowing?,” Health Policy (New. York)., vol. 120, no. 9, 2016, doi: 10.1016/j.healthpol.2016.07.019.
- Footnote 30
-
K. Brown, A. Nevitte, B. Szeto, and A. Nandi, “Growing social inequality in the prevalence of type 2 diabetes in Canada, 2004–2012,” Can. J. Public Heal., vol. 106, no. 3, 2015, doi: 10.17269/CJPH.106.4769.
- Footnote 31
-
J. L. Reid, D. Hammond, and P. Driezen, “Socio-economic status and smoking in Canada, 1999-2006: Has there been any progress on disparities in Tobacco use?,” Can. J. Public Heal., vol. 101, no. 1, 2010, doi: 10.1007/bf03405567.
- Footnote 32
-
T. Bushnik, M. Tjepkema, and L. Martel, “Socioeconomic disparities in life and health expectancy among the household population in Canada,” Heal. Reports, vol. 31, no. 1, 2020, doi: 10.25318/82-003-x202000100001-eng.
- Footnote 33
-
E. Pichora, J. Y. Polsky, C. Catley, N. Perumal, J. Jin, and S. Allin, “Comparing individual and area-based income measures: impact on analysis of inequality in smoking, obesity, and diabetes rates in Canadians 2003–2013,” Can. J. Public Heal., vol. 109, no. 3, 2018, doi: 10.17269/s41997-018-0062-5.
- Footnote 34
-
T. van Ingen, E. Khandor, and P. Fleiszer, “The Unequal City 2015: Income and Health Inequities in Toronto,” Toronto Public Health, 2015. https://www.toronto.ca/legdocs/mmis/2015/hl/bgrd/backgroundfile-79096.pdf (accessed Apr. 26, 2022).
- Footnote 35
-
C. Plante, S. Missiuna, and C. Neudorf, “Urban Income-Related Health Inequalities in Canada,” Urban Public Health Network, 2020. http://uphn.ca/wp-content/uploads/2021/02/MTHIC-Report-English-Report.pdf (accessed Apr. 26, 2022).
- Footnote 36
-
E. Buajitti, J. Frank, T. Watson, K. Kornas, and L. C. Rosella, “Changing relative and absolute socioeconomic health inequalities in Ontario, Canada: A population-based cohort study of adult premature mortality, 1992 to 2017,” PLoS One, vol. 15, no. 4, 2020, doi: 10.1371/journal.pone.0230684.
- Footnote 37
-
C. Fang, M. Aldossri, J. Farmer, N. Gomaa, C. Quiñonez, and V. Ravaghi, “Changes in income-related inequalities in oral health status in Ontario, Canada,” Community Dent. Oral Epidemiol., vol. 49, no. 2, 2021, doi: 10.1111/cdoe.12582.
- Footnote 38
-
A. Zygmunt, C. E. Kendall, P. James, I. Lima, M. Tuna, and P. Tanuseputro, “Avoidable Mortality Rates Decrease but Inequity Gaps Widen for Marginalized Neighborhoods: A Population-Based Analysis in Ontario, Canada from 1993 to 2014,” J. Community Health, vol. 45, no. 3, 2020, doi: 10.1007/s10900-019-00778-8.
- Footnote 39
-
E. von Elm, D. G. Altman, M. Egger, S. J. Pocock, P. C. Gøtzsche, and J. P. Vandenbroucke, “The strengthening the reporting of observational studies in epidemiology (STROBE) statement: Guidelines for reporting observational studies,” Int. J. Surg., vol. 12, no. 12, 2014, doi: 10.1016/j.ijsu.2014.07.013.
- Footnote 40
-
O. Solar and A. Irwin, “Social Determinants of Health Discussion Paper 2 (Policy and Practice) A conceptual framework for action on the social determinants of health,” World Health Organization Discussion Paper Series on Social Determinants of Health, 2 , 2010. https://apps.who.int/iris/handle/10665/44489 (accessed Apr. 26, 2022).
- Footnote 41
-
S. E. Coen and N. A. Ross, “Exploring the material basis for health: Characteristics of parks in Montreal neighborhoods with contrasting health outcomes,” Heal. Place, vol. 12, no. 4, 2006, doi: 10.1016/j.healthplace.2005.02.001.
- Footnote 42
-
S. Macintyre, “Deprivation amplification revisited; or, is it always true that poorer places have poorer access to resources for healthy diets and physical activity?,” Int. J. Behav. Nutr. Phys. Act., vol. 4, 2007, doi: 10.1186/1479-5868-4-32.
- Footnote 43
-
I. Townshend, B. Miller, and L. Evans, “Socio-Spatial Polarization in an Age of Income Inequality: An Exploration of Neighbourhood Change in Calgary’s ‘Three Cities,’” Neighbourhood Change Research Partnership Research Paper 241, 2018. http://neighbourhoodchange.ca/documents/2018/04/socio-spatial-polarization-in-calgary.pdf (accessed Jan. 20, 2022).
- Footnote 44
-
V. F. Burns, J. P. Lavoie, and D. Rose, “Revisiting the role of neighbourhood change in social exclusion and inclusion of older people,” J. Aging Res., vol. 2012, 2012, doi: 10.1155/2012/148287.
- Footnote 45
-
J. L. Grant and W. Gregory, “Who lives downtown? Neighbourhood change in central Halifax, 1951–2011,” Int. Plan. Stud., vol. 21, no. 2, 2016, doi: 10.1080/13563475.2015.1115340.
- Footnote 46
-
A. Blair, G. Gariépy, and N. Schmitz, “The longitudinal effects of neighbourhood social and material deprivation change on psychological distress in urban, community-dwelling Canadian adults,” Public Health, vol. 129, no. 7, 2015, doi: 10.1016/j.puhe.2015.05.011.
- Footnote 47
-
National Council of Welfare, “Poverty Profile: Special Edition,” 2012. Accessed: Nov. 25, 2021. [Online]. Available: https://www.canada.ca/content/dam/esdc-edsc/migration/documents/eng/communities/reports/poverty_profile/snapshot.pdf.
- Footnote 48
-
J. Frank and S. Haw, “Best practice guidelines for monitoring socioeconomic Inequalities in health status: Lessons from scotland,” Milbank Q., vol. 89, no. 4, 2011, doi: 10.1111/j.1468-0009.2011.00646.x.
- Footnote 49
-
D. W. Meals, J. Spooner, S. A. Dressing, and J. B. Harcum, “Statistical Analysis for Monotonic Trends,” 2011. https://www.epa.gov/sites/default/files/2016-05/documents/tech_notes_6_dec2013_trend.pdf (accessed Jan. 30, 2022).
- Footnote 50
-
K. J. Rothman, S. Greenland, and T. L. L. Associate, “Modern Epidemiology, 3rd Edition,” Hastings Cent. Rep., vol. 44 Suppl 2, 2014.
- Footnote 51
-
J. W. Jackson, D. R. Williams, and T. J. VanderWeele, “Disparities at the intersection of marginalized groups,” Social Psychiatry and Psychiatric Epidemiology, vol. 51, no. 10. 2016, doi: 10.1007/s00127-016-1276-6.
- Footnote 52
-
B. G. Link and J. Phelan, “Social conditions as fundamental causes of disease.,” Journal of health and social behavior, vol. Spec No. 1995, doi: 10.2307/2626958.
- Footnote 53
-
P. Isenberg, A. Bezerianos, P. Dragicevic, and J.-D. Fekete, “A Study on Dual-Scale Data Charts,” 2011. https://www.lri.fr/~isenberg/publications/papers/Isenberg_2011_ASO.pdf (accessed Nov. 24, 2021).
- Footnote 54
-
T. Rahlf, “Data Visualisation with R,” Springer, 2019. https://link.springer.com/book/10.1007/978-3-030-28444-2 (accessed Nov. 24, 2021).
- Footnote 55
-
One Society Network, “One Society Network: Background,” 2021. https://onesocietynetwork.ca/background/ (accessed Jan. 19, 2022).
7. Supplemental material
7.1 Detailed methods
a) International scan: country identification strategy
| Frank & Matsunaga (2021) Evaluation of 36 OECD countries* | |||||||
|---|---|---|---|---|---|---|---|
| No. | Country | [1] Availability of definition of 'health inequalities' and/or 'health inequities' on official website | [2] Retrievable report on social inequalities in health on official website | [3] Health inequalities measurement system in place | Included in rapid review based on Frank & Matsunaga (2021) review (Yes if [2] = yes, No if [2] = Unclear/No) |
Included in additional hand-search (based on authors' a priori awareness of reporting across countries) | Scanned item # |
| 1 | Australia | Yes | No | No | No | Yes | 1 |
| 2 | Austria | Yes | No | No | No | N/A | N/A |
| 3 | Canada | Yes | Yes | Yes | N/A | N/A | N/A |
| 4 | Belgium | Yes | Yes | Yes | Yes | N/A | 2 |
| 5 | Czech Republic | Yes | No | No | No | N/A | N/A |
| 6 | Chile | No | No | No | No | N/A | N/A |
| 7 | Estonia | No | No | No | No | N/A | N/A |
| 8 | Denmark | No | No | No | No | N/A | N/A |
| 9 | Finland | Yes | Unclear | Unclear | No | N/A | N/A |
| 10 | France | Yes | Unclear | No | No | N/A | N/A |
| 11 | Germany | Yes | Yes | No | Yes | N/A | 3 |
| 12 | Greece | No | No | No | No | N/A | N/A |
| 13 | Hungary | No | No | No | No | N/A | N/A |
| 14 | Iceland | No | No | No | No | N/A | N/A |
| 15 | Ireland | Yes | Yes | No | Yes | N/A | 4 |
| 16 | Israel | Yes | Yes | No | Yes | N/A | 5 |
| 17 | Italy | Unclear | No | No | No | Yes | 6 |
| 18 | Japan | Yes | No | No | No | Yes | 7 |
| 19 | Korea | Unclear | Unclear | Unclear | No | N/A | N/A |
| 20 | Latvia | No | No | No | No | N/A | N/A |
| 21 | Lithuania | Yes | Unclear | No | No | N/A | N/A |
| 22 | Luxembourg | No | No | No | No | N/A | N/A |
| 23 | Mexico | Yes | Yes | Unclear | Yes | N/A | 8 |
| 24 | Netherlands | Yes | No | Unclear | No | N/A | N/A |
| 25 | New Zealand | Yes | No | No | No | Yes | 9 |
| 26 | Norway | Yes | Yes | Yes | Yes | N/A | 10 |
| 27 | Poland | No | No | No | No | N/A | N/A |
| 28 | Portugal | Yes | No | No | No | N/A | N/A |
| 29 | Slovakia | No | No | No | No | N/A | N/A |
| 30 | Slovenia | Yes | Yes | No | Yes | N/A | 11 |
| 31 | Spain | No | No | No | No | N/A | N/A |
| 32 | Sweden | Yes | No | No | No | Yes | 12 |
| 33 | Switzerland | Yes | No | No | No | N/A | N/A |
| 34 | Turkey | No | No | No | No | N/A | N/A |
| 35 | United Kingdom | ||||||
| England | Yes | Yes | Yes | Yes | N/A | 13 | |
| Norther Ireland | Yes | Yes | Yes | Yes | N/A | 14 | |
| Scotland | Yes | Yes | Yes | Yes | N/A | 15 | |
| Wales | Yes | Yes | Yes | Yes | N/A | 16 | |
| 36 | United States | Yes | Unclear | Unclear | Yes | N/A | 17 |
| WHO (Added) | N/A | N/A | N/A | N/A | Yes | 18, 19 | |
| OECD (Added) | N/A | N/A | N/A | N/A | Yes | 20 | |
* Provided in the article's Supplementary File's Table 1, available online at Taylor and Francis Online Note: N/A in columns 3 to 8 of Table 4 indicate that there is no applicable data items to note in these cells. No data are presented for the United Kingdom (UK) row, as the data are instead presented for each devolved UK jurisdiction instead (i.e., for England, Northern Ireland, Scotland, Wales, respectively) in the subsequent rows. |
|||||||
b) Rapid literature review: detailed search strategy
| Search Engine | Search Strings | Results |
|---|---|---|
| PubMed | ((((health[Title/Abstract]) AND (inequality[Title/Abstract] OR inequalities[Title/Abstract] OR disparity[Title/Abstract] OR disparities[Title/Abstract] OR inequity[Title/Abstract] OR equity[Title/Abstract] OR gap[Title/Abstract])) AND (socioeconomic[Title/Abstract] OR "social determinants"[Title/Abstract] OR social[Title/Abstract] OR education[Title/Abstract] OR income[Title/Abstract] OR deprivation[Title/Abstract] OR occupation[Title/Abstract] OR class[Title/Abstract] OR "Indigenous peoples"[Title/Abstract] OR "Indigenous identity"[Title/Abstract] OR "First Nations"[Title/Abstract] OR Métis[Title/Abstract] OR Inuit[Title/Abstract] OR race[Title/Abstract] OR ethnicity[Title/Abstract] OR "race/ethnicity"[Title/Abstract] OR gender[Title/Abstract] OR sex[Title/Abstract])) AND ((("trend"[Title/Abstract] OR "change"[Title/Abstract] OR "monitor*"[Title/Abstract]) ))) AND (time[Title/Abstract] OR temporal[Title/Abstract]) | 1,635 |
|
7.2 Detailed results
a) Quality evaluation: scientific studies
For a copy of the report’s full quality analysis extraction table (Excel file), please contact:
health.inequalities-inegalites.en.sante@phac-aspc.gc.ca
b) Time frame of data reporting
International reporting initiatives
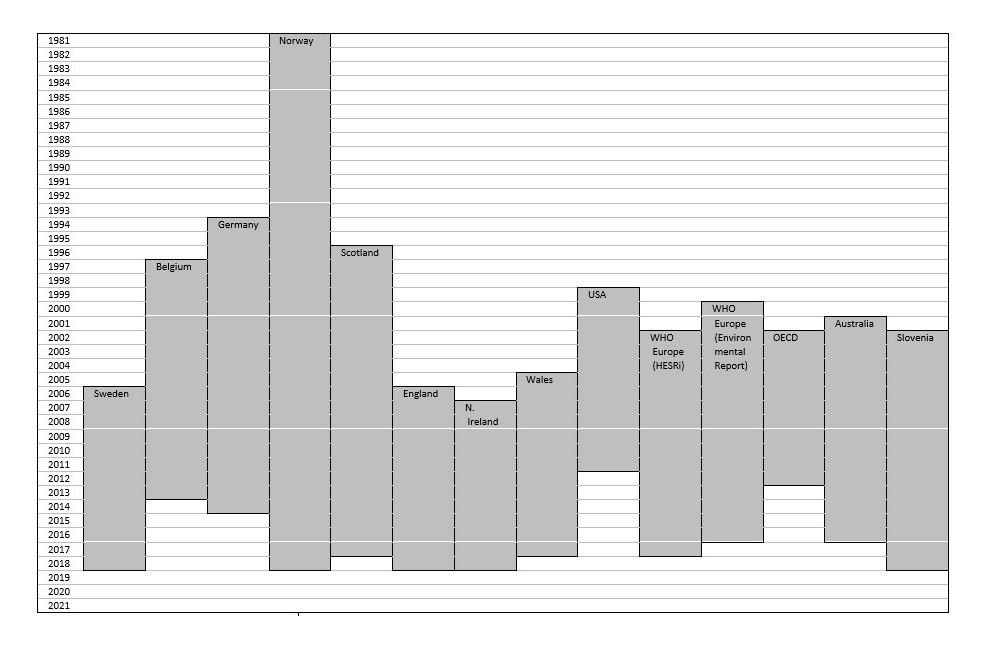
Text description
This figure summarizes the periods covered by the data analyses of the international reporting on changes in health inequalities over time. Sweden used data from 2006 to 2018; Belgium used data from 1997 to 2013; Germany used data from 1994 to 2014; Norway used data from 1981 to 2018; Scotland used data from 1996 to 2017; England used data from 2006 to 2018; Northern Ireland used data from 2007 to 2018; Wales used data from 2005 to 2017; the US used data from 1999 to 2011; the Europe’s European Health Equity Status Report initiative used data from 2000 to 2017; the WHO Europe Environmental Report used data from 2000 to 2016; the Organisation for Economic Co-operation and Development (OECD) reporting used data from 2002 to 2012; Australia used data from 2001 to 2016; and Slovenia used data from 2002 to 2018.
| Initiative reviewed | Period of coverage |
|---|---|
| Sweden | 2006-2018 |
| Belgium | 1997-2013 |
| Germany | 1994-2014 |
| Norway | 1981-2018 |
| Scotland | 1996-2017 |
| England | 2006-2018 |
| Northern Ireland | 2007-2018 |
| Wales | 2005-2017 |
| United States (US) | 1999-2011 |
| European Health Equity Status Report initiative | 2000-2017 |
| WHO Europe Environmental Report | 2000-2016 |
| Organisation for Economic Co-operation and Development (OECD) | 2002-2012 |
| Australia | 2001-2016 |
| Slovenia | 2002-2018 |
Canadian scientific studies
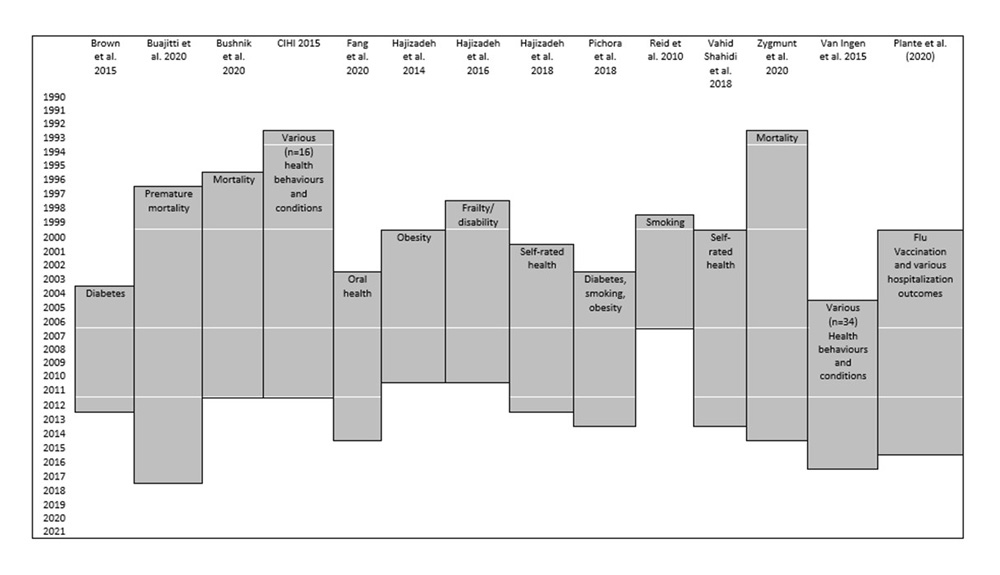
Text description
This figure summarizes the periods covered by the data analyses of 14 Canadian studies that were reviewed. Brown et al. 2015’s study on diabetes used data from 2004 to 2012. Buajitti et al. 2020’s study on premature mortality used data from 1997 to 2017. Bushnik et al. 2020’s study on mortality used data from 1996 to 2011. CIHI’s 2015 report on various health behaviours and outcomes used data from 1993 to 2011. Fang et al. 2020’s study on oral health used data from 2003 to 2014. Hajizadeh et al. 2014’s study on obesity used data from 2000 to 2010. Hajizadeh et al. 2016’s study on frailty and disability used data from 1998 to 2010. Hajizadeh et al. 2018’s study on self-rated health used data from 2001 to 2012. Pichora et al. 2018’s study on diabetes, smoking and obesity used data from 2003 to 2013. Reid et al. 2010’s study on smoking used data from 1999 to 2006. Vahid Shahidi et al. 2018’s study on self-rated health used data from 2000 to 2013. Zygmunt et al. 2020’s study on mortality used data from 1993 to 2014. Van Ingen et al. 2015’s study on various health behaviours and outcomes used data from 2005 to 2016. Plante et al. 2020’s study on influenza immunization and various hospitalization outcomes used data from 2000 to 2015.
| Studies reviewed (Author/Year) |
Outcome | Period |
|---|---|---|
| Brown et al. 2015 | Diabetes | 2004-2012 |
| Buajitti et al. 2020 | Premature mortality | 1997-2017 |
| Bushnik et al. 2020 | Mortality | 1996-2011 |
| CIHI 2015 | Various health behaviours and outcomes | 1993-2011 |
| Fang et al. 2020 | Oral health | 2003-2014 |
| Hajizadeh et al. 2014 | Obesity | 2000-2010 |
| Hajizadeh et al. 2016 | Frailty and disability | 1998-2010 |
| Hajizadeh et al. 2018 | Self-rated health | 2001-2012 |
| Pichora et al. 2018 | Diabetes, smoking, obesity | 2003-2013 |
| Reid et al. 2010 | Smoking | 1999-2006 |
| Vahid Shahidi et al. 2018 | Self-rated health | 2000-2013 |
| Zygmunt et al. 2020 | Mortality | 1993-2014 |
| Van Ingen et al. 2015 | Various health behaviours and outcomes | 2005-2016 |
| Plante et al. (2020) | Influenza immunization and various hospitalization outcomes | 2000-2015 |
c) Data visualization (examples)
Examples of data visualization tools used in international reporting initiatives
Connected scatter plot with estimates presented over time
Example 1 : Scotland
Source: Scottish Government. Long-term monitoring of health inequalities: December 2018 report [Internet]. Scottish Government. 2018 [Accessed 2021-11-24]. Available from: Long-term monitoring of health inequalities: December 2018 report
- Figure 1.2 of the report, entitled “Relative index of inequality (RII): All cause mortality <75 y, Scotland 1997-2017”, depicts a connected scatter plot graph. The vertical axis depicts the relative index of inequality (RII), while the horizontal axis depicts calendar years. RII values per year are depicted.
Example 2 : OECD
Source: OECD (2017), Preventing Ageing Unequally, OECD Publishing, Paris, Preventing Ageing Unequally. (Source for the data: calculations form the Luxembourg Income Study covering 25 OECD countries.)
- Figure 1.6 of the report, entitled “Income Gini coefficient by cohort and age groups in four selected countries” depicts a figure with four panels, each presenting a connected scatter plot. The vertical axis depicts the Gini coefficient (values ranged from 0.15 to 0.40). The horizontal axis depicts the values of age (from 20 to 75 years). Each panel depicts a country (United States, Slovak Republic, Spain, Ireland). Within each panel, a connected scatter point line is presented for each birth cohort, based on year of birth (1920, 1930, 1940, 1950, 1960, 1970, 1980). Each birth cohort connect scatter point line has a distinct symbol or line type (e.g. full line, dashed, square with full line, triangle with full line, dash-dot line, dash-dot-dash line, diamond with full line). The lines depict the Gini values, by age, for each birth cohort.
Combined histogram and scatter plot
Example : OECD
Source: OECD (2017), Preventing Ageing Unequally, OECD Publishing, Paris, Preventing Ageing Unequally. (Source for the data: Source: OECD calculations from the Luxembourg Income Study data.)
- Figure 1.5 of the report, entitled “Income inequality at the same age has increased from one generation to the next in most countries – Changes in income Gini coefficient at the same age across birth cohorts in percentage points, average across age groups, cohort reference = 1920s” depicts a vertical bar gaph (or histogram). The horizontal axis depicts OECD country names. The vertical axis depicts the size of the Gini coefficient change (negative or positive values representing improving and worsening values, respectively). For each country, a point (white diamond shape) indicates the change in the magnitude of the Gini coefficient between 1920 and 1950, and a blue bar indicates the change in the magnitude of the Gini coefficient between 1920 and 1980.
Time-stratified box and whisker plot
Example: WHO Europe
Source: WHO Europe. Environmental health inequalities in Europe: Second assessment report (2019). WHO Europe. 2019 [Accessed 2022-02-24] Available from: Environmental health inequalities in Europe: second assessment report
- Figure 28 of the report, entitled “PM2.5 exposure by GDP per capita across NUTS 3 regions over time”, depicts a box and whisker plot. The vertical axis depicts the population weighted 2.5-sized particulate matter (PM) concentration, while the horizontal axis depicts GDP per capita quintile groups (1 to 50. PM 2.5 concentration values are depicted, per time period (2007-2008, 2010-2011, 2013-2014, respectively) and per GDP quintile group.
Choropleth map of degree of change over time and space
Example : WHO Europe
Source: WHO Europe. Environmental health inequalities in Europe: Second assessment report (2019). WHO Europe. 2019 [Accessed 2022-02-24] Available from: Environmental health inequalities in Europe: second assessment report
- Figure 27 of the report, entitled “Absolute change in PM2.5 exposure in NUTS 3 regions, 2007-2008 to 2013-2014” depicts a choropleth map of European countries. The colour-coding system of the choropleth map shows change in population-weighted PM2.5 concentration (μg/m3). Darker blue values indicate reduction, darker red values indicate increases. Grey values indicate an absence of data.
Summary tables with icons or colour coding
Example 1: Australia
Source: Australian Institute of Health and Welfare (2019). Indicators of socioeconomic inequalities in cardiovascular disease, diabetes and chronic kidney disease. Cat. no. CDK 12. Canberra: AIHW. [Accessed 2022-03-01] Available from: https://www.aihw.gov.au/reports/social-determinants/indicators-socioeconomic-inequalities/summary
- Table 2.2 of the report, entitled “Summary measures of inequalities in stoke incidence, by socioeconomic area and sex, 2006 to 2016” depicts a table with icons that describe the direction of inequality trends. The table presents data for four summary measures of inequalities in stroke incidence. The four summary measures are the rate ratio, rate difference, relative index of inequality (RII), and population attributable fraction (PAF). Inequality estimates are provided for the years 2006, 2011 and 2016. The last column of the table presents an icons that depict the change in the inequality. The three possible icons are: arrow going down (suggesting a decrease in inequalities), an upward arrow (suggesting an increase in inequalities), and a horizontal wave icon (suggesting no change, or that the trend is unclear).
Example 2: Slovenia
Source: National Institute of Public Health. Inequalities in Health: Future Challenges for Intersectoral Cooperation. (2021). [Accessed 2022-02-25] Available from: Inequalities in health future challenges for intersectoral cooperation
- Figure 2 of the report, entitled “Indicators in which the trend in the gap between low and high levels of education attainment is improving – the difference between socioeconomic groups is narrowing” depicts a table. The four columns of the table present data on: the direction of the burden for Slovenia overall, for those in the lowest educational attainment group, for those in the highest educational attainment group, and the direction of the inequality between the latter groups. Each row depicts data for one of seven indicators: self-assessed good or very good health, life expectancy at age 30 – men, obesity – men, neck chronic disorder, back chronic disorder, seeking help from mental health professionals – women and adult mortality from injuries caused by accidents. In the cells, a colour-coding scheme was used. The scheme uses three colours: green, to indicate an improvement during the period observed; red to indicate a deterioration during the period observed; and yellow, to indicate no statistically significant changes or an indefinable trend resulting from a fluctuation in the value or a reversal of the educational gap in the period observed.
Examples of data visualization tools used in Canadian studies
Lollypop graph
Example : Toronto Public Health
Source: Toronto Public Health. The Unequal City 2015: Income and Health Inequities in Toronto. (2015). [Accessed 2022-02-25] Available from: The Unequal City 2015: Income and Health Inequities in Toronto
- The unnumbered figure on page 15 of the report, entitled “Changes in health inequities for Toronto men over the 7 to 12 years of data analyzed, the income and health relationship do not change between the initial and most recent time points for 12 of the 15 indicators of male health, and the two indicators of combined male and female health”, depicts a lollipop (or lollypop) graph. The horizontal axis depicts relative index of inequality (RII) values, which capture the strength of the relationship between income and health. The horizontal axis values range is from -2.5 to 2.5, where values below zero, represents poor health associated with high income, and values above zero represent poor health associated with low income. The vertical axis depicts health outcome indicators. Two sets of points are presented in the lollipop graph for each indicator: one point (in lighter colour) presents the initial RII values, while another point (in darker colour) presents the latest RII values, for each indicator, respectively. The reader can thus observe the change in RII across time for each indicator.
Bar chart or scatter plot with estimates presented over time
Example : Toronto Public Health
Source: Toronto Public Health. The Unequal City 2015: Income and Health Inequities in
Toronto. (2015). [Accessed 2022-02-25] Available from: The Unequal City 2015: Income and Health Inequities in Toronto
- Figure 2 of the report, entitled “Breast Cancer Incidence Rate, by income, Females, Toronto, 1999 to 2001 Combined to 2008 to 2010 Combined” depicts three panels. The first panel (Panel A) depicts a stratified histogram (vertical bar chart). The vertical axis depicts rates (per 100,000 population). The horizontal axis depicts years (1999-2001, 2002-2004, 2005-2007 and 2008-2010). A bar value is presented for each income quintile group, for each period, respectively. It includes 95% confidence interval error bars. The second panel (Panel B) depicts a connected forest or scatter plot. The vertical axis depicts the slope index of inequality (SII) values. The horizontal axis depicts years (same as above). A SII value is presented for each period, with a 95% confidence interval. The third panel (Panel C) depicts a connected forest or scatter plot. The vertical axis depicts the relative index of inequality (RII) values. The horizontal axis depicts years (same as above). A RII value is presented for each period, with a 95% confidence interval.
Cumulative horizontal bar chart
Example : Hajizadeh et al. (2014)
Source: Hajizadeh M, Karen Campbell M, Sarma S. Socioeconomic inequalities in adult obesity risk in Canada: trends and decomposition analyses. The European Journal of Health Economics. 2014 Mar;15(2):203-21. Socioeconomic inequalities in adult obesity risk in Canada: trends and decomposition analyses
- Figure 3 of the article, entitled “Relative contribution of each factor to the inequality of obesity in Canada” depicts a horizontal, cumulative bar graph. The graph presents the results of a decomposition analysis. The horizontal axis depicts proportions of the inequality explained. The vertical axis depicts gender groups (female, male, total population) for two time periods (2000-2001 and 2009-2010), respectively. A horizontal cumulative bar is presented for each of the six gender and time period pairings (females in 2000-2001, females in 2009-2010, etc.). Each segment within the bar graph depicts the proportion of the inequality explained by the social determinant or behavioural factors measured (e.g. demographic factors, household arrangements, immigrant status, drinking habit, income, education, fruits and vegetables consumption, smoking habit, home ownership, occupation status, physical activity, geographic factors) and the residual unexplained portion. Each factor is represented by a distinct colour, in each of the six bars. Differences in the size of the proportion explained between time periods, for each gender group, can be observed visually, by comparing the change in the size of the cumulative bar graph section for each factor, respectively (note: a more accessible version of this graph could include distinct textures, fill, and contour values to identify each factor).
Blakely’s compass (connected scatter plot)
Example : Buajitti et al. (2020)
Source: Buajitti E, Frank J, Watson T, Kornas K, Rosella LC. Changing relative and absolute socioeconomic health inequalities in Ontario, Canada: a population-based cohort study of adult premature mortality,1992 to 2017. Plos One. 2020 Apr 2;15(4):e0230684. https://doi.org/10.1371/journal.pone.0230684
- Figure 2 of this article, entitled “Absolute and relative inequalities in adult premature mortality (death ages 18 to 74), Ontario by sex, 1992 to 2017”, presents a connected scatter plot graph. This figure is also referred to as “Blakely’s compass”. The vertical axis depicts the relative index of inequality (RII) values on the log scale (values range form 0 to 3.0). The horizontal axis depicts the rate of adult premature deaths per 1000 population on a log scale (values range from 2 to 6). Additionally, dotted grid lines are presented in the background of the graph. Each dotted grid line indicates a slope index of inequality (SII) value (1.0, 1.5, 2.0, 3.0, 4.0). Two connected arrow scatter plot lines are presented in the graph: a full purple line for females, a dashed green line for males. The points in the arrow scatter plot lines are connected in order of year, with arrows indicating the directionality of the trend.
8.0 Acknowledgments and Authors
Acknowledgements
This report is a product to guide the Pan-Canadian Health Inequalities Reporting (HIR) Initiative. The HIR Initiative is a collaborative effort of the Public Health Agency of Canada (PHAC), Statistics Canada, the Canadian Institute for Health Information (CIHI), and the Pan-Canadian Public Health Network (PHN). The PHN is a coordinating body of federal, provincial and territorial public health departments.
We would like to thank Radhika Sultania for her work on the bibliography and references in this report, and Natalie Osorio for her work on the preparation of this report for web-based publication. We would also like to thank the reviewers of this report for the generous donation of their time: Dr. Cory Neudorf, Lawson Greenberg (Statistics Canada), and Julie Stratton (Canadian Institute of Health Information). The analyses and conclusions in this report do not necessarily reflect those of the reviewers or their affiliated organizations.
Authors
At PHAC, this report was prepared by a core team within the Health Equity Policy Division’s Equity Analysis and Policy Research team: Dr. Alexandra Blair, Ali El-Samra, MScPH, Muhim Abdalla, MPH, Eric Vallières, MSc, Sai Yi Pan, MSc, and Colin Steensma, MSc.