The health of Canadian youth: Findings from the health behaviour in school-aged children study

Download the alternative format
(PDF format, 5.5 MB, 157 pages)
Organization: Public Health Agency of Canada
Type: Publication
Date published: 2020-06-24
Related topics
The results of a cross-national research study on the health and health behaviours of youth in Canada in grades 6 through 10.
Table of contents
- Foreword
- Acknowledgements
- Chapter 1: Introduction
- Chapter 2: Home and family
- Chapter 3: Friends
- Chapter 4: School
- Chapter 5: Community
- Chapter 6: Physical activity, screen time, and sleep
- Chapter 7: Healthy eating
- Chapter 8: Healthy weights
- Chapter 9: Injury and concussions
- Chapter 10: Bullying and teen dating violence
- Chapter 11: Mental health
- Chapter 12: Spiritual health
- Chapter 13: Substance use
- Chapter 14: Sexual health
- Chapter 15: Social media use
- Chapter 16: Key messages
Foreword
We are pleased to present The health of Canadian youth: Findings from the health behaviour in school-aged children study.
In an evolving public health landscape, gaining insight into the health and well-being of young people remains important. Understanding the connections between health and social contexts is a crucial step in ensuring positive health outcomes. This report examines the social determinants of youth health, including family, friends, school and community. We are encouraged to see that the majority of youth are reporting happy home lives and positive relationships with their parents.
Further, the study’s ability to capture trends in health behaviour provides information on progress made in addressing some risk-taking behaviours, such as smoking, and the challenges that are emerging, such as vaping. In addition, new information collected on social media use has provided us with a more comprehensive perspective on its positive and negative dimensions, and identifies it as an important emerging health issue.
The report highlights the continued need to support young people during an important time of transition. The study is a valuable source of information that enables the Public Health Agency of Canada to deliver on its mandate to protect and promote the health of Canadians through evidence-based decision-making.
We extend our gratitude to the over 21,000 students across Canada who shared their lived experiences, as well as to the young people who were engaged in providing reflections, context and insight on the findings. Youth perspectives matter and are an invaluable contribution to our work. Thank you to the teachers and school administrators for their collaboration and support in the administration of this survey. Together we can help to ensure that young people in Canada receive the support they need to lead healthy lives.
Tina Namiesniowski
President, Public Health Agency of Canada
Dr. Theresa Tam
Chief Public Health Officer of Canada
Acknowledgements
This report presents findings from the 8th cycle of the health behaviour in school-aged children survey in Canada. We would like to acknowledge the collaborative efforts of the 50 participating research teams from Europe and North America and the ongoing support of the International Coordinating Centre in Scotland, as well as the International Databank Coordinating Centre in Norway.
The administration of the HBSC survey and the presentation of findings in this report are made possible by funding from the Public Health Agency of Canada through the Youth Policy and Partnerships Unit in the Division of Children and Youth.
Special appreciation is given to Dr. Suzy Wong, Senior Policy Analyst; Matthew Enticknap, Manager; and Adrian Puga, Manager; as well as reviewers within the Government of Canada for providing invaluable insight and contributions throughout the planning and the completion of this report.
The Pan-Canadian Joint Consortium for School Health (JCSH) collaborated with the HBSC team to provide active support in the data collection phase of the study and to identify priority issues in the development of the survey instruments and for reporting. Leadership in our collaboration was provided by Executive Director Katherine Kelly, the JCSH Secretariat, and the JCSH School Health Coordinators’ Committee.
For the first time the HBSC study has targeted a subsample of students who are the children of current or retired Canadian Armed Forces families. This was done in collaboration with the Canadian Institute for Military and Veteran Health Research (CIMVHR) under the leadership of Dr. Alyson Mahar. Findings will be released in a separate report.
We would like to acknowledge Shanti MacFronton, Sharif Mahdy, Christa Romaldi, Gillian Camazzola and Stoney McCart, and their colleagues from The Students Commission of Canada, for their work in bringing together young people to elicit their input on questions, and for their work in collecting and summarizing the views of young people. We would also like to thank the young people who so candidly shared with us their thoughts and experiences and their perspectives on the HBSC findings.
The Social Program Evaluation Group, Queen’s University, was responsible for collecting and analyzing the data under the supervision and organization of Matthew King. Sandy Youmans and Diane Earle were responsible for contacting school jurisdictions and schools and coordinating the administration of the survey.
Data entry, coding, questionnaire handling, and the related tracking and documentation were carried out by Deen Maishan, Nea Okada, Lovleen Cheema, Christina Zheng, Darmetha Ajerla, Nive Indrajith, Vivek Thanki, Jaishnu Moudgil, Najmeh Arabi, Hannah Michaelson, Ozma Aziz, Olivia Hughes, Hossein Tari, Sau-Ling Hum, Sierra Dyer, Natalie Kwan, and Diksha Doodnauth.
Diane Yocum was responsible for carrying out and overseeing the many administrative tasks required in the questionnaire development process and collecting the data, as well as preparing and editing the figures and the text in the report.
Lee Watkins edited the manuscript, while Les Stuart graphically designed the report and assisted the editorial team with picture research. Chantal Caron was responsible for translating the English version of the report into French.
We would like to thank all of the co-investigators who have contributed to the development of the measures, the methodology, as well as the conceptual direction of the report (Dr. Colleen Davison, Dr. Ian Janssen, and Dr. Don Klinger of Queen’s University; Dr. Frank Elgar, McGill University; Dr. Genevieve Gariepy, l’Université de Montréal; Dr. Kathy Georgiades, McMaster University; Dr. Scott Leatherdale, University of Waterloo; Dr. Michael McIsaac, University of Prince Edward Island; and Dr. Elizabeth Saewyc, University of British Columbia).
We are also grateful for the leadership of Dr. John Freeman, who worked tirelessly as the principal investigator of HBSC Canada from 2008 to 2017. On John’s passing in August 2017 the leadership of HBSC Canada and this survey was assumed by Dr. Wendy Craig, Dr. Will Pickett, and Mr. Matthew King, who co-authored this report.
Most importantly, we wish to thank all the students who were willing to share their experiences with us, as well as the school principals, teachers, school boards, and parents, for making this survey happen.
Chapter 1: Introduction
Health behaviour in school-aged children (HBSC)
The HBSC examines the health and health behaviours of youth ages 11-15 through a population health theory lens. Such a lens considers both individual and collective factors and conditions within broadly defined determinants of health (Public Health Agency of Canada, 2013). Among youth, these physical and social environmental determinants include their home life, school life, peer groups, neighbourhood settings, socioeconomic status, and health and risk behaviours.
Purpose
The main purposes of the HBSC are to understand youth health and well-being and to inform education and health policy and health promotion programs nationally and internationally. The HBSC is conducted every four years using a common research protocol, which is developed and approved by the International Assembly of Principal Investigators. By collecting common indicators of youth health across multiple nations and administering the survey every four years, health behaviours in youth can be compared internationally, within nations, and over time.
Objectives
In Canada, the HBSC is funded by the Public Health Agency of Canada (PHAC) and conducted by Queen’s University. The protocol and associated questions asked of Canadian students are developed through a broad-based consultation model alongside PHAC, provincial and territorial Ministries of Health and Education through the Pan-Canadian Joint Consortium for School Health and the Canadian HBSC team.
The primary objectives of the HBSC are to:
- initiate and sustain national and international research on health behaviour, health and well-being, and their social and physical contexts in school-aged children;
- contribute to theoretical, conceptual, and methodological development in youth health research;
- monitor health and health behaviours and social and physical contexts of school-aged children;
- disseminate findings to the relevant audiences;
- provide an international source of expertise on youth health for public health and health education.
Methods
The Canadian HBSC survey
- The student questionnaire represents the core source of information in the HBSC.
- Questionnaires were administered to school classes during one 45-70 minute session.
- Survey questions covered a wide range of topics pertaining to health and its determinants.
- Researchers were granted ethics clearance for the study by Research Ethics Boards from both Queen’s University and PHAC/Health Canada.
Youth perspective
In 2019, the Students Commission of Canada (SCC) worked with the Public Health Agency of Canada to support youth engagement on the HBSC study through youth-centered events, workshops, activities and youth-generated videos/materials that engage with the HBSC study findings. Young people across Canada have engaged in providing reflections, context and insight to the most recent HBSC findings and they are represented in this report through the youth participant quotes and youth perspective.
Sample
Selection of schools
- All provinces and two territories (Yukon and the Northwest Territories) participated in 2018.
- School jurisdictions in each province or territory were identified and ordered according to key characteristics: language of instruction, public/Roman Catholic designation (where applicable), and community size.
- A list of schools within eligible and consenting school jurisdictions was created, and schools in the sample were selected randomly from this list.
Selection of students
- The number of classes in specific schools was estimated based on the grades in the school, the number of teachers, the total enrolment, and the enrolment by grade, while accounting for known variations in class structure.
- Classes had an approximately equal chance of being selected.
- Students within the selected classrooms, following consent, were asked to complete the survey questionnaire.
Statistical analysis
- Nationally-representative estimates were calculated using survey weights, which reflected actual enrolments of students within each grade (from grades 6 to 10) and province/territory.
- Differences between groups are considered statistically significant (p<.05) if they were three percent or greater.
| Province | Schools | Students | |||
|---|---|---|---|---|---|
| British Columbia | 20 | (7.0%) | 1,740 | (8.1%) | |
| Alberta | 29 | (10.1%) | 2,261 | (10.5%) | |
| Saskatchewan | 8 | (2.8%) | 373 | (1.7%) | |
| Manitoba | 27 | (9.4%) | 2,569 | (11.9%) | |
| Ontario | 54 | (18.8%) | 2,757 | (12.8%) | |
| Quebec | 25 | (8.7%) | 1,832 | (8.5%) | |
| Newfoundland and Labrador | 20 | (7.0%) | 1,416 | (6.6%) | |
| Nova Scotia | 21 | (7.3%) | 2,438 | (11.3%) | |
| Prince Edward Island | 14 | (4.9%) | 2,410 | (11.2%) | |
| New Brunswick | 7 | (2.4%) | 584 | (2.7%) | |
| Northwest Territories | 34 | (11.8%) | 1,724 | (8.0%) | |
| Yukon | 28 | (9.8%) | 1,437 | (6.7%) | |
| Total | 287 | (100%) | 21,541 | (100%) | |
| Gender, number, percentage, total | Grade | Total | |||||
|---|---|---|---|---|---|---|---|
| 6 | 7 | 8 | 9 | 10 | |||
| Male | n | 2,017 | 2,143 | 2,114 | 2,294 | 1,688 | 10,256 |
| % | 50.6% | 47.4% | 47.4% | 48.0% | 46.9% | 48.0% | |
| Female | n | 1,932 | 2,315 | 2,264 | 2,414 | 1,842 | 10,767 |
| % | 48.4% | 51.2% | 50.8% | 50.5% | 51.2% | 50.4% | |
| Neither term describes me*Footnote * | n | 39 | 64 | 78 | 76 | 70 | 327 |
| % | 1.0% | 1.4% | 1.8% | 1.6% | 1.9% | 1.5% | |
| Total | n | 3,988 | 4,522 | 4,456 | 4,784 | 3,600 | 21,350 |
|
|||||||
References
Public Health Agency of Canada [PHAC]. (2013). What is the population health approach? Retrieved from http://www.phac-aspc.gc.ca/ph-sp/approach-approche/appr-eng.php
Chapter 2: Home and family
- Family structure
- Happy home life
- Want to leave home
- Mother easy to talk to
- Father easy to talk to
- Parents understand me
- Conclusions
Family
Throughout development, the family is an important socializing force, influencing young people’s actions, values, and beliefs (Parke & Buriel, 2006). As behavioural role models, family plays a key role in a variety of health-promoting behaviours. Parents also play a significant role in supporting young people’s psychological and emotional health and well-being. Youth with strong attachments and supportive relationships with their parents are more likely to have high self-esteem. These positive parental connections may also help adolescents to cope with challenges and struggles (Bulanda & Majumdar, 2009), including mental health problems (Leone, Ray, & Evans, 2013).
Adolescence marks a time of great social and emotional change, where youth begin to expand their networks of social support. Despite the increase in social support from friends and partners during adolescence, parental support continues to be a key factor in healthy mental and physical development.
In this chapter, we examine the relationships that adolescents have with their parents. These relationships are assessed by asking students about how supported they feel by their family; if their parents expect too much of them; if they feel understood by their parents; if they have a happy home life; if they have thoughts of leaving home; and the ease at which they communicate with their mother and father.
Family support
With increasing grade, fewer girls report high family support.
51% of girls in grade 6 report high family support compared to 31% of girls in grade 10.
The percentage of boys who report high family support is higher in grades 6 and 7 than in grades 9 and 10.
53% of boys in grade 6 report high family support compared to 41% of boys in grade 10.
Parents are struggling with being over protective and accepting that kids are growing up. They also struggle with communication and listening. A lot of times parents are on their phones, so they’re struggling to be present.
[Youth Workshop Group Reflections]
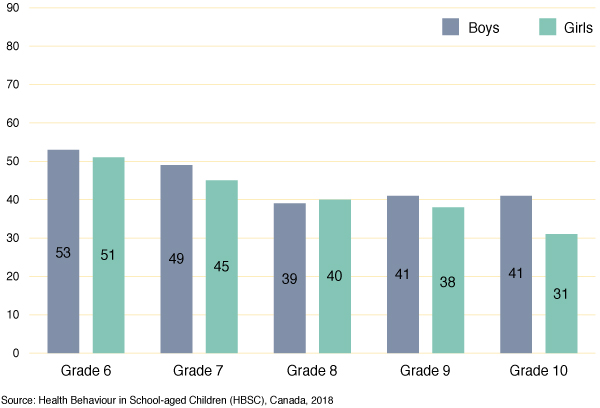
Figure 1 - Text description
| Grade | Boys | Girls |
|---|---|---|
| Grade 6 | 53 | 51 |
| Grade 7 | 49 | 45 |
| Grade 8 | 39 | 40 |
| Grade 9 | 41 | 38 |
| Grade 10 | 41 | 31 |
| Source: Health Behaviour in School-aged Children (HBSC), Canada, 2018 | ||
Majority of students report having a happy home life
Boys are more likely than girls to report having a happy home life.
79% of boys in grade 10 report having a happy home life compared to 68% of grade 10 girls.
With increasing grade, there are fewer students who report having a happy home life. This drop is greater for girls than boys.
86% of grade 6 boys report having a happy home life and it drops 7 percentage points to 79% by grade 10.
For girls, 84% report having a happy home life in grade 6 and it drops 16 percentage points to 68% by grade 10.
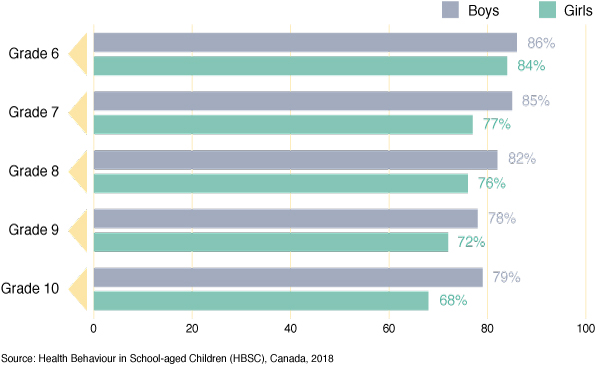
Figure 2 - Text description
| Grade | Boys | Girls |
|---|---|---|
| Grade 6 | 86 | 84 |
| Grade 7 | 85 | 77 |
| Grade 8 | 82 | 76 |
| Grade 9 | 78 | 72 |
| Grade 10 | 79 | 68 |
| Source: Health Behaviour in School-aged Children (HBSC), Canada, 2018 | ||
One-third of girls in grades 9 and 10 report that there are times when they would like to leave home
Girls are more likely than boys to report wanting to leave home.
24% of boys in grade 10 report having times when they wanted to leave home compared to 35% of grade 10 girls.
With increasing grade, there are more students reporting wanting to leave home. This increase is greater for girls than boys.
19% of grade 6 boys report that there are times they would like to leave home and it increases 5 percentage points to 24%, by grade 10.
17% of grade 6 girls report that there are times they would like to leave home and it increases 18 percentage points to 35%, by grade 10.
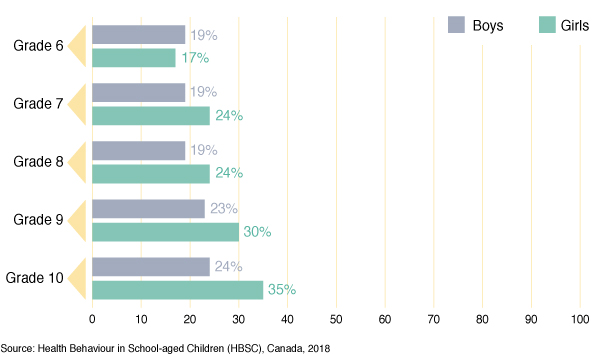
Figure 3 - Text description
| Grade | Boys | Girls |
|---|---|---|
| Grade 6 | 19 | 17 |
| Grade 7 | 19 | 24 |
| Grade 8 | 19 | 24 |
| Grade 9 | 23 | 30 |
| Grade 10 | 24 | 35 |
| Source: Health Behaviour in School-aged Children (HBSC), Canada, 2018 | ||
The majority of students report that it is easy to talk to their mother, but this decreases with grade
Boys are more likely than girls to report it is easy to talk to their mother about things that really bother them.
In grade 10, 74% of boys report it is easy to talk to their mother versus 66% of girls.
With increasing grade, fewer students report it is easy to talk to their mother.
In grade 6, 87% of boys report it is easy to talk to their mother compared to 74% in grade 10. Similarly for girls, ease of talking with their mother drops from 84% in grade 6 to 66% in grade 10.
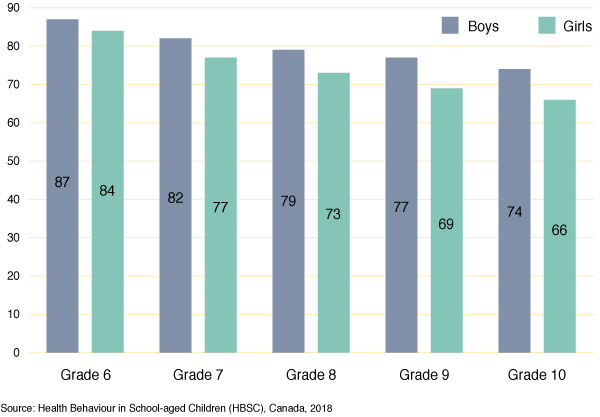
Figure 4 - Text description
| Grade | Boys | Girls |
|---|---|---|
| Grade 6 | 87 | 84 |
| Grade 7 | 82 | 77 |
| Grade 8 | 79 | 73 |
| Grade 9 | 77 | 69 |
| Grade 10 | 74 | 66 |
| Source: Health Behaviour in School-aged Children (HBSC), Canada, 2018 | ||
With increasing grade, fewer students report that it is easy to talk to their father
Boys are more likely than girls to report it is easy to talk to their father about things that really bother them.
In grade 10, 59% of boys versus 44% of girls report it is easy to talk to their father.
With increasing grade, fewer students report it is easy to talk to their father.
In grade 6, 77% of boys report it is easy to talk to their father compared to 59% in grade 10, an 18 percentage point drop. Similarly for girls, ease talking to their father declines from 67% in grade 6 to 44% in grade 10, a 23 percentage point drop.
Fewer students report that it is easy to talk to their father than it is easy to talk to their mother.

Figure 5 - Text description
| Grade | Boys | Girls |
|---|---|---|
| Grade 6 | 77 | 67 |
| Grade 7 | 73 | 53 |
| Grade 8 | 67 | 50 |
| Grade 9 | 62 | 49 |
| Grade 10 | 59 | 44 |
| Source: Health Behaviour in School-aged Children (HBSC), Canada, 2018 | ||
Over time, more students are reporting that they feel understood by their parents
In 1990, 51% of grade 10 boys reported they were understood by their parents, compared to 75% in 2018.
In 1990, 45% of grade 10 girls reported that they were understood by their parents, compared to 58% in 2018.
Boys are more likely than girls to report that they feel understood by their parents, 87% of grade 6 boys in 2018 versus 81% of grade 6 girls.
With increasing grade, fewer youth report feeling understood by their parents, 81% of grade 6 girls in 2018 versus 58% of grade 10 girls.
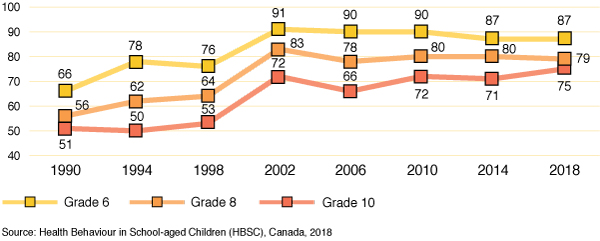
Figure 6a - Text description
| Year | Grade 6 | Grade 8 | Grade 10 |
|---|---|---|---|
| 1990 | 66 | 56 | 51 |
| 1994 | 78 | 62 | 50 |
| 1998 | 76 | 64 | 53 |
| 2002 | 91 | 83 | 72 |
| 2006 | 90 | 78 | 66 |
| 2010 | 90 | 80 | 72 |
| 2014 | 87 | 80 | 71 |
| 2018 | 87 | 79 | 75 |
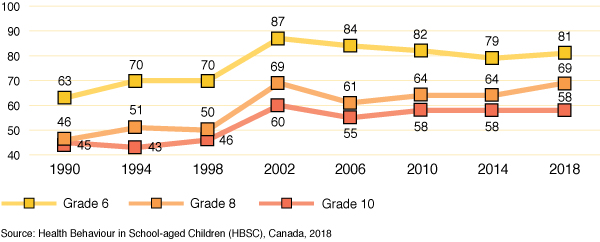
Figure 6b - Text description
| Year | Grade 6 | Grade 8 | Grade 10 |
|---|---|---|---|
| 1990 | 63 | 46 | 45 |
| 1994 | 70 | 51 | 43 |
| 1998 | 70 | 50 | 46 |
| 2002 | 87 | 69 | 60 |
| 2006 | 84 | 61 | 55 |
| 2010 | 82 | 64 | 58 |
| 2014 | 79 | 64 | 58 |
| 2018 | 81 | 69 | 58 |
| Source: Health Behaviour in School-aged Children (HBSC), Canada, 2018 | |||
Conclusions
- It is concerning that only one-half of Canadian grade 6 students are reporting feeling high support at home and that this percentage declines as grade increases, particularly for girls.
- It is encouraging that the majority of students report a happy home life. However, it is noteworthy that lower percentages of girls than boys report a happy home life and the percentage declines with grade.
- One-third of youth in grades 9 and 10 report thinking about leaving home. Again, older girls are more likely to report these feelings. Girls may be experiencing more conflict and stress in the home and may require support.
- Most youth report that it is easy to talk to their mother about things that really bother them, but fewer report it is easy to talk to their father. Boys report more ease communicating with parents than do girls. Again it is the older girls who are least likely to report ease of communicating, especially with fathers.
- Since 1990, more students are reporting that they feel understood by their parents, although this increase is less for the older students, particularly girls.
- Nonetheless, parents play an important role in the healthy development of youth (Parke & Buriel, 2006).
References
Bulanda, R., & Majumdar, D. (2009). Perceived parent-child relations and adolescent self-esteem. Journal of Child and Family Studies, 18, 203-212.
Leon, R., Ray, S., & Evans, M. (2013). The lived experience of anxiety among late adolescents during high school: An interpretive phenomenological approach. Journal of Holistic Nursing, 31, 188-197.
Parke, R. D., & Buriel, R. (2006). Socialization in the family: Ethnic and ecological perspectives. In W. Damon & R. M. Lerner (Eds.), Handbook of child psychology, (pp. 429-504). Hoboken, NJ: John Wiley & Sons Inc.
Chapter 3: Friends
- Positive peer behaviours
- Risky peer behaviours
- Easy to talk to friends
- Friend support
- Online friend communication
- Trends in close friends
- Conclusions
Friends
Relationships with friends are highly influential for school-aged youth, contributing to psychological, social, and emotional development (Bukowski, Burmester, & Underwood, 2011). Friendships become especially salient during adolescence, as youth pursue greater autonomy from parents and deeper engagement with peers (Steinberg & Morris, 2001). This includes friendships with peers of the same and opposite sex (Lam, McHale, & Crouter, 2014). With the increased importance of peer relationships, friends become important sources of companionship, validation, and mutual support during adolescence (Juvonen, Espinoza, & Knifsend, 2012).
This chapter examines students’ friendships with their peers. These relationships are assessed by asking students how supported they feel by their friends and the ease with which they can communicate and share concerns with their friends. This chapter also explores positive social behaviours and the risk-taking behaviours of their peers.
Majority of students report that most of their friends do well at school and get along with parents
The majority of students in grades 9 and 10 report having friends who do well at school, with a higher percentage of girls than boys with friends who do well at school (71% versus 66%).
43% of grade 9 and 10 boys versus 53% of girls report having friends who help others.
16% of boys and 18% of girls report having friends who engage in cultural activities.

Figure 7 - Text description
| Positive behaviour | Boys | Girls |
|---|---|---|
| Do well at school | 66 | 71 |
| Participate in sports | 51 | 47 |
| Participate in cultural activities | 16 | 18 |
| Get along with parents | 66 | 59 |
| Care for environment | 35 | 42 |
| Help others | 43 | 53 |
| Source: Health Behaviour in School-aged Children (HBSC), Canada, 2018 | ||
Minority of grade 9 and 10 students report that most of their friends engage in risky behaviours
In grades 9 and 10, 4% of boys and 5% of girls report that most of their friends smoke.
6% of students report that most of their friends get drunk at least once a week.
Grade 9 and 10 students are more likely to report that most of their friends use drugs to get high (11% of girls; 9% of boys) than smoke cigarettes (4%).
Both boys and girls agreed that they would likely participate in risky behaviours if their friends were doing them.
[Youth Workshop Group Reflections]
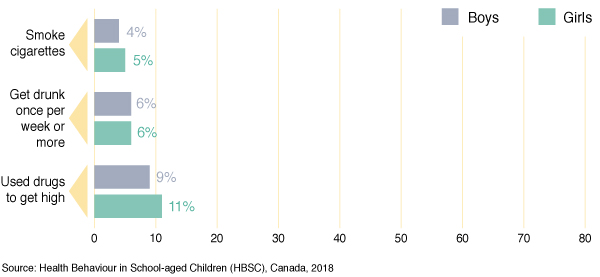
Figure 8 - Text description
| Risky behaviour | Boys | Girls |
|---|---|---|
| Smoke cigarettes | 4 | 5 |
| Get drunk once per week or more | 6 | 6 |
| Used drugs to get high | 9 | 11 |
| Source: Health Behaviour in School-aged Children (HBSC), Canada, 2018 | ||
A higher percentage of girls than boys report having high friend support
44% of girls in grade 8 compared to 30% of grade 8 boys report having high friend support.
For girls, with increasing grade, fewer report high friend support, 48% of girls in grade 6 to 39% in grade 10.
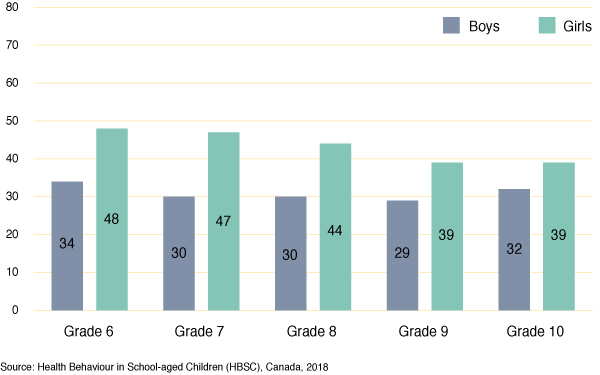
Figure 9 - Text description
| Grade | Boys | Girls |
|---|---|---|
| Grade 6 | 34 | 48 |
| Grade 7 | 30 | 47 |
| Grade 8 | 30 | 44 |
| Grade 9 | 29 | 39 |
| Grade 10 | 32 | 39 |
| Source: Health Behaviour in School-aged Children (HBSC), Canada, 2018 | ||
With increasing grade, students are more likely to communicate with friends online
Girls are more likely than boys to communicate frequently with their close friends online.
In grade 10, 69% of girls versus 58% of boys report having online communication with close friends several times a day.
With increasing grade, students report increased online communication with close friends.
26% of grade 6 boys report communicating online several times a day versus 58% of grade 10 boys.
In the survey, ‘online communication’ was defined as ‘sending and receiving text messages, emojis, and photo, video, or audio messages through instant, social network sites, or e-mail (on a computer, laptop, tablet, or smartphone)’.
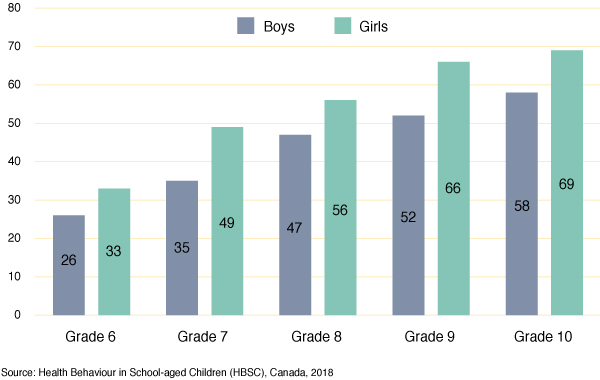
Figure 10 - Text description
| Grade | Boys | Girls |
|---|---|---|
| Grade 6 | 26 | 33 |
| Grade 7 | 35 | 49 |
| Grade 8 | 47 | 56 |
| Grade 9 | 52 | 66 |
| Grade 10 | 58 | 69 |
| Source: Health Behaviour in School-aged Children (HBSC), Canada, 2018 | ||
Compared to 1994, fewer grade 8 and 10 girls report having a same-sex friend to talk to in 2018
Over time, fewer grade 8 and 10 girls report having a same-sex friend to talk to about things that bother them, while for boys it is relatively stable.
For example, in 1994, 90% of grade 8 girls report having a same-sex friend to talk to versus 79% in 2018.
In 1994, 94% of grade 10 girls report having a same-sex friend to talk to versus 79% in 2018.
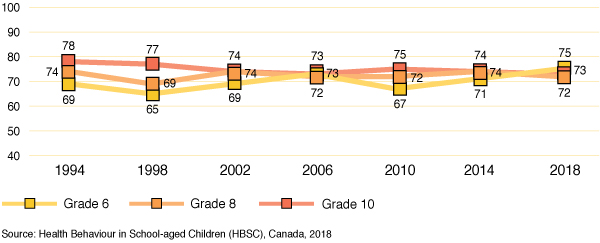
Figure 11a - Text description
| Year | Grade 6 | Grade 8 | Grade 10 |
|---|---|---|---|
| 1994 | 69 | 74 | 78 |
| 1998 | 65 | 69 | 77 |
| 2002 | 69 | 74 | 74 |
| 2006 | 73 | 72 | 73 |
| 2010 | 67 | 72 | 75 |
| 2014 | 71 | 74 | 74 |
| 2018 | 75 | 72 | 73 |
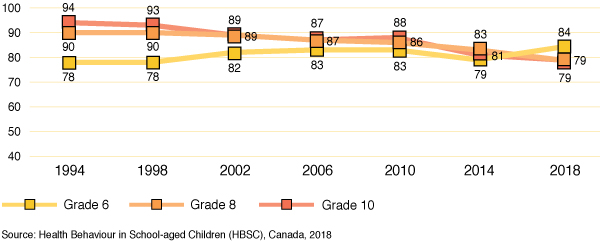
Figure 11b - Text description
| Year | Grade 6 | Grade 8 | Grade 10 |
|---|---|---|---|
| 1994 | 78 | 90 | 94 |
| 1998 | 78 | 90 | 93 |
| 2002 | 82 | 89 | 89 |
| 2006 | 83 | 87 | 87 |
| 2010 | 83 | 86 | 88 |
| 2014 | 79 | 83 | 81 |
| 2018 | 84 | 79 | 79 |
| Source: Health Behaviour in School-aged Children (HBSC), Canada, 2018 | |||
Conclusions
- The majority of youth are reporting having friends who engage in positive behaviours. These friendships can have the benefit of strengthening adaptive behaviours (Bukowski et al., 2011).
- A minority of students report having friends who engage in risky behaviour – although 11% of grade 9 and 10 girls report having friends who use drugs. Having close friends who engage in risky behaviours can increase the likelihood that the youth will also engage in that behaviour (Lam et al., 2014).
- More girls than boys report having high friend support. Since 1994, fewer girls are reporting having a same-sex friend that they can talk to about issues that bother them. Social support is a protective factor for mental health (Reinke et al., 2011).
- A majority of students have daily online communication, and it is more prevalent for girls. Communication among friends provides opportunities to develop intimacy, to share interpersonal issues, and to support one another (Bukowski et al., 2011).
- Healthy relationships with peers can help prevent negative outcomes and promote healthy development (Craig & Pepler, 2014).
References
Bukowski, W. M., Buhrmester, D., & Underwood, M. K. (2011). Peer Relations as a Developmental Context. In M. K. Underwood & L. H. Rosen (Eds.), Social Development: Relationships in Infancy, Childhood, and Adolescence (pp. 153–179).
Craig, W., & Pepler, D. (2014). Trends in Healthy Development and Healthy Relationships. Public Health Agency of Canada.
Juvonen, J., Espinoza, G., & Knifsend, C. (2012). The role of peer relationships in student academic and extracurricular engagement. In S. Christenson, A. Reschly, & C. Wylie (Eds.), Handbook of research on student engagement (pp. 387–401). New York, NY: Springer. New York, NY: Guilford Press.
Lam, C. B., McHale, S. M., & Crouter, A. C. (2014). Time with peers from middle childhood to late adolescence: Developmental course and adjustment correlates. Child Development, 85, 1677–1693. doi:10.1111/cdev.12235
Reinke, W., Stormont, M., Herman, K., Puri, R., & Goel, N. (2011). Supporting children’s mental health in schools: Teacher perceptions of needs, roles, and barriers. School Psychology Quarterly, 26, 433–449.
Steinberg, L., & Morris, A. S. (2000). Adolescent Development. Annual Review of Psychology, 52, 83–110. doi:10.1146/annurev.psych.52.1.83
Chapter 4: School
- School pressure
- Caring teachers
- Kind classmates
- School climate
- Conclusions
Schools
In addition to educating students, schools also influence their social-emotional health and well-being (Anderman, 2002; Kidger et al., 2012; McLaughlin, 2008). Students who have positive experiences at school are less likely to have mental health problems and engage in risk-taking behaviours than students who experience school negatively (McLaughlin, 2008). On the other hand, students who experience a negative school climate report lower self-confidence and lower self-esteem (King et al., 2002).
This chapter examines students’ experiences of pressure at school. In addition, it explores students’ relationships with school teachers and classmates.
In 2018, 1 in 5 grade 10 boys report feeling a lot of school pressure
Compared to those in the younger grades, more grade 10 boys report feeling a lot of school pressure. This pattern is found consistently from 1994 to 2018.
For example, in 2018, 21% of grade10 boys versus 6% of grade 6 boys report feeling a lot of school pressure.
From 2014 to 2018, the percentage of grade 10 boys reporting feeling a lot of school pressure has increased from 16% to 21%.
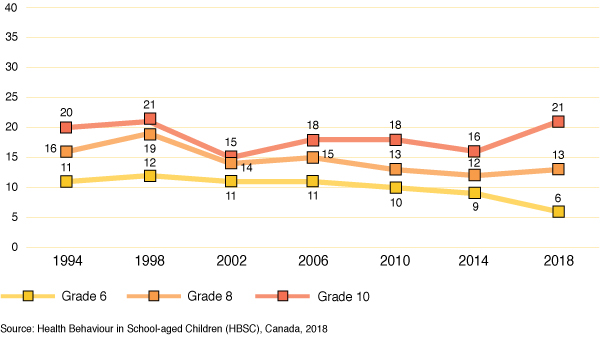
Figure 12 - Text description
| Year | Grade 6 | Grade 8 | Grade 10 |
|---|---|---|---|
| 1994 | 11 | 16 | 20 |
| 1998 | 12 | 19 | 21 |
| 2002 | 11 | 14 | 15 |
| 2006 | 11 | 15 | 18 |
| 2010 | 10 | 13 | 18 |
| 2014 | 9 | 12 | 16 |
| 2018 | 6 | 13 | 21 |
| Source: Health Behaviour in School-aged Children (HBSC), Canada, 2018 | |||
In 2018, 2 in 5 grade 10 girls report feeling a lot of school pressure
Compared to those in the younger grades, more grade 10 girls report feeling a lot of school pressure and this pattern is found consistently from 1994 to 2018.
For example, in 2018, 39% of grade 10 girls report feeling a lot of school pressure versus 8% of grade 6 girls.
For Grade 8 girls, and especially grade 10 girls, the proportion reporting that they feel a lot of pressure from school work increases dramatically between 2014 and 2018.
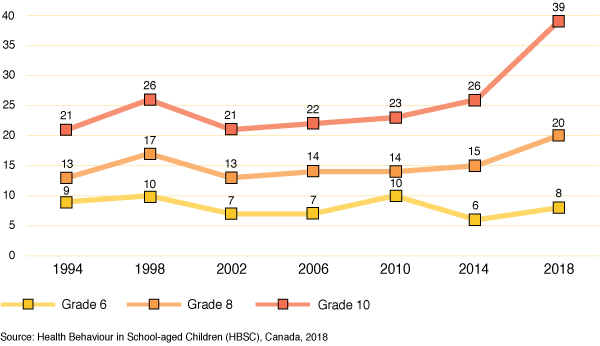
Figure 13 - Text description
| Year | Grade 6 | Grade 8 | Grade 10 |
|---|---|---|---|
| 1994 | 9 | 13 | 21 |
| 1998 | 10 | 17 | 26 |
| 2002 | 7 | 13 | 21 |
| 2006 | 7 | 14 | 22 |
| 2010 | 10 | 14 | 23 |
| 2014 | 6 | 15 | 26 |
| 2018 | 8 | 20 | 39 |
| Source: Health Behaviour in School-aged Children (HBSC), Canada, 2018 | |||
Students in higher grades are less likely to report that teachers care about them
In grade 6, 76% of girls report that teachers care about them versus 56% of girls in grade 10.
Similarly, 73% of grade 6 boys report that their teachers care about them versus 59% of grade 10 boys.
In grades 8, 9, and 10, boys are more likely than girls to report that teachers care about them.
Young people talked about the need to feel respect from teachers in order to feel supported. When students were asked what makes them feel supported at school they said:
“When teachers believe in you and know your strengths and weaknesses.”; “Teachers greeting us and saying hello.”; “Teachers that stand by you and respect you and talk to you.”
[Youth Workshop Group Reflections]
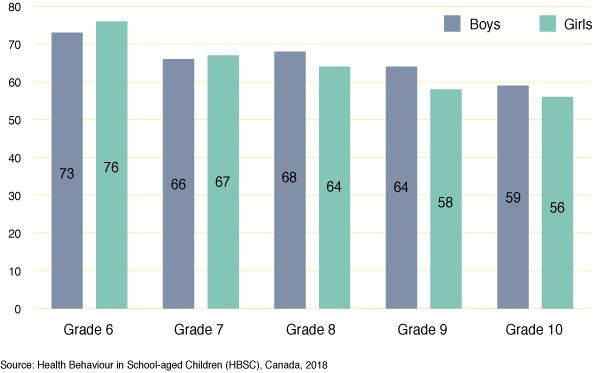
Figure 14 - Text description
| Grade | Boys | Girls |
|---|---|---|
| Grade 6 | 73 | 76 |
| Grade 7 | 66 | 67 |
| Grade 8 | 68 | 64 |
| Grade 9 | 64 | 58 |
| Grade 10 | 59 | 56 |
| Source: Health Behaviour in School-aged Children (HBSC), Canada, 2018 | ||
With increasing grade, students are less likely to report that other students are kind and helpful
65% of grade 6 boys versus 56% of grade 10 boys report that other students are kind and helpful.
64% of grade 6 girls versus 54% of grade 10 girls report that other students are kind and helpful.
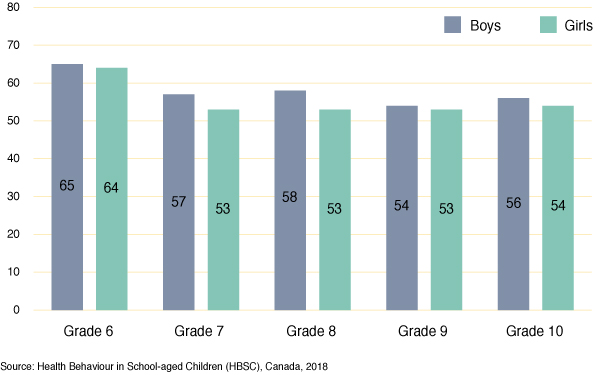
Figure 15 - Text description
| Grade | Boys | Girls |
|---|---|---|
| Grade 6 | 65 | 64 |
| Grade 7 | 57 | 53 |
| Grade 8 | 58 | 53 |
| Grade 9 | 54 | 53 |
| Grade 10 | 56 | 54 |
| Source: Health Behaviour in School-aged Children (HBSC), Canada, 2018 | ||
In the higher grades, fewer students report a positive school climate
School climate assesses students’ opinion of school (liking school, feeling a sense of belonging, feeling their school is a nice place to be and that the rules at school are fair).
The percentage of boys reporting a more positive school climate decreases from Grade 6 (57%) to Grade 9 (40%).
For girls, the drop in the percentage who report a more positive school climate is even greater than it is for boys, from 60% in Grade 6 to 31% in Grade 10.
In Grades 6 and 7, the percentage of girls and boys who report a positive school climate is similar, but by Grade 10, there are many fewer girls than boys who report a positive school climate.
“Teachers think that [older students] are more mature and don’t need as much help; trying to prepare [us] for the ‘real world’.”
[Youth Workshop Participant]
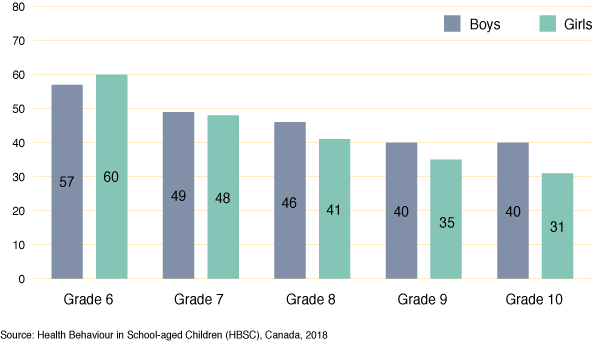
Figure 16 - Text description
| Grade | Boys | Girls |
|---|---|---|
| Grade 6 | 57 | 60 |
| Grade 7 | 49 | 48 |
| Grade 8 | 46 | 41 |
| Grade 9 | 40 | 35 |
| Grade 10 | 40 | 31 |
| Source: Health Behaviour in School-aged Children (HBSC), Canada, 2018 | ||
Conclusions
- It is concerning that the percentage of students reporting a lot of school pressure in grade 10 has increased over the past 4 years, particularly for girls.
- Grade 10 girls report more school pressure than boys and this trend is consistent over time.
- A cause for concern is that with increasing grade, fewer students are reporting that teachers care about them. While a majority of students still reported that teachers care about them, a decline in social support from teachers may have a negative impact on student mental health and well-being (Kidger et al., 2012).
- With increasing grade, fewer students are reporting that their peers are kind and helpful. This lack of support from peers may also have a negative impact on students’ well-being (Craig & Pepler, 2014).
- Support from schools and families may help students cope with feelings of school pressure (Craig & Pepler, 2014).
- With increasing grade, fewer students report experiencing a positive school climate. Having a positive school climate is related to increased academic performance and more positive social relationships (McLaughlin, 2008).
References
Anderman, E. M. (2002). School effects on psychological outcomes during adolescence. Journal of Educational Psychology, 94, 795–809.
Craig, W., & Pepler, D. (2014). Trends in Healthy Development and Healthy Relationships. Public Health Agency of Canada.
Kidger, J., Araya, R., Donovan, J., & Gunnell, D. (2012). The effect of the school environment on the emotional health of adolescents: A systematic review. Pediatrics, 129, 1–25.
King, K. A., Vidourek, R. A., Davis, B., & McClellan, W. (2002). Increasing self‐esteem and school connectedness through a multidimensional mentoring program. Journal of School Health, 72, 294–299.
McLaughlin, C. (2008). Emotional well-being and its relationship to schools and classrooms: A critical reflection. British Journal of Guidance and Counselling, 36, 353–366.
Chapter 5: Community
- Community support
- Neighbourhood trust
- Volunteering
- Conclusions
Communities
Communities refer to the neighbourhoods where young people live, play, and grow up. Groups and activities in which young people participate represent important parts of such communities. Together, these neighbourhoods and groups offer important benefits to health. A healthy community will provide support to young people in making good behavioural choices, and in educating them about decisions that enhance their health and well-being (Ellen, Mijanovich, & Dillman, 2001).
In this chapter, we examine young people’s perceptions of the supports that they receive in their communities, and the extent to which they trust the people in their neighbourhood. We also examine the proportions of young people who volunteer on a regular basis.
Perceived levels of community support decline with grade
Here we report on a scale that measures community support using five items that ask about the quality of social relationships, safety, trust, and community leisure spaces.
One-half or fewer students in each grade and gender group report a high level of community support.
Among both boys and girls, perceived levels of community support decline as grade increases. For example, 48% of grade 6 girls report a high level of community support versus 38% of grade 10 girls, a difference of 10 percentage points.
Overall, boys are more positive than girls about their level of community support. For example, in grade 10, 43% of boys report a high level of community support compared to 38% of girls.

Figure 17 - Text description
| Grade | Boys | Girls |
|---|---|---|
| Grade 6 | 50 | 48 |
| Grade 7 | 48 | 43 |
| Grade 8 | 45 | 41 |
| Grade 9 | 43 | 40 |
| Grade 10 | 43 | 38 |
| Source: Health Behaviour in School-aged Children (HBSC), Canada, 2018 | ||
Young people’s level of neighbourhood distrust is on the rise
Among both girls and boys, levels of distrust of the people in their neighbourhoods is low.
For example, in grade 10 boys, the proportion expressing distrust of the people in their community is one-fifth or less across the years.
However, among both girls and boys, levels of distrust in their community rise between 2002 and 2018.
For example, in grade 10 girls, the proportion expressing distrust of the people in their community rises from 9% in 2002 to 18% in 2018.
“If something isn’t right in your neighbourhood, you don’t feel like you belong there. Because I didn’t know a lot of people there it really wasn’t my space.”
[Youth Workshop Participant]
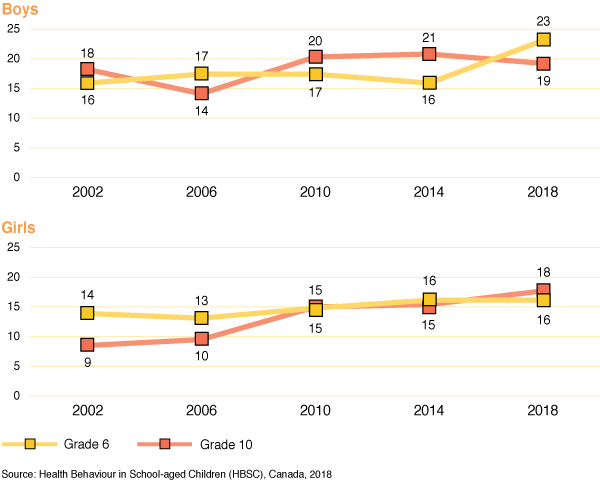
Figure 18 - Text description
Figure 18: Percentage of students who agree or strongly agree that people in the area where they live would try to take advantage of them if they got the chance, by grade, gender and year of survey
| Year | Grade 6 | Grade 10 |
|---|---|---|
| 2002 | 16 | 18 |
| 2006 | 17 | 14 |
| 2010 | 17 | 20 |
| 2014 | 16 | 21 |
| 2018 | 23 | 19 |
| Year | Grade 6 | Grade 10 |
|---|---|---|
| 2002 | 14 | 9 |
| 2006 | 13 | 10 |
| 2010 | 15 | 15 |
| 2014 | 16 | 15 |
| 2018 | 16 | 18 |
| Source: Health Behaviour in School-aged Children (HBSC), Canada, 2018 | ||
Girls get involved in volunteer work more than boys
In each of grades 6 to 10, more girls report involvement in volunteer work than do boys.
For example, in both grades 9 and 10, the percentage of girls who report volunteering is 57% versus 37% of boys.
In boys, proportions reporting involvement in volunteer work range from a low of 25% in grade 6 to a high of 37% in grades 9 and 10.
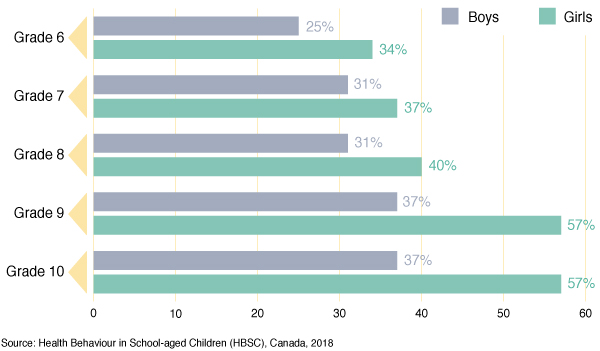
Figure 19 - Text description
| Grade | Boys | Girls |
|---|---|---|
| Grade 6 | 25 | 34 |
| Grade 7 | 31 | 37 |
| Grade 8 | 31 | 40 |
| Grade 9 | 37 | 57 |
| Grade 10 | 37 | 57 |
| Source: Health Behaviour in School-aged Children (HBSC), Canada, 2018 | ||
Conclusions
- It is concerning that less than one-half of young people feel high levels of support from the communities where they live.
- Increases in levels of neighbourhood distrust are noteworthy and should be monitored over time.
- In Canada, girls appear to be more likely to get involved in volunteer work, a prosocial behaviour.
References
Ellen, I. G., Mijanovich, T., & Dillman, K. N. (2001). Neighborhood effects on health: Exploring the links and assessing the evidence. Journal of Urban Affairs, 23, 391-408.
Chapter 6: Physical activity, screen time, and sleep
- Physical activity
- Screen time
- Sleep
- Conclusions
Movement behaviours
Movement ranges in intensity from vigorous exercise at the high end to sleep at the low end. Movement behaviours include physical activity (e.g., sports, outdoor play), sedentary behaviour (e.g., screen time), and sleep. For optimal health, the Canadian 24-hour Movement Guidelines (Tremblay et al., 2016) encourage youth to achieve high levels of physical activity, low levels of sedentary behaviour and recreational screen time, and sufficient sleep each day.
In this chapter, we describe the amount of time youth report that they spend engaged in physical activity, recreational screen time, and sleep. Collectively, we refer to such behaviours as “movement behaviours”.
Most young people are not participating in regular physical activity, and girls are participating less than boys
Among boys, the proportion who report being active for at least 60 minutes a day over the past seven days declines from 38% in grade 6 to 26% in grade 10.
Among girls, the proportion who report being active for at least 60 minutes a day over the past seven days declines from 30% in grade 6 to 13% in grade 10.
More boys than girls participate in regular physical activity at all grade levels.
Young people attribute the lower levels of engagement of girls in physical activity to a number of factors, including: (1) girls are often less comfortable engaging in activities in front of others; (2) girls often have less opportunities to engage in physical activities than do boys (for example, contact sports such as football, rugby or hockey), and (3) boys have more friends who engage in physical activities than do girls, and they also have more role models in sports to look up to.
[Youth Workshop Group Reflections]
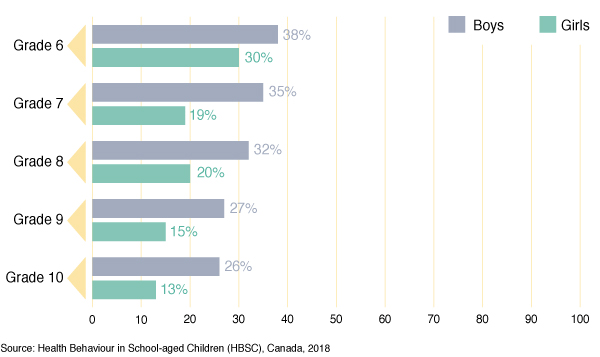
Figure 20 - Text description
| Grade | Boys | Girls |
|---|---|---|
| Grade 6 | 38 | 30 |
| Grade 7 | 35 | 19 |
| Grade 8 | 32 | 20 |
| Grade 9 | 27 | 15 |
| Grade 10 | 26 | 13 |
| Source: Health Behaviour in School-aged Children (HBSC), Canada, 2018 | ||
25% of young people report at least 60 minutes per day of moderate-to-vigorous intensity physical activity
Among students in grades 6 to 10, those reporting at least 60 minutes per day of moderate-to-vigorous intensity physical activity varied from 20% to 25% from 2002 to 2018.
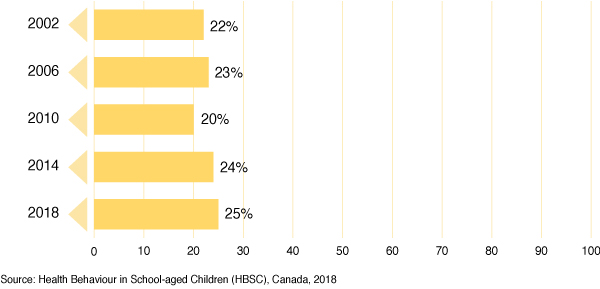
Figure 21 - Text description
| 2002 | 22 |
|---|---|
| 2006 | 23 |
| 2010 | 20 |
| 2014 | 24 |
| 2018 | 25 |
| Source: Health Behaviour in School-aged Children (HBSC), Canada, 2018 | |
Participation in organized sports is more common in boys, and declines by grade
Among boys, participation in organized sports declines from 76% in grade 6 to 63% in grade 10.
Among girls, this decline goes from 70% in grade 6 to 54% in grade 10.
Higher percentages of boys than girls report participating in a team-based organized sport.
Higher percentages of girls than boys report participating in an individual-based organized sport.
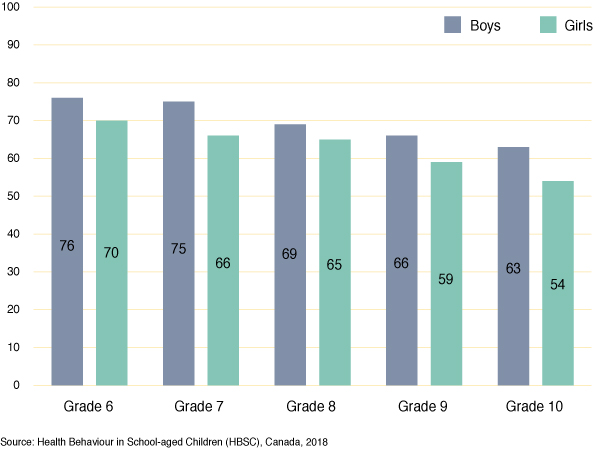
Figure 22 - Text description
| Grade | Boys | Girls |
|---|---|---|
| Grade 6 | 76 | 70 |
| Grade 7 | 75 | 66 |
| Grade 8 | 69 | 65 |
| Grade 9 | 66 | 59 |
| Grade 10 | 63 | 54 |
| Source: Health Behaviour in School-aged Children (HBSC), Canada, 2018 | ||
Active transportation to school
One-third or fewer students across all grades use active transportation to go to school in the morning and there is a general decline as grade increases.
Higher percentages of boys than girls report regularly walking or bicycling to school.
Higher proportions of students who report they take 15 minutes or less to get to school report that they use active transportation (36%) compared to those who took more than 15 minutes to get to school (12%).
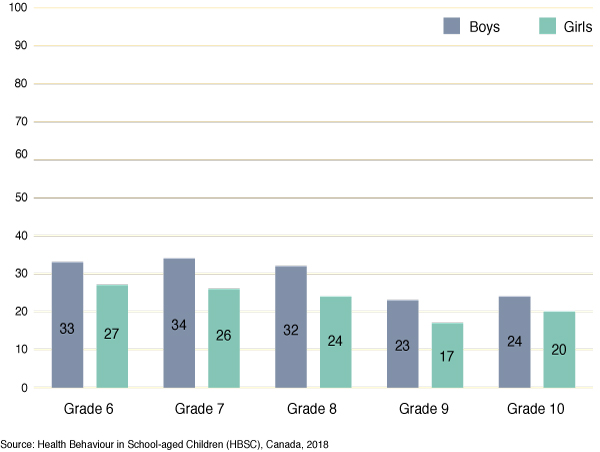
Figure 23 - Text description
| Grade | Boys | Girls |
|---|---|---|
| Grade 6 | 33 | 27 |
| Grade 7 | 34 | 26 |
| Grade 8 | 32 | 24 |
| Grade 9 | 23 | 17 |
| Grade 10 | 24 | 20 |
| Source: Health Behaviour in School-aged Children (HBSC), Canada, 2018 | ||
Screen time differs by grade and gender
In 2019, the Canadian Paediatric Society published new recommendations for screen time use in children that emphasized four “essential Ms”: managed, meaningful, modeled, and monitored (Ponti et al., 2019).
Among boys, average amounts of screen time increase from 4 hours and 19 minutes per day in grade 6, to 5 hours and 16 minutes in grade 10.
Among girls, screen time increases from 3 hours and 28 minutes per day in grade 6, to 4 hours and 33 minutes in grade 10.
Boys consistently report more screen time than girls.
Screen time increases from grade 6 to 10 in both boys and girls.
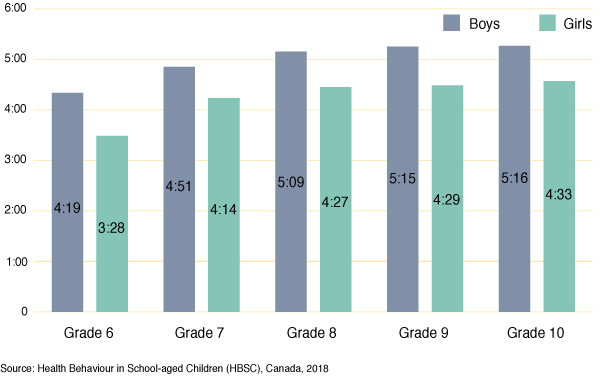
Figure 24 - Text description
| Grade | Boys | Girls |
|---|---|---|
| Grade 6 | 4:19 | 3:28 |
| Grade 7 | 4:51 | 4:14 |
| Grade 8 | 5:09 | 4:27 |
| Grade 9 | 5:15 | 4:29 |
| Grade 10 | 5:16 | 4:33 |
| Source: Health Behaviour in School-aged Children (HBSC), Canada, 2018 | ||
Sleep duration differs by grade but not by gender
The Canadian 24-hour Movement Guidelines (Tremblay et al., 2016) suggest that from ages 5 to 13, children require 9 to 11 hours of sleep per night. This recommendation changes to 8 to10 hours among those aged 14 to 17.
Among boys, average amounts of sleep drop from 9 hours and 24 minutes per night in grade 6, to 8 hours and 26 minutes in grade 10.
Among girls, average amounts of sleep drop from 9 hours and 34 minutes per night in grade 6, to 8 hours and 20 minutes in grade 10.
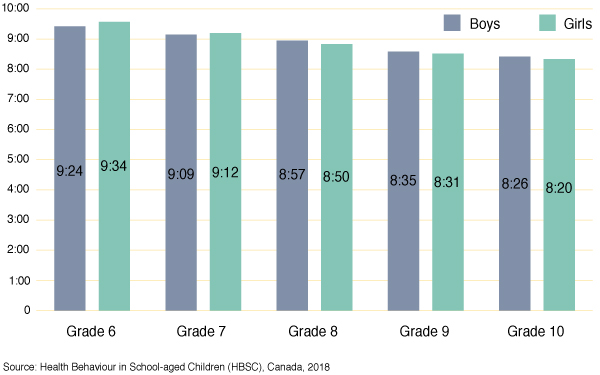
Figure 25 - Text description
| Grade | Boys | Girls |
|---|---|---|
| Grade 6 | 9:24 | 9:34 |
| Grade 7 | 9:09 | 9:12 |
| Grade 8 | 8:57 | 8:50 |
| Grade 9 | 8:35 | 8:31 |
| Grade 10 | 8:25 | 8:20 |
| Source: Health Behaviour in School-aged Children (HBSC), Canada, 2018 | ||
Conclusions
- The proportion of Canadian students in grades 6 to 10 that report participating in at least 60 minutes per day of moderate-to-vigorous intensity physical activity has not exceeded 25% from 2002 to 2018.
- The average levels of screen time reported by boys and girls at all grade levels far exceed the 2 hours per day of recreational screen time recommended in the Canadian 24-hour Movement Guidelines for Children and Youth.
- Most young people adhere to sleep recommendations in the Canadian 24-hour Movement Guidelines.
- One-third or fewer students across all grades use active transportation to go to school in the morning.
References
Ponti, M., & the Canadian Paediatric Society Digital Health Task Force (2019). Digital media: Promoting healthy screen use in school-aged children and adolescents. Retrieved from: https://www.cps.ca/en/documents/position/digital-media.
Tremblay, M. S., Carson, V., Chaput, J. P., Connor Gorber, S., Dinh, T., Duggan, M., ... & Janssen, I. (2016). Canadian 24-hour movement guidelines for children and youth: an integration of physical activity, sedentary behaviour, and sleep.Applied Physiology, Nutrition, and Metabolism, 41(6), S311-S327.
Chapter 7: Healthy eating
- Healthy and unhealthy foods
- Fast food
- Eating breakfast
- Hunger
- Conclusions
Healthy eating
Healthy eating is important for the healthy development of children and youth (Health Canada, 2019) and to reduce the risk of obesity later in life (Public Health Agency of Canada, 2012). Unhealthy eating behaviours that begin during adolescence may continue into adulthood, creating negative conditions for a wide variety of eating-related concerns (Vereecken, 2005). Where and when young people eat, or not, can have a great influence on their body weight and other related nutritional and mental health outcomes. Food insecurity can also have a bearing on their eating habits (Kirkpatrick et al., 2015).
This chapter describes the foods that young people eat, and behaviours and practices that may influence their nutrition. These include the frequency of eating at fast food restaurants and skipping breakfast. The frequency of going to school or bed hungry due to not having enough food in the home is also presented.
The dietary habits of young Canadians are improving
From 2002 to 2018, the proportion of young people reporting daily consumption of fruits increases from 38% to 52%.
Daily consumption of vegetables increases from 42% to 54% over the same time period.
Daily consumption of sweets decreases from 23% to 16% from 2002 to 2018.
Daily consumption of soft drinks decreases from 22% to 6% in the same time period.
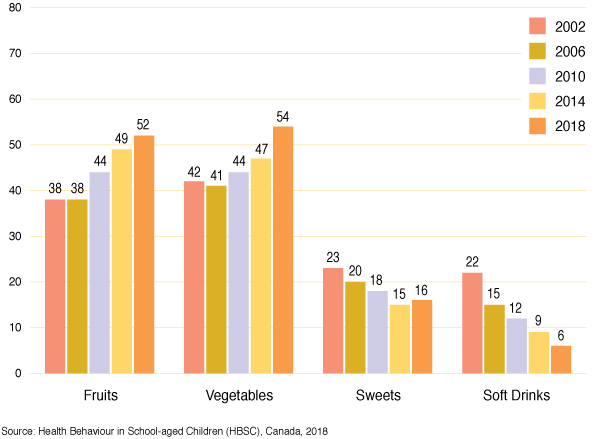
Figure 26 - Text description
| Types of food | 2002 | 2006 | 2010 | 2014 | 2018 |
|---|---|---|---|---|---|
| Fruits | 38 | 38 | 44 | 49 | 52 |
| Vegetables | 42 | 41 | 44 | 47 | 54 |
| Sweets | 23 | 20 | 18 | 15 | 16 |
| Soft Drinks | 22 | 15 | 12 | 9 | 6 |
| Source: Health Behaviour in School-aged Children (HBSC), Canada, 2018 | |||||
Fast food consumption occurs more often in higher grades
Weekly consumption of food in a fast food restaurant increases as young people grow older.
For example, 18% of grade 6 boys, 22% of grade 8 boys, and 34% of grade 10 boys report eating fast food at least once per week.
In girls, the proportion reporting fast food consumption is slightly less than boys, in grades 6 to 9.
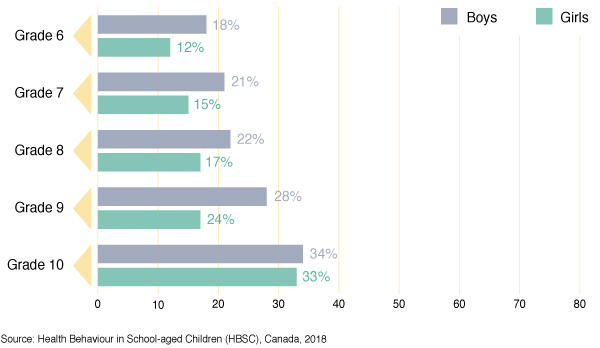
Figure 27 - Text description
| Grade | Boys | Girls |
|---|---|---|
| Grade 6 | 18 | 12 |
| Grade 7 | 21 | 15 |
| Grade 8 | 22 | 17 |
| Grade 9 | 28 | 24 |
| Grade 10 | 34 | 33 |
| Source: Health Behaviour in School-aged Children (HBSC), Canada, 2018 | ||
Breakfast consumption patterns vary by grade and gender
In boys, proportions reporting that they usually consume breakfast decline from 76% in grade 6, to 59% in grade 10.
In girls, these proportions drop from a high of 70% in grade 6, to a low of 43% in grade 10.
Breakfast consumption is more common among boys than girls in all grades.
There are lots of factors involved in skipping breakfast, including the need to get ready, finishing homework and the time required to travel to school.
[Youth Workshop Group Reflections]

Figure 28 - Text description
| Grade | Boys | Girls |
|---|---|---|
| Grade 6 | 76 | 70 |
| Grade 7 | 66 | 58 |
| Grade 8 | 64 | 51 |
| Grade 9 | 60 | 45 |
| Grade 10 | 59 | 43 |
| Source: Health Behaviour in School-aged Children (HBSC), Canada, 2018 | ||
Hunger is experienced by many young Canadians
In all grade levels and for both genders, 2 to 4% of students report often or always going to school or bed hungry because there is not enough food at home.
A further 11 to 17% report that they sometimes experience such hunger.
There is no consistent pattern in the occurrence of hunger by gender or grade.
Young people talked about how expensive it can be to eat healthy, especially in more northern and remote communities, and how this can be a barrier to eating healthy.
[Youth Workshop Group Reflections]

Figure 29 - Text description
| Grade | Gender | Sometimes | Often or always |
|---|---|---|---|
| Grade 6 | Boys | 16 | 3 |
| Girls | 14 | 4 | |
| Grade 7 | Boys | 15 | 3 |
| Girls | 17 | 2 | |
| Grade 8 | Boys | 14 | 3 |
| Girls | 11 | 3 | |
| Grade 9 | Boys | 13 | 3 |
| Girls | 12 | 2 | |
| Grade 10 | Boys | 12 | 4 |
| Girls | 15 | 2 | |
| Source: Health Behaviour in School-aged Children (HBSC), Canada, 2018 | |||
Conclusions
- The proportion of young people reporting daily consumption of fruits and vegetables continues to increase, while the proportion reporting consumption of unhealthy foods such as sweets and soft drinks continues to decline.
- Despite this positive trend, one-third of grade 10 boys and girls report eating in a fast food restaurant at least on a weekly basis.
- Although not eating breakfast is associated with increased risk of nutritional inadequacies and poorer cognition, daily breakfast eating declines dramatically in the older grades.
- Up to 1 in 5 young people report going to school or bed hungry at least sometimes because there is not enough food at home. For 2-4% this occurs often or always. There are many possible explanations for this hunger, but it remains an important concern affecting the health and academic success of young people.
References
Health Canada. (2019). Eating well with Canada’s Food Guide. Retrieved from https://food-guide.canada.ca/en/
Kirkpatrick, S. I., Dodd, K. W., Parsons, R., Ng, C., Garriguet, D., & Tarasuk, V. (2015). Household food insecurity is a stronger marker of adequacy of nutrient intakes among Canadian compared to American youth and adults. The Journal of Nutrition, 145(7), 1596-1603.
Public Health Agency of Canada [PHAC]. (2012). Curbing childhood obesity: A federal, provincial and territorial framework for action to promote healthy weights. Retrieved from https://www.canada.ca/content/dam/phac-aspc/migration/phac-aspc/hp-ps/hl-mvs/framework-cadre/pdf/ccofw-eng.pdf
Vereecken, C. A., Inchley, J., Subramanian, S. V., Hublet, A., & Maes, L. (2005). The relative influence of individual and contextual socio-economic status on consumption of fruit and soft drinks among adolescents in Europe. The European Journal of Public Health, 15(3), 224-232.
Chapter 8: Healthy weights
- Overweight and obesity
- Weight-based teasing
- Body image
- Conclusions
Healthy weights
A healthy weight is a weight that is appropriate for a person’s height and promotes good health and well-being. Simply defined, the terms overweight and obesity represent a state where an individual has excess body weight and fat to the extent that it affects his or her health in a negative way (World Health Organization, 1998). Body weight issues, and the behaviours and stigmas to which young people are subject, due to perceptions of the look of their bodies, are also major adolescent health concerns among young people (Puhl & Suh, 2015).
In this chapter, we report on overweight and obesity, weight-based teasing (body shaming) and body image. Overweight and obesity were determined using body mass index (BMI) based on self-reported height and weight. Height and weight measurements were not taken as part of the survey.
1 in 4 boys in Canada have a BMI categorized as obese or overweight
In grades 6 to 10, between 7% and 14% of boys have a BMI categorized as obese.
By grade, between 16% and 20% of boys have a BMI categorized as overweight.
Among boys, obesity peaks in grade 7, then declines as they enter the high school years.
Among boys, the prevalence of overweight remains relatively stable by grade level.
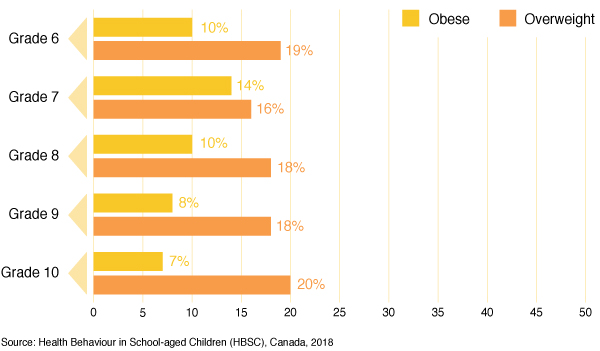
Figure 30 - Text description
| Grade | Obese | Overweight |
|---|---|---|
| Grade 6 | 10 | 19 |
| Grade 7 | 14 | 16 |
| Grade 8 | 10 | 18 |
| Grade 9 | 8 | 18 |
| Grade 10 | 7 | 20 |
| Source: Health Behaviour in School-aged Children (HBSC), Canada, 2018 | ||
Overweight and obesity remain common in girls
By grade, between 5% and 7% of girls have a BMI categorized as obese.
By grade, between 13% and 18% of girls have a BMI categorized as overweight.
Overall prevalence of obesity, based on self-reported heights and weights, are lower among girls than boys.
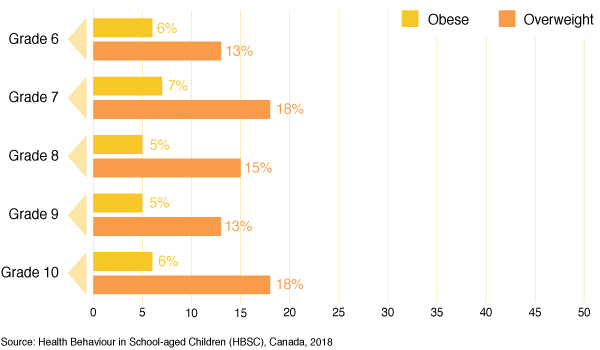
Figure 31 - Text description
| Grade | Obese | Overweight |
|---|---|---|
| Grade 6 | 6 | 13 |
| Grade 7 | 7 | 18 |
| Grade 8 | 5 | 15 |
| Grade 9 | 5 | 13 |
| Grade 10 | 6 | 18 |
| Source: Health Behaviour in School-aged Children (HBSC), Canada, 2018 | ||
Percentages of students with a BMI categorized as overweight and obese have not changed much over time
Among boys in grades 6 to 10 combined, the prevalence of obesity ranged from 9% to 11% and overweight ranged from 18% to 22% between 2002 and 2018.
Among girls, the prevalence of obesity ranged from 5% to 7% and overweight ranged from 13% to 16% between 2002 and 2018.
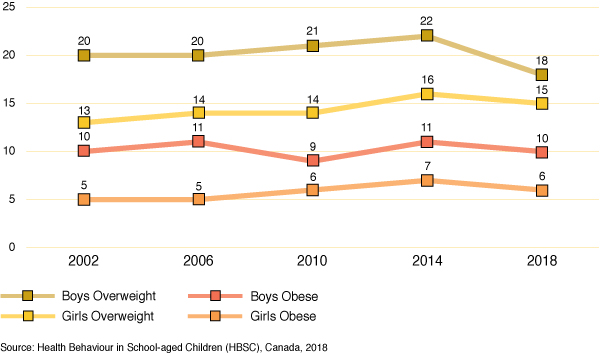
Figure 32 - Text description
| Year | Boys Overweight | Boys Obese | Girls Overweight | Girls Obese |
|---|---|---|---|---|
| 2002 | 20 | 10 | 13 | 5 |
| 2006 | 20 | 11 | 14 | 5 |
| 2010 | 21 | 9 | 14 | 6 |
| 2014 | 22 | 11 | 16 | 7 |
| 2018 | 18 | 10 | 15 | 6 |
| Source: Health Behaviour in School-aged Children (HBSC), Canada, 2018 | ||||
Body shaming is experienced by almost 1 in 10 young people
Among boys, the prevalence of reported weight-based teasing varies from 5% to 9% by grade level.
Among girls, the prevalence of reported weight-based teasing varies from 6% to 10% by grade level.

Figure 33 - Text description
| Grade | Boys | Girls |
|---|---|---|
| Grade 6 | 5 | 6 |
| Grade 7 | 9 | 10 |
| Grade 8 | 8 | 9 |
| Grade 9 | 9 | 7 |
| Grade 10 | 6 | 8 |
| Source: Health Behaviour in School-aged Children (HBSC), Canada, 2018 | ||
Up to 1 in 3 young people perceive that their body is “too fat”
In general, girls report that they perceive their body to be “too fat” more often than boys.
Among boys, the percentage that perceive their body as being “too fat” ranges from 18% to 25% by grade level.
Among girls, the percentage that perceive their body as being “too fat” rises from 19% in grade 6 to 34% in grade 10.
“Boys are told by social media and society that they should be “buff”, but naturally in grades 6 to 10 they are often skinny. Girls are told that they should have a “perfect hour glass figure”.
[Youth Workshop Participant]
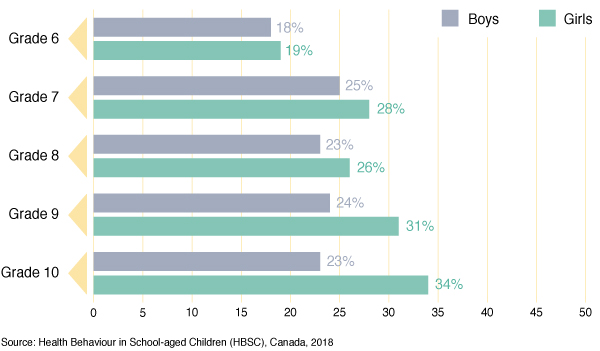
Figure 34 - Text description
| Grade | Boys | Girls |
|---|---|---|
| Grade 6 | 18 | 19 |
| Grade 7 | 25 | 28 |
| Grade 8 | 23 | 26 |
| Grade 9 | 24 | 31 |
| Grade 10 | 23 | 34 |
| Source: Health Behaviour in School-aged Children (HBSC), Canada, 2018 | ||
Many other young people perceive that their body is “too thin”
Among boys, the proportion that perceive their body as being “too thin” rises from 14% in grade 6 to 20% in grades 9 and 10.
Among girls, the proportion that perceive their body as being “too thin” varies from 9% to 11%.
In all grade levels, more boys than girls perceive their body as being “too thin”.
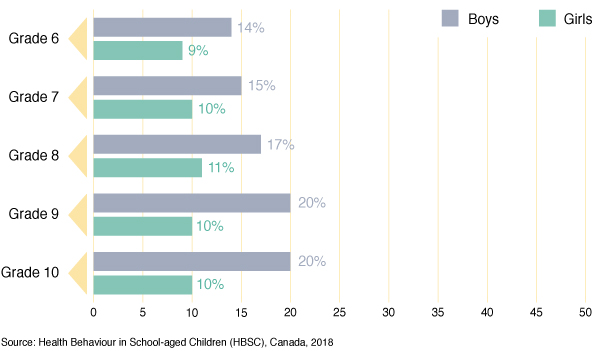
Figure 35 - Text description
| Grade | Boys | Girls |
|---|---|---|
| Grade 6 | 14 | 9 |
| Grade 7 | 15 | 10 |
| Grade 8 | 17 | 11 |
| Grade 9 | 20 | 10 |
| Grade 10 | 20 | 10 |
| Source: Health Behaviour in School-aged Children (HBSC), Canada, 2018 | ||
Conclusions
- Between 7% to 14% of boys, and 5% to 7% of girls, have obesity.
- Between 16% to 20% of boys, and 13% to 18% of girls, are overweight.
- Between 2002 and 2018, percentages of students with a BMI categorized as overweight and obese have not changed much in young Canadians.
- Body shaming (being teased because of their weight) is reported by 5% to 10% of young people.
- A greater percentage of girls than boys think that their body is “too fat”, whereas a greater percentage of boys than girls think that their body is “too thin”, illustrating the complex social pressure faced by young people with respect to their body image.
References
Puhl, R., & Suh, Y. (2015). Health consequences of weight stigma: implications for obesity prevention and treatment. Current obesity reports, 4(2), 182-190.
World Health Organization. (1998). Obesity: Preventing and Managing the Global Epidemic (Vol. [WHO/NUT/ NCD/98.1.1998]). Geneva: Report of a WHO Consultation on Obesity.
Chapter 9: Injury and concussions
- Medically treated injuries
- Serious injuries
- Where injuries happen
- Concussion
- Conclusions
Injuries
Injuries are the leading cause of death in Canadian children over the age of one (Public Health Agency of Canada, 2018). Youth injury has an enormous impact on Canadian society in terms of premature mortality, person years of life lost, inpatient and outpatient medical treatment, disability, and loss from productive activities for both youth and the adults who care for them when they are injured (Parachute, 2015). In addition, concussions have emerged as a major health issue in recent years, as awareness of their importance to the health of young people has grown.
This chapter describes how frequently young people report the occurrence of medically treated injuries. The vast majority of these are unintentional injuries, but HBSC does capture some injury events with intentional causes. It examines trends in the occurrence of more serious injuries over time, and where these more serious injuries occurred. Finally, it examines novel data on the occurrence of concussions that has not been available in past cycles of HBSC.
Injuries requiring medical treatment by a doctor or nurse represent a substantial burden
In boys, proportions reporting one or more medically treated injuries in the last 12 months range from 51% to 53%.
In girls, these proportions range from 43% to 49%.
Boys report injuries more often than girls in all grades.
There is no clear difference in injury prevalence reported by grade.
Boys have more contact sports options than girls, and these provide more opportunities to get injured. Most girls don’t play tackle football, rugby, or hockey; activities that are associated with a higher risk for injury.
[Youth Workshop Group Reflections]
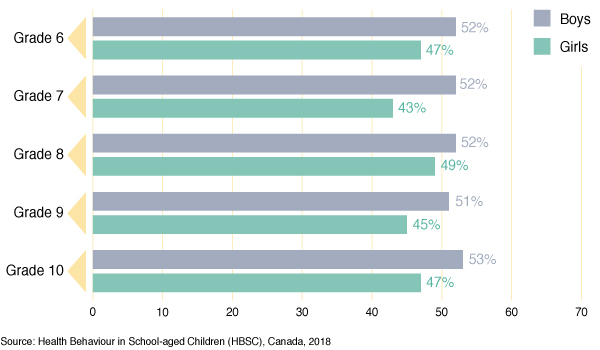
Figure 36 - Text description
| Grade | Boys | Girls |
|---|---|---|
| Grade 6 | 52 | 47 |
| Grade 7 | 52 | 43 |
| Grade 8 | 52 | 49 |
| Grade 9 | 51 | 45 |
| Grade 10 | 53 | 47 |
| Source: Health Behaviour in School-aged Children (HBSC), Canada, 2018 | ||
Reports of serious injuries are stable or increasing over time
Serious injuries are those requiring a cast, stitches, an operation, or an overnight hospital stay.
Higher proportions of boys report serious injuries than girls in all grade levels.
Among girls, the proportion reporting serious injuries over time increases, while these trends are less consistent for boys.
The differences in the reporting of injury by gender are similar for all grade levels; grade 6 and 10 data are provided to illustrate these patterns.

Figure 37 - Text description
| Year | Grade 6 Boys | Grade 6 Girls | Grade 10 Boys | Grade 10 Girls |
|---|---|---|---|---|
| 2006 | 18 | 10 | 19 | 13 |
| 2010 | 18 | 15 | 22 | 13 |
| 2014 | 19 | 16 | 22 | 14 |
| 2018 | 21 | 18 | 21 | 16 |
| Source: Health Behaviour in School-aged Children (HBSC), Canada, 2018 | ||||
Serious injuries most commonly occur in three locations
The majority of injuries (78% of boys, 79% of girls) are experienced in one of three locations: sports facilities, schools, and homes or yards.
Children in the younger grades are more likely to experience serious injuries in home locations, while the locations for incurrence of injury for older children are much more diverse.

Figure 38 - Text description
| Location of serious injury | Boys | Girls |
|---|---|---|
| Sports facilities | 34 | 31 |
| Schools | 22 | 21 |
| Home or yard | 22 | 27 |
| Streets, roads and parking lots | 5 | 4 |
| Other | 17 | 18 |
| Source: Health Behaviour in School-aged Children (HBSC), Canada, 2018 | ||
About 1 in 10 young Canadians have experienced a concussion in the past year
In boys, between 10 and 14% of students report experiencing a concussion in the past 12 months.
In girls, these proportions range from 7% to 12% across the grades.
The majority of these concussions (59.1%) occur while participating in sports.
There is no clear increase or decrease in concussion prevalence reported by grade.
It was concerning to some young people that they may report concussion-like symptoms to adults, but they may be ignored by people other than their parents. Those who had experienced concussion-like symptoms reported that their parents generally viewed them “very seriously”, but coaches and team-mates did not.
[Youth Workshop Group Reflections]
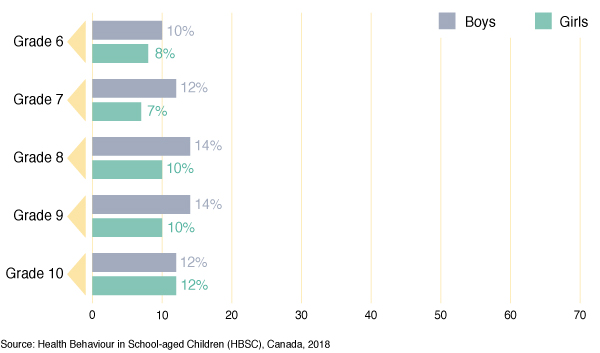
Figure 39 - Text description
| Grade | Boys | Girls |
|---|---|---|
| Grade 6 | 10 | 8 |
| Grade 7 | 12 | 7 |
| Grade 8 | 14 | 10 |
| Grade 9 | 14 | 10 |
| Grade 10 | 12 | 12 |
| Source: Health Behaviour in School-aged Children (HBSC), Canada, 2018 | ||
Conclusions
- Injuries happen frequently, and result in an enormous burden in terms of the costs of treatment, lost time and potential, and disability (Parachute, 2015).
- Boys consistently report the occurrence of medically treated injuries and serious injuries more often than do girls.
- Three types of locations (sports facilities, schools, and homes) are associated with 4 out of every 5 serious injuries that occur. This may provide direction for the targeting of interventions.
- About 1 in 10 Canadian youth report that they were diagnosed with a concussion in the past year, with most of these concussions occurring while participating in sports.
References
Parachute. (2015). The cost of injury in Canada. Retrieved from https://parachute.ca/en/professional-resource/cost-of-injury-report/
Public Health Agency of Canada. (2018). Facts on Injury. Retrieved from https://www.canada.ca/en/public-health/services/injury-prevention/facts-on-injury.html
Chapter 10: Bullying and teen dating violence
- Involvement in bullying
- Trends of the involvement in bullying
- Sexual and cyber-victimization
- Sexual and cyber-perpetration
- Physical, psychological, and cyber
teen dating victimization - Physical, psychological, and cyber teen dating perpetration
- Conclusions
Bullying and teen dating violence
Bullying is repeated and targeted aggression within a relationship in which one person has greater power than the other person. Bullying is a destructive relationship that is characterized by disrespect. Children who bully are learning to use power and aggression to control and distress others. Children who are victimized become increasingly powerless; they find themselves trapped in relationships in which they are being abused.
Teen dating violence also involves the combination of power and aggression and can take the form of physical, emotional, psychological, or cyber-violence. Although sexual violence is recognized as an important aspect of teen dating violence, it was not assessed in the HBSC study.
For both bullying and teen dating violence, there are negative long term physical and mental health effects (Wolke & Lereya, 2015).
In this chapter we examine young people’s reports of bullying and teen dating violence, two forms of an abuse of power within peer relationships.
Approximately one in three girls report being bullied
In general, more girls report being bullied than boys at all grades. For example, 25% of boys in grade 6 report being bullied compared to 31% of girls.
For both boys and girls the lowest percentages of students who report being bullied are in grade 10, 22% of boys and 26% of girls.
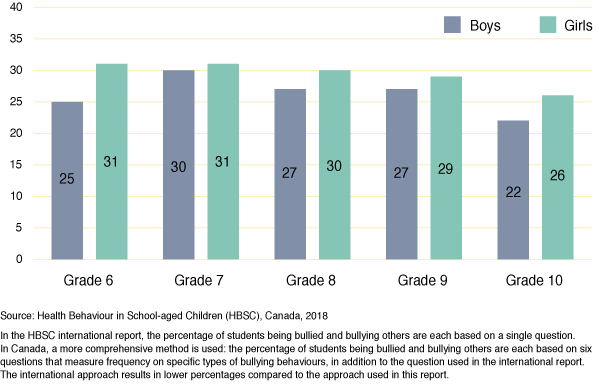
Figure 40 - Text description
| Grade | Boys | Girls |
|---|---|---|
| Grade 6 | 25 | 31 |
| Grade 7 | 30 | 31 |
| Grade 8 | 27 | 30 |
| Grade 9 | 27 | 29 |
| Grade 10 | 22 | 26 |
| Source: Health Behaviour in School-aged Children (HBSC),
Canada, 2018. In the HBSC international report, the percentage of students being bullied and bullying others are each based on a single question. In Canada, a more comprehensive method is used: the percentage of students being bullied and bullying others are each based on six questions that measure frequency on specific types of bullying behaviours, in addition to the question used in the international report. The international approach results in lower percentages compared to the approach used in this report. |
||
More boys than girls report bullying others
In all grades, more boys than girls report bullying others. For example, 15% of boys in grade 6 report bullying others compared to 10% of girls.
For boys, the percentage of students who report bullying others increases from grade 6 to grade 10, from 15% to 23%.
Some young people were surprised by the statistics. They thought that bullying rates would be higher than reported and questioned whether students might not be candid in answering whether they had bullied others or had been bullied.
[Youth Workshop Group Reflections]

Figure 41 - Text description
| Grade | Boys | Girls |
|---|---|---|
| Grade 6 | 15 | 10 |
| Grade 7 | 15 | 10 |
| Grade 8 | 21 | 12 |
| Grade 9 | 20 | 10 |
| Grade 10 | 23 | 11 |
| Source: Health Behaviour in School-aged Children (HBSC), Canada, 2018 | ||
More boys than girls report bullying others and being bullied
More boys than girls report both bullying others and being bullied in grades 7 through 10. For example, 12% of boys in grade 8 report both behaviours versus 7% of girls.
In general, the percentages of students who report bullying others and being bullied is fairly consistent across the grades for both boys and girls. The lone exception is the lower percentage for grade 6 boys compared to the older grades.

Figure 42 - Text description
| Grade | Boys | Girls |
|---|---|---|
| Grade 6 | 8 | 7 |
| Grade 7 | 10 | 6 |
| Grade 8 | 12 | 7 |
| Grade 9 | 12 | 6 |
| Grade 10 | 11 | 6 |
| Source: Health Behaviour in School-aged Children (HBSC), Canada, 2018 | ||
Percentages of students who report being bullied and bullying others are relatively stable over time
The percentages of students who report being bullied, bullying others and being both victims and bullies have been relatively stable over the past 12 years. The notable exception is lower percentages of both bullying perpetration and being both a bully and a victim were lower in 2014 compared to 2018.
A lot of young people felt that bullying will likely never go away because it’s an evolving problem and cyber-bullying is hard to catch and address.
[Youth Workshop Group Reflections]
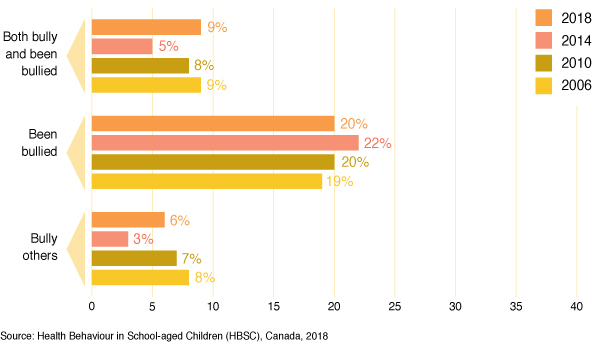
Figure 43 - Text description
| Involvement in bullying | 2018 | 2014 | 2010 | 2006 |
|---|---|---|---|---|
| Both bully and been bullied | 9 | 5 | 8 | 9 |
| Been bullied | 20 | 22 | 20 | 19 |
| Bully others | 6 | 3 | 7 | 8 |
| Source: Health Behaviour in School-aged Children (HBSC), Canada, 2018 | ||||
Verbal bullying is more often reported than physical bullying
More boys than girls report being bullied physically with the exception of grade 6.
9% of boys in grade 6 and 9% of girls in grade 6 report being bullied physically.
Similar percentages of boys and girls report being verbally bullied.
12% of boys and 14% of girls report being verbally bullied in grade 10.
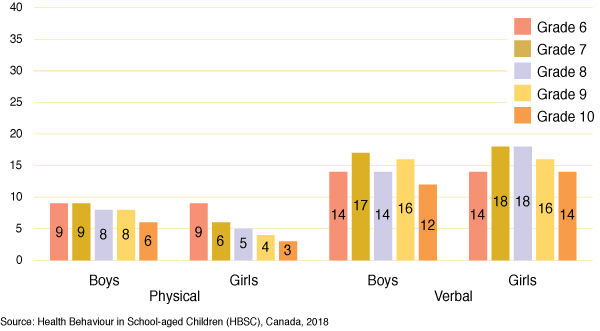
Figure 44 - Text description
| Physical and verbal bullying, by gender | Grade 6 | Grade 7 | Grade 8 | Grade 9 | Grade 10 | |
|---|---|---|---|---|---|---|
| Physical | Boys | 9 | 9 | 8 | 8 | 6 |
| Girls | 9 | 6 | 5 | 4 | 3 | |
| Verbal | Boys | 14 | 17 | 14 | 16 | 12 |
| Girls | 14 | 18 | 18 | 16 | 14 | |
| Source: Health Behaviour in School-aged Children (HBSC), Canada, 2018 | ||||||
More boys than girls report bullying others physically and verbally
With increasing grade, more boys report verbally bullying others.
For example, 6% of grade 6 boys report verbally bullying others versus 13% of grade 10 boys.
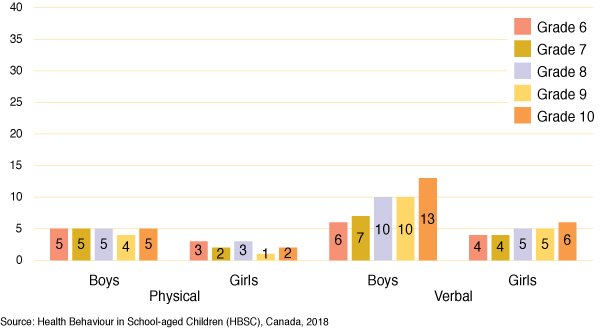
Figure 45 - Text description
| Physical and verbal bullying, by gender | Grade 6 | Grade 7 | Grade 8 | Grade 9 | Grade 10 | |
|---|---|---|---|---|---|---|
| Physical | Boys | 5 | 5 | 5 | 4 | 5 |
| Girls | 3 | 2 | 3 | 1 | 2 | |
| Verbal | Boys | 6 | 7 | 10 | 10 | 13 |
| Girls | 4 | 4 | 5 | 5 | 6 | |
| Source: Health Behaviour in School-aged Children (HBSC), Canada, 2018 | ||||||
Girls are more likely to report being cyber-victimized and boys are more likely to report cyber-bullying others
“[Cyber-bullying is a] lot more scary because people are more likely to say stuff over social media than to your face; ‘keyboard warriors’.”
[Youth Workshop Participant]
Girls are more likely to report being cyber-victimized than boys.
For example, 16% of girls in grade 10 and 9% of boys in grade 10 report being cyber-victimized.
With increasing grade, more boys report cyber-bullying others than girls.
9% of boys and 5% of girls report cyber-bullying others in grade 10.
Young people commented on the effects of cyber-bullying and how easy it is to bully people online because of the anonymity and being removed from the situation. They felt like this was something that is going to continue to increase over time.
[Youth Workshop Group Reflections]
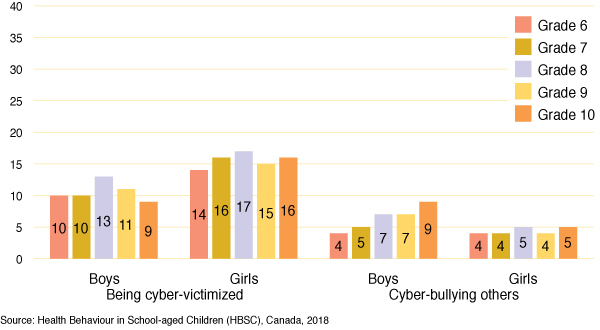
Figure 46 - Text description
| Being cyber-victimized and cyber-bulleying others, by gender | Grade 6 | Grade 7 | Grade 8 | Grade 9 | Grade 10 | |
|---|---|---|---|---|---|---|
| Being cyber-victimized | Boys | 10 | 10 | 13 | 11 | 9 |
| Girls | 14 | 16 | 17 | 15 | 16 | |
| Cyber-bullying others | Boys | 4 | 5 | 7 | 7 | 9 |
| Girls | 4 | 4 | 5 | 4 | 5 | |
| Source: Health Behaviour in School-aged Children (HBSC), Canada, 2018 | ||||||
Girls report more dating violence victimization than boys
A high proportion of students in grades 9 and 10 report being victimized in their dating relationships, versus significantly fewer reporting perpetrating the dating violence.
40% of grade 10 girls compared to 32% of grade 10 boys.
Boys and girls are equally likely to report perpetrating dating violence, 14% of grade 9 girls and 12% of grade 9 boys.
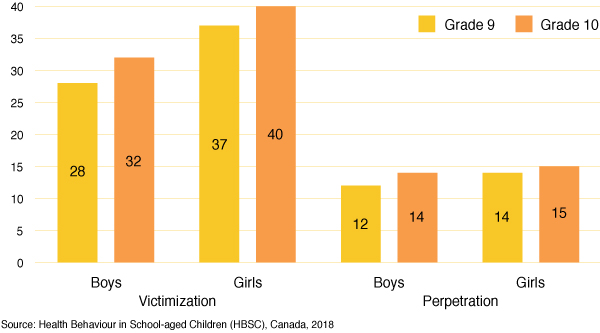
Figure 47 - Text description
| Victimization and perpetration, by gender | Grade 9 | Grade 10 | |
|---|---|---|---|
| Victimization | Boys | 28 | 32 |
| Girls | 37 | 40 | |
| Perpetration | Boys | 12 | 14 |
| Girls | 14 | 15 | |
| Source: Health Behaviour in School-aged Children (HBSC), Canada, 2018 | |||
Girls are more likely to report emotional and cyber-victimization than boys in teen dating relationships
A greater percentage of students reported cyber- and emotional victimization than physical victimization in teen dating relationships.
For example, 19% of boys in grade 9 and 34% of girls in grade 10 report emotional teen dating violence victimization.
17% of boys and 20% of girls report being cyber-victimized by their dating partner in grade 10.
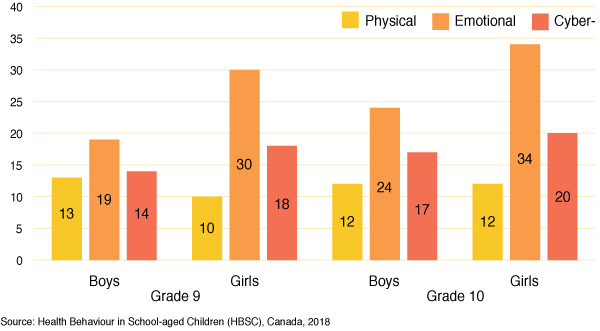
Figure 48 - Text description
| Grade, gender | Physical | Emotional | Cyber- | |
|---|---|---|---|---|
| Grade 9 | Boys | 13 | 19 | 14 |
| Girls | 10 | 30 | 18 | |
| Grade 10 | Boys | 12 | 24 | 17 |
| Girls | 12 | 34 | 20 | |
| Source: Health Behaviour in School-aged Children (HBSC), Canada, 2018 | ||||
Conclusions
- Prevalence of bullying victimization has remained relatively stable over the past 12 years. There is a similar trend for bullying perpetration with the exception of 2014 when the prevalence was considerably lower.
- In general, more girls report being bullied, and more boys report bullying others. The percentage of students who report bullying others increases with grade for boys.
- Boys and girls both report higher prevalence of being verbally bullied and being victims of cyber-bullying than being physically bullied.
- Students who understand what is a healthy relationship; how to engage in a healthy relationship and how to develop strategies for seeking support if they are bullied in their romantic relationships tend to experience less bullying (Craig & Pepler, 2014).
- About 1 in 7 students in grades 9 and 10 report perpetrating teen dating violence. Developing healthy relationship skills may help support youth to engage in healthy romantic relationships (Craig & Pepler, 2014).
- Many students experience aggression through the abuse of power in their peer and romantic relationships. The development of intervention and prevention programs to prevent future abuse can contribute to supporting healthy development (Vagi et al., 2013).
References
Craig, W., & Pepler, D. (2014). Trends in Healthy Development and Healthy Relationships. Public Health Agency of Canada.
Vagi, K. J., Rothman, E. F., Latzman, N. E., Tharp, A. T., Hall, D. M., & Breiding, M. J. (2013). Beyond correlates: A review of risk and protective factors for adolescent dating violence perpetration. Journal of Youth and Adolescence, 42, 633-649.
Wolke, D., & Lereya, S. T. (2015). Long-term effects of bullying. Archives of Disease in Childhood, 100(9), 879-885. doi:10.1136/archdischild-2014-306667
Chapter 11: Mental health
- Sad and hopeless
- Lonely
- Nervous
- Health complaints
- Confidence
- Life satisfaction
- Conclusions
Mental health
Canadian youth who experience mental health problems often have difficulties adjusting at home (Buote, 2009), struggle academically, and experience social difficulties at school (Mychailyszyn, Mendez, & Kendall, 2010). Students struggling with their mental health are less engaged in the classroom, have lower levels of academic performance and achievement (Owens, Stevenson, & Hadwin, 2012), and are more likely to drop out of school (Meldrum, Venn & Kutcher, 2009). Mental health problems that emerge during school-age years can persist and lead to adverse outcomes throughout one’s lifespan (Waddell, Shepherd, Chen, & Boyle, 2013).
This chapter examines students’ mental health and life satisfaction.
Young people identified the things that define positive and negative mental health for them:
“Quality mental health and wellness is.... Self-care, keeping in touch with the land, self-respect, knowing you are capable, respect, talking about your problems with family and friends, resilience training, confidence, caring, being happy, good self-esteem, being healthy, being sober.” “It is not.... self-judging, putting yourself down, self-criticism, self-medicating, poor health habits, lack of exercise.”
[Youth Workshop Group Reflections]
With increasing grade, higher proportions of students report feeling hopeless for two weeks
18% of grade 6 boys report feeling hopeless versus 24% of grade 10 boys, an increase of 6 percentage points.
25% of grade 6 girls report feeling hopeless versus 48% of grade 10 girls, an increase of 23 percentage points.
Compared to boys, a higher percentage of girls report feeling hopeless.
48% of girls in grade 10 report feeling hopeless or sad for two weeks or more in a row in the past year versus 24% of boys in grade 10.
“As you get older, poor mental health increases, stress levels rise, more pressure and responsibilities.”
[Youth Workshop Participant]
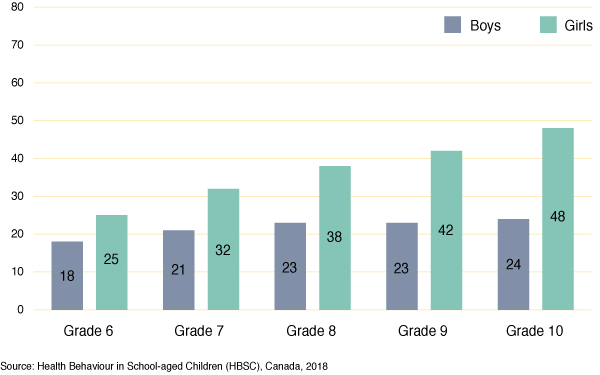
Figure 49 - Text description
| Grade | Boys | Girls |
|---|---|---|
| Grade 6 | 18 | 25 |
| Grade 7 | 21 | 32 |
| Grade 8 | 23 | 38 |
| Grade 9 | 23 | 42 |
| Grade 10 | 24 | 48 |
| Source: Health Behaviour in School-aged Children (HBSC), Canada, 2018 | ||
With increasing grade, higher proportions of students report feeling lonely, particularly girls
14% of grade 6 boys report feeling lonely versus 22% of grade 10 boys, an increase of 8 percentage points.
21% of grade 6 girls report feeling lonely versus 38% of grade 10 girls, an increase of 17 percentage points.
Compared to boys, a higher percentage of girls report feeling lonely.
38% of girls in grade 10 report feeling lonely versus 22% of boys in grade 10.

Figure 50 - Text description
| Grade | Boys | Girls |
|---|---|---|
| Grade 6 | 14 | 21 |
| Grade 7 | 17 | 28 |
| Grade 8 | 19 | 30 |
| Grade 9 | 21 | 35 |
| Grade 10 | 22 | 38 |
| Source: Health Behaviour in School-aged Children (HBSC), Canada, 2018 | ||
More girls than boys report feeling nervous and the difference increases with grade
67% of girls in grade 10 report feeling nervous versus 42% of boys in grade 10.
32% of grade 6 boys report feeling nervous versus 42% of grade 10 boys, an increase of 10 percentage points.
38% of grade 6 girls report feeling nervous versus 67% of grade 10 girls, an increase of 29 percentage points.
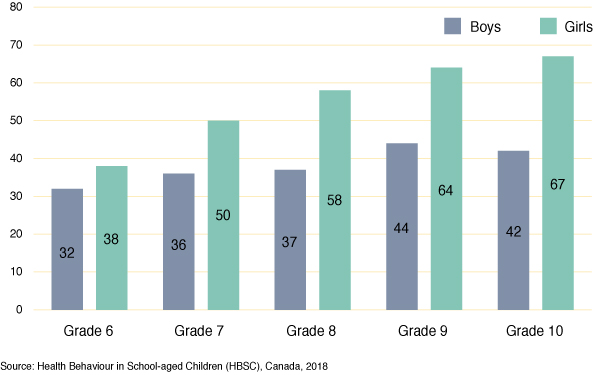
Figure 51 - Text description
| Grade | Boys | Girls |
|---|---|---|
| Grade 6 | 32 | 38 |
| Grade 7 | 36 | 50 |
| Grade 8 | 37 | 58 |
| Grade 9 | 44 | 64 |
| Grade 10 | 42 | 67 |
| Source: Health Behaviour in School-aged Children (HBSC), Canada, 2018 | ||
More girls than boys report frequent subjective health complaints and the difference increases with grade
Compared to boys, a higher percentage of girls report more than weekly subjective health complaints, such as headaches or stomachaches.
55% of girls in grade 10 report more than weekly subjective health complaints versus 27% of boys in grade 10.
20% of grade 6 boys report frequent health complaints versus 27% of grade 10 boys, an increase of 7 percentage points.
30% of grade 6 girls report frequent health complaints versus 55% of grade 10 girls, an increase of 25 percentage points.
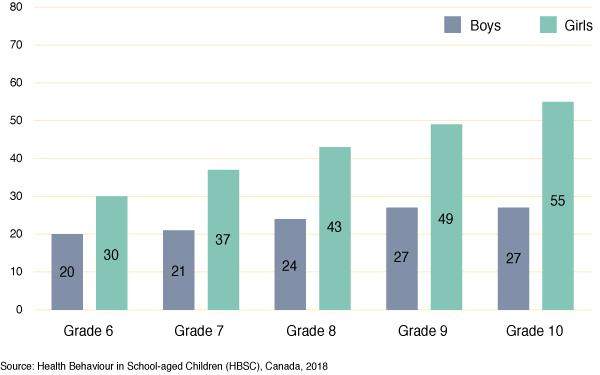
Figure 52 - Text description
| Grade | Boys | Girls |
|---|---|---|
| Grade 6 | 20 | 30 |
| Grade 7 | 21 | 37 |
| Grade 8 | 24 | 43 |
| Grade 9 | 27 | 49 |
| Grade 10 | 27 | 55 |
| Source: Health Behaviour in School-aged Children (HBSC), Canada, 2018 | ||
More boys report having confidence in themselves than girls
“When you are not confident it is hard to be happy.”
[Youth Workshop Participant]
67% of boys in grade 10 report being confident versus 47% of girls in grade 10.
76% of grade 6 boys report feeling confident versus 67% of grade 10 boys, a decrease of 9 percentage points.
66% of grade 6 girls report feeling confident versus 47% of grade 10 girls, a decrease of 19 percentage points.
“You’re more confident when you’re younger; when you think of something you want to do, you just go do it, you don’t think about the consequences or judgement. You don’t think ahead as much when you’re younger.”
[Youth Workshop Participant]
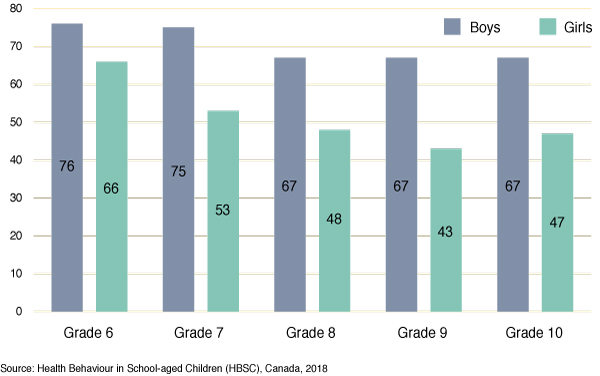
Figure 53 - Text description
| Grade | Boys | Girls |
|---|---|---|
| Grade 6 | 76 | 66 |
| Grade 7 | 75 | 53 |
| Grade 8 | 67 | 48 |
| Grade 9 | 67 | 43 |
| Grade 10 | 67 | 47 |
| Source: Health Behaviour in School-aged Children (HBSC), Canada, 2018 | ||
More girls than boys report low life satisfaction
In 2018, 14% of grade 10 boys versus 28% of grade 10 girls report low life satisfaction.
With increasing grade, more girls report low life satisfaction. In 2018, 18% of grade 6 girls versus 28% of grade 10 girls report low life satisfaction.
The percentage of boys reporting low life satisfaction is relatively consistent over time. For girls in grade 10, the percentage who reported low life satisfaction increased from 22% in 2014 to 28% in 2018.
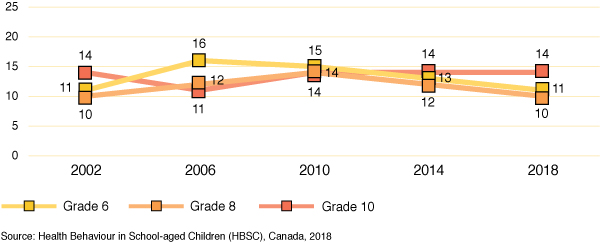
Figure 54a - Text description
| Year | Grade 6 | Grade 8 | Grade 10 |
|---|---|---|---|
| 2002 | 11 | 10 | 14 |
| 2006 | 16 | 12 | 11 |
| 2010 | 15 | 14 | 14 |
| 2014 | 13 | 12 | 14 |
| 2018 | 11 | 10 | 14 |
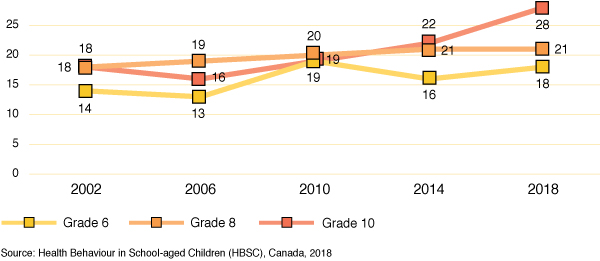
Figure 54b - Text description
| Year | Grade 6 | Grade 8 | Grade 10 |
|---|---|---|---|
| 2002 | 14 | 18 | 18 |
| 2006 | 13 | 19 | 16 |
| 2010 | 19 | 20 | 19 |
| 2014 | 16 | 21 | 22 |
| 2018 | 18 | 21 | 28 |
| Source: Health Behaviour in School-aged Children (HBSC), Canada, 2018 | |||
Conclusions
- Almost one-half of grade 9 and 10 girls and one-quarter of boys report feeling sad or hopeless almost every day for two weeks or more resulting in them stopping usual activities. There are also high percentages of students who report feeling lonely. These findings are concerning.
- Similarly, there are concerning high percentages of students who report feeling nervous. In grade 6, about one-third of students report feeling nervous, but by grade 10, this proportion has increased to two-thirds of girls. Subjective health complaints increase with grade, especially for girls.
- For grade 10 girls, there has been an increase in the percentage reporting low life satisfaction from 2014 to 2018.
- Three-quarters of grade 6 boys and two-thirds of grade 6 girls report having confidence in themselves. In grade 10 these percentages drop to two-thirds for boys and less than one-half of girls.
- Consistently on all indicators, girls are reporting more symptoms that are consistent with depression and anxiety than boys and older students are reporting more symptoms than younger students. The concern is that poor mental health during school-age years can persist and lead to adverse outcomes throughout one’s lifespan (Waddell et al., 2013).
- Taken together, these results indicate that many students, particularly older girls, are reporting symptoms that are consistent with depression (sadness, hopelessness) and anxiety (nervousness, psychosomatic complaints).
References
Buote, D. (2009). Social-emotional health in middle childhood: What we know. Ottawa, ON: Public Health Agency of Canada.
Meldrum, L., Venn, D., & Kutcher, S. (2009). Mental health in schools: How teachers have the power to make a difference. Health & Learning Magazine, 8, 3–5.
Mychailyszyn, M. P., Méndez, J. L., & Kendall, P. C. (2010). School functioning in youth with and without anxiety disorders: Comparisons by diagnosis and comorbidity. School Psychology Review, 39, 106–121.
Owens, M., Stevenson, J., & Hadwin, J. (2012). Anxiety and depression in academic performance: An exploration of the mediating factors of worry and working memory. School Psychology International, 33(4), 1–13.
Waddell, C., Shepherd, C. A., Chen, A., & Boyle, M. H. (2013). Creating comprehensive children’s mental health indicators for British Columbia. Canadian Journal of Community Mental Health, 32, 9–27.
Chapter 12: Spiritual health
- Connections to self
- Connections to others
- Connections to nature
- Transcendent connections
- Conclusions
Spiritual health
Spirituality has been defined as the “connections in life that make us human” (Michaelson et al., 2015). Not to be confused with formal religion, the right to a healthy spirituality in the development of young people is enshrined in the United Nations’ Convention on the Rights of the Child (General Assembly UN, 1989). Spiritual health often considers four domains: connections to self, others, nature and to something greater (the transcendent) (Hay and Nye, 2006).
This chapter describes young people’s perceptions of the importance of spiritual health according to those four domains.
In the views of young people, there is a distinct overlap between spiritual health and “quality mental health and wellness”. In that regard, spiritual health is very much a positive health asset. Both include the need for strong connections to your inner self. This includes self-care, self-respect, and knowing you are capable and resilient (connections to self). For some, it includes “keeping in touch with the land” (connections to nature), or being connected to something greater (connections to the transcendent). For others it is being able to talk over problems with family and friends (connections to others). All of these are core domains of spiritual health.
[Youth Workshop Group Reflections]
Connections to self are important to the majority of young people
In boys, proportions reporting that connections to self (i.e., sensing meaning in life, experiences of joy) are important vary from a high of 73% in grade 6 to a low of 57% in grade 9.
In girls, these proportions range from a high of 76% in grade 6 to a low of 67% in grades 8 and 9.
The proportions who report that connections to self are important are higher for girls than boys in all grades.
“Growing up in a trades household and a heavy stigma [I was taught] to never cry. I’ve never seen a guy in my family cry except for one time in my entire life. So I feel that I lost my self connection with emotions for a long, long time, because I didn’t think my feelings were important enough to be validated”.
[Youth Workshop Participant]

Figure 55 - Text description
| Grade | Boys | Girls |
|---|---|---|
| Grade 6 | 73 | 76 |
| Grade 7 | 64 | 70 |
| Grade 8 | 60 | 67 |
| Grade 9 | 57 | 67 |
| Grade 10 | 60 | 69 |
| Source: Health Behaviour in School-aged Children (HBSC), Canada, 2018 | ||
More girls than boys rate connections to others as being important
In boys, proportions reporting that connections to others are important vary from a high of 58% in grade 6 to a low of 46% in grade 9.
In girls, these proportions range from a high of 69% in grade 6 to a low of 61% in grades 8 and 9.
More girls than boys in all grades report that connections to others are important.
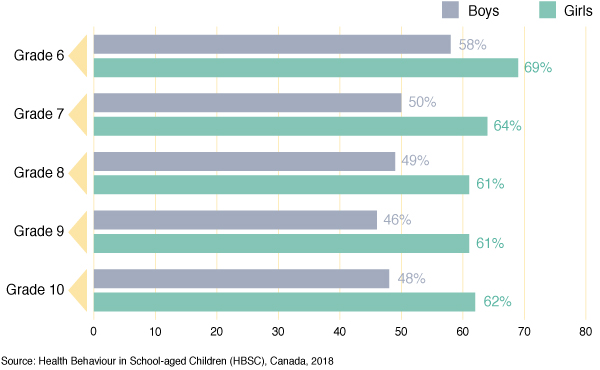
Figure 56 - Text description
| Grade | Boys | Girls |
|---|---|---|
| Grade 6 | 58 | 69 |
| Grade 7 | 50 | 64 |
| Grade 8 | 49 | 61 |
| Grade 9 | 46 | 61 |
| Grade 10 | 48 | 62 |
| Source: Health Behaviour in School-aged Children (HBSC), Canada, 2018 | ||
Students in older grades report connections to nature as being less important
In boys, the proportion reporting that connections to nature are important declines from 58% in grade 6 to 35% in grade 10.
In girls, these proportions drop from a high of 68% in grade 6 to a low of 44% in grade 10.
More girls than boys in all grades report that connections to nature are important.
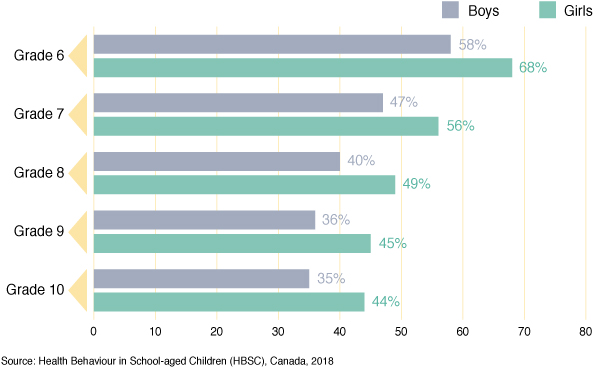
Figure 57 - Text description
| Grade | Boys | Girls |
|---|---|---|
| Grade 6 | 58 | 68 |
| Grade 7 | 47 | 56 |
| Grade 8 | 40 | 49 |
| Grade 9 | 36 | 45 |
| Grade 10 | 35 | 44 |
| Source: Health Behaviour in School-aged Children (HBSC), Canada, 2018 | ||
Transcendent connections have less importance to most young Canadians than the other domains of spiritual health
Fewer than one in four girls and boys report that connections to something greater (the transcendent) are important in their lives.
This is the spiritual health domain that is most closely affiliated with formal religion.
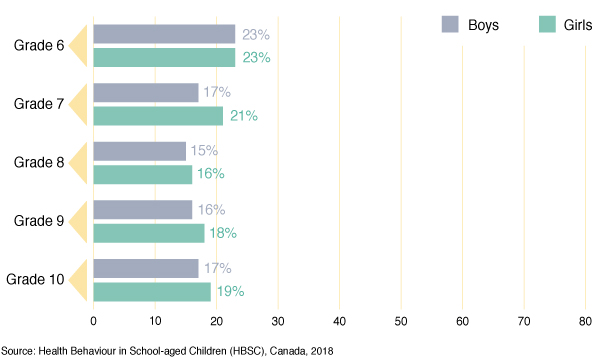
Figure 58 - Text description
| Grade | Boys | Girls |
|---|---|---|
| Grade 6 | 23 | 23 |
| Grade 7 | 17 | 21 |
| Grade 8 | 15 | 16 |
| Grade 9 | 16 | 18 |
| Grade 10 | 17 | 19 |
| Source: Health Behaviour in School-aged Children (HBSC), Canada, 2018 | ||
Conclusions
- Spiritual health is an ancient concept with contemporary application to the health, and health experiences of young people in Canada (Brooks et al., 2018).
- Of the four domains used to measure spiritual health, connections to self seems to be most important to young people, followed by connections to others, to nature, and to the transcendent.
- The proportion of students who perceived that connections to nature were important declined by grade. This is particularly relevant to adolescent health discussions in Canada, since connections to nature are known to be positive health assets (Piccininni et al., 2018).
References
Brooks, F., Michaelson, V., King, N., Inchley, J., & Pickett, W. (2018). Spirituality as a protective health asset for young people: an international comparative analysis from three countries. International journal of public health, 63(3), 387-395.
Hay, D., & Nye, R. (1998). The spirit of the child. London, UK: Fount Paperbacks.
Michaelson, V., Brooks, F., Jirásek, I., Inchley, J., Whitehead, R., King, N., ... & Pickett, W. (2016). Developmental patterns of adolescent spiritual health in six countries. SSM-population health, 2, 294-303.
Piccininni, C., Michaelson, V., Janssen, I., & Pickett, W. (2018). Outdoor play and nature connectedness as potential correlates of internalized mental health symptoms among Canadian adolescents. Preventive Medicine. 112. 10.1016/j.ypmed.2018.04.020.
UN General Assembly. (1989). Convention on the Rights of the Child . United Nations, Treaty Series, vol. 1577, p. 3, available at: http://www.refworld.org/docid/3ae6b38f0.html
Chapter 13: Substance use
- Daily smoking
- E-cigarettes/Vaping
- Drunkenness
- Cannabis use
- Illegal drugs and use of medications to “get high”
- Conclusions
Substance use
During adolescence, many young people begin to experiment with tobacco, alcohol, or other drugs. Frequent use of these substances is related to a diversity of health problems (Paglia-Boak & Adlaf, 2007). It is therefore important to monitor substance use behaviour in order to understand their harms, and to inform public health policy and practice. For similar reasons, it is also vital to monitor the emergence of newer substance use behaviour such as e-cigarette use and the use of illegal drugs and prescription medications to “get high”.
In this chapter, we examine the reporting of key indicators of substance use. Questions about tobacco, alcohol use, and e-cigarettes were asked across grades 6 to 10, while questions about the use of cannabis and illegal drugs were asked only of students in grades 9 and 10.
Young people use substances to cope, to deal with stress, and to “fit in” with others.
[Youth Workshop Group Reflections]
E-cigarettes are a type of vaping product used for consuming e-liquids that can contain nicotine and/or flavourings. Students were asked if they had used “e-cigarettes (electronic cigarettes that look like cigarettes/cigars, but produce vapour instead of smoke)” in the last 30 days.
Percentages of students who smoke cigarettes daily are low
Among boys, smoking cigarettes daily in the last 30 days ranges from 0.1% in grade 6 to 2% in grade 10.
Among girls, responses range from 0% in grade 6 to 1.8% in grade 10.
The percentages of students smoking cigarettes are similar for boys and girls across the grade range and remain at historic lows.
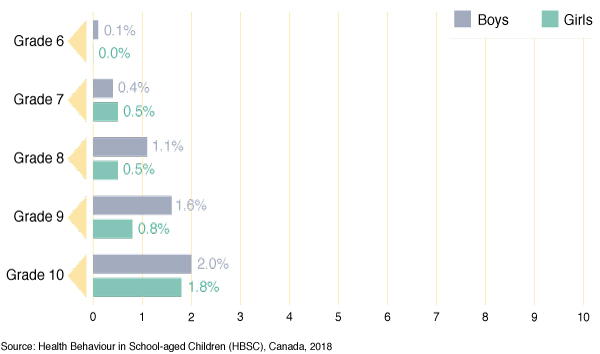
Figure 59 - Text description
| Grade | Boys | Girls |
|---|---|---|
| Grade 6 | 0.1 | 0 |
| Grade 7 | 0.4 | 0.5 |
| Grade 8 | 1.1 | 0.5 |
| Grade 9 | 1.6 | 0.8 |
| Grade 10 | 2.0 | 1.8 |
| Source: Health Behaviour in School-aged Children (HBSC), Canada, 2018 | ||
1 in 4 grade 10 students are reporting e-cigarette use
In boys, reported use of e-cigarettes in the last 30 days ranges from 7% in grade 6 to 28% in grade 10.
In girls, reported use of e-cigarettes in the last 30 days varies from 4% in grade 6 to 24% in grade 10.
With the exception of grade 7, more boys than girls report smoking e-cigarettes.
Young people had many suggestions for prevention efforts. These included: (1) lowering the amounts of nicotine that go in to a vape; (2) publicizing some of the negative health effects (e.g., collapsed lungs) that sometimes go with vaping; (3) removing popular flavours from the market; (4) introducing legislation to make the legal age consistent with cigarettes, mandating the use of plain packaging, and prohibiting companies from advertising these products on television and social media.
[Youth Workshop Group Reflections]
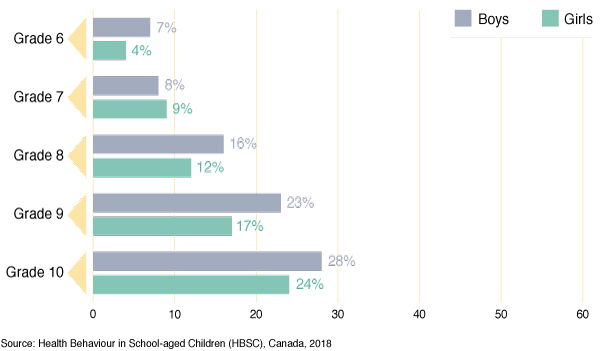
Figure 60 - Text description
| Grade | Boys | Girls |
|---|---|---|
| Grade 6 | 7 | 4 |
| Grade 7 | 8 | 9 |
| Grade 8 | 16 | 12 |
| Grade 9 | 23 | 17 |
| Grade 10 | 28 | 24 |
| Source: Health Behaviour in School-aged Children (HBSC), Canada, 2018 | ||
Boys and girls report very similar patterns of “getting really drunk”
Among boys, drunkenness on two or more occasions (lifetime) ranges from 1% in grade 6 to 26% in grade 10.
Among girls, these proportions range from 1% in grade 6 to 29% in grade 10.
Similar percentages of boys and girls report drunkenness in their lifetimes.
“Everyone drinks or smokes in high school. You feel like you cannot connect with anyone without these”.
[Youth Workshop Participant]

Figure 61 - Text description
| Grade | Boys | Girls |
|---|---|---|
| Grade 6 | 1 | 1 |
| Grade 7 | 2 | 2 |
| Grade 8 | 7 | 5 |
| Grade 9 | 14 | 13 |
| Grade 10 | 26 | 29 |
| Source: Health Behaviour in School-aged Children (HBSC), Canada, 2018 | ||
Cannabis use is declining among grade 9 and 10 students
The proportion of Grade 9 and 10 boys that report using cannabis in the last 12 months declines from 37% in 2002 to 17% in 2018.
Among grade 9 and 10 girls, the proportion that report using cannabis in the last 12 months declines from 31% in 2002 to 17% in 2018.
In 2002 more boys than girls report using cannabis, whereas the proportions are similar for boys and girls in subsequent years.
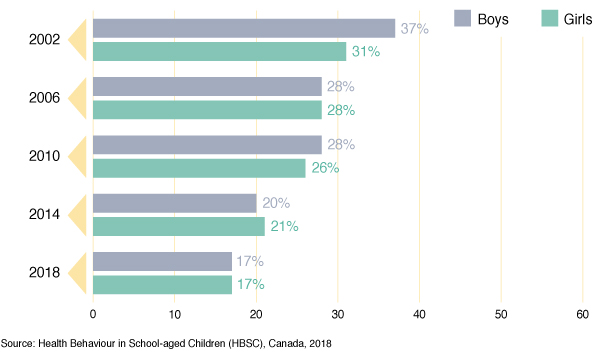
Figure 62 - Text description
| Year | Boys | Girls |
|---|---|---|
| 2002 | 37 | 31 |
| 2006 | 28 | 28 |
| 2010 | 28 | 26 |
| 2014 | 20 | 21 |
| 2018 | 17 | 17 |
| Source: Health Behaviour in School-aged Children (HBSC), Canada, 2018 | ||
Use of illegal drugs or medications to “get high”
Among boys, 2 to 4% report use of specific illegal drugs.
Among girls, this proportion is 2 to 3%.
Both boys and girls more commonly report use of specific medications to “get high”, 18% of boys, and 21% of girls use cough and cold medicines to “get high”.
| Illegal drug or medication | Boys | Girls |
|---|---|---|
| Ecstasy, MDMA (E, Xtc, Adam, X) | 3 | 2 |
| Amphetamines (speed) | 3 | 3 |
| Methamphetamines/Crystal methamphetamine (ice) | 2 | 2 |
| Heroin (horse, tar, junk) | 2 | 2 |
| Cocaine (coke, crack, snow, rock) | 3 | 2 |
| Glue or solvents (e.g., gasoline, butane, model glue) | 2 | 2 |
| LSD and other hallucinogens (e.g., PCP, magic mushrooms, mescaline, peyote, Salvia) | 4 | 3 |
| Medication to “get high”: | ||
| Pain Relievers (e.g., Percodan, Demerol, Oxycontin, Codeine) | 6 | 4 |
| Stimulants (e.g., Ritalin, Concerta, Adderall) | 5 | 3 |
| Sedatives/tranquillizers (e.g., Valium, Ativan, Xanax) | 3 | 3 |
| Cough and cold medicines | 18 | 21 |
Conclusions
- The very low levels of daily cigarette smoking reported by young people in Canada is encouraging.
- Almost one in four young people in grade 10 now report the use of e-cigarettes.
- The continued decline in the use of cannabis among young people is encouraging. Given the 2018 Canadian legislation that maintains bans on cannabis use among children while legalizing its use among adults, it will be especially important to monitor patterns of cannabis use among young people in Canada.
- There is a low percentage of students reporting use of illegal drugs to “get high”, but there are a variety of health risks for the young people who use them. A higher percentage of students report the use of medications to “get high”, which is also associated with health concerns.
References
Paglia-Boak, A., & Adlaf., E. (2007). Substance use and harm in the general youth population. In Substance Abuse in Canada: Youth in Focus. Ottawa, ON: Canadian Centre on Substance Abuse.
Chapter 14: Sexual health
- Trends in sexual intercourse
- Contraceptive use
- Age of initiation
- Conclusions
Sexual health
Adolescence is characterized by the emergence of romantic relationships. These relationships enable youth to learn intimacy skills and develop healthy relationships. Sexual health is important to adolescents’ overall health and well-being (Slater & Robinson, 2014). Romantic relationships, however, can also involve risky behaviours. Engaging in sexual intercourse at an early age is associated with greater risk for unprotected sex, having an unplanned pregnancy, and contracting sexually transmitted infections. Moreover, it is linked to other risk-taking behaviours such as drug and alcohol use (Godeau, Nic Gabhainn, & Ross, 2005).
This chapter examines the trends in the percentage of students who have had sexual intercourse, as well the prevalence of the use of contraception, and the age of initiation of sexual intercourse.
In 2018, approximately 1 in 4 grade 10 students report they have had sexual intercourse
In 2018, 25% of grade 10 boys and 27% of grade 10 girls reported having had sex.
In 2018, 14% of grade 9 boys and 12% of grade 9 girls report having had sex.
Since 2010, there has been a significant drop in the percentage of students reporting they have had sexual intercourse.
“Technology has made sexual activity [go down]; sexting, online chat.”
[Youth Workshop Participant]
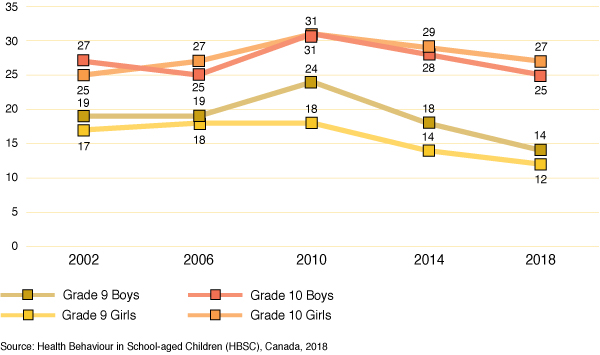
Figure 63 - Text description
| Year | Grade 9 Boys | Grade 9 Girls | Grade 10 Boys | Grade 10 Girls |
|---|---|---|---|---|
| 2002 | 19 | 17 | 27 | 25 |
| 2006 | 19 | 18 | 25 | 27 |
| 2010 | 24 | 18 | 31 | 31 |
| 2014 | 18 | 14 | 28 | 29 |
| 2018 | 14 | 12 | 25 | 27 |
| Source: Health Behaviour in School-aged Children (HBSC), Canada, 2018 | ||||
Less than 2/3 of students report using condoms
Girls are more likely than boys to report birth control pills as the method of birth control (55% versus 47%), whereas boys are more likely to report using condoms (66% of boys versus 61% of girls) the last time they had intercourse.
It should be noted that the boy/girl difference in birth control use may be impacted by the fact that more boys than girls are “unsure” of whether or not birth control pills were used.
Young people reported a range of experiences and accessibility of information on sexual health, ranging from only talking about abstinence to condoms being available at their school for anyone to access.
[Youth Workshop Group Reflections]

Figure 64 - Text description
| Type of contraceptive | Boys | Girls |
|---|---|---|
| Birth control pills | 47 | 55 |
| Condoms | 66 | 61 |
| Source: Health Behaviour in School-aged Children (HBSC), Canada, 2018 | ||
Of the students who report having had sex, most had their first experience when they were 15 years old
Of the grade 9 and 10 students who have had sex, the majority report that they first had sex at age 14 or 15.
Of the students who report having had sex, 26% of boys in grades 9 and 10 have had sex before they were 14, versus 16% of girls.
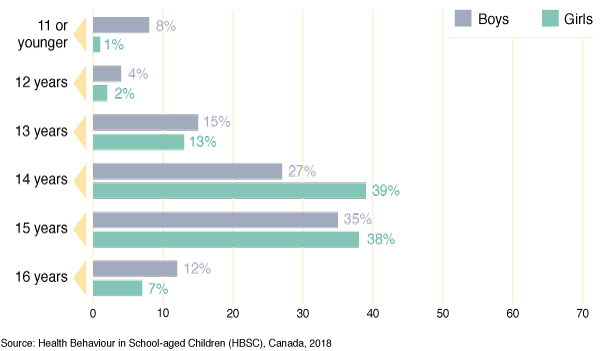
Figure 65 - Text description
| Age | Boys | Girls |
|---|---|---|
| 11 or younger | 8 | 1 |
| 12 years | 4 | 2 |
| 13 years | 15 | 13 |
| 14 years | 27 | 39 |
| 15 years | 35 | 38 |
| 16 years | 12 | 7 |
| Source: Health Behaviour in School-aged Children (HBSC), Canada, 2018 | ||
Conclusions
- The percentage of grade 9 and 10 students who report having had sexual intercourse has dropped significantly since 2010 and the drop is greater in boys than girls.
- About two-thirds of students report using condoms, and about one-half of students report using birth control pills, the last time they had sex.
- Of the grade 9 and 10 students who report having had sex, they are most likely to initiate it at age 14 or 15. Consent-based education may help inform students about the risks of early sex initiation and about contraceptive choices.
- Sex education enables students to better understand themselves, establish emotional relationships that show respect for themselves and others, and develop critical thinking and good judgment along with a sense of responsibility (Slater & Robinson, 2014).
References
Godeau, E., Nic Gabhainn, S., & Ross, J. (2005). Sexual health. In HBSC Research Protocol for 2005/06 Survey. Section 2, Scientific rationales for focus areas.
Slater, C., & Robinson, A. J. (2014). Sexual health in adolescents. Clinics in Dermatology, 32, 189–199.
Chapter 15: Social media use
- Problematic social media use
- Talk easily on social media
- Intensive social media use
- Time spent on social media
- Time spent on electronic devices playing games
- Conclusions
Social media use
Social media use has become increasingly embedded in the daily lives of youth in recent years, leading to concerns about its potential impact (Underwood & Ehrenreich, 2017). Research suggests that intense social media use, indicated by the time spent using social media, is linked to lower mental (Primack & Escobar-Vierra, 2017), school (Al-Menayes, 2015), and social well-being of youth (Underwood & Ehrenreich, 2017).
In addition, problematic social media use, indicated by symptoms of addiction to social media, such as loss of control over social media use or having conflicts because of social media use (Van den Eijnden, Lemmens, & Valkenburg, 2016), is also associated with lower well-being among youth (Marino, Gini, Vieno, et al., 2018).
In this chapter, we examine young people’s engagement with social media, including problematic use, ease of use, intensity of use, and activities in which they engage.
Students were classified as intensive users of social media based on their frequency of communication with four groups: close friend(s); friends from a larger friend group; friends that you got to know through the internet, but didn’t know before; and people other than friends (Inchley et al., 2018). Students were classified as problematic users of social media based on negative aspects of their social media use such as neglecting other activities, being unable to focus on other things, feeling bad about social media use, and having conflict, arguments, or lying to family or friends about social media use (Inchley et al., 2018).
With increasing grade, students are more likely to report problematic social media use
In general, girls are more likely to report problematic social media use than boys.
9% of grade 9 girls versus 4% of grade 6 girls report problematic social media use.
11% of girls in grade 10 are problematic social media users compared to 6% of grade 10 boys.
Many students recognized the possible negative impacts that social media can have, particularly if they are spending too much time on social media:
“Makes you obsessive, rough on mental health, cyber-bullying, takes away from face-to-face interactions, miss out on sleep, miss out on the present moment, lots of missed opportunities.”
[Youth Workshop Group Reflections]
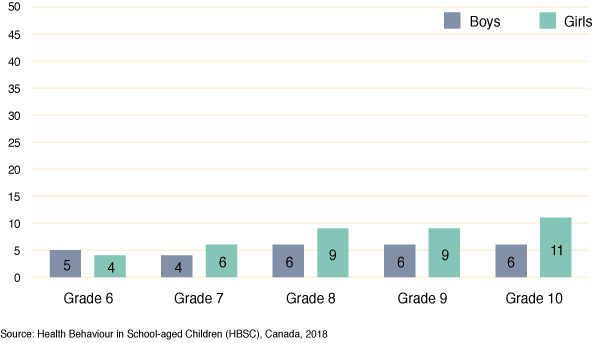
Figure 66 - Text description
| Grade | Boys | Girls |
|---|---|---|
| Grade 6 | 5 | 4 |
| Grade 7 | 4 | 6 |
| Grade 8 | 6 | 9 |
| Grade 9 | 6 | 9 |
| Grade 10 | 6 | 11 |
| Source: Health Behaviour in School-aged Children (HBSC), Canada, 2018 | ||
With increasing grade, more students prefer to talk about their inner feelings online
In general, girls are more likely to agree that they prefer to talk about feelings on the internet compared to boys.
39% of girls in grade 10 agree they prefer to talk on the internet versus 32% of grade 10 boys.
39% of grade 9 girls versus 15% of grade 6 girls report that they can more easily talk about their inner feelings online.
“[On social media] you are able to express your feelings at a safe distance.”
[Youth Workshop Participant]
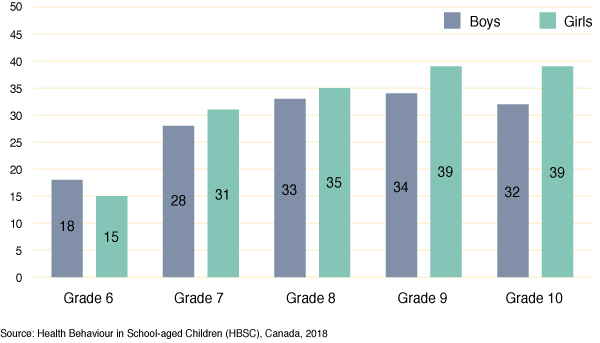
Figure 67 - Text description
| Grade | Boys | Girls |
|---|---|---|
| Grade 6 | 18 | 15 |
| Grade 7 | 28 | 31 |
| Grade 8 | 33 | 35 |
| Grade 9 | 34 | 39 |
| Grade 10 | 32 | 39 |
| Source: Health Behaviour in School-aged Children (HBSC), Canada, 2018 | ||
With increasing grade, more students report intensive social media use
At all grades, more girls report intensive social media use than boys.
In grades 9 and 10, 46% and 47% of girls report intensive social media use, versus 35% and 38% for grade 9 and10 boys.
As youth age, they are utilizing their phones or other devices to stay in contact with others frequently and regularly throughout the day.
“[Social media] is addictive, so people become more addicted as they use it more.”
[Youth Workshop Participant]
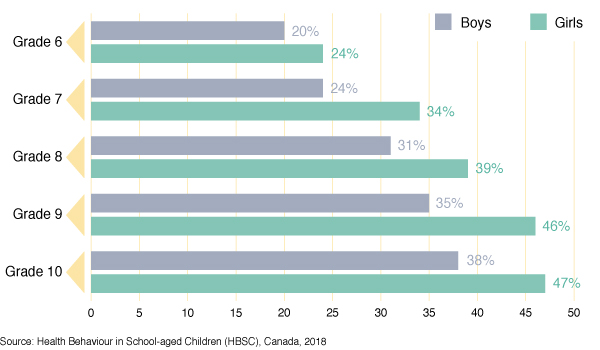
Figure 68 - Text description
| Grade | Boys | Girls |
|---|---|---|
| Grade 6 | 20 | 24 |
| Grade 7 | 24 | 34 |
| Grade 8 | 31 | 39 |
| Grade 9 | 35 | 46 |
| Grade 10 | 38 | 47 |
| Source: Health Behaviour in School-aged Children (HBSC), Canada, 2018 | ||
Girls are more likely to spend time using electronic devices to do homework and social networking activities
43% of girls in grade 10 compared to 32% of boys spend three hours or more a day during the week doing homework or social networking on their electronic devices.
The proportion of girls spending three hours or more a day on their electronic devices other than game playing increases from 12% in grade 6 to 43% in grade 10.
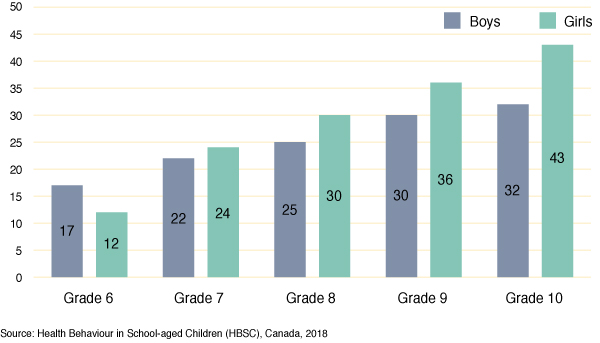
Figure 69 - Text description
| Grade | Boys | Girls |
|---|---|---|
| Grade 6 | 17 | 12 |
| Grade 7 | 22 | 24 |
| Grade 8 | 25 | 30 |
| Grade 9 | 30 | 36 |
| Grade 10 | 32 | 43 |
| Source: Health Behaviour in School-aged Children (HBSC), Canada, 2018 | ||
Boys are more likely to spend time using electronic devices to play games
24% of boys in grade 6 compared to 12% of girls in grade 6 spend three or more hours a day during the week playing games on their electronic devices.
The proportion of boys spending time on their electronic devices playing games for three or more hours increases from 24% in grade 6 to 31% in grade 9.
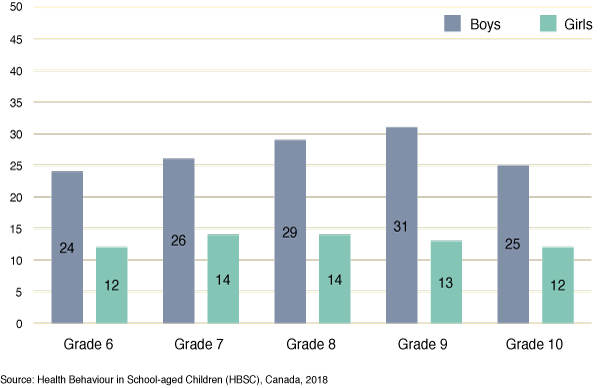
Figure 70 - Text description
| Grade | Boys | Girls |
|---|---|---|
| Grade 6 | 24 | 12 |
| Grade 7 | 26 | 14 |
| Grade 8 | 29 | 14 |
| Grade 9 | 31 | 13 |
| Grade 10 | 25 | 12 |
| Source: Health Behaviour in School-aged Children (HBSC), Canada, 2018 | ||
Conclusions
- The good news is very few students are reporting problematic social media use, although for girls by grade 10, it is about 11%.
- Students may not have problematic use, but they are spending a significant amount of time online. Boys are more likely than girls to be playing games online, while girls are more likely than boys to be doing homework, social networking or surfing the net.
- With increasing grade, students report that it is easier to talk about their inner feelings through social media. Online communication does not require face-to-face contact or anyone seeing visual cues and students may feel safer communicating online (Hudson et al., 2016).
- Students connect, play, and do work online. Understanding the benefits and drawbacks of being online may help the development of prevention and intervention strategies to support students online (Best et al., 2014).
References
Al-Menayes, J. J. (2015). Social media use, engagement and addiction as predictors of academic performance. Int J Psychol Stud, 7:86–94.
Best, P., Manktelow, R., & Taylor, B. (2014). Online communication, social media and adolescent wellbeing: A systematic narrative review. Child Youth Serv Rev, 41:27–36.
Hudson, C., Lambe, L., PREVNet National Youth Advisory Committee, Pepler, D. J., & Craig, W. M. (2016). Coping while connected: the association among cybervictimization, privacy settings, and reporting tools in youth. Canadian Journal of School Psychology, 31:3-16.
Inchley J, Currie D, Cosma A & Samdal O, editors (2018). Health behaviour in school-aged children (HBSC) Study Protocol: background, methodology and mandatory items for the 2017/18 survey, 2.2.6 Electronic Media.
Marino, C., Gini, G., Vieno, A., et al. (2018). The associations between problematic Facebook use, psychological distress and well-being among adolescents and young adults: A systematic review and meta-analysis. J Affect Disord, 226:274–81.
Primack, B. A., & Escobar-Viera, C. G. (2017). Social media as it interfaces with psychosocial development and mental illness in transitional age youth. Child Adolesc Psychiatr Clin Am, 26:217–33.
Underwood, M. K., & Ehrenreich, S. E. (2017). The power and the pain of adolescents’ digital communication: Cyber victimization and the perils of lurking. Am Psychol, 72:144–58.
Van den Eijnden, R. J. J. M., Lemmens, J., & Valkenburg, P. M. (2016). The Social Media Disorder Scale: Validity and psychometric properties. Comput Human Behav, 61:478–87.
Chapter 16: Key messages
Final thoughts
The main purposes of the HBSC are to understand youth health and well-being and to inform education and health policy and health promotion programs, nationally and internationally.
In this national Canadian report, we report on key findings aimed at monitoring health and health behaviours and social and physical contexts of students in grades 6 to 10.
This chapter highlights key findings of this 2018 HBSC report. In addition to providing a brief snapshot of the various health topics covered by the survey, we also highlight four major themes that emerged when the results are looked at as a whole.
Home and family
The majority of students in Canada report having a happy home life. They also report positive relationships with their parents, and feel that they are generally understood by them. There are some exceptions. The home life for grade 9 and 10 girls is more challenging – they are less likely to feel understood and are more likely to report they would like to leave home at times.
Friends
Many students report having frequent contact online with friends, and this increases with grade. Of concern, is that the percentage of girls in grades 8 to 10 who report that they have a same-sex friend to talk to has been decreasing for decades. However, it is encouraging that the majority of students report that most of their friends engage in positive behaviours, and relatively few report that most of their friends engage in risky behaviours.
School
Over time, more and more grade 10 girls report feeling a lot of pressure around school work and school performance. A substantial proportion of students in grades 9 and 10 report that their teachers are not supportive, nor are their peers. The combination of increased school pressure and perceived lack of support may be contributing to mental health challenges experienced by older girls.
Community
Less than one-half of young people in Canada perceive high levels of support from the communities that they live in. Increases in neighbourhood distrust observed since 2002 are of concern. In each of grades 6 to 10, a higher percentage of girls reported involvement in volunteer work compared to boys.
Physical activity, screen time, and sleep
While the majority of students adhere to Canadian 24-hour Movement Guidelines for sleep, adherence to related screen time guidelines is poor. Further, only one-quarter of Canadian students report participating in a least 60 minutes per day of moderate-to-vigorous intensity physical activity.
Healthy eating
The proportions of students that report daily consumption of fruit and vegetables continue to rise, while the proportions reporting sweets and soft drink consumption continue to decline. The extent of eating in fast food restaurants, skipping breakfast during the school week, and going to school or bed hungry due to a lack of food in the home were each notable findings related to healthy eating and nutrition.
Healthy weights
Percentages of students categorized as being overweight and obese in grades 6 to 10 have not changed substantially since 2002. Higher percentages of girls than boys report thinking that their body is “too fat”, while higher percentages of boys than girls report thinking that their body is “too thin”, illustrating the complex social pressures faced by students with respect to their body image.
Injury and concussions
Injuries remain one of the leading causes of death, disability and lost productivity among students (Parachute, 2015). Most serious injuries occur in three types of environments: sports facilities, schools, and at home, offering targets for intervention. About 1 in 10 Canadian youth report that they were diagnosed with a concussion in the past year.
Bullying and teen dating violence
The percentages of students who report being bullied have remained relatively stable over time. Involvement in bullying is a gendered issue with more girls than boys reporting being bullied and more boys than girls reporting bullying others. More girls than boys report being victimized in their dating relationships, but boys and girls are equally likely to perpetrate teen dating violence. Supporting youth in engaging in healthy relationships can help to prevent bullying and teen dating violence.
Mental health
Of girls and boys in grades 6 to 10, girls in grades 9 and 10 consistently report the most negative mental health experiences. They have the highest likelihood of reporting feeling hopeless, sad, lonely and nervous, as well as having low confidence and subjective health complaints. They are also reporting lower quality relationships with parents, teachers, and peers. It is concerning that these girls are reporting experiencing the most negative mental health concerns and problems in their relationships, as healthy relationships may buffer these mental health concerns.
Spiritual health
The right to a healthy spirituality has been recognized as a fundamental human right for children. Since 2014, HBSC researchers have been measuring spiritual health and its four domains describing connections to self, others, nature, and the transcendent. Connections to self seem to be of central importance to young people. Observed declines in the importance of connections to nature are of particular importance to Canada.
Substance use
The percentages of students who report daily smoking continue to be very low. However, the use of e-cigarettes is a health risk behaviour that is of great concern. Further, we need to continue to monitor observed declines in cannabis use, especially given the recent changes in legislation.
Sexual health
Over time, fewer students are reporting having had sex and about two-thirds of those reported using condoms the last time they had sex. Ongoing healthy relationship education for Canadian youth will support their healthy sexual development.
Social media use
A small proportion of students report problematic social media use and a higher proportion report intensive social media use, but both increase with grade. Canadian students report frequent use of social media for homework and social connection, as well as gaming. Understanding the link between when the intensity of use becomes problematic is critical to support healthy engagement with social media.
Theme 1: The mental health and relationships of grade 9 and 10 girls are of great concern
Girls in grades 9 and 10 are consistently reporting the most negative health experiences relating to their mental health and relationships. For example, they have the highest levels of subjective health complaints, feeling hopeless, sad, nervous, and low confidence. In addition, high proportions of these girls report they feel their parents do not understand them, and they have low levels of teacher and friend support.
Theme 2: Positive relationships in homes and families matter
Positive relationships are a cause for celebration. The majority of students are reporting happy home lives and positive relationships with their mothers and fathers. These are well established as major protective factors for the health of young people (Craig & Pepler, 2014).
Theme 3: Profiles of risk-taking are changing
While young people report less engagement in many forms of risk-taking (e.g., cigarette smoking, sexual intercourse), engagement in other types of risk-taking and negative health behaviours may be on the rise and require future attention (e.g., electronic cigarette use/vaping, problematic social media use, and cyber-bullying).
Theme 4: Social media use is a growing public health issue among young people
Although social media can be used in positive ways to communicate, connect and engage with others, its use can also be negative, including exposure to cyber-bullying and symptoms of addiction. Although many students report intensive social media use and few report problematic social media use, levels of both increase with grade. Increased understanding of social media use can contribute to the promotion of healthy social media use and prevention of unhealthy use.
The last word: What adolescents in Canada told us
We engaged young people across Canada to provide reflections, context and insight to the HBSC findings presented in this report. In addition to the perspective(s) provided within individual chapters of this report, they identified several themes that clearly were of great contemporary importance to them. In this last section, we balance the four themes identified by the investigators with additional themes identified in these youth engagement sessions.
Youth engagement theme 1: Gendered roles and norms
In almost all of the youth engagement sessions, the issues of gender, gender norms, and their impacts on the health of adolescents were evident. Almost universally, participants identified various ways that gender can impact upon well-being, as well as the ways that gendered norms influence and create barriers for them as they grow and develop. There are many examples of this theme that emerged within a number of topics. For example, youth noted that both girls and boys struggle with weight stigma and body image, but there are different gendered ideals in terms of body shapes and sizes. Youth also talked about different social expectations for boys compared to girls in terms of participation in physical activity and organized sports. With respect to mental and spiritual health, youth told us that the social norm is that it is acceptable to acknowledge your feelings if you’re a girl, but that there is social stigma to acknowledging and expressing your feelings if you’re a boy. When reviewing the results on bullying and teen dating violence, youth felt that the higher levels of perpetration by males could be understood as “toxic masculinity” and the social norming of aggressive behaviours in boys compared to girls. These represent three of many examples of gendered roles and norms as a theme. This resonated with participants surrounding many different aspects of health, and this was noteworthy.
Youth engagement theme 2: Transitions to adulthood
Adolescence can be a challenging time of life as young people transition from childhood to young adulthood. This transition represents a second theme that emerged from the youth engagement sessions. While participants understood that becoming more independent is an important part of their development, they viewed the corresponding declines in support as problematic. Many reported feelings of disconnection from others, such as parents, associated with these transitions. Some also suggested that these transitions had notable impacts of their self-confidence and sense of well-being, making transitions to adulthood a second important theme that emerged from the voices of young people.
Youth engagement theme 3: Technology and social media
Consistent with what emerged from the survey findings, young people identified the influence of technology and social media on adolescent health as a third theme. Youth emphasized the existence of both positive and negative aspects of technology in their lives. They told us that technology provided an excellent way of staying connected, and much of this was beneficial. However, youth also talked about how spending too much time online was not a good thing, and the many different physical, mental and other problems that could result. The need for balance in the use of technology and social media was important to them.
Youth engagement theme 4: New and emergent risks
As a fourth youth engagement theme, participants identified that they are currently facing many new and emergent risks in their lives. Youth talked about risks associated with online environments and use of technology and social media (Youth Engagement Theme 3). A second emergent risk they identified was the use of e-cigarettes/vaping. While the percentage of students smoking cigarettes continues to be very low, the percentages of students vaping are increasing across all grades and genders. Youth had much to say about vaping, whether commenting on its trendiness and social acceptability, their reliance on vaping to cope with stress, how easy it was to access vapes, or the appeal of this vaping, as reinforced by advertising and social media. These represent prime examples of new types of health behaviours to be tracked, monitored and better understood in the future.
Unaddressed health issues
While participants in the youth engagement sessions had many positive comments about the HBSC study, they also noted some areas for improvements. These included the need for new and improved items on: (1) gender identity, so that the health of LGBTQ2+ youth and other marginalized groups could be studied; (2) perceived accessibility of resources and supports available to students; (3) healthy and unhealthy transitions to adulthood; (4) confidence and self-esteem; and (5) Colonialism and its impact(s) on youth health. These suggestions provide important considerations for future cycles of the HBSC study.
References
Craig, W., & Pepler, D. (2014). Trends in Healthy Development and Healthy Relationships. Public Health Agency of Canada.
Parachute. (2015). The cost of injury in Canada. Retrieved from https://parachute.ca/en/professional-resource/cost-of-injury-report/