Hepatitis B in Canada: 2005-2012


Download this article as a PDF (490 KB - 8 pages)
Published by: The Public Health Agency of Canada
Issue: Volume 40-13: Hepatitis B
Date published: July 10, 2014
ISSN: 1481-8531
Submit a manuscript
About CCDR
Browse
Volume 40-13, July 10, 2014: Hepatitis B
Surveillance
Hepatitis B surveillance in Canada: 2005-2012
Payne E1*, Totten S1, Laroche J2, Archibald C1
Affiliations
1 Public Health Agency of Canada, Centre for Communicable Diseases and Infection Control, Ottawa, ON
2 Public Health Agency of Canada, Centre for Immunization and Respiratory Infectious Diseases, Ottawa, ON
Correspondence
DOI
https://doi.org/10.14745/ccdr.v40i13a01
Abstract
Objective: To describe surveillance trends by age, sex and infection status of Hepatitis B (HB) virus in Canada between 2005 and 2012.
Methods: Data on acute and chronic HB cases reported to the Canadian Notifiable Disease Surveillance System were compiled at the national level to examine trends by age and sex over time. Time trends are presented from 2005 to 2012, corresponding to the availability of data differentiated by acute and chronic infection status.
Results: The rate of reported acute HB infections decreased from 1.0 to 0.6 per 100,000 between 2005 and 2012. Both sexes showed rate decreases over this time, although acute HB rates were consistently higher among males than females. The rate of reported chronic HB infections decreased from 14.1 to 12.0 per 100,000 between 2009 and 2012. These results are based on data in which infection status was specified. The proportion of unspecified cases in any given year may somewhat alter the results.
Conclusion: This is the first time that trends in reported cases and corresponding rates of HB in Canada have been examined by acute and chronic infection status using national surveillance data. Canada continues to have a downward trend in HB rates across Canada, most notably in acute HB cases. Increasing national capacity to differentiate between acute and chronic HB will facilitate a more thorough understanding of trends in transmission and of the burden of HB infection in Canada.
Introduction
Hepatitis B (HB) is an important clinical and public health issue worldwide. Globally, it is estimated that two billion people have been infected with HB virusFootnote 1 and approximately 400 million individuals are chronically infected carriersFootnote 2. Approximately 10% of infants infected at birth and over 90% of adults will recover completely from HB; in the rest, chronic HB infection develops, which may result in severe illness and premature deathFootnote 3. In 2011, acute HB infection was reported as the underlying cause of 43 deaths in Canada while chronic HB infection was reported as the underlying cause of 19 deathsFootnote 4. This may be an underestimate, as deaths attributable to chronic HB may have been coded as more proximal causes such as hepatocellular carcinoma or cirrhosis.
The rates of acute HB observed in Canada are low, and routine HB vaccination programs have undoubtedly contributed to this low rate. In Canada, all provinces and territories have had an HB vaccination program since the 1990sFootnote 5. Although programs differ by jurisdiction, all offer HB immunization to infants and/or school-aged childrenFootnote 6 and in some jurisdictions to individuals at increased riskFootnote 7,Footnote 8. In 2009, HB immunization coverage by the second birthday was estimated to be 69% in provinces and territories with a three-dose infant programFootnote 9. Coverage with at least two doses of the HB vaccine by the 17th birthday was 74.8% in 2011Footnote 10. In 2012, national HB immunization coverage was estimated at only 39.7% in the non-institutionalized adult population; however, approximately 64.9% of health care workers in close contact with patients had received the HB vaccineFootnote 11.
Diagnosis of HB requires laboratory confirmation by means of a blood sample to differentiate HB infection from other types of hepatitis. Infection markers present in the blood can also be used to distinguish between acute and chronic HB infection. Until recently, surveillance data reported to the Canadian Notifiable Disease Surveillance System (CNDSS) by most provinces and territories did not distinguish between acute and chronic HB infection, starting with data reported for 2005, a number of provinces and territories began reporting HB cases differentiated by acute and chronic infection status. The objective of this analysis was to describe surveillance trends by age, sex and infection status in Canada between 2005 and 2012.
Methods
Data sources
HB has been nationally notifiable since 1969; data on acute and chronic HB cases are reported to the CNDSS by provincial and territorial ministries of health, which in turn obtain data from local and regional health authorities. Most provinces and territories distinguish reported HB cases by infection status, namely acute, chronic and unspecified HB infection (refer to Table 1 for case definitions). Reporting of infection status by provinces and territories has increased over time; however, some cases are still reported without infection status. Only acute and chronic HB cases are analyzed in detail in this report, thus presented results are not inclusive of all HB cases reported to the CNDSS.
| Infection status | Case definitionFootnote 12 |
|---|---|
| Acute HB infection | HBsAg and anti-HBc IgM positive in the context of a compatible clinical history or probable exposure |
| Confirmed chronic HB infection | A person being HBsAg positive for more than 6 months |
| Unspecified HB infectionTable 1 - Footnote * | Serologic profile not in line with either acute or chronic case definition and HBsAg positive |
|
|
Analysis
Descriptive analysis of HB infection by year, age group and sex was conducted using data reported to the CNDSS. Analyses are presented separated by acute and chronic HB infection status, and rates are given per 100,000 population. Rates, percentages, and percent change in rates were calculated using unrounded numbers, thus presented rounded numbers may not sum to the total. Population data for the calculation of rates were provided by Statistics Canada, Demography Division, Demographic Estimates Section. The following estimates were used: for 2005, final intercensal estimates; for 2006-2009, final postcensal estimates; for 2010-2011, updated postcensal estimates; and for 2012; preliminary postcensal estimates.
In order to examine trends over time, HB analyses were restricted to provinces and territories that consistently provided acute and/or chronic HB data to the CNDSS over the entire time frame used. Acute HB analysis for the time period 2005 to 2012 involved data from British Columbia, Alberta, Saskatchewan, Manitoba, Ontario, Quebec, New Brunswick, the Yukon and the Northwest Territories. In some provinces and territories, chronic HB did not become reportable until recent years; it remains non-reportable in Ontario. Reporting of chronic HB infection became more consistent in 2009; thus, trend analysis of chronic HB was restricted to 2009 to 2012. It includes data from British Columbia, Alberta, Saskatchewan, Quebec, New Brunswick and Nova Scotia. Two provinces (Newfoundland and Labrador and Prince Edward Island) provided exclusively unspecified HB data over the entire reporting period and thus are not reflected in any of the national-level analyses presented here.
Demographic patterns (age and sex) were examined for cases of HB reported in 2012 to provide a more detailed snapshot of the most recent available data. In these analyses, all provinces and territories that reported HB cases for that year were included; thus, in 2012, data on acute HB cases from Nova Scotia and on chronic HB cases from Manitoba and Yukon were also included.
Results
Acute HB infection
Trends over time
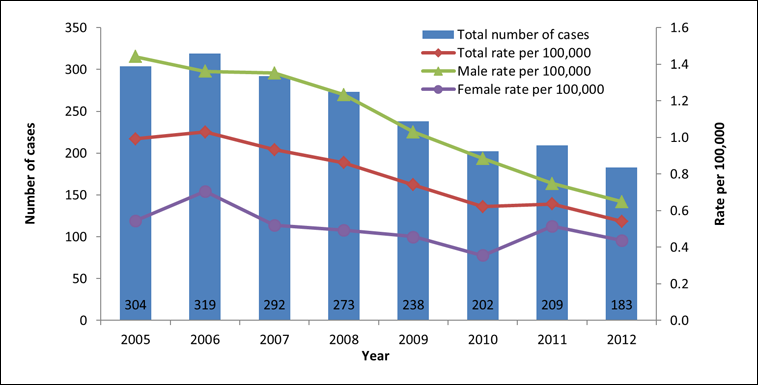
The total rate of reported cases of acute HB infection decreased steadily between 2005 and 2012. In 2005, a total of 304 cases of acute HB infection were reported, corresponding to an overall rate of 1.0 per 100,000. In 2012, 183 cases were reported, which represents a rate of 0.6 per 100,000 (Figure 1).
Between 2005 and 2012, rates of reported cases of acute HB were consistently higher among males than females, although the gap between the sexes narrowed over time. Though rate decreases were observed over time in both sexes, males showed a greater decrease (53.8% for males versus 19.8% for females) (Figure 1).
Figure 1. Reported number of cases and rates of acute HB infection in CanadaFootnote * by sex,
CNDSS, 2005-2012

Text Equivalent - Figure 1
Figure 1 is a bar and line graph of the reported number of cases and rates of acute hepatitis B infection in Canada between 2005-2012. A footnote identifies that this is based on data from British Columbia, Alberta, Saskatchewan, Manitoba, Ontario, Quebec, New Brunswick, Yukon and Northwest Territories. The y axis represents the number of cases on the left hand side and the rate per 100,000 on the right hand side. The x axis represents time. The number of cases is represented by bars. There were 304 reported cases of acute HBV infection in 2005, 319 reported cases in 2006 and then the numbers progressively declined to 2012 with 183 reported cases. The rates per 100,000 population are represented by three lines going across the bar data, one for the male rate, one for the female rate and one for the total rate. The male rate per 100,000 is higher for all years than the female rate, ranging from a high over 1.4 per 100,000 in 2005 to a rate a little over 0.6 per 100,000 in 2012. The female rate peaked in 2006 at approximately 0.7 per 100,000 in 2006 to a low less than 0.4 per 100,000 in 2010. The female rate increased in 2011 to slightly more than 0.5 per 100,000 in 2011 then dropped slightly to a little more than 0.4 per 100,000 in 2012. The total rate was consistently between the higher male and lower female rates.
Trends by age group and sex
Between 2005 and 2012, the rates of reported cases of acute HB among males decreased across all age groups. There were consistently fewer acute HB cases reported in males less than 25 years of age, corresponding to rates of 1.0 per 100,000 or less in the younger age groups for all years. In 2005, males aged 30 to 39 years had the highest rate of reported acute HB infection at 3.1 per 100,000. In 2012, this rate had decreased to 1.5 per 100,000. A large decrease in rates was also observed among males aged 40 to 59 during this period, from 2.2 to 0.9 per 100,000 (data not shown).
Among females, both increases and decreases in rates of reported cases of acute HB were observed between 2005 and 2012. Most changes in rates were marginal, with the exception of females in the 20 to 24 age group whose rate decreased by 71.8%, from 1.3 to 0.4 per 100,000. Few cases were reported among females, especially in the younger age groups (< 30 years). Continued monitoring of subsequent years of data will be useful in identifying any emerging trends among females.
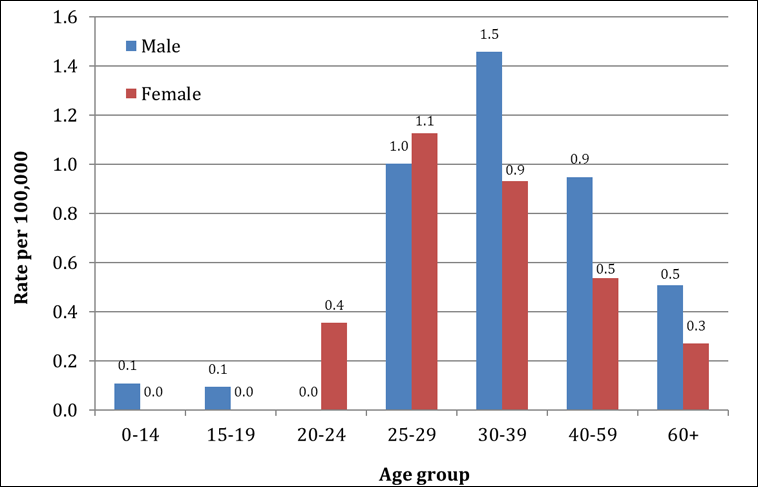
In 2012, the highest rate of reported cases of acute HB infection was observed among males in the 30 to 39 age group (1.5 per 100,000), followed by females in the 25 to 29 age group (1.1 per 100,000). Overall, for both sexes rates of acute HB were higher among those aged 25 to 59 years and lower among both younger (< 20 years) and older (> 60 years) age groups (Figure 2).
Figure 2. Rates of reported cases of acute HB in CanadaFootnote * by age group and sex, CNDSS, 2012

Text Equivalent - Figure 2
Figure 2 is a histogram of the rates of reported cases of acute hepatitis B infection in Canada by age group and sex for 2012. A footnote identifies that this includes data from British Columbia, Alberta, Saskatchewan, Manitoba, Ontario, Quebec, New Brunswick, Nova Scotia, Yukon and Northwest Territories. The y axis represents the rate per 100,000 on the left hand side and ranges from 0 to 1.6. The x axis represents age in years and ranges from 0 to 60+. The rate per 100,000 in each age group is represented by bars with different colored bars for males and females. The highest rate is for males is 1.5 in the 30-39 year age group. The highest rate for females is 1.1 in the 25-29 year age group; it is one of only two age groups where the female rate is slightly higher than the male rate (at 1.0). In the 0-14 and 15-19 age groups the rate per 100,000 is 0.1 for males and 0 for females. In the 20-24 age group the rate is 0 for males and 0.4 for females. The rate per 100,000 begins to decrease after the 30-39 year age group. In the 60+ age group the rate is 0.5 in males and 0.3 in females.
Chronic HB infection
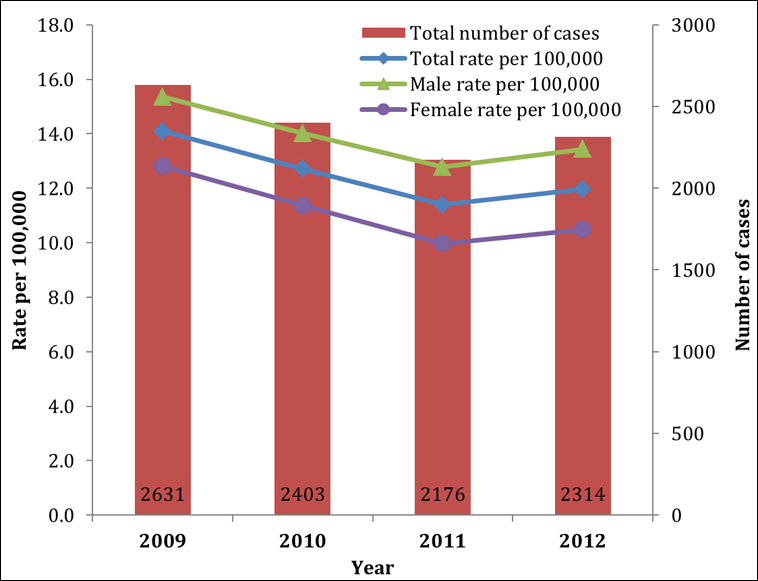
There was some variation in the rate of reported cases of chronic HB infection between 2009 and 2012, but the overall trend was a decrease over this time frame. In 2009, a total of 2,631 cases of chronic HB were reported, corresponding to an overall chronic HB rate of 14.1 per 100,000. In 2012, there were 2,314 cases, resulting in a rate of 12.0 per 100,000. Between 2009 and 2012, chronic HB rates were consistently higher among males as compared with their female counterparts, though rate increases and decreases were observed in both sexes (Figure 3).
Figure 3. Reported number of cases and rates of chronic infection in CanadaFootnote * by sex, CNDSS, 2009-2012

Text Equivalent - Figure 3
Figure 3 is a bar and line graph of the reported number of cases and rates of chronic hepatitis B infection in Canada between 2009-2012. A footnote identifies that this is based on data from British Columbia, Alberta, Saskatchewan, Quebec, New Brunswick, and Nova Scotia. The y axis represents the number of cases on the right hand side and the rate per 100,000 on the left hand side. The x axis represents time. The number of cases is represented by bars. There were 2631 reported cases of chronic HBV infection in 2009. This decreased over the next two years to a low of 2176 reported cases in 2011 and then increased slightly in 2012 to 2314 reported cases. The rates per 100,000 population are represented by three lines going across the bar data, one for the male rate, one for the female rate and one for the total rate. The male rate per 100,000 is higher for all years than the female rate, with a high over 15 per 100,000 in 2009 to a rate of approximately 13 per 100,000 in 2011 and then a slight increase to approximately 14 per 100,000 in 2012. The total rate was consistently between the higher male and lower female rates and the difference between the male and female rates remain stable over time. The female rate peaked in 2009 at rate a little less than 13 cases per 100,000 in 2009 to a low of 10 per 100,000 in 2011. The female rate increased slightly in 2012.
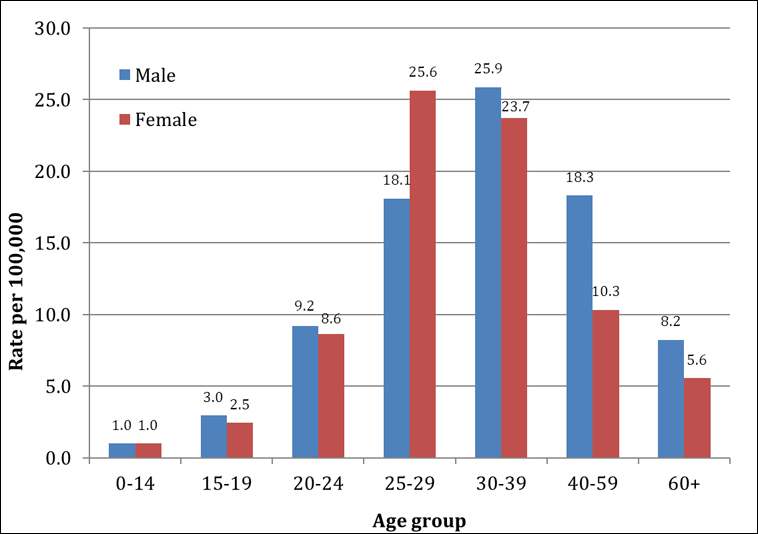
In 2012, rates of reported chronic HB for all age groups were higher among males than females, with the exception of the 25 to 29 age group, in which the reverse was found. Overall, the highest rates of reported cases of chronic HB in 2012 were observed among males in the 30 to 39 age group, followed by females in the 25 to 29 age group (25.9 and 25.6 per 100,000 respectively). In 2012 rates were higher among individuals between the ages of 20 and 59, with lower rates observed in both males and females of younger (< 20 years) and older (> 60 years) age groups (Figure 4).
Figure 4. Rates of reported cases of chronic HB in CanadaFootnote * by age group and sex, CNDSS, 2012

Text Equivalent - Figure 4
Figure 4 is a histogram of the rates of reported cases of chronic hepatitis B infection in Canada by age group and sex for 2012. A footnote identifies that this includes data from British Columbia, Alberta, Saskatchewan, Manitoba, Quebec, New Brunswick, Nova Scotia, and Yukon. The y axis represents the rate per 100,000 on the left hand side and ranges from 0 to 30. The x axis represents age in years and ranges from 0 to 60+. The rate per 100,000 in each age group is represented by bars with different colored bars for males and females. The highest rate is 25.9 per 100,000 for males in the 30-39 year age group compared with a rate of 23.7 per 100,000 for females. The highest rate for females is 25.6 in the 25-29 year age group; it is the only age groups where the female rate is higher than the male rate (at 18.1). In the 0-14 age group the rate per 100,000 is equal at 1.0 for males and females. It then increases progressively for the described 25-29 and 30-39 age groups and then declines progressively to the 60+ age group where the rate is 8.2 in males and 5.6 in females.
Discussion
This is the first time that trends in reported cases and corresponding rates of HB in Canada have been examined by acute and chronic infection using national surveillance data. It provides insights into general trends, based on the provinces and territories that were able to report data on HB infection status to the CNDSS.
Acute HB cases offer valuable insight into current transmission trends and patterns in Canada. There was a 45% decrease in the rate of reported acute hepatitis cases in Canada over the reporting period, These low rates may be attributable to the implementation of routine HB immunization. Children who received HB vaccine in the early 1990s when routine HB immunization programs first started have now reached adulthood. As an increasing proportion of the Canadian population is covered by HB immunization, it is reasonable to expect continued decreases in acute HB rates.
It is not surprising that similar decreases were not seen in the number of chronic HB infections. Although chronic HB infection rates are generally low in the general Canadian population, high rates have been documented among people born outside Canada. It has been estimated that approximately 4% of immigrants in Canada are chronically infected with HBFootnote 13.
Declining rates of acute HB have been similarly observed in countries with comparable population structure, health status and public health infrastructure, as evidenced by data from routine and/or enhanced surveillanceFootnote 14-17. With respect to chronic HB infection, Canadian rates were considerably lower than those observed in other countries, though cross-country comparison is difficult because of differences in reporting practicesFootnote 14,Footnote 16.
Limitations
These findings need to be interpreted in light of several limitations. First, the data are based on the number of reported cases; changes in provincial/territorial diagnostic and reporting practices may affect trends. By limiting our analysis to time periods and jurisdictions for which reporting was consistent, we have attempted to mitigate these effects. Additionally, when rates are based on small numbers of reported cases, they are more prone to fluctuations over time.
Second, the observed rates may be an underestimate of true HB incidence, possibly as a result of underdiagnoses of subclinical or mildly symptomatic cases. According to results from the Community Health Measures Survey, only 46% of Canadian respondents who tested positive for a current HB infection reported that they had been diagnosed with HBFootnote 18. Cases of chronic HB in Canada reported here are known to be an underestimate because of the unavailability of chronic HB data from Ontario, where a significant proportion of the Canadian population reside, many of whom are immigrants from countries where HB is endemicFootnote 19. A recent assessment of liver disease estimated that approximately 50% of individuals with chronic HB in Canada reside in OntarioFootnote 20.
Third, longer-term trends of chronic HB in Canada cannot be examined, as only a few provinces and territories reported chronic HB data before 2009.
Fourth, as only acute and chronic HB cases are analyzed in detail in this report, the findings are not inclusive of all HB cases reported to the CNDSS; infection status cannot be determined for all HB cases, In 2012, 737 (22.6%) of the 3,262 HB cases reported nationally did not specify infection status. These unspecified cases could contribute to higher rates for either acute or chronic cases if infection status could be determined.
Finally, the data are limited to analysis by age, sex and infection status. At this time, there are no additional data elements in the CDNSS that could explain observed trends. Consequently, it is not clear what proportion of reported HB infections is due to importation of cases through immigration from endemic countries, injection drug use or high-risk sexual practices.
Conclusion
From a public health planning and policy development perspective, it is important to identify populations disproportionately affected by HB as well as the factors associated with transmission of infection. Surveillance, supported by research that examines factors affecting observed trends, could contribute to the development and amelioration of tailored HB interventions in Canada.
Acknowledgements
The authors would like to acknowledge the participation of health care providers, public health officials and laboratories, and the provinces and territories involved in the routine reporting of HB.
We would also like to acknowledge and thank Rachel MacLean for her contribution to HB surveillance at the Public Health Agency of Canada.
Conflicts of interest
No conflicts of interest to declare.
Page details
- Date modified: