
Surveillance reporting guide, 2015

 Download this article as a PDF (695 KB - 3 pages)
 Published by: The Public Health Agency of Canada
Issue: Volume 41-4: Scientific writing
Date published: April 2, 2015
ISSN: 1481-8531
Submit a manuscript
About CCDR
Browse
Volume 41-4, April 2, 2015: Scientific writing
Scientific writing
Surveillance summary reporting guide
Correspondence
DOI
https://doi.org/10.14745/ccdr.v41i04a03
Surveillance reports provide essential information about a disease or health-related condition according to person, time and place. They often provide the basis to identify burden of illness and may include related information, such as trends in risk factor frequency or prescribing practices. Surveillance reports inform strategies to address targeted health conditions and may identify the need for additional clinical care or public health action. They can be summaries of larger reports published in the grey literature and, increasingly, may link to a complete surveillance dataset. Surveillance reports are approximately 2,000-2,500 words in length - excluding the abstract, tables and references.
The Canada Communicable Disease Report (CCDR) supports the use of reporting guidelines, including those collected by the Enhancing the QUAlity and Transparency Of health Research (EQUATOR) NetworkNote 1. However, the EQUATOR Network does not currently provide a guideline for surveillance reports, so the CCDR has developed this one based on other checklists, a guidelines for evaluating surveillance systemsNote 2 and recent trends in Open Science.
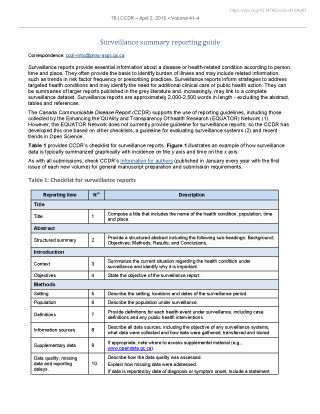
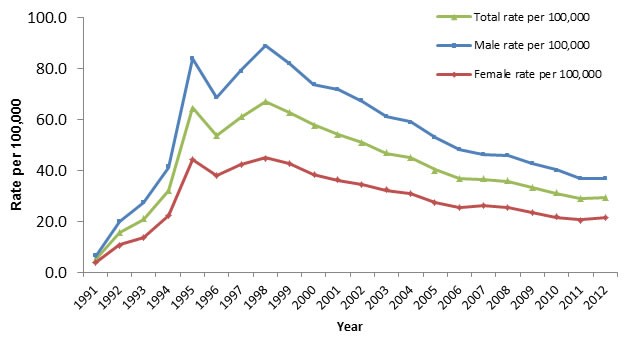
Table 1 provides CCDR's checklist for surveillance reports. Figure 1 illustrates an example of how surveillance data is typically summarized graphically with incidence on the y axis and time on the x axis.
As with all submissions, check CCDR's Information for authors (published in January every year with the first issue of each new volume) for general manuscript preparation and submission requirements.
| Reporting item | No1Table 1 footnote 1 | Description |
|---|---|---|
| Title | ||
| Title | 1 | Compose a title that includes the name of the health condition, population, time and place. |
| Abstract | ||
| Structured summary | 2 | Provide a structured abstract including the following sub-headings: Background; Objectives; Methods; Results; and Conclusions. |
| Introduction | ||
| Context | 3 | Summarize the current situation regarding the health condition under surveillance and identify why it is important. |
| Objectives | 4 | State the objective of the surveillance report. |
| Methods | ||
| Setting | 5 | Describe the setting, locations and dates of the surveillance period. |
| Population | 6 | Describe the population under surveillance. |
| Definitions | 7 | Provide definitions for each health event under surveillance, including case definitions and any public health interventions. |
| Information sources | 8 | Describe all data sources, including the objective of any surveillance systems, what data were collected and how data were gathered, transferred and stored. |
| Supplementary data | 9 | If appropriate, note where to access supplemental material (e.g., www.opendata.gc.ca). |
| Data quality, missing data and reporting delays. | 10 | Describe how the data quality was assessed. Explain how missing data were addressed. If data is reported by date of diagnosis or symptom onset, include a statement about whether the data for the most recent periods may be revised. |
| Data analysis | 11 | Describe any analytical methods used providing sufficient detail to enable a knowledgeable reader with access to the original data to judge its appropriateness and to assess the reported results. |
| Results | ||
| Descriptive data | 12 | Provide a summary of the descriptive data, including demographics. |
| Data Quality | 13 | Report on data quality (e.g., completeness, missing data, under reporting,) |
| Analytic data | 14 | Provide a summary of the analysis including (when indicated) estimates of trends. When applicable, point estimates should include appropriate indicators of measurement error such as 95% confidence intervals (e.g., average annual percentage change used to describe trends or odds ratios used to describe subgroup differences). |
| Figures | 15 | Create the minimum number of figures to highlight key results. Create a title that includes person, time and place. |
| Discussion | ||
| Key results | 16 | Summarise key results with reference to study objectives |
| Comparison | 17 | Consider these findings in relation to the current literature. |
| Strengths and weaknesses | 18 | Discuss strengths and weaknesses of the study (data quality, completeness, sources of potential bias). |
| Interpretation and generalizability | 19 | Provide a cautious overall interpretation of results considering objectives, limitations, multiplicity of analyses, results from similar studies and other relevant evidence. |
| Conclusion | 20 | Ensure conclusions address objective and follow from the results. |
Figure 1: Rates of reported cases of Hepatitis C in CanadaFigure 1 footnote 1 by sex, CNDSSFigure 1 footnote 2, 1991-2012Note 3
Text description: Figure 1
Figure 1: Rates of reported cases of Hepatitis C in CanadaFigure 1 footnote 1 by sex, CNDSSFigure 1 footnote 2, 1991-2012Note 3
| Year | Total rate per 100,000 | Male rate per 100,000 | Female rate per 100,000 |
|---|---|---|---|
| 1991 | 5.2 | 6.4 | 3.9 |
| 1992 | 15.6 | 20.2 | 10.9 |
| 1993 | 20.8 | 27.3 | 13.9 |
| 1994 | 32.0 | 41.3 | 22.2 |
| 1995 | 64.5 | 83.9 | 44.4 |
| 1996 | 53.6 | 68.6 | 38.1 |
| 1997 | 60.9 | 79.0 | 42.5 |
| 1998 | 66.9 | 88.9 | 45.0 |
| 1999 | 62.7 | 81.8 | 42.9 |
| 2000 | 57.8 | 73.7 | 38.3 |
| 2001 | 54.3 | 71.5 | 36.2 |
| 2002 | 50.9 | 67.2 | 34.5 |
| 2003 | 46.8 | 61.1 | 32.3 |
| 2004 | 45.2 | 59.0 | 30.9 |
| 2005 | 40.3 | 53.1 | 27.5 |
| 2006 | 36.9 | 48.1 | 25.5 |
| 2007 | 36.6 | 46.2 | 26.2 |
| 2008 | 35.8 | 45.7 | 25.5 |
| 2009 | 33.3 | 42.7 | 23.3 |
| 2010 | 31.1 | 40.2 | 21.6 |
| 2011 | 28.9 | 36.8 | 20.7 |
| 2012 | 29.3 | 36.8 | 21.5 |
Page details
- Date modified: