
Monitoring pertussis in Nova Scotia, 2015

 Download this article as a PDF (1.5 MB - 7 pages)
Published by: The Public Health Agency of Canada
Issue: Volume 43-2: Sexually transmitted infections
Date published: February 2, 2017
ISSN: 1481-8531
Submit a manuscript
About CCDR
Browse
Volume 43-2, February 2, 2017: Sexually transmitted infections
Implementation science
Use of a 40-day rolling incidence to monitor pertussis in Nova Scotia, 2015
J Born1,2*, A Coombs1,4, V Ryan2, M LaFreniere2,3, L Earle2, S Fleming2, A Fitzgerald2, F Atherton2
Affiliations
1 Centre for Public Health Infrastructure, Public Health Agency of Canada, Ottawa, ON
2 Department of Health and Wellness, Halifax, NS
3 Centre for Communicable Diseases and Infection Control, Public Health Agency of Canada, Ottawa, ON
4 Nova Scotia Health Authority, Kentville, NS
Correspondence
Suggested citation
Born J, Coombs A, Ryan V, LaFreniere M, Earle L, Fleming S, Fitzgerald A, Atherton F. Use of a 40-day rolling incidence to monitor pertussis in Nova Scotia, 2015. Can Commun Dis Rep. 2017;43(2):49-55. https://doi.org/10.14745/ccdr.v43i02a03
Abstract
Background: Pertussis can cause a serious respiratory bacterial infection, especially in infants. Between January 1 and December 31, 2015, there was an increase in the number of reported pertussis cases in Nova Scotia (NS). Surveillance practices for pertussis in NS were challenging because immunization coverage data are not available and rate information was neither timely nor precise with respect to geography. Public health officials in NS decided to adopt a new surveillance technique to inform public health actions across the Province.
Objective: To assess the use of a 40-day rolling incidence rate to monitor pertussis activity in Nova Scotia.
Intervention: A 40-day rolling incidence rate was calculated for pertussis by age groups and various levels of geography. Public health authorities continued to anticipate new cases of pertussis if the contacts of known cases were still within the incubation period (range between six and 20 days). The 40-day incubation period was chosen to reflect twice the incubation period’s upper range. Rates were calculated using Statistics Canada population projections for 2014 and then compared with traditional case counts and cumulative incidences. The usefulness of the statistics was assessed by public health decision makers.
Outcomes: Increased pertussis activity was noted across NS, most notably in the South West region. The use of a 40-day rolling incidence rate as a surveillance tool provided more timely and geographically precise descriptions of ongoing trends in pertussis activity and helped to inform appropriate public health action. Health officials valued the information provided from the rolling incidence because it allowed them to manage activities based on weekly estimates at various levels of geography.
Conclusion: Rolling incidence proved to be a useful tool to monitor a cyclical increase in pertussis cases in Nova Scotia and to inform related public health actions. The rolling incidence provided geographically precise and timely information that was useful to estimate new cases in the absence of reliable immunization coverage information. This method could supplement traditional epidemiological surveillance of future communicable disease events, especially those characterized by long incubation periods and low case counts.
Introduction
Pertussis (whooping cough) is a highly contagious respiratory infection caused by Bordetella pertussis bacteria. It is endemic in the human population and challenging to control in part due to a long communicable period (six to 20 days) Footnote 1Footnote 2Footnote 3 under-immunization of the population and evidence of waning vaccine immunity. Illness may be particularly severe in children under 12 months Footnote 1 with complications including pneumonia, seizures, encephalopathy, hernias and death Footnote 4. Milder forms of the disease may manifest in adults and adolescents who are less likely to be diagnosed and treated Footnote 5Footnote 6. Evidence suggests that children are falling behind in immunizations Footnote 7Footnote 8 and immunity post vaccination may wane over time Footnote 9Footnote 10 creating a vulnerable population that contributes to an ongoing reservoir of pertussis in humans Footnote 11Footnote 12.
Pertussis activity can be cyclical in nature Footnote 13Footnote 14Footnote 15. Between January 1 and December 31, 2015, Nova Scotia (NS) experienced an increase in the number of pertussis cases. This triggered a need to more closely monitor and analyze pertussis activity within the Province. The structure of the health system in NS comprises two health authorities, the Nova Scotia Health Authority (NSHA) (subdivided into four local management zones) and the Izaak Walton Killam (IWK) Health Authority. In line with recommendations from Canada and the World Health Organization for pertussis surveillance Footnote 16Footnote 17 notifiable disease data is reported monthly at the zone and provincial levels and on an annual basis at the provincial level.
During the 2015 pertussis outbreak, monthly and annual surveillance reports did not fully meet the information needs of local public health authorities to respond to the increase in the number of pertussis cases. Given that NS is a small province (total population less than one million), frequently reporting on pertussis activity (e.g. weekly) and by health zone (or lower level geographies) presents challenges due to small case counts. Findings are statistically less reliable when disease events are rare Footnote 18 and reporting low counts may threaten confidentiality, especially in smaller populations Footnote 19Footnote 20.
To mitigate the challenges presented by small numbers, other options were considered. The year-to-date cumulative incidence was considered problematic as it did not accurately reflect current disease activity. Because cumulative incidence was calculated with a static denominator, the trend line simply increased weekly so it did not reveal increases or decreases from week to week. The attack rate was also considered, but poor immunization coverage data made it difficult to quantify the susceptible populations.
Public health authorities decided to try a 40-day rolling incidence rate. The 40-day interval was chosen to conservatively reflect twice the upper range of the six to 20-day incubation period. Rolling estimates have been used in outbreak situations Footnote 21 often in the form of an arbitrary five year rolling average to define normal activity or establish baselines for comparisons. To the best of the authors’ knowledge, this is the first documented use of a rolling incidence rate developed to reflect disease specific qualities (i.e. incubation period) and to anticipate disease activity.
The objective of this article is to describe the first use of a 40‑day rolling incidence rate to monitor pertussis activity and to assess whether this method assisted in guiding public health action. This method supplemented routine surveillance during an increase in pertussis activity in NS between January 1 and December 31, 2015.
Intervention
Data sources
Confirmed pertussis cases reported based on episode date
The Application for Notifiable Disease Surveillance (ANDS) was used for ongoing surveillance of NS pertussis cases that met the provincial case definitions (confirmed, probable and suspect) Footnote 22. Demographic information (including age and geographical area of residence) were also extracted from ANDS using COGNOS, a commercial software extraction, analysis and reporting package. This information was used to calculate the number of confirmed pertussis cases based on reported episode date by month and geographical area. Episode date most often referred to the onset date of symptoms. Clinical diagnosis date was used if onset date was unavailable and specimen collection date was used if neither onset date nor clinical diagnosis date were available. Lab test result date was used only when no other dates were available Footnote 23.
Data analysis
Traditional statistics
Cases reported between January 1, 2015 and December 31, 2015, were extracted monthly from ANDS using COGNOS. Traditional statistics including monthly counts and rate per 100,000 were calculated monthly for the Province overall and by zones.
Rolling incidence
Retrospective cases from 2015 and the last 40 days of 2014 were used to calculate the 40-day rolling incidence rates for all of 2015 (based on episode date). Confirmed cases reported between November 21, 2014 and December 31, 2015 were extracted from ANDS using COGNOS and used to calculate the 40-day rolling incidence rates for 2015.
For each calendar day in 2015, the incidence of pertussis was calculated for the previous 40-days using the reported episode date. The 40-day incidence rate was chosen because it represented twice the outer range of days for the typical incubation for pertussis (range 6-20 days) Footnote 1Footnote 3. Based on an average maximum incubation period of 20 days, a case and any relevant contacts were considered non-infectious 40 days the from the episode date of the case.
Rolling incidence (MI) was defined as the sum of cases (A) over the previous n days divided by the person-time (PT) (mathematical equation available upon request).
Populations were assumed to be static and all at risk, thus each person in the respective populations contributed one unit of time to the denominator. The rolling incidence was calculated for each calendar day (t) by summing the number of pertussis cases (A) within the previous 40-days over the person-time. Rates were calculated in Stata Footnote 24 using 2014 demographic data from Statistics Canada Footnote 25. Rates per 100,000 population were calculated at different geographies, including four provincial health management zones and the South West geographic area – a sub-section of the Western Zone that concerned local health officials.
Assessing the usefulness of traditional methods and the 40-day rolling incidence rate
The rolling incidence methods were developed through an iterative process. To supplement monthly and annual reporting, the Population Health Assessment and Surveillance team (PHAS) first created a weekly report that included pertussis case counts by zone and age groups. This data was disseminated to public health staff, Medical Officers of Health (MOHs), epidemiologists and communicable disease managers at the provincial Department of Health and Wellness (DHW) and local (NSHA) levels of the public health system. The rolling incidence rate was developed as an additional statistic based on the feedback received from public health stakeholders. Throughout 2015, the PHAS team not only collected stakeholder feedback with respect to the usefulness of the weekly information but also summarized the usefulness of the rolling incidence rate to inform public health action.
Outcomes
Pertussis activity
One hundred thirty-six (136) cases of pertussis were reported in NS between January 1 and December 31, 2015. Of those, 105 (76.5%) met the case definition for a confirmed case based on laboratory confirmation or an epidemiological link to a laboratory confirmed case, 10 (7.4%) were probable cases and 21 (15.4%) were suspect cases. The cases ranged in age from 0 to 62 years, with a mean age of 15.6 years. The highest proportion of cases was reported in individuals 20 years and older, while the highest cumulative incidence rate occurred in those under five years (Table 1). By December 31, 2015, the provincial cumulative incidence rate was 11.2 per 100,000 population (Table 1).
| Age group (years) | South WestTable 1 - Footnote 1 | Heath management zone | Population | CITable 1 - Footnote 2 | ||||
|---|---|---|---|---|---|---|---|---|
| Eastern | Western | Northern | Central | Total | ||||
| 0-4 | 9 | 4 | 12 | 1 | 13 | 30 | 39,271 | 76.4 |
| 5-9 | 8 | 3 | 11 | 1 | 5 | 20 | 43,825 | 45.6 |
| 10-14 | 6 | 0 | 6 | 4 | 5 | 15 | 45,850 | 32.7 |
| 15-19 | 7 | 1 | 7 | 1 | 0 | 9 | 54,060 | 16.6 |
| 20+ | 16 | 3 | 16 | 3 | 9 | 31 | 755,819 | 4.1 |
| Total | 46 | 11 | 52 | 10 | 32 | 105 | n/a | n/a |
| Population | 56,352 | 165,727 | 196,648 | 154,834 | 421,616 | n/a | 938,825 | n/a |
| CITable 1 - Footnote 2 | 81.6 | 6.6 | 26.4 | 6.5 | 7.6 | n/a | n/a | 11.2 |
Cases were reported from all four provincial health management zones: 9.5% (Northern), 10.5% (Eastern), 30.5% (Central) and 49.5% (Western). The highest cumulative incidence (26.4 per 100,000) in the Province was reported in the Western Zone with 43.8% of the provincial cases in South West. By the end of 2015, the annual incidence rate of pertussis in the South West was 81.6 per 100,000.
Comparing the different surveillance tools
Traditional methods were reported monthly. They showed that the number of cases first peaked in May, 2015 and began to drop after September, 2015. A maximum of 20 confirmed cases were reported monthly (Figure 1) with an average of 2.0 cases per week during 2015 (range of 0 to 7 cases). At the zone level, there was an average of 0.2, 1.0, 0.2 and 0.6 cases per week for the Eastern, Western, Northern and Central Zones, respectively. Feedback from public health stakeholders highlighted difficulties in stratifying and contextualizing these low case counts. Additionally, they reported difficulty identifying temporal trends by zones or smaller geographic areas using only counts. Based on feedback, weekly 40-day rolling incidence rate graphics were created for various levels of geography (province, zones, area) and age groups.
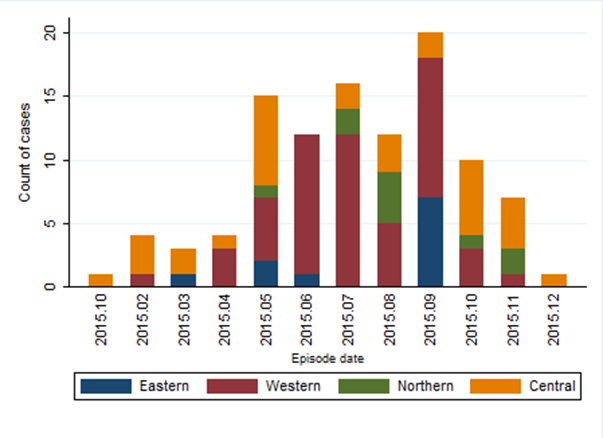
Figure 1: Monthly counts of confirmed pertussis cases by health management zone reported in Nova Scotia between January 1 and December 31, 2015
Text description: Figure 1
Figure 1: Monthly counts of confirmed pertussis cases by health management zone reported in Nova Scotia between January 1 and December 31, 2015
Figure 1 is a histogram that shows cases case counts distributed by month and zone for pertussis case reported in Nova Scotia in 2015. The x axis represents the date of symptom onset of the cases, ranging from January to December 2015. The y axis measures the count of confirmed pertussis case ranging from 0 at origin to 20. Within each bar of the histogram for each zone is differentiated with shadings for Eastern (blue), Western (red), Northern (green) and Central (amber). The number of cases first peaked with 15 cases in May, 2015 and began to drop after September, 2015. A maximum of 20 confirmed cases were reported monthly (in September 2015). Initially the majority of cases were reported in the Central real zone. Yet, between April and September, 2015, cases from Western outnumbered Central. Cases from Central were the majority from October-December 2015.
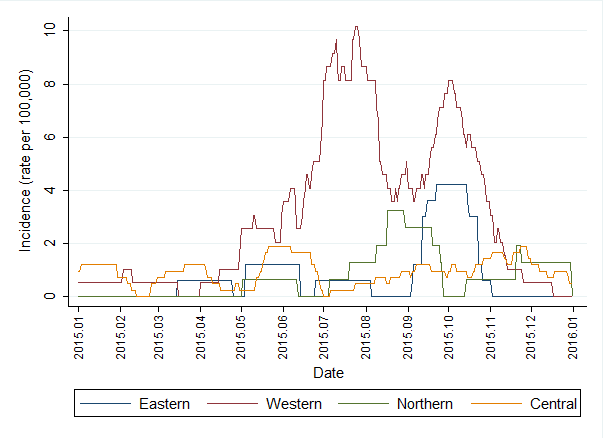
Following the implementation of the 40-day rolling incidence rate into weekly reporting, stakeholders reported that the new format was useful because it was much more timely than monthly reporting. The 40-day rolling incidence statistic provided clear and contextual representation of disease activity within each zone, when compared to weekly case counts. This statistic was useful to explore temporal trends in zonal and sub-zonal areas within NS not possible with count data. For example, over time, cases from the Western Zone (Figure 2) produced a bimodal pattern with rolling incidence peaks in July and again in October 2015. Cases in the Eastern Zone followed a single wave, which peaked in October, while cases in the Northern Zone, increased earlier and peaked in August. Weekly counts were also limited in their usefulness because they could not account for the variation in population sizes across zones or age groups. Weekly case counts of pertussis in the Central Zone were relatively high compared to other zones, likely because of the large population. However, the rolling incidence statistic could contextualize pertussis activity and the resulting analysis demonstrated that activity in the Central Zone was generally lower and more sporadic, without the clear large peaks observed in other zones.
Figure 2: Rolling 40-day incidence calculated per 100,000 population of confirmed pertussis cases by health management zone in Nova Scotia, 2015
Text description: Figure 2
Figure 2: Rolling 40-day incidence calculated per 100,000 population of confirmed pertussis cases by health management zone in Nova Scotia, 2015
Figure 2 contains plots of 40-day rolling incidence rates calculated for each day in 2015 by zone. The x axis represents continuous time ranging from 1 January to 31 December 2015. The y axis measures the 40-day rolling average of confirmed pertussis cases presented per 100,000. The incidence ranged from 0 at origin to 10 per 100,000. Separate plots are presented for each zone: Western (red), Eastern (blue), Northern (green) and Central (amber). The Western Zone presented the highest 40-day incidence, peaking at slightly over 10 per 100,000 in mid July. The 40-day incidence in Eastern Zone peaked around 4 per 100,000 in October. The 40-day incidence in the Northern Zone peaked around 3.5 per 100,000 in mid August. The 40-day incidence in Central zone was highest in May and June with a maximum of around 2 per 100,000. Over time, the 40-day incidence in the Western Zone showed a bimodal pattern that peaked in July and again in October, 2015. The 40-day incidence in Eastern Zone followed a single wave, that peaked in October, 2015. The 40-day incidence in Northern Zone peaked in August, 2015. The 40-day rolling incidence activity in the Central Zone was generally lower than in the other zones with no clear large peaks, as were observed in other zones.
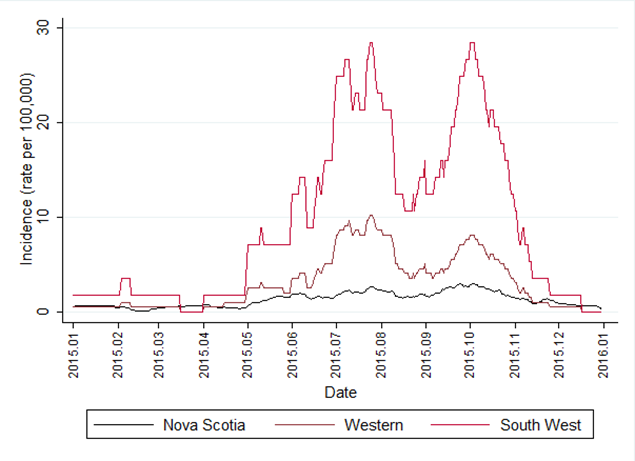
By July 1, 2015, the provincial year-to-date cumulative incidence rate for pertussis was 4.2 per 100,000 population; 10.2 per 100,000 in the Western Zone and 31.9 per 100,000 in the South West area. Stakeholders requested a statistic that was more reflective of the current activity level, as weekly case counts or annual cumulative incidence rates were not useful to inform the implementation of interventions across various geographic levels. Case counts were too small to provide meaningful comparisons as they were not adjusted for population size, while annual cumulative incidence exaggerated the current disease activity as the non-contagious cases were not removed from the estimates. In comparison, on July 1 the 40-day rolling incidence was 0.5 per 100,000 population in NS, 8.1 per 100,000 in the Western Zone and 24.8 per 100,000 in the South West area (Figure 3). The 40-day rolling incidence highlighted the need for interventions within the South West area as recommended by the local MOH. Similarly, the rolling incidence estimates did not support the implementation of zone- or province-wide public health actions.
The analysis was important in informing appropriate public health action at different geographic levels. Figure 3 provides a comparison of rolling incidence rates across three levels of geography. Activity was slightly elevated across the Province, with the highest rates observed in the South West area of the Western Zone. Local providers in the South West area were requested to focus on the immunization of children to bring them up-to-date with provincial guidelines, particularly for those 0-4 years of age and to offer immunizations to all pregnant women over 26 weeks gestation, regardless of their immunization status. The latter recommendation differed from the provincial recommendation that only pregnant women 26 weeks gestation or greater who had not received a dose of pertussis vaccine in adulthood be vaccinated, yet was in keeping with the National Advisory Committee on Immunization (NACI) recommendations for pertussis based on local epidemiology that demonstrated increased activity Footnote 26.
Figure 3: Rolling 40-day incidence per 100,000 population of confirmed pertussis cases reported in Nova Scotia, Western Zone and South West area, 2015
Text description: Figure 3
Figure 3: Rolling 40-day incidence per 100,000 population of confirmed pertussis cases reported in Nova Scotia, Western Zone and South West area, 2015
Figure 3 contains plots of 40-day rolling incidence rates calculated for each day in 2015 by presented at three difference level of geography: province, zone, and sub-section of a zone. The x axis represents continuous time ranging from 1 January to 31 December 2015. The y axis measures the 40-day rolling average of confirmed pertussis cases presented per 100,000. The 40-day rolling incidence ranged from 0 at origin to 30 per 100,000. Separate plots are presented for each level of geography: The province of Nova Scotia (black), Western zone (red), and South West (magenta). Overall the 40-day rolling incidence was highest in South West, and the lowest across the province of Nova Scotia. Over time, the 40-day incidence in the South West showed a bimodal pattern that peaked between July and August again in October, 2015. The 40-day incidence in the Western Zone also showed a bimodal pattern that peaked in July and again in October, 2015, but was generally less than half as elevated as in South west. The 40-day rolling incidence activity in the provincial level was generally lower than in the other two levels of geography, without the clear large peaks observed in the other geographic levels.
Intervention experience
During the period of increased pertussis incidence in NS, there was considerable debate about whether there was a need to intensify control interventions in either the whole or parts of the Province. The 40-day rolling incidence provided greater insight into the timing of peak pertussis incidence and thereby informed a decision by provincial public health authorities that additional control measures instituted in the geographical area of highest activity were not required at a provincial level. Stakeholders reported that they valued the additional information provided by the 40-day rolling incidence rate.
Discussion
During the increase in the reported number of pertussis cases in 2015, the use of the 40-day rolling incidence was found to be a useful way to visualize surveillance data to illustrate regional and temporal trends in NS. This led to the initiation of an urgent vaccination program in part of a health management zone in response to disease activity.
The increased number of pertussis cases in NS throughout 2015 was concerning as it far exceeded the counts and rates observed on average and in the previous cyclical peak of 2012 Footnote 27. This increased activity was successfully described using a 40-day rolling incidence rate.
The use of rolling estimates is not a new technique; rolling averages have been used in other forms of surveillance, such as the development of alert thresholds in syndromic surveillance Footnote 28,Footnote 29,Footnote 30. Although rolling averages have been used to set thresholds in other research, this use was not the purpose of the study. An additional benefit of the rolling incidence approach is its potential to define and monitor thresholds of disease occurrence.
There were two main strengths associated with use of the 40-day rolling incidence during this public health event. First, the 40-day rolling average provided a timely visual tool to compare statistics across different subpopulations, using information that was more timely than that provided in monthly notifiable disease reports. These comparisons could not be made using a standard epidemiological curve of case counts. For example, in this event, the increasing trend in the Western Zone was not as obvious from the traditional monthly count, but more evident in the plot of the 40-day rolling average.
Second, use of a 40-day rolling average helped avoid some of the complications associated with reporting small numbers of cases and helped to disentangle the issues behind the steadily rising cumulative rate. Reporting low numbers can also threaten the confidentiality of individuals Footnote 19Footnote 20 and small numbers are also more affected by chance. This instability can be addressed by either collapsing categories to increase the count Footnote 31 or, as in this article, expanding the time interval. NS is a small province with a population of less than one million residents. When pertussis rates are elevated, the actual count of cases remains a small number, especially when stratified by zone.
Limitations
There are several limitations to the 40-day rolling incidence rate. Although this analysis provided disease specific incidence information to public health decision makers, it is a method not traditionally used and thus its results are not comparable to pertussis rates in other jurisdictions. There are few published discussions of incidents where public health interventions for pertussis have been initiated or discontinued using this type of analysis. In New Brunswick, a pertussis outbreak was declared over when activity returned to within two standard deviations of a five year smoothed rolling average for at least two weeks Footnote 28 however this is a much larger timeframe than that used in the analysis. The use of communicable periods to define time intervals might provide an indication of current community transmission but does not consider the additional factor of the known cyclical nature of the disease, where peaks can last for several months and recur over a three to five year time span. A longer timeframe may be required to define optimal thresholds for initiating or discontinuing community control interventions. Additionally, since the number of cases is very small, visualization of the data may be distorted. For example, the bimodal characteristic observed in this analysis could be random noise, an artefact of the rolling average process. Therefore, graphics should be interpreted caution when they reflect low counts.
Using episode date is another weakness of this analysis. In NS, the episode date is the date of symptom onset. The definition of episode date may vary across jurisdictions and may reflect date of report, date of lab confirmation or date of symptom onset. As such, the usefulness of comparing rolling incidence across jurisdictions may be limited.
The 40-day time interval might not be the best or most accurate interval to represent the infectious potential of pertussis within NS. The evidence suggests that the longest incubation period could be 42 days Footnote 2 thus a 42 day time frame might be a more complete representation of potential communicability. Alternatively, using the average incubation period of 10 days, might also be insightful as to the probable propagation of disease. Additional research and analysis is needed to validate the optimal time interval for reporting moving incidence. Communicability of pertussis depends on the disease stage and whether a patient receives treatment. Cases are most contagious in the catarrhal and early paroxysmal stages (first two weeks), after which communicability gradually decreases over the next three weeks Footnote 1Footnote 2. Furthermore, cases are no longer contagious after five days of treatment with antibiotics. During this public health event, several cases in families were diagnosed retrospectively. These retrospective cases likely did not benefit from treatment and were therefore probably communicable for longer time intervals. The communicability period was assumed to be the same for all cases included in the 40-day rolling incidence calculations. Cases that received treatment and those that continued to spread the disease were both included. Moreover, delayed reporting of cases limits the real-time effectiveness of this method.
Despite the limitations of the methodology, rolling incidence can be used in conjunction with traditional communicable disease surveillance methods, especially in instances that involve rare public health events, with long incubation periods. There is potential for these methods to be employed in similar situations as they complement traditional epidemiological methods for surveillance of notifiable diseases. Going forward, rolling incidence could be used to define and monitor thresholds of disease occurrence. This will be an area for public health authorities to consider as they continue efforts to improve surveillance for communicable disease. Therefore, graphics should be interpreted with caution when they reflect low counts.
Conclusion
Forty day rolling incidence rates provided a useful way to describe and compare pertussis trends within NS for various geographic levels and age groups. The 40-day rolling incidence rate proved to be a useful supplementary tool to investigate increased pertussis activity and inform the public health decisions of epidemiologists, MOHs and local communicable disease managers. Furthermore, these results helped to guide public health action, particularly in areas of high pertussis activity. The methods presented in this paper could be adjusted to investigate and manage other communicable diseases.
Acknowledgements
The authors acknowledge the local public health staff that collected and reported the data used in the analysis and the stakeholders that provided feedback for this assessment.
Conflict of interest
None.
Funding
This research was supported by the Nova Scotia Department of Health and Wellness and Canadian Field Epidemiology Program.