
Archived - Canadian hospitalization rates for Hep C

 Download this article as a PDF
 Published by: The Public Health Agency of Canada
Issue: Volume 44-7/8 : Can we eliminate hepatitis C?
Date published: July 5, 2018
ISSN: 1481-8531
Submit a manuscript
About CCDR
Browse
Volume 44-7/8, July 5, 2018: Can we eliminate hepatitis C?
Database Study
Impact of availability of direct-acting antivirals for hepatitis C on Canadian hospitalization rates, 2012–2016
D Schanzer1, L Pogany1, J Aho1, K Tomas1, M Gale-Rowe1, JC Kwong2,3,4,5, NZ Janjua6,7, J Feld8,9
Affiliations
1 Centre for Communicable Diseases and Infection Control, Public Health Agency of Canada, Ottawa, ON
2 Institute for Clinical Evaluative Sciences, Toronto, ON
3 Public Health Ontario, Toronto, ON
4 Department of Family & Community Medicine, University of Toronto, Toronto, ON
5 Dalla Lana School of Public Health, University of Toronto, Toronto, ON
6 BC Centre for Disease Control, Vancouver, BC
7 School of Population and Public Health, University of British Columbia, Vancouver, BC
8 Toronto Centre for Liver Disease, University Health Network, Toronto General Hospital, Toronto, ON
9 Sandra Rotman Centre, University of Toronto, Toronto, ON
Correspondence
Suggested citation
Schanzer D, Pogany L, Aho J, Tomas K, Gale-Rowe M, Kwong JC, Janjua NZ, Feld J. Impact of availability of direct-acting antivirals for hepatitis C on Canadian hospitalization rates, 2012–2016. Can Commun Dis Rep 2018;44(7/8):150-6. https://doi.org/10.14745/ccdr.v44i78a01
Keywords: hepatitis C, disease burden, trends, hospitalization, monitoring the impact of DAA treatment
Abstract
Background: Hospitalizations associated with hepatitis C virus (HCV) infection and liver disease increased on average by 6.0% per year from 2004 to 2010 in Canada and were projected (in 2010) to increase by another 4% by 2016. The first generation of direct-acting antivirals (DAAs) became available in 2012. In 2014, a second generation of effective and well-tolerated DAA therapy was authorized in Canada. The impact of DAA therapy on the HCV-associated disease burden in Canada has not been documented.
Objectives: To assess the potential impact of DAA therapy on the disease burden by a) comparing the actual hospitalization rates associated with HCV infection and liver disease following the introduction of DAAs in Canada with the 2010 baseline projection and b) documenting the associated uptake of anti-HCV therapy.
Methods: The hospital records of inpatients diagnosed with chronic HCV and chronic liver disease were extracted from the Canadian Discharge Abstract Database (DAD) by fiscal year for 2004–2016. We compared the actual number of hospitalizations to the baseline projection by year and for selected 5-year birth cohorts (1925–1989). The monthly number of new prescriptions for anti-HCV regimens was extracted from the IQVIA CDH CompuScript database (formerly IMS Health), aggregated to annual levels by age group and compared with hospitalization trends.
Results: Compared to the baseline projection, there was a slight reduction in hospitalizations in 2014/15 and 2015/16. This slight reduction was followed by a more significant decline in 2016/17 (32% below expected; 95% confidence interval [CI]: 27%–37%). The largest declines were observed for patients born before 1960 (age 55 or older) at 40% below expected in 2016/17. The number of new anti-HCV prescriptions increased from 5,484 in fiscal year 2012/13 to a peak of 17,775 in 2015/2016. The number of new prescriptions corresponds to approximately 1.3 and five times the number of hospitalizations in 2012/13 and 2015/16, respectively.
Conclusions: In Canada there has been a modest decrease in HCV and liver-related hospitalizations following a significant increase in uptake of second-generation DAAs in 2015. However, the burden is still high. Linked health administrative databases created to monitor the disease burden in the new treatment era should provide additional insight with the linkage of treatment history and disease stage to individual outcomes.
Introduction
Hepatitis has been identified as an international public health issue for yearsFootnote 1. Over 15 years ago, Canada identified chronic hepatitis C virus (HCV) as a major contributor to the growing burden of cirrhosis, hepatocellular carcinoma (HCC) and liver transplantationsFootnote 2Footnote 3. In Ontario, HCV was identified as the infectious disease accountable for the largest disease burden in terms of health adjusted life yearsFootnote 4. A Canadian modelling study estimated that the prevalence of viremic hepatitis C cases peaked between 2003 and 2013; it also predicted the prevalence of advanced liver disease would increase until 2030 as the infected population agesFootnote 5. Another Canadian study, based on hospitalization data, established that a large part of this growing burden was driven by the “baby boomer” cohort. The study found that the number of hospitalizations for HCV-associated chronic liver disease (CLD) increased 6.0% per year from 2004 to 2010Footnote 6. As of 2010, hospitalizations were highest for those born between 1950 and 1959, and were projected to increase to 1.5 times the 2010 levels as this cohort approaches age 70 in 2025–2035Footnote 6.
In 2012, the first generation of direct-acting antivirals (DAAs) was introduced in Canada. These agents achieved high rates of sustained virologic response and offered hope of reversing the trends in the prevalence of advanced liver disease. However tolerability was an issue and uptake remained relatively limited.
In 2014, a second generation of highly effective DAAs became available. These new regimens provided cure rates of >95% against all main genotypes with a short course of well-tolerated therapy (8–24 weeks). Second generation DAAs are now being considered a major medical breakthrough that have revolutionized the treatment of HCV infection, thus enabling much greater treatment uptake and the prospect of a major reduction in HCV-related morbidity and mortalityFootnote 7.
Based largely on the improvement in treatment for HCV, the World Health Organization (WHO) called for the elimination of viral hepatitis as a public health threatFootnote 7. The WHO has set targets aiming to reduce mortality by 65% by 2030, compared to 2015 levels, and recommends ongoing monitoring so countries can assess whether they are on track to meet these ambitious goalsFootnote 7.
It will be a number of years before mortality data are available. Monitoring trends in hospitalization rates is a viable alternative and offers several advantages over mortality data. Hospitalization data are more timely than mortality data. The number of deaths coded to HCV as the underlying cause of death in the mortality databaseFootnote 8 is considered an underestimate. In addition, mortality data has limited statistical power due to the smaller number of deaths that will delay the detection of any changes in the trend.
However, in order to use hospital data it must be taken into account that the population-level reductions in disease burden associated with the new treatments may not be large enough in the short term to offset the anticipated increase in hospitalizationsFootnote 6. This arises from three considerations linked to the nature of how this disease progresses. First, the short term reduction in the risk of hospitalization is expected to be limited primarily to the treatment of patients with compensated cirrhosis who are at risk of progressing to decompensated cirrhosis. Second, treating patients who do not currently have advanced liver disease will prevent progression to cirrhosis in the long term. Third, patients with advanced liver disease, and particularly those with decompensated cirrhosis and/or HCC, may not improve much after achieving sustained virologic response, potentially leading to limited or no change in hospitalization ratesFootnote 9Footnote 10.
In Canada, the study by Schanzer et al. in 2014, established a baseline projection of HCV and CLD hospitalizations based on trends prior to the introduction of DAAsFootnote 6. This study found that the increasing risk of hospitalization within each 5-year birth cohort was primarily a function of age, and that stratification by 5-year birth cohort was required to control for the differences in exposure to HCV.
The objective of the current study was to use previously calculated projections as a baseline scenario corresponding to the hypothetical situation of “no change in treatment,” and then to compare this baseline projection with the actual number of hospitalizations associated with HCV and CLD, and to document the uptake of antiviral therapy at a population level.
Methods
Data sources
Hospital discharge records for patients admitted to an acute care hospital with a diagnostic code of chronic HCV (ICD-10 code B18.2) and CLD (K70–K77, R18) including HCC (C22) in any of the diagnostic fields were extracted from the Canadian Institute of Health Information (CIHI) patient-specific Discharge Abstract Database (DAD)Footnote 11 for the period spanning April 2004 to March 2017. Fields related to age, date of discharge, inpatient deaths and HCC were retained. As the province of Quebec does not participate in the DAD, the database captures approximately 75% of all acute care hospitalizations in Canada. Population denominators were obtained from Statistics Canada population estimatesFootnote 12. In September 2017, the number of new prescriptions filled for anti-HCV therapy was extracted from the IQVIA CDH CompuScript database (formally IMS Health)Footnote 13 by month and year, as well as province and age group for the period spanning September 2011 to August 2017. This database is created from a panel survey of over 5,700 pharmacies, representing more than 60% of all retail pharmacies in Canada. The products used to treat HCV are listed in Appendix 1. The baseline projection of hospitalization levels by birth cohort were taken from the 2014 Schanzer et al. studyFootnote 6.
Data analysis
Annual trends
To assess the impact on an annual basis, we limited the comparison of the actual number of annual hospitalizations with the baseline scenario to birth cohorts for which we had sufficient data to estimate the baseline projection (persons born between 1925 and 1989, but aged less than 90 years). We computed 95% confidence limits corresponding to the standard error of the difference between actual and predicted values for the pre-DAA period (2004–2011). We also calculated the ratio of the annual number of hospitalizations divided by the baseline projection for the same year. During the pre-DAA period, the ratio was expected to track close to 1.0, and then start to decline as first- and then second-generation DAAs started to reduce the risk of hospitalization. Logistic regression was used to assess trends in the inpatient fatality rate and proportion of hospitalizations associated with HCC.
Age group
To assess the impact by age group, we compared the annual number of hospitalizations with a recorded diagnosis of HCV and CLD in the hospital discharge abstract for 2016/17 with the baseline projections for 2016/17 for each 5-year birth cohort. The average age at hospitalization was calculated for each birth cohort by year. The error bars corresponding to the 95% confidence intervals (CIs) were based on the Poisson distribution typically used for count data.
New prescriptions
We plotted the monthly number of new prescriptions in Canada as a time series. The ratio of new prescriptions to hospitalizations was calculated by calendar year and by age group from the IQVIA data extract. New prescriptions for Quebec were excluded from the ratio calculation.
Results
Annual trends
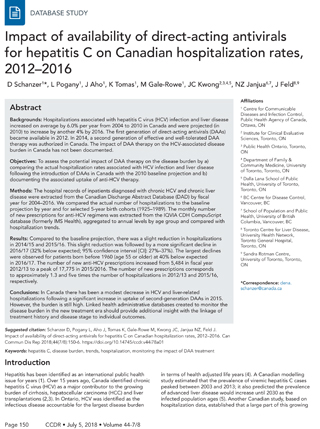
The annual number of hospitalizations associated with HCV and CLD tracked the projected numbers closely during the pre-DAA period (Figure 1, red curve compared to blue curve). A statistically significant reduction compared with the baseline was first observed in 2014/15 (green curve compared to blue curve). The largest reduction occurred in 2016/17, 32% (95% CI: 27%–37%), with 2,538 HCV and CLD hospitalizations compared with the predicted 3,740.
Figure 1: Trends in annual hospitalizations associated with hepatitis C virus infection and chronic liver disease, by year, 2004/05–2016/17, Canada Figure 1 footnote a
Text description: Figure 1
Figure 1: Trends in annual hospitalizations associated with hepatitis C virus infection and chronic liver disease, by year, 2004/05–2016/17, Canada Figure 1 footnote a
| Year | Number of Hospital Admissions | Predicted: Pre DAA Scenario | Error Bar | Ratio: Number of Hospitalizations to Number of Predicted | Error Bar |
|---|---|---|---|---|---|
| 2003 | 2,115 | - | 192 | - | - |
| 2004 | 2,181 | 2,080 | 192 | - | - |
| 2005 | 2,338 | 2,188 | 192 | 1.07 | 0.09 |
| 2006 | 2,568 | 2,313 | 192 | 1.11 | 0.08 |
| 2007 | 2,542 | 2,443 | 192 | 1.04 | 0.08 |
| 2008 | 2,507 | 2,571 | 192 | 0.98 | 0.07 |
| 2009 | 2,766 | 2,723 | 192 | 1.02 | 0.07 |
| 2010 | 3,029 | 2,891 | 192 | 1.05 | 0.07 |
| 2011 | 3,079 | 3,077 | 192 | 1.00 | 0.06 |
| 2012 | 2,975 | 3,216 | 192 | 0.93 | 0.06 |
| 2013 | 3,245 | 3,340 | 192 | 0.97 | 0.06 |
| 2014 | 3,146 | 3,477 | 192 | 0.90 | 0.06 |
| 2015 | 3,028 | 3,611 | 192 | 0.84 | 0.05 |
| 2016 | 2,538 | 3,740 | 192 | 0.68 | 0.05 |
| 2017 | - | 3,864 | - | - | - |
| 2018 | - | 3,956 | - | - | - |
| 2019 | - | 4,070 | - | - | - |
| 2020 | - | 4,176 | - | - | - |
| 2021 | - | 4,272 | - | - | - |
| 2022 | - | 4,358 | - | - | - |
| 2023 | - | 4,398 | - | - | - |
| 2024 | - | 4,466 | - | - | - |
| 2025 | - | 4,521 | - | - | - |
| 2026 | - | 4,563 | - | - | - |
| 2027 | - | 4,592 | - | - | - |
| 2028 | - | 4,576 | - | - | - |
| 2029 | - | 4,581 | - | - | - |
| 2030 | - | 4,572 | - | - | - |
The inpatient mortality rate for HCV and CLD declined from 15.7% in 2003 to 13.0% in 2016 (Table 1), corresponding to an annual average percent change (AAPC) of −1.2% (95% CI: −2.0% to −0.4%). After controlling for the aging of the hospitalized HCV cohort, the rate of decline was stronger (AAPC: −1.9%; 95% CI: −2.6% to −1.1%). The proportion of HCV and CLD hospitalizations with an HCC diagnosis increased from 11% to 25% for an AAPC of 6.4% (95% CI: 5.0%–7.9%). After controlling for age, the AAPC was 4.0% (95% CI: 2.9%–5.1%). This trend was evident in the baseline period (2003–2010) with an AAPC of 6.6% (95% CI: 4.8%–8.6%).
| Year | Hospitalizations (n) |
Deaths (n) |
Mortality rate (%) |
HCC cases (n) |
HCCTable 1 Footnote b (%) |
|---|---|---|---|---|---|
| 2003/04 | 2,115 | 331 | 15.7 | 226 | 10.7 |
| 2004/05 | 2,182 | 334 | 15.3 | 264 | 12.1 |
| 2005/06 | 2,338 | 341 | 14.6 | 321 | 13.7 |
| 2006/07 | 2,569 | 421 | 16.4 | 388 | 15.1 |
| 2007/08 | 2,542 | 395 | 15.5 | 420 | 16.5 |
| 2008/09 | 2,527 | 404 | 16.0 | 438 | 17.3 |
| 2009/10 | 2,774 | 384 | 13.8 | 551 | 19.9 |
| 2010/11 | 3,041 | 415 | 13.6 | 594 | 19.5 |
| 2011/12 | 3,092 | 459 | 14.8 | 622 | 20.1 |
| 2012/13 | 2,979 | 446 | 15.0 | 619 | 20.8 |
| 2013/14 | 3,255 | 464 | 14.3 | 742 | 22.8 |
| 2014/15 | 3,152 | 457 | 14.5 | 631 | 20.0 |
| 2015/16 | 3,040 | 428 | 14.1 | 669 | 22.0 |
| 2016/17 | 2,554 | 333 | 13.0 | 633 | 24.8 |
Abbreviations: HCC, hepatocellular carcinoma; n, number; Year, fiscal year Source: CIHI Discharge Abstract DatabaseFootnote 11 |
|||||
Age group
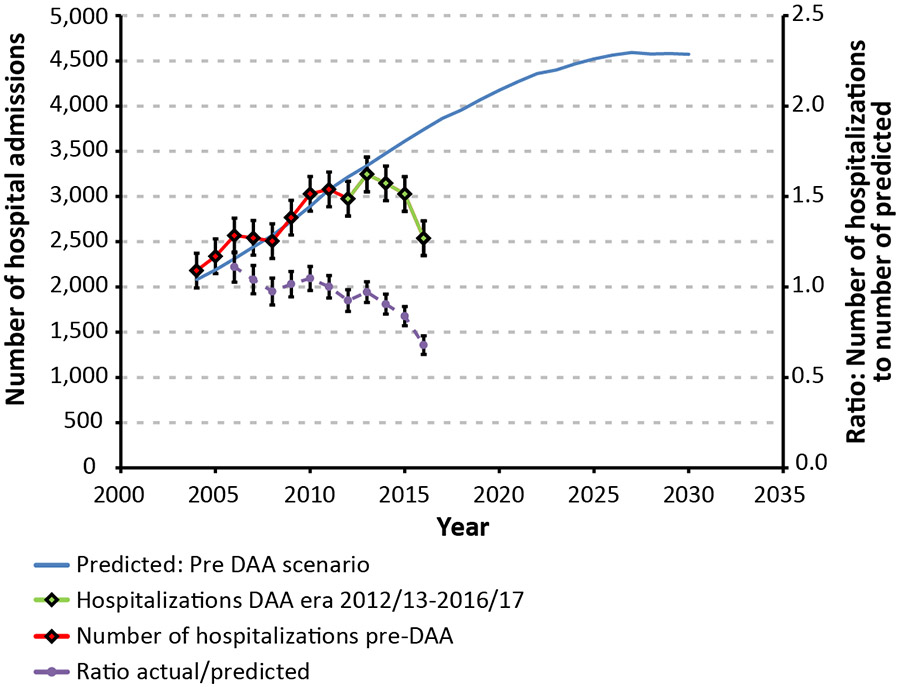
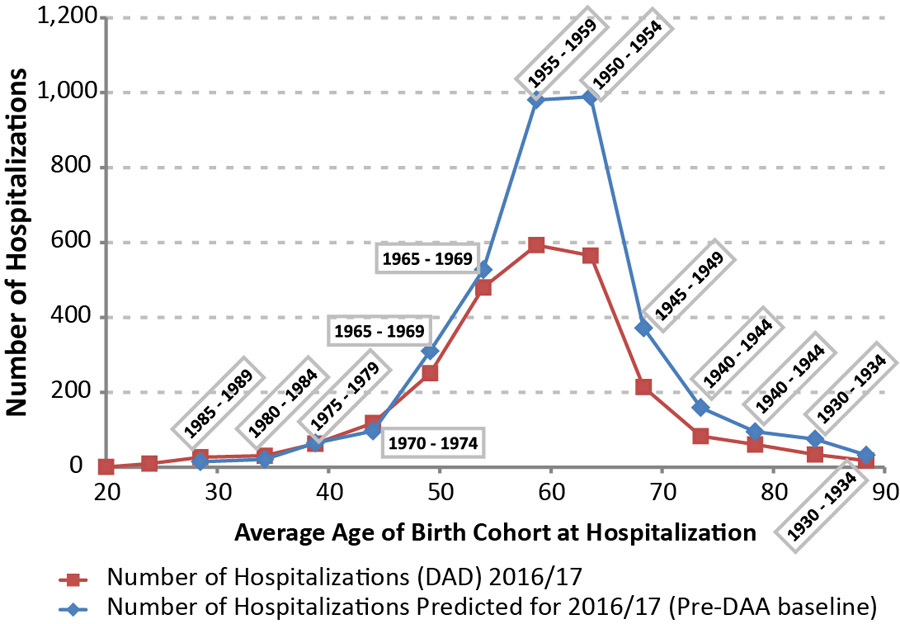
In Figure 2a, the actual number of hospitalizations are compared with the projected baseline levels for 2016/17. The largest declines in the number of hospitalizations in 2016/17 occurred in the birth cohorts with the highest baseline estimates (1950–54 and 1955–59). The ratio of the observed to projected number of hospitalizations in Figure 2b shows that the largest relative declines were observed among patients born before 1960 (age 55 years or older), at 40% below expected. Conversely, for patients aged 45 years or less, a ratio of one suggests that treatment has not resulted in significant short term reductions to the risk of hospitalization.
Figure 2a: Annual number of hospitalizations associated with hepatitis C virus and chronic liver disease compared with baseline estimates, by age Figure 2 footnote a, 2016/17, in Canada Figure 2 footnote b
Text description: Figure 2a
Figure 2a: Annual number of hospitalizations associated with hepatitis C virus and chronic liver disease compared with baseline estimates, by age Figure 2 footnote a, 2016/17, in Canada Figure 2 footnote b
| Birth Cohort | Age of Birth Cohort at Hospitalization | Number of Hospitalizations (DAD) 2016/17 | Error Bar(for Ratio) | Reference Line |
|---|---|---|---|---|
| 1915 - 1919 | 96.0 | 1 | N/A | 1 |
| 1920 - 1924 | 94.3 | 3 | N/A | 1 |
| 1930 - 1934 | 88.3 | 18 | 0.25 | 1 |
| 1930 - 1934 | 83.7 | 34 | 0.15 | 1 |
| 1940 - 1944 | 78.3 | 61 | 0.16 | 1 |
| 1940 - 1944 | 73.5 | 83 | 0.11 | 1 |
| 1945 - 1949 | 68.3 | 214 | 0.08 | 1 |
| 1950 - 1954 | 63.6 | 565 | 0.05 | 1 |
| 1955 - 1959 | 58.7 | 593 | 0.05 | 1 |
| 1965 - 1969 | 53.9 | 480 | 0.08 | 1 |
| 1965 - 1969 | 49.1 | 251 | 0.10 | 1 |
| 1970 - 1974 | 44.0 | 118 | 0.22 | 1 |
| 1975 - 1979 | 38.8 | 63 | 0.24 | 1 |
| 1980 - 1984 | 34.3 | 31 | 0.52 | 1 |
| 1985 - 1989 | 28.5 | 27 | 0.68 | 1 |
| 1990 - 1994 | 23.9 | 10 | N/A | 1 |
| 1995 - 1999 | 20.0 | 1 | N/A | 1 |
| 2005 - 2009 | 8.0 | 1 | N/A | 1 |
| Abbreviation: N/A, not available | ||||
Figure 2b: Ratio of the actual number of hospitalizations to the pre-DAA baseline projection by age Figure 2 footnote a, 2016/17 in Canada Figure 2 footnote b
Text description: Figure 2b
Figure 2b: Ratio of the actual number of hospitalizations to the pre-DAA baseline projection by age Figure 2 footnote a, 2016/17 in Canada Figure 2 footnote b
| Birth Cohort | Predicted number of Hospitalizations (pre-DAA baseline) |
Ratio: number of Hospitalizations to Predicted (pre-DAA baseline) |
Error Bar (for Ratio) | Reference Line |
|---|---|---|---|---|
| 1915 - 1919 | N/A | N/A | N/A | 1 |
| 1920 - 1924 | N/A | N/A | N/A | 1 |
| 1930 - 1934 | 33 | 0.55 | 0.25 | 1 |
| 1930 - 1934 | 75 | 0.45 | 0.15 | 1 |
| 1940 - 1944 | 95 | 0.64 | 0.16 | 1 |
| 1940 - 1944 | 159 | 0.52 | 0.11 | 1 |
| 1945 - 1949 | 372 | 0.58 | 0.08 | 1 |
| 1950 - 1954 | 989 | 0.57 | 0.05 | 1 |
| 1955 - 1959 | 981 | 0.60 | 0.05 | 1 |
| 1965 - 1969 | 527 | 0.91 | 0.08 | 1 |
| 1965 - 1969 | 311 | 0.81 | 0.10 | 1 |
| 1970 - 1974 | 97 | 1.22 | 0.22 | 1 |
| 1975 - 1979 | 65 | 0.97 | 0.24 | 1 |
| 1980 - 1984 | 21 | 1.46 | 0.52 | 1 |
| 1985 - 1989 | 15 | 1.80 | 0.68 | 1 |
| 1990 - 1994 | N/A | N/A | N/A | 1 |
| 1995 - 1999 | N/A | N/A | N/A | 1 |
| 2005 - 2009 | N/A | N/A | N/A | 1 |
New prescriptions
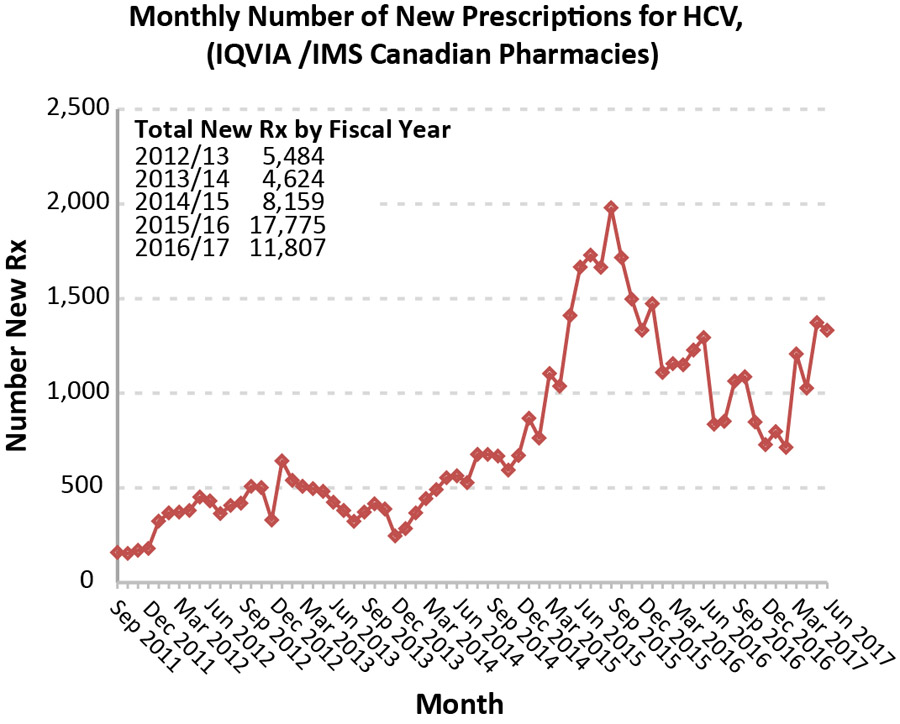
New prescriptions peaked in 2015 (Figure 3), shortly after the introduction of second-generation DAAs, increasing from 5,484 in 2012 to 17,775 in 2015. The age distribution of new prescriptions was similar to the age distribution of hospitalizations, though the treated group was slightly younger than those hospitalized, as seen by the ratio of new prescriptions to hospitalizations for each year and age group (Table 2).
Figure 3: Monthly number of new prescriptions for hepatitis C virus, in Canada
Text description: Figure 3
Figure 3: Monthly number of new prescriptions for hepatitis C virus, in Canada
| Month | Monthly Number of New Prescriptions for HCV (IQVIA/IMS Canadian Pharmacies) |
|---|---|
| Sep 2011 | 159 |
| Oct 2011 | 154 |
| Nov 2011 | 170 |
| Dec 2011 | 180 |
| Jan 2012 | 324 |
| Feb 2012 | 368 |
| Mar 2012 | 372 |
| Apr 2012 | 381 |
| May 2012 | 452 |
| Jun 2012 | 431 |
| Jul 2012 | 364 |
| Aug 2012 | 407 |
| Sep 2012 | 419 |
| Oct 2012 | 508 |
| Nov 2012 | 501 |
| Dec 2012 | 330 |
| Jan 2013 | 643 |
| Feb 2013 | 540 |
| Mar 2013 | 508 |
| Apr 2013 | 496 |
| May 2013 | 482 |
| Jun 2013 | 424 |
| Jul 2013 | 381 |
| Aug 2013 | 323 |
| Sep 2013 | 372 |
| Oct 2013 | 416 |
| Nov 2013 | 388 |
| Dec 2013 | 246 |
| Jan 2014 | 285 |
| Feb 2014 | 368 |
| Mar 2014 | 443 |
| Apr 2014 | 491 |
| May 2014 | 554 |
| Jun 2014 | 564 |
| Jul 2014 | 528 |
| Aug 2014 | 677 |
| Sep 2014 | 677 |
| Oct 2014 | 668 |
| Nov 2014 | 594 |
| Dec 2014 | 671 |
| Jan 2015 | 868 |
| Feb 2015 | 763 |
| Mar 2015 | 1,104 |
| Apr 2015 | 1,037 |
| May 2015 | 1,411 |
| Jun 2015 | 1,667 |
| Jul 2015 | 1,730 |
| Aug 2015 | 1,665 |
| Sep 2015 | 1,980 |
| Oct 2015 | 1,716 |
| Nov 2015 | 1,497 |
| Dec 2015 | 1,333 |
| Jan 2016 | 1,473 |
| Feb 2016 | 1,110 |
| Mar 2016 | 1,156 |
| Apr 2016 | 1,150 |
| May 2016 | 1,228 |
| Jun 2016 | 1,294 |
| Jul 2016 | 836 |
| Aug 2016 | 852 |
| Sep 2016 | 1,064 |
| Oct 2016 | 1,087 |
| Nov 2016 | 848 |
| Dec 2016 | 728 |
| Jan 2017 | 798 |
| Feb 2017 | 714 |
| Mar 2017 | 1,208 |
| Apr 2017 | 1,027 |
| May 2017 | 1,373 |
| Jun 2017 | 1,333 |
| Jul 2017 | 1,200 |
| Aug 2017 | 1,006 |
| Calendar year | Age group (years) | Total | ||||
|---|---|---|---|---|---|---|
| 19–29 | 30–39 | 40–49 | 50–59 | 60+ | ||
| 2012 | 1.9 | 4.8 | 0.3 | 1.7 | 0.9 | 1.3 |
| 2013 | 4.4 | 4.6 | 1.6 | 1.6 | 1.0 | 1.5 |
| 2014 | 8.2 | 4.5 | 2.0 | 2.0 | 1.6 | 1.9 |
| 2015 | 10.5 | 10.1 | 1.7 | 5.6 | 4.9 | 5.0 |
| 2016 | 7.4 | 8.7 | 5.1 | 4.8 | 4.1 | 4.7 |
Discussion
There was a slight reduction in hospitalizations for HCV-related chronic liver disease diagnoses in Canada in 2014/15 and 2015/16 compared with the baseline projection. In 2016/17, the reduction in hospitalizations was modest following a significant increase in the uptake of treatment with the introduction of second-generation DAAs in 2015. This reduction is nevertheless impressive considering that the burden was expected to increase. By using baseline projections from a previous study, we were able to monitor early progress in reductions in the HCV and CLD burden by age group. Persons with an HCV infection born before 1960 (55 years or older in 2016) appear to have benefited the most from DAAs in the near-term, with a 40% reduction in hospitalizations in 2016 compared with the projected baseline. The largest reduction in the number of hospitalizations occurred in the birth cohorts with the highest baseline estimates (1950–54 and 1955–59). A large change for the younger cohorts was not observed despite a proportionally higher uptake of treatment. This likely reflects differences in the disease stage of patients who received treatment. Patients receiving treatment in the early stages of fibrosis would be at a very low risk of hospitalization for advanced liver disease in the short term, while more substantial benefits for this group would be expected over the longer term.
A decline in the inpatient mortality rate was observed over the full study period (2003–2016), as was an increase in the proportion of hospitalizations with HCC. Despite some controversy about the possibility that DAAs may increase the risk of HCC, more recent data clearly show that, like interferon-induced sustained virologic response, viral clearance with DAAs reduces but does not eliminate the risk of HCCFootnote 14. Rather, a strong increase in both mortality and HCC risk with age has been noted for patients with a chronic HCV infectionFootnote 10. Emerging data confirm that while achieving sustained virologic response largely prevents hepatic decompensation in patients with cirrhosis and even improves liver function in those who are treated after initial decompensation, the risk of HCC remains a major concernFootnote 9. Recent declines in the number of inpatient deaths and the number of HCC hospitalizations are encouraging, though these numbers are too small and the time period too short to assess the statistical significance of the impact of the second-generation DAAs on mortality and HCC.
Strengths and limitations
The main strength of this study is the use of hospitalization data compared with a baseline projection to provide a more timely assessment of the early impact of DAAs than would be possible with vital statistics dataFootnote 8. The larger number of annual events provides the statistical power to detect an impact earlier than mortality data. The baseline projection corresponding to the hypothetical absence of DAA therapyFootnote 6 provided a more accurate assessment of the impact of the new therapies than would be available from a simple trend analysis. This approach allowed us to control for variation in exposure to HCV infection in different birth cohorts, and due to the slow natural progression of disease, the number of early hospitalizations was a good predictor of the number of future events. As well, this approach did not require the many estimates, data points or assumptions needed to model the full complexity of disease progression. The comparison with the hypothetical baseline rather than previous levels allowed us to assess the potential early benefits of the intervention and control for the anticipated increase in burden.
There are also several limitations to consider. We were unable to assess trends in the number of HCC hospitalizations, as the numbers were small and we did not have a readily available baseline estimate to take into account the increasing underlying burden. As a population level study, patient-specific information such as the disease history, patient care and exposure category that could help refine projections of the future burden under various scenarios of ramped-up treatment and screening was not available. As we used the presence of an HCV and CLD diagnostic code in any of the diagnostic fields in the DAD database to identify HCV and CLD hospitalizations, there is a risk of bias due to under-ascertainment. The HCV diagnosis was likely not included in the discharge record for all hospitalizations of patients diagnosed with an HCV infection. The number of new prescriptions does not necessarily correspond to the number of treatment courses, as physicians may not include all renewals for the full treatment course on one script. In addition, the quality of the prescription data from IQVIA has not been fully assessed. Unfortunately, Quebec does not participate in the DAD, so the hospitalization results are not national. Many of these limitations could be overcome through data linkage projects.
Next steps
With a potentially curative treatment available, the research focus has shifted from measuring and predicting burden of illness to documenting the impact of treatment on long term outcomes. Challenges in monitoring the impact of DAA at a population level amid an otherwise growing burden remain, as does concern about the access to treatment, the HCV-associated HCC burdenFootnote 15Footnote 16 and the impact of sustained virologic response on the future HCC burdenFootnote 9Footnote 10Footnote 14. Reductions in HCV-related compensated or decompensated cirrhosis or HCC should be detectable well ahead of reductions in hospitalization. As such, if these data were available in a timely manner, these trends would be better indicators of progress. One Canadian study used linked health data to characterize patients who developed HCV-related decompensated cirrhosis or HCC between 2007 and 2011Footnote 16. Samji et al. defined a late diagnosis as having been diagnosed with HCV within the previous two yearsFootnote 16. They found that the proportion of late diagnoses was substantially reduced over the (pre-DAA) study period and that illicit drug use (as identified in the medical records) and regular physician visits were protective against a late HCV diagnosisFootnote 16. The capacity to monitor these trends and the characteristics of persons developing cirrhosis or HCC will greatly assist in monitoring progress and guiding public health efforts in further reduction of the burden.
Researchers affiliated with the Canadian Network on Hepatitis C (CanHepC) programFootnote 17 are conducting a number of additional studies that aim to link a cohort of people diagnosed with HCV with other administrative health databasesFootnote 15Footnote 16. Linkage requires various approvals and safe-guards to maintain patient confidentiality. Though true data-sharing is not likely feasible, these researchers are planning to coordinate definitions across provinces so that results will be comparable. Significant progress has been made in Ontario (at the Institute for Clinical Evaluative Sciences), British Columbia and Quebec, and additional statistics related to late presentation and the cascade of care for patients with an HCV diagnosis is forthcoming. Preliminary research compared the number of new prescriptions from IQVIA Institute for Human Data Science with preliminary data on the number of DAA treatment courses in British Columbia and found that one treatment course accounts for approximately 1.4 new prescriptions (Personal communication. NZ Janjua, February 7, 2018).
Conclusions
Canada has had a modest decrease in HCV and CLD hospitalizations following the switch to second-generation DAAs. However, liver disease burden associated with chronic HCV is still high and progression to HCC following sustained virologic response in cirrhotic patients remains a concern. As it is preferable to treat patients with chronic HCV infection before cirrhosis has developed, it will likely be many years before the full benefit of DAA treatment can be observed. The observed trends are also consistent with the emerging data that patients with much more advanced liver disease can be safely and effectively treated. Identifying and monitoring leading indicators such as disease stage at sustained virologic response along with measures of the cascade of care will be helpful in monitoring progress toward the elimination of the disease burden associated with HCV. Linked health administrative databases created to monitor the disease burden in the new treatment era should provide additional insight with the linkage of treatment history and disease stage to individual outcomes.
Authors' statement
- DS – Conceptualization; methodology; writing – original draft; validation, statistical analysis
- JA – Writing – review and editing
- MGR – Writing – review and editing
- LP – Writing – review and editing
- KT – Writing – review and editing
- JCK – Clinical expertise; data for validation and comparison with other studies; writing – review and editing
- NJ – Data for validation and comparison with other studies; writing – review and editing
- JF – Clinical expertise; data for validation and comparison with other studies; writing – review and editing
Conflict of interest
JF has collaborated on research projects with Abbvie, Gilead, Janssen and Merck and has consulted for Abbvie, Gilead and Merck.
Acknowledgements
The authors wish to thank the Canadian Institute of Health Information (CIHI) and all those involved in the collection and compilation of the Discharge Abstract Database (DAD) as well as the Data Coordination and Access Program of the Public Health Agency of Canada for providing access to this database. The cooperation of all involved in these activities is gratefully acknowledged.
Funding
This work was supported by the Public Health Agency of Canada and the Canadian Network on Hepatitis C (Grant # NHC – 142832).
Appendix 1
| Product | Combined molecule abbreviation | DIN |
|---|---|---|
| DAKLINZA | DACLATASVIR | 2444747, 2444755 |
| EPCLUSA | SOFOSBUVIR:VELPATASVIR | 2456370 |
| GALEXOS | SIMEPREVIR | 2416441 |
| HARVONI | LEDIPASVIR:SOFOSBUVIR | 2432226 |
| HOLKIRA PAK | DASABUVIR:OMBITASVIR:PARITAPREVIR:RITONAVIR | 2436027 |
| IBAVYR | RIBAVIRIN | 2425890, 2425904, 2439212 |
| INCIVEK | TELAPREVIR | 2371553 |
| PEGASYS | PEGINTERFERON ALFA 2A | 2248077, 2248078 |
| PEGETRON | INTERFERON ALFA 2B:RIBAVIRIN | 2246026, 2246027, 2246028, 2246029, 2246030 |
| PEGETRON REDIPEN/CLEARCL | INTERFERON ALFA 2B:RIBAVIRIN | 2254581, 2254603, 2254638, 2254646 |
| SOVALDI | SOFOSBUVIR | 2418355 |
| TECHNIVIE | OMBITASVIR:PARITAPREVIR:RITONAVIR | 2447711 |
| VICTRELIS | BOCEPREVIR | 2370816 |
| VICTRELIS TRIPLE | BOCEPREVIR:PEGINTERFERON ALFA 2B:RIBAVIRIN | 2371448, 2371456, 2371464, 2371472 |
| ZEPATIER | ELBASVIR:GRAZOPREVIR | 2451131 |