
Archived - 2018 - HIV Surveillance Report

 Download this article as a PDF
Published by: The Public Health Agency of Canada
Issue: Volume 45–12: HIV
Date published: December 5, 2019
ISSN: 1481-8531
Submit a manuscript
About CCDR
Browse
Volume 45–12, December 5, 2019: HIV
Surveillance
HIV in Canada—Surveillance Report, 2018
N Haddad1, A Robert1, A Weeks1, N Popovic1, W Siu1, C Archibald1
Affiliation
1 Centre for Communicable Diseases and Infection Control, Public Health Agency of Canada, Ottawa, ON
Correspondence
Suggested citation
Haddad N, Robert A, Weeks A, Popovic N, Siu W, Archibald C. HIV in Canada—Surveillance Report, 2018. Can Commun Dis Rep 2019;45(12):304–12. https://doi.org/10.14745/ccdr.v45i12a01
Keywords: HIV, surveillance, gay, bisexual and other men who have sex with men, people who inject drugs, perinatal HIV, heterosexual contact, Canada
Abstract
Background: Human immunodeficiency virus (HIV) is a global public health issue, with an estimated 36.9 million people living with HIV in 2017. HIV has been reportable in Canada since 1985 and the Public Health Agency of Canada (PHAC) continues to monitor trends in new HIV diagnoses.
Objective: The objective of this surveillance report is to provide an overview of the epidemiology of all reported diagnoses of HIV in Canada since 1985 with a focus on 2018 overall, and by geographic location, age group, sex, and exposure category.
Methods: PHAC monitors HIV through the national HIV/AIDS Surveillance System, a passive, case-based system that collates nonnominal data that is voluntarily submitted by all Canadian provinces and territories. Descriptive epidemiological analyses were conducted on national data and those relating to specific populations provided by Immigration, Refugees and Citizenship Canada and the Canadian Perinatal HIV Surveillance Program.
Results: In 2018, a total of 2,561 HIV diagnoses were reported in Canada, an increase of 8.2% compared with 2017. The national diagnosis rate increased to 6.9 per 100,000 population in 2018 from 6.5 per 100,000 population in 2017. Saskatchewan reported the highest provincial diagnosis rate at 14.9 per 100,000 population. The 30–39 year age group continued to have the highest HIV diagnosis rate at 15.4 per 100,000 population. Overall, the diagnosis rate for males continued to be higher than that of females (9.8 versus 4.0 per 100,000 population, respectively); however, females experienced a larger increase in reported cases and diagnosis rate. The gay, bisexual and other men who have sex with men (gbMSM) exposure category continued to represent the highest proportion of all reported adult cases (41.4%), though the proportion has decreased over time. Five perinatal HIV transmissions were documented, three were related to the mother not receiving perinatal antiretroviral therapy prophylaxis.
Conclusion: The number and rate of reported HIV cases in Canada increased in 2018, gbMSM continued to account for the largest exposure category and the number and rate of reported HIV cases among women increased. PHAC will continue to work with its national partners to refine the collection, analysis and publication of national data to better understand the burden of HIV in Canada.
Introduction
Human immunodeficiency virus (HIV) remains a global public health issue. In 2017, the estimated number of people living with HIV had grown to 36.9 millionFootnote 1. HIV has been reportable in Canada since 1985 and the Public Health Agency of Canada (PHAC) continues to monitor trends in new HIV diagnoses. In Canada in 2017, there were 2,402 newly reported HIV diagnoses with a diagnosis rate of 6.5 per 100,000 populationFootnote 2, which is an increase from 2014 when the rate of new HIV diagnoses was 5.8 per 100,000 populationFootnote 2. Moreover, an estimated $686.8 million was spent on HIV prevention and treatment in Canada in 2015, demonstrating a significant economic burden of diseaseFootnote 3.
Recently, PHAC released a Pan-Canadian framework for action and an associated five-year action plan on sexually transmitted and bloodborne infections, which detail the importance of a common approach to addressing key populations disproportionately affected by these infectionsFootnote 4Footnote 5. Early HIV diagnosis and reporting is crucial for monitoring trends in newly diagnosed infections to inform and evaluate prevention and care programsFootnote 6Footnote 7Footnote 8Footnote 9.
The objective of this surveillance report is to provide an overview of the epidemiology of all reported diagnoses of HIV in Canada from 1985 to end of 2018, overall, as well as by geographic location, age group, sex and exposure category. As in previous reports, updated information on immigration medical screening results for HIV and on the number of infants perinatally exposed to HIV and perinatally infected with HIV are presented. This report will also discuss recent work completed by PHAC aimed at quantifying and explaining the effect of previously diagnosed cases of HIV on the trend of new HIV diagnoses in CanadaFootnote 10. In addition, although PHAC has historically published surveillance reports pertaining to newly diagnosed cases of AIDS, PHAC is reporting 2018 AIDS cases through the Canadian Notifiable Disease Surveillance SystemFootnote 11 and, as such, AIDS cases will not be presented here.
It is important to keep in mind that surveillance data describe only the diagnosed portion of the HIV epidemic. National HIV estimates of prevalence and incidence that describe the overall HIV epidemic in Canada, including people with both diagnosed and undiagnosed HIV infection, are produced using statistical modelling and additional sources of information; these are published separatelyFootnote 12.
Methods
Data sources
The data presented in this HIV surveillance report come from three different sources: the national HIV/AIDS Surveillance System (HASS) maintained by PHAC; immigration medical screening for HIV by Immigration, Refugees and Citizenship Canada (IRCC); and the Canadian Perinatal HIV Surveillance Program (CPHSP).
HIV/AIDS Surveillance System
The HASS is a passive, case-based surveillance system that collates nonnominal data on persons diagnosed with HIV infection who meet the national case definitionFootnote 13. Data, including but not limited to age, sex, race/ethnicity and risks associated with the transmission of HIV (exposure categories), are voluntarily submitted to PHAC from provincial and territorial public health authorities. For the purposes of this report, an “adult” is anyone aged 15 years or older.
It is important to note that Quebec does not submit exposure category or race/ethnicity information for HIV cases to PHAC, British Columbia does not submit race/ethnicity information for HIV cases to PHAC and Ontario has no race/ethnicity data available for reported HIV cases prior to 2009. In addition, for 2018, Saskatchewan attributed cases to being Indigenous or non-Indigenous only with respect to race/ethnicity without further breakdown.
Provinces and territories provide data through the National Case Report FormFootnote 14 or through a secure electronic dataset transmission. All raw data (paper forms and electronic datasets) are retained in compliance with the Directive for the Collection, Use and Dissemination of Information relating to Public Health (PHAC, 2013, unpublished document). Data quality assessment, such as the detection of duplicate entries, is handled by the provinces and territories prior to submission to PHAC. The data presented in this surveillance report represent newly reported HIV cases diagnosed on or before December 31, 2018, that were submitted by provincial and territorial surveillance programs to PHAC up to July 12, 2019. Additional details on the HASS’s methods can be found elsewhereFootnote 2Footnote 14.
Immigration medical screening for HIV
All foreign nationals 15 years of age and older applying for permanent residence and some applying for temporary residence in Canada must undergo an Immigration Medical Exam (IME) administered by IRCC, either in Canada or overseas. IRCC provides PHAC with nonnominal data collected during the IME on migrants who tested positive for HIV, either in Canada or overseas. The term “migrant” is used broadly and includes the following: immigrants (permanent residents of Canada); refugees; refugee claimants or convention refugees; and temporary residents (visitors, students or foreign workers). The IME data presented here were obtained from IRCC’s Global Case Management System, updated to March 2019, which contains the IME information for all applicants screened in Canada or overseas who tested positive for HIV. Aggregate data were provided to PHAC in July 2019. The data presented in this report focus on those tested in Canada.
IRCC shares nominal data from overseas IME test results with provinces and territories for all clients who have been diagnosed as having HIV and have a valid Canadian residential address on file that indicates their current province/territory of residence. These data may subsequently be incorporated, to varying degrees, into the provincial/territorial routine HIV case-based surveillance systems, with some jurisdictions reporting these HIV-positive migrant cases as a new diagnosis and others excluding them from provincial/territorial reporting to PHAC.
Canadian Perinatal HIV Surveillance Program
National data on the HIV status of infants exposed perinatally to HIV infection are collected through the CPHSP, an initiative of the Canadian Paediatric AIDS Research Group. The CPHSP is a sentinel-based active surveillance system that collects data on two groups of children: infants born to HIV-positive women and HIV-infected children receiving care at any participating site (whether born in Canada or abroad). Additional information on CPHSP methodology has been described previouslyFootnote 2. Surveillance data for 2018, including data updates for previous years, were submitted to PHAC in March 2019.
Analysis
Descriptive trends overall and by geography, age group, sex, exposure category and key population are presented. Microsoft Excel 2010 (Redmond, Washington, United States [US]) and SAS Enterprise Guide v7.1 (Cary, North Carolina, US) software were used for data cleaning and analysis. Standardized data recoding procedures were applied to all submitted provincial and territorial datasets to create a national dataset for analysis. The surveillance data presented in this report were validated by all provinces and territories to ensure accuracy. No statistical procedures were used for comparative analysis, nor were any statistical techniques applied to account for missing data since analyses were limited to cross-tabulations due to the descriptive nature of the analysis. The proportions presented in the text exclude records with missing values unless otherwise noted.
The population data source used to calculate rates was the Annual Demographic Statistics, issued by Statistics Canada in July 2018Footnote 15.
Supplementary tables are listed in the Appendix and are available upon request.
Results
Overall trends
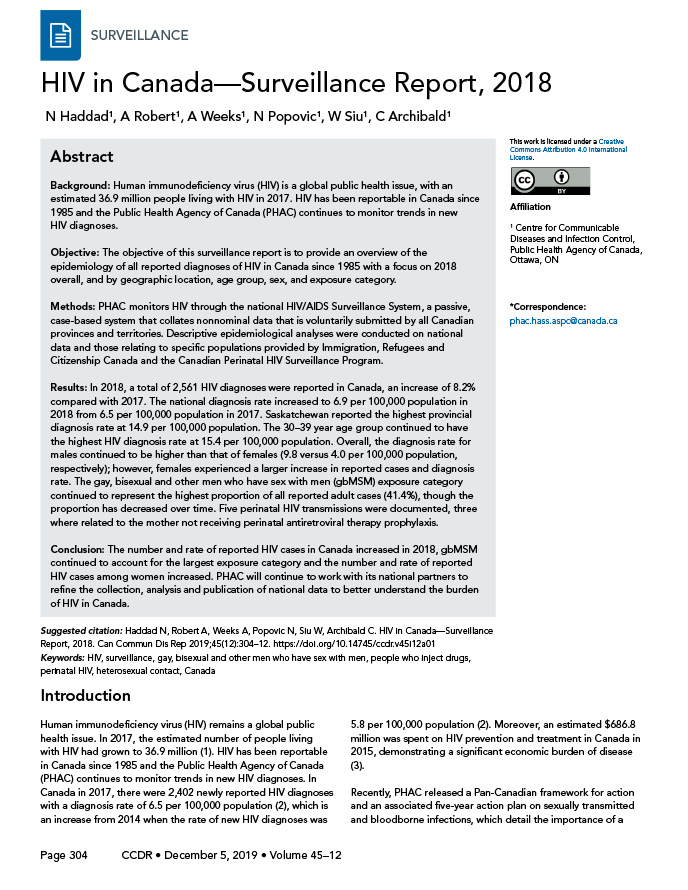
A cumulative total of 88,881 HIV diagnoses have been reported to PHAC since HIV reporting began in Canada in 1985. In 2018, a total of 2,561 HIV diagnoses were reported, an increase of 8.2% compared with 2017. The national diagnosis rate has fluctuated over the years with a downward trend between 2008 and 2015, followed by slight increases to 6.9 per 100,000 population in 2018 (Figure 1).
Figure 1: Number of reported cases of HIV and diagnosis rates overall, by sex and year, Canada, 1996–2018Figure 1 footnote a
Text description: Figure 1
Figure 1: Number of reported cases of HIV and diagnosis rates overall, by sex and year, Canada, 1996–2018Figure 1 footnote a
| Year of test | Total number of reported HIV cases |
Overall rate | Male rate | Female rate |
|---|---|---|---|---|
| 1996 | 2,713 | 9.2 | 14.2 | 3.7 |
| 1997 | 2,442 | 8.2 | 12.7 | 3.2 |
| 1998 | 2,261 | 7.5 | 11.6 | 3.2 |
| 1999 | 2,168 | 7.1 | 10.7 | 3.4 |
| 2000 | 2,035 | 6.6 | 10.1 | 3.1 |
| 2001 | 2,163 | 7.0 | 10.4 | 3.5 |
| 2002 | 2,389 | 7.6 | 11.4 | 3.8 |
| 2003 | 2,415 | 7.6 | 11.4 | 3.8 |
| 2004 | 2,455 | 7.7 | 11.4 | 4.0 |
| 2005 | 2,411 | 7.5 | 11.2 | 3.8 |
| 2006 | 2,471 | 7.6 | 11.0 | 4.2 |
| 2007 | 2,383 | 7.2 | 10.9 | 3.6 |
| 2008 | 2,585 | 7.8 | 11.6 | 3.9 |
| 2009 | 2,343 | 7.0 | 10.4 | 3.6 |
| 2010 | 2,280 | 6.7 | 10.3 | 3.1 |
| 2011 | 2,257 | 6.6 | 10.0 | 3.1 |
| 2012 | 2,056 | 5.9 | 9.1 | 2.7 |
| 2013 | 2,046 | 5.8 | 9.2 | 2.5 |
| 2014 | 2,040 | 5.8 | 8.7 | 2.8 |
| 2015 | 2,078 | 5.8 | 8.9 | 2.8 |
| 2016 | 2,318 | 6.4 | 9.9 | 3.0 |
| 2017 | 2,368 | 6.5 | 9.8 | 3.2 |
| 2018 | 2,561 | 6.9 | 9.8 | 4.0 |
Since 2009, the diagnosis rates for males and females have fluctuated. For males, there has been a slight decrease since 2009 (10.4 per 100,000 population in 2009 to 9.8 per 100,000 population in 2018). For females, the rate of HIV diagnoses has fluctuated between 2.5 and 4.2 per 100,000 population since 1996. In the last five years, the rate increased: 2.5 in 2013, 3.2 in 2017 and 4.0 in 2018, always per 100,000 population.
Geographic distribution
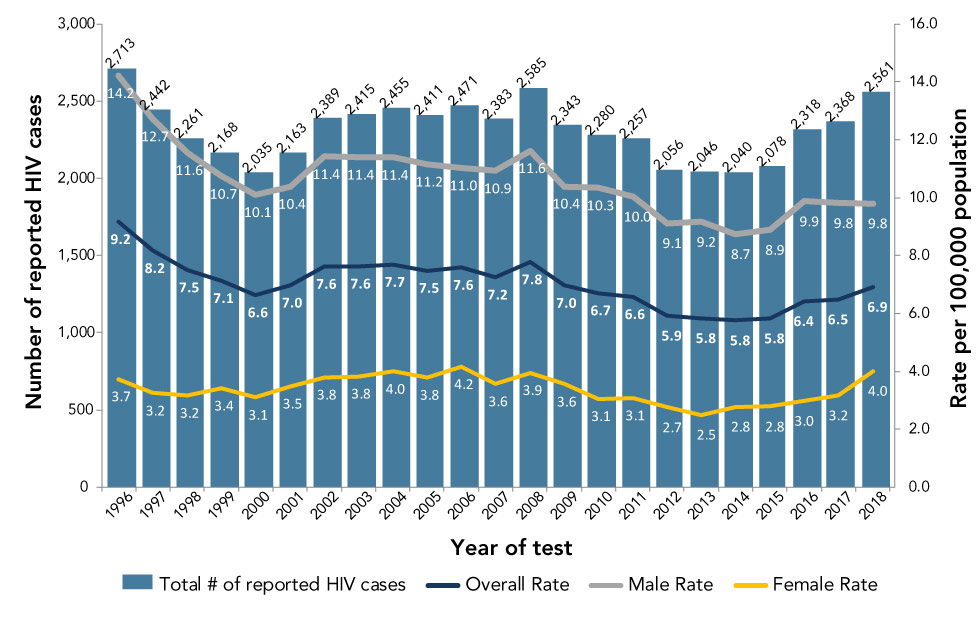
In 2018, Ontario accounted for the highest number and proportion of reported HIV cases in Canada (n=1,003, 39.2%), followed by Quebec (n=766, 29.9%), Alberta (n=249, 9.7%) and British Columbia (n=199, 7.8%). As in 2017, the provincial and territorial rates of reported HIV diagnoses varied across Canada. Saskatchewan continued to have the highest diagnosis rate at 14.9 per 100,000 population, although the province accounted for only 6.8% of the total number of reported HIV cases. Quebec had the second highest diagnosis rate at 9.1 per 100,000 population followed by Manitoba (7.9 per 100,000 population), and Ontario (7.0 per 100,000 population) (Figure 2). Increases in the rate of HIV diagnoses were observed in Quebec, Manitoba and Ontario (from 8.1, 6.7 and 6.5 per 100,000 population in 2017, respectively), while Saskatchewan and Alberta experienced decreases (from 15.6 and 6.8 per 100,000 population in 2017, respectively). An increase was observed in the diagnosis rates for females in British Columbia, Saskatchewan, Manitoba, Ontario and Quebec from 2017 to 2018.
Figure 2: HIV diagnosis rate (per 100,000 population) by province and territory, Canada, 2018Figure 2 footnote a
Text description: Figure 2
Figure 2: HIV diagnosis rate (per 100,000 population) by province and territory, Canada, 2018Figure 2 footnote a
Figure 2 is a map of Canada that identifies the provincial, territorial, and national HIV diagnosis rates across the country in 2018. The national HIV diagnosis rate in Canada was 6.9 per 100,000 population in 2018. The colours denote the HIV diagnosis rate: light green denotes an HIV diagnosis rate between 0.1 and 3.0 per 100,000 population; turquoise denotes an HIV diagnosis rate between 3.1 and 6.9 per 100,000 population; blue denotes an HIV diagnosis rate of 7.0 to 9.0 per 100,000 population; dark blue denotes an HIV diagnosis rate of greater than or equal to 9.1 per 100,000 population.
| Year | HIV diagnosis rate (per 100,000 population) | |||||||
|---|---|---|---|---|---|---|---|---|
| Territories (Light green) |
British Columbia (Turquoise) |
Alberta (Turquoise) |
Saskatchewan (Dark blue) |
Manitoba (Blue) |
Ontario (Blue) |
Quebec (Dark blue) |
Atlantic (Light green) |
|
| 2018 | 2.5 | 4.0 | 5.8 | 14.9 | 7.9 | 7.0 | 9.1 | 2.8 |
Age group and sex distribution
In 2018, data on age groups were available for nearly 100% (n=2,558) of all reported HIV cases. The 30–39 year age group continued to have the highest number and proportion of reported HIV cases (n=778, 30.4%), which is similar to 2017. The ≥50 and 20–29 year age group presented the second highest proportion of reported HIV cases at 22.5% for each age group (n=576 and n=575, respectively). This was followed by the 40–49 year age group (n=559, 21.9%). The 15–19 age group and children (less than 15 years of age) represented 1.6% and 1.1% of new HIV diagnoses, respectively.
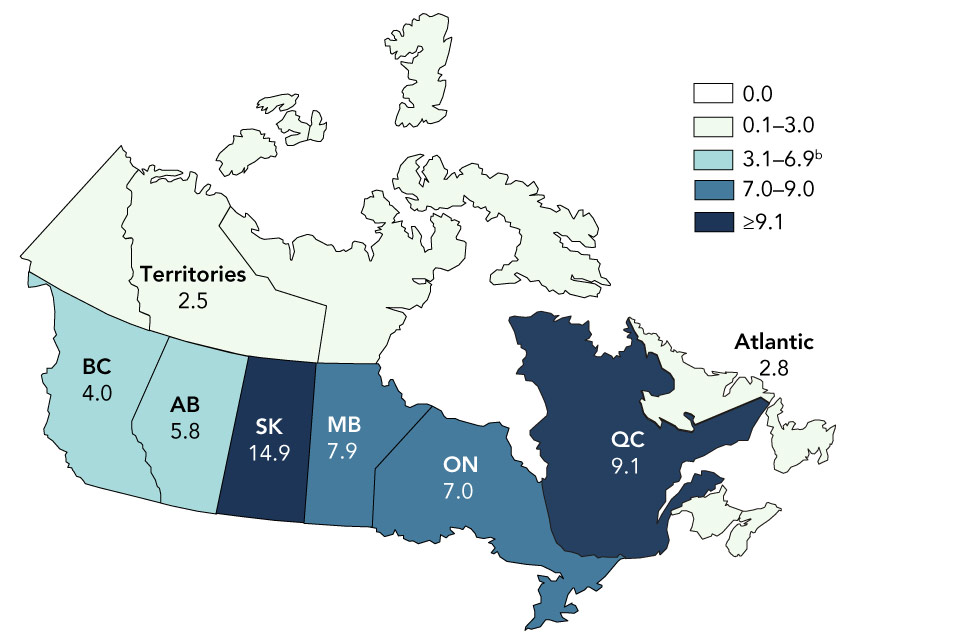
Accordingly, the 30–39 year age group had the highest rate of reported HIV cases at 15.4 per 100,000 population (Figure 3). The 40–49 year age group had the second highest rate at 11.7 per 100,000 population, followed by the 20–29 year age group at 11.5 per 100,000 population. The 20–29 year and 40–49 year age groups have had similar rates since 2016. Overall, the diagnosis rates for children (less than 15 years of age), the 15–19 year age group, and those who are 50 years of age or older remained relatively stable over the last five years.
Figure 3: HIV diagnosis rate, by age group and year, Canada, 2014–2018Figure 3 footnote a
Text description: Figure 3
Figure 3: HIV diagnosis rate, by age group and year, Canada, 2014–2018Figure 3 footnote a
| Age group | Rate per year | ||||
|---|---|---|---|---|---|
| 2014 | 2015 | 2016 | 2017 | 2018 | |
| Children younger than 15 years | 0.2 | 0.2 | 0.2 | 0.3 | 0.5 |
| 15 to 19 years | 1.7 | 1.9 | 2.3 | 2.0 | 1.9 |
| 20 to 29 years | 9.0 | 10.6 | 10.8 | 10.8 | 11.5 |
| 30 to 39 years | 13.4 | 11.7 | 13.8 | 14.7 | 15.4 |
| 40 to 49 years | 9.6 | 9.3 | 10.4 | 10.9 | 11.7 |
| Older than or equal to 50 | 3.4 | 3.7 | 4.1 | 3.8 | 4.1 |
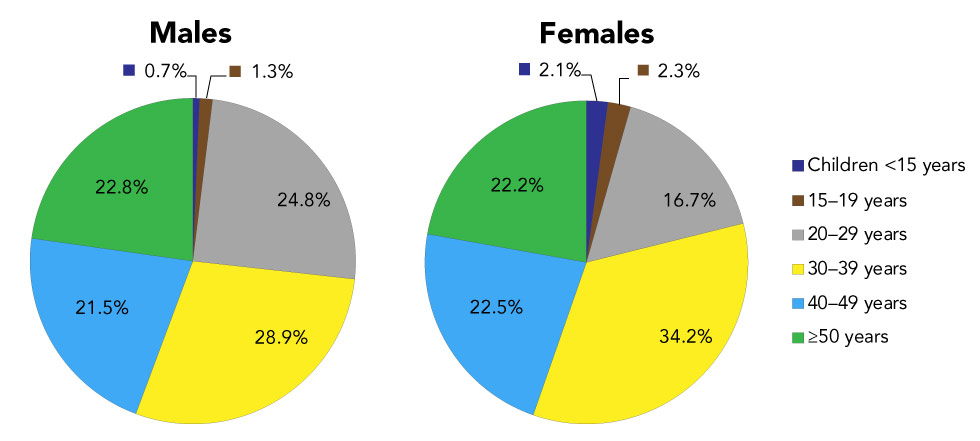
In 2018, data on sex were available for nearly 100% (n=2,552) of all reported HIV cases. Males accounted for 70.7% of them, while females accounted for 29.3%. This is a slight change in the proportion between sexes when compared with 2017, where males accounted for 75.3% of reported HIV cases and females accounted for 24.7%, where sex was known. The 30–39 year age group had the highest proportion of HIV cases in both males (n=521, 28.9%) and females (n=256, 34.2%) (Figure 4). The proportions of HIV cases in the 40–49 year and ≥50 year age groups were similar for both males and females. However, the proportion of HIV cases was lower in females for the 20–29 year age group, and higher in both the 15–19 year and <15 year age groups.
Figure 4: Proportion of new HIV cases, by age group and sex, Canada, 2018Figure 4 footnote aFigure 4 footnote b
Text description: Figure 4
Figure 4: Proportion of new HIV cases, by age group and sex, Canada, 2018Figure 4 footnote aFigure 4 footnote b
| Age Group | Males | Females |
|---|---|---|
| Children younger than 15 years | 12 | 16 |
| 15–19 years | 23 | 17 |
| 20–29 years | 447 | 125 |
| 30–39 years | 521 | 256 |
| 40–49 years | 388 | 168 |
| Older than or equal to 50 | 410 | 166 |
Similar to the overall trend, when stratifying by sex the highest diagnosis rates were observed in the 30–39 year age group at 20.5 per 100,000 population for males and 10.1 per 100,000 population for females. When observing the rates in other age groups, the 20–29 and the 40–49 year age groups had the second and third highest diagnosis rates in males at 17.2 and 16.4 per 100,000 population, respectively. The opposite trend was observed in the female population where the 40–49 year age group had the second highest diagnosis rate at 7.0 per 100,000 population, followed by the 20–29 year age group with a rate of 5.2 per 100,000 population.
Overall, since 2014, males aged 20–29 years old experienced the highest increase in HIV diagnosis rates; whereas in females, those aged 30–39 years had the highest increase in HIV diagnosis rates, followed by the 40–49 year age group.
Exposure category distribution
Trends in exposure category have shifted since HIV reporting began in 1985. Over the years, although the gay, bisexual and other men who have sex with men (gbMSM) exposure category has continued to account for the highest proportion of cases, the proportion has decreased over time. In 2018, among all cases where exposure category was known (n=1,462, 57.1%), 41.4% of all reported cases in adults (n=600 of 1,450) were attributed to the gbMSM exposure category (Table 1). This was a decrease from 46.6% in 2017. The second most reported exposure category among adults continued to be heterosexual contact at 32.3% of adult cases with known exposure, and a shift was observed in the distribution of the proportions for each heterosexual contact subgroup in the past five years. The proportion of the three heterosexual subgroups was almost equal in 2014, with an average of 9.6%, whereas in 2018, this distribution varied with 15.4% attributed to heterosexual contact among people born in a country where HIV is endemic (Het-Endemic), 6.2% among heterosexual contact with a person at risk (Het-Risk) and 10.7% among heterosexual contact with no identified risk (Het-NIR). People who inject drugs (PWID) accounted for the third most frequently reported exposure category among adults in 2018 at 18.3% (Table 1).
| Exposure category | 2017 | 2018 | ||||||||||
|---|---|---|---|---|---|---|---|---|---|---|---|---|
| Male | Female | TotalFootnote a of Table 1 | Male | Female | TotalFootnote a of Table 1 | |||||||
| n | % | n | % | n | % | n | % | n | % | n | % | |
| gbMSM | 667 | 61.0 | n/a | n/a | 667 | 46.6 | 600 | 58.1 | n/a | n/a | 600 | 41.4 |
| gbMSM/PWID | 39 | 3.6 | n/a | n/a | 39 | 2.7 | 49 | 4.7 | n/a | n/a | 49 | 3.4 |
| PWID | 138 | 12.6 | 93 | 27.6 | 232 | 16.2 | 146 | 14.1 | 118 | 28.4 | 265 | 18.3 |
| Heterosexual contact | 204 | 18.6 | 207 | 61.4 | 412 | 28.8 | 200 | 19.4 | 266 | 64.1 | 468 | 32.3 |
|
62 | 5.7 | 105 | 31.2 | 167 | 11.7 | 82 | 7.9 | 140 | 33.7 | 223 | 15.4 |
|
51 | 4.7 | 46 | 13.6 | 98 | 6.8 | 37 | 3.6 | 52 | 12.5 | 90 | 6.2 |
|
91 | 8.3 | 56 | 16.6 | 147 | 10.3 | 81 | 7.8 | 74 | 17.8 | 155 | 10.7 |
| OtherFootnote b of Table 1 | 46 | 4.2 | 37 | 11.0 | 83 | 5.8 | 37 | 3.6 | 31 | 7.5 | 68 | 4.7 |
| SubtotalFootnote c of Table 1 | 1,094 | 100.0 | 337 | 100.0 | 1,433 | 100.0 | 1,032 | 100.0 | 415 | 100.0 | 1,450 | 100.0 |
| No identified riskFootnote d of Table 1 | 60 | 3.4 | 8 | 1.4 | 69 | 2.9 | 54 | 3.0 | 22 | 3.0 | 77 | 3.0 |
| Exposure category unknown or not reported (“missing”)Footnote e of Table 1 | 613 | 34.7 | 230 | 40.0 | 846 | 36.0 | 703 | 39.3 | 295 | 40.3 | 1,002 | 39.6 |
| Total | 1,767 | n/a | 575 | n/a | 2,348 | n/a | 1,789 | n/a | 732 | n/a | 2,529 | n/a |
Analysis of the exposure category variable was done separately for males and females since the gbMSM exposure category only applies to males. Among adult males in 2018, the gbMSM exposure category accounted for the highest proportion (58.1%) of reported cases, and in adult females, exposure through heterosexual contact accounted for the highest proportion at 64.1% (33.7% Het-Endemic, 12.5% Het-Risk and 17.8% Het-NIR). In addition, PWID accounted for a little over a quarter of adult female HIV cases (28.4%) compared to 14.1% among adult males (Table 1).
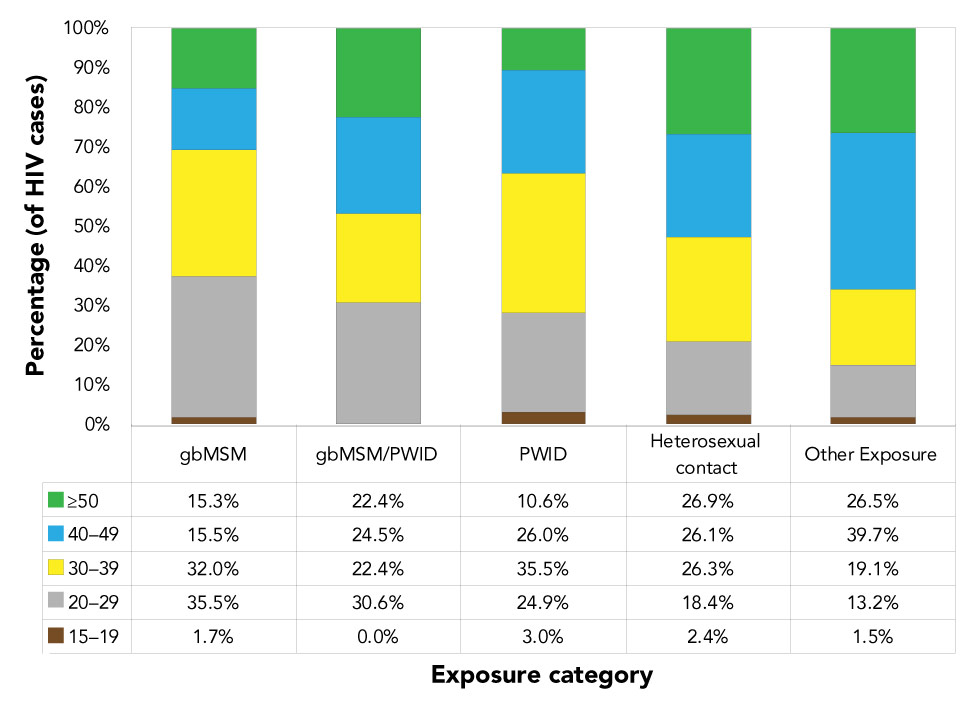
In 2018, more than one third of reported gbMSM HIV cases were between 20–29 years of age (35.5%) and around one third were aged 30–39 years (32%) (Figure 5). Similarly, 30.6% of gbMSM/PWID cases were 20–29 years of age, and a similar distribution was observed for cases aged 30–39 years, 40–49 years and those ≥50 years (22.4%, 24.5% and 22.4%, respectively). Among the PWID risk group, cases were reported among a slightly older age group compared to gbMSM and gbMSM/PWID with 35.5% of cases aged 30–39 years. Cases reported within the heterosexual contact exposure category were evenly distributed among the 30–39, 40–49 and ≥50 year age groups (26.3%, 26.1% and 26.9%, respectively).
Figure 5: Proportion of reported HIV cases (≥15 years of age) by exposure category and age group, Canada, 2018Figure 5 footnote aFigure 5 footnote b
Text description: Figure 5
Figure 5: Proportion of reported HIV cases (≥15 years of age) by exposure category and age group, Canada, 2018Figure 5 footnote aFigure 5 footnote b
| Age group | Exposure category / Percentage of HIV cases | ||||
|---|---|---|---|---|---|
| gbMSM | gbMSM/PWID | PWID | Heterosexual contact | Other Exposure | |
| 15 to 19 years | 1.7% | 0.0% | 3.0% | 2.4% | 1.5% |
| 20 to 29 years | 35.5% | 30.6% | 24.9% | 18.4% | 13.2% |
| 30 to 39 years | 32.0% | 22.4% | 35.5% | 26.3% | 19.1% |
| 40 to 49 years | 15.5% | 24.5% | 26.0% | 26.1% | 39.7% |
| Older than or equal to 50 | 15.3% | 22.4% | 10.6% | 26.9% | 26.5% |
Race/ethnicity information
Over the years, the extent of completion of national data for race/ethnicity has varied. Race/ethnicity is not presented in this report, as it has been in previous reports, for two main reasons. First, race/ethnicity information was available for less than half of reported HIV cases in 2018 (n=1,196, 46.7%, excluding Quebec and British Columbia). In addition, in 2018 for the first time, Saskatchewan attributed cases to two categories only: Indigenous and non-Indigenous, with no further breakdown. Secondly, due to Canada’s diversity and recent changes to Statistics Canada’s methodology for categorizing ethnic originFootnote 16, the current categories for race/ethnicity may need to be reassessed.
Of the cases with known race/ethnicity information, 19.3% were reported as Indigenous and 80.7% were reported as other races/ethnicities. These results are similar to those seen in 2017, when 20.1% were reported as Indigenous and 79.9% as other races/ethnicities.
Immigration medical screening for HIV
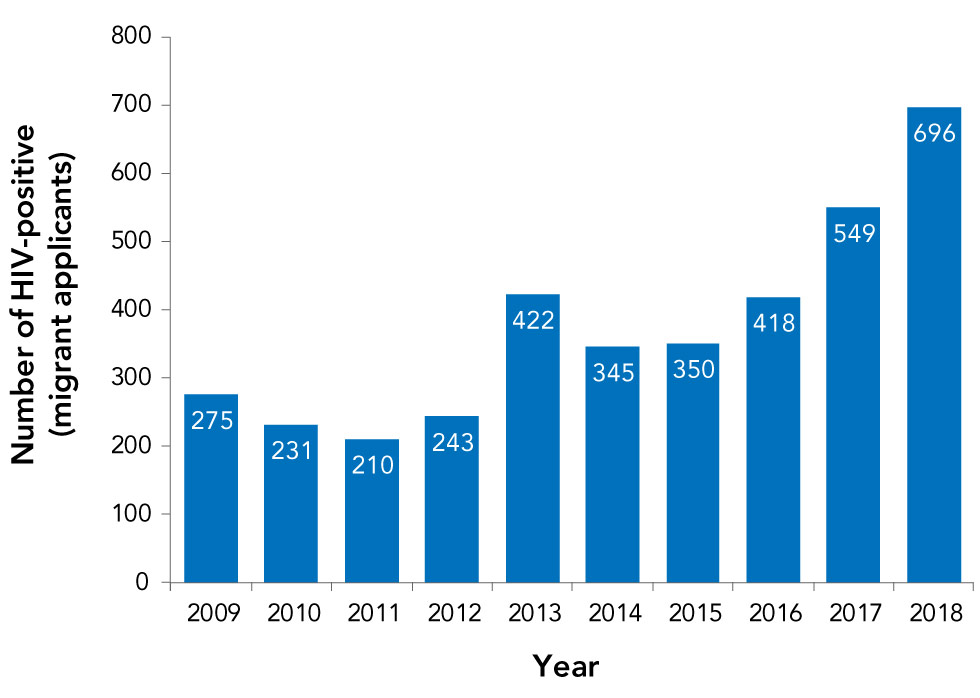
In 2018, a total of 1,026 migrants tested positive for HIV through the IME. Of these, 696 were tested in Canada (Figure 6) and 330 were tested overseas. This is an increase from 2017, when a total of 835 migrants tested positive on an IME, with 549 tested in Canada. Migrants who tested positive on the IME in Canada are highlighted in this report because these individuals are tested within the provincial/territorial public health systems and are therefore captured in the HASS.
Figure 6: Number of migrants who tested positive for HIV during an Immigration Medical Exam conducted in Canada, 2009–2018
Text description: Figure 6
Figure 6: Number of migrants who tested positive for HIV during an Immigration Medical Exam conducted in Canada, 2009–2018
| Year | Number of HIV-positive (migrant applicants) |
|---|---|
| 2005 | 282 |
| 2006 | 373 |
| 2007 | 308 |
| 2008 | 365 |
| 2009 | 275 |
| 2010 | 231 |
| 2011 | 210 |
| 2012 | 243 |
| 2013 | 422 |
| 2014 | 345 |
| 2015 | 350 |
| 2016 | 418 |
| 2017 | 549 |
| 2018 | 696 |
Of applicants tested in Canada from 2009 to 2018, a total of 3,739 migrants were diagnosed with HIV with an average of 374 per year (range 210–696). Slightly more than half of the HIV-positive migrants tested in Canada in 2018 were male (57.0%) and the majority of all applicants tested in Canada were 30–39 years old (39.8%), followed by 40–49 years old (26.4%). Individuals aged 20–29 years old, or ≥50 years accounted for 16% each of the total. The majority of HIV positive applicants resided in Ontario (52.7%) and Quebec (29.3%).
Canadian Perinatal HIV Surveillance System
There were 259 infants perinatally exposed to HIV in Canada in 2018. Of these, five infants were confirmed to be infected with HIV. Among these five infants, three were born to mothers who did not receive perinatal antiretroviral therapy (ART) prophylaxis and two were born to mothers who received perinatal ART prophylaxis. The number of infants perinatally exposed and confirmed to be infected with HIV has fluctuated slightly since 2011, but remained within the range of two to nine confirmed infected infants per year. The percentage of HIV-positive mothers receiving ART remained relatively stable in the last two years at 95.9% in 2017 and 96.5% in 2018.
In 2018 the most frequently reported exposure for mothers continued to be heterosexual contact at 75.0%, followed by PWID at 20.1%. With respect to the racial/ethnic origin of the mothers, 54.4% of perinatally exposed infants were born to mothers identified as Black in 2018. This was followed by 22.8% and 16.2% of HIV-exposed infants born to Indigenous and Caucasian mothers, respectively. The maternal region of birth for the majority of infants perinatally exposed to HIV in 2018 was Africa (45.2%) followed by North America (39.8%).
Discussion
In Canada, 2,561 HIV diagnoses were reported in 2018. This is an increase of 8.2% compared with 2017, and an overall increase of 9.3% in the last decade. The national diagnosis rate in 2018 was 6.9 per 100,000 population, a slight increase from 6.5 per 100,000 in 2017. It is difficult to situate Canada’s 2018 HIV diagnosis rate among other high income countries as most of them have not yet released their 2018 HIV surveillance data. With respect to 2017 data, rates of new HIV diagnoses varied between countries; for instance, the US, Australia and the United Kingdom reported national rates of 11.8, 4.0 and 6.7 per 100,000 population, respectivelyFootnote 17Footnote 18Footnote 19, compared with 6.5 per 100,000 population in Canada in 2017.
As previously discussedFootnote 2, the increase in the number of new HIV diagnoses observed since 2014 in Canada may be due to several factors: an increase in HIV transmission (i.e. HIV incidence); an increase in HIV testing; changes in reporting practices; and/or an increase in the number of HIV-positive people migrating to Canada who are either testing positive for HIV for the first time in Canada or are re-testing in Canada (Figure 6). Data from IRCC indicate that while the proportion of migrants with positive HIV test results on their IME has remained relatively stable in recent years, the overall number of people migrating to Canada has increased. Of the 696 migrants who tested positive for HIV during in-Canada IMEs in 2018, it is not known how many were infected with HIV overseas versus in Canada, since the time between arrival in Canada and undergoing an IME varies. This distinction between HIV being acquired overseas versus in Canada is important because the focus of national surveillance is examining the epidemiology of domestic HIV transmission. Although a migrant who was infected overseas may be testing positive for the first time in Canada (and this information is important for measures of HIV prevalence and health services planning), counting the case as a “new” diagnosis complicates the interpretation and use of the national diagnosis rate as an indicator of domestic transmission. Other organizations such as the European Centre for Disease Prevention and Control are developing methods to distinguish between these two groups, and PHAC hopes to continue working with IRCC to follow suit.
A first step in identifying (and separating out from national HIV surveillance counts) migrants who were infected with HIV outside of Canada is identifying individuals who report a previous diagnosis of HIV in another country. PHAC recently analyzed national data between 2007 and 2017 to identify cases using a common definition of “previous HIV-positive test result” to quantify the effect of all previously diagnosed cases, whether in another country or another province, on the national trend. The percent increase in HIV diagnoses over this time period decreased from 16% (reported in the previous annual surveillance report)Footnote 2 to 9% when previously diagnosed cases were removedFootnote 10. Moving forward, future national surveillance reports will present trends of new HIV diagnoses (not known to be previously diagnosed) separately from all HIV diagnoses. Continuation of this work will refine the number and rate of new diagnoses, leading to more precise information about transmission of HIV within Canada.
As reported historically, the gbMSM exposure category remains the largest proportion of new HIV diagnoses and accounted for over half of adult male cases (58.1%) in 2018. However, the proportion of gbMSM cases has declined over time. Moreover, since 1996, the rate of HIV diagnoses in females has fluctuated between 2.5 to 4.2 per 100,000 population. In the last five years, the rate has increased from 2.5 to 4.0 per 100,000 population in 2018. The provinces of British Columbia, Saskatchewan, Manitoba, Ontario and Quebec observed increased rates in the female population in 2018 when compared with 2017. Increased rates in females have not been observed in other high income countries: diagnosis rates among females in Australia have been stable with the highest rates among women aged 30–39 years oldFootnote 19, and the US and the United Kingdom both reported a decrease in the diagnosis rates for womenFootnote 17Footnote 18. This increase among females in Canada is observed across all exposure categories and future data will help determine its significance.
Strengths and limitations
The main strength of this report is that it is the only source of national epidemiological data on all reported HIV diagnoses in Canada.
Limitations of HASS have been described previouslyFootnote 2Footnote 14. One limitation to note is the variation in reporting of previously diagnosed cases among the provinces and territories; the inclusion of some of these cases has likely led to an over counting of new HIV diagnoses in CanadaFootnote 10. Future surveillance information will include methods to mitigate this limitation. Additionally, conclusions on race/ethnicity of newly reported HIV diagnoses in 2018 could not be made due to missing data from provincial/territorial submissions. Moving forward, PHAC will work with its surveillance partners to improve race/ethnicity information to understand these trends among those newly diagnosed with HIV.
Data in this report are considered provisional and may be subject to change in future HIV surveillance reports. If there are discrepancies between the data summarized in this report and provincial and territorial reports, the most recent provincial and territorial report should be used because updated national data may still be pending.
Conclusion
The number and rate of reported HIV cases in Canada increased in 2018 and this may be due in part to cases who were diagnosed for the first time within a province and territory but had been previously diagnosed either in other provinces or from outside the country. The gbMSM exposure category continued to account for the highest exposure category proportion of HIV in Canada, although this proportion has decreased. The number and rate of new diagnoses increased among women in all exposure categories. PHAC will continue to work with provinces and territories to more accurately describe the trends in HIV transmission occurring in Canada, including the identification of previously diagnosed cases.
Authors’ statement
- NH — Conceptualization, research, writing, original draft, final draft, review, editing, data validation, visualization, supervision
- AR — Data management, data validation, research
- AW — Data validation, editing, research
- NP — Review, editing, supervision
- WS — Review, editing, supervision
- CA — Review, editing
Conflict of interest
None.
Acknowledgements
The Public Health Agency of Canada would like to acknowledge the following individuals from the provincial and territorial HIV/AIDS programs for their contribution and participation: S Fathima, Alberta Health; A O’Brien, Alberta Health; J Wong, Clinical Prevention Service, Surveillance and Epidemiology, BC Centre for Disease Control; C Loeppky, Manitoba Health; R RaaFat Gad, New Brunswick Department of Health; S Landsburg, New Brunswick Department of Health; S Wertz, New Brunswick Department of Health; B Halfyard, Department of Health and Community Services, Newfoundland and Labrador; M O’Driscoll, Department of Health and Community Services, Newfoundland and Labrador; H Hannah, Department of Health and Social Services, Northwest Territories; B Billard, Nova Scotia Department of Health and Wellness; S Fleming, Nova Scotia Department of Health and Wellness; K Kullerperuma, Nunavut Department of Health; A Kroch, Ontario Treatment Network; J Liu, Public Health Ontario; M Murti, Public Health Ontario; M Whelan, Public Health Ontario; S Baidoobonso, Prince Edward Island Department of Health and Wellness; C Cheverie, Prince Edward Island Department of Health and Wellness; R Bitera, Direction des risques biologiques et de la santé au travail, Institut national de santé publique du Québec; M Fauvel, Laboratoire de santé publique du Québec, Institut national de santé publique du Québec; M Hastie, Laboratoire de santé publique du Québec, Institut national de santé publique du Québec; R Parent, Direction des risques biologiques et de la santé au travail, Institut national de santé publique du Québec; B Serhir, Laboratoire de santé publique du Québec, Institut national de santé publique du Québec; D Sylvain, Laboratoire de santé publique du Québec, Institut national de santé publique du Québec; H Bangura, Saskatchewan Ministry of Health; J Manalo, Saskatchewan Ministry of Health; R Wallace, Yukon Communicable Disease Control; L Strudwick, Yukon Communicable Disease Control; S Plitt, Public Health Agency of Canada, Alberta; E Wong, Public Health Agency of Canada, British Columbia; J Paul, Public Health Agency of Canada, Manitoba; H Rilkoff, Public Health Agency of Canada, Ontario; T. Schellenberg, Public Health Agency of Canada, Saskatchewan; M Nichols Public Health Agency of Canada, Nova Scotia.
Funding
This work was supported by the Public Health Agency of Canada as part of its core mandate.
Appendix: List of supplementary tables
These tables are available upon request at: phac.hass.aspc@canada.ca.
- Table S1: HIV diagnosis rate (per 100,000 population) by province/territory and year of diagnosis (all ages)
- Table S2: Number of HIV cases (all ages) by province/territory, sex and year of diagnosis—Canada, 1985–2018
- Table S3: Number of HIV cases by age group and province/territory—Canada, 2017–2018
- Table S4: Cumulative number of HIV cases among adults (≥15 years old) and children (<15 years old) by sex—Canada, between November 1, 1985 and December 31, 2018
- Table S5: Number of HIV cases among adults (≥15 years old) by year of diagnosis and sex—Canada, 1985–2018
- Table S6: Number of HIV cases by age group, sex and year of diagnosis—Canada, 1985–2018
- Table S7: Number and percentage distribution of HIV cases among adults (≥15 years old) by exposure category and year of diagnosis—Canada, 1985–2018
- Table S8: Number and percentage distribution of HIV cases among adult males (≥15 years old) by exposure category and year of diagnosis—Canada, 1985–2018
- Table S9: Number and percentage distribution of HIV cases among adult females (≥15 years old) by exposure category and year of diagnosis—Canada, 1985–2018
- Table S10: Number and percentage distribution of HIV cases among adults (≥15 years old) by exposure category and age group—Canada, 2016–2018
- Table S11: Number of HIV cases by exposure category and province/territory—Canada, 2016–2018
- Table S12: Number and percentage distribution of immigration applicants to Canada diagnosed with HIV as a result of an Immigration Medical Exam by year—2002–2018
- Table S13: Number and percentage distribution of immigration applicants to Canada diagnosed with HIV as a result of an Immigration Medical Exam by sex, age group and province—2002–2018
- Table S14: Number of perinatally HIV-exposed infants by year of birth, current status and use of antiretroviral therapy for prophylaxis—Canada, 1984–2018
- Table S15: Number of perinatally HIV-exposed infants by maternal exposure category and year of infant birth—Canada, 1984–2018
- Table S16: Number of perinatally HIV-exposed infants by ethnic status and infection status—Canada, 1984–2018
- Table S17: Number of perinatally HIV-exposed infants by maternal country of birth and infection status—Canada, 1984–2018
- Table S18: Number of perinatally HIV-exposed infants by geographic region and status at last report—Canada, 1984–2018
- Table S19: International statistics on reported HIV cases—Canada, 2017
- Table S20: Rates of HIV cases by age group, sex and year of diagnosis—Canada, 2014–2018
