
Best practices for presenting data in tables and figures

 Download this article as a PDF
Published by: The Public Health Agency of Canada
Issue: Volume 46–7/8: Mandatory childhood immunization programs
Date published: July 2, 2020
ISSN: 1481-8531
Submit a manuscript
About CCDR
Browse
Volume 46–7/8, July 2, 2020: Mandatory childhood immunization programs
Overview
Effective presentation of data in tables and figures
Patricia Huston1
Affiliation
1 Office of the Chief Science Officer, Public Health Agency of Canada, Ottawa, ON (at the time the article was written)
Correspondence
Suggested citation
Huston P. Effective presentation of data in tables and figures. Can Commun Dis Rep 2020;46(7/8):242–6. https://doi.org/10.14745/ccdr.v46i78a05
Keywords: tables, figures, scientific publications, data presentation, best practices
Abstract
The presentation of data in tables and figures is a hallmark of scientific publications. Tables and figures are most effective if they reflect two principles and a number of best practices. The first principle is to use tables and figures to highlight the main findings of a study. The second principle is to choose the appropriate format based on the type of data. Tables are most effective for presenting precise data and multiple outcomes. Figures are most effective for presenting trends over time or comparative values. When constructing a table, different populations are identified in columns and then compared according to variables that are identified in rows. This structure enables comparisons between the different study populations. When constructing figures, the independent variable (such as time) is on the horizontal or x-axis and the dependent or outcome variable is on the vertical or y-axis. Good titles for both tables and figures give a concise description of who, what, where, when and how many. Electronic readers can read tables if there are visible row and column lines and there is a single datum per cell; electronic readers can read figures if there is a link to an Excel spreadsheet with the data or if there is a short text description. With these principles and best practices, tables and figures will highlight the key findings of scientific studies in a way that is clear, accessible and memorable.
Introduction
A hallmark of a scientific study is the presentation of data; yet authors often do not consider how they are going to present their data before starting to prepare manuscripts for publication. Definitive textbooks on this topic are availableFootnote 1Footnote 2Footnote 3Footnote 4, as are articles in other disciplinesFootnote 5Footnote 6Footnote 7. However, these sources generally do not consider international guidelines on ensuring that online publications are accessible to those visually impairedFootnote 8. These guidelines have been adopted by scientific publishers worldwide, and knowing how to comply with them prevents the need for subsequent revision.
The objective of this article is to provide researchers with a concise overview of principles and best practices for creating accessible tables and graphs in health research. Information on other types of figures, such as photographs, diagrams and biomedical images, can be found elsewhereFootnote 1.
Appropriate use
Tables and figures are often essential in communicating health research. To present data effectively, you need to apply two key principles and certain best practices. The two key principles are to highlight the main findings and to choose the appropriate format based on the type of data. Best practices include conventions for creating titles; structuring tables and figures; and making abbreviations and footnotes accessible so they can be read by those who use electronic readers with text-to-speech technologyFootnote 9.
The question of how much data to include often arises when starting to prepare research findings for publication. The initial impulse may be to share all that has been gleaned. With the growing trend towards open science and open data, this is now in fact possible: whole datasets are being posted and made accessible onlineFootnote 10. In a scientific publication, however, a clear focus helps readers identify and retain the key findings of a study; too much data can be overwhelming. On the other hand, if readers are presented with too little data, they may get the impression that there is a lack of substance to support the scientific findings.
The best way to get the presentation of data in tables and figures just right is to use these to focus on the main findings, including both the results of the methodology (more on this below) and the main outcome measures of the study. Know that, as part of assessing whether a manuscript is appropriate for a journal, editors will assess if the information provided by the figures and tables is warranted based on the paper’s length and if the manuscript fits within the journal’s space limitsFootnote 11. As a general rule of thumb, medical journal articles typically include three to four tables and figures and often no more than five to seven.
Methodology
There are at least three instances when a table or figure showing pertinent information on the methodology is indicated: randomized clinical trials, systematic reviews and studies that involve two or more populations. For randomized clinical trials, the CONSORT statement has identified the need for a flow diagram to show how many people were invited to join the study, how many accepted and were randomized, how many were in each group, and how many dropped out or completed the studyFootnote 12.
In systematic reviews, the PRISMA statement has identified the need for a flow diagram to show the results of the literature search and the winnowing down of the studies based on inclusion and exclusion criteriaFootnote 13.
In epidemiologic studies involving two or more groups (such as a nested case–control study), the STROBE statement notes the need to describe the demographic, clinical and social characteristics of study participants, and information on exposures and potential confounders for cases and controlsFootnote 14; a table is the most efficient way to do this. A table also helps readers assess whether the groups were similar at the start of the study; randomization does not always result in equivalent groups. In both randomized controlled trials and case–control studies, if one group ends up with more co-morbidity, for example, this may bias the results and needs to be taken into account when interpreting the results.
Main outcomes
Key research findings include the main outcome measure and, often, a number of secondary measures that are all linked to the objective of the study. The objective can have several components. For example, if the objective of a study is to examine trends in new HIV cases over a certain period of time by age, sex, geographic location and risk group, each of these areas would be addressed in the results. One would anticipate data in each of these areas to be visually displayed.
Once you have identified what you want to highlight, the question is “is it best to present the data in a table or a figure?”. The answer depends on the type of data you have to present. A trend over time is best presented in a figure. If exact values are important, or there are many, these are best presented in a tableFootnote 1.
Figures
Figures can provide instant information that would otherwise take many sentences to explain. A graph or a histogram easily and memorably shows comparative data or identifies trends over time. For example, a graph is commonly used in surveillance summaries and outbreak reports to show disease incidence.
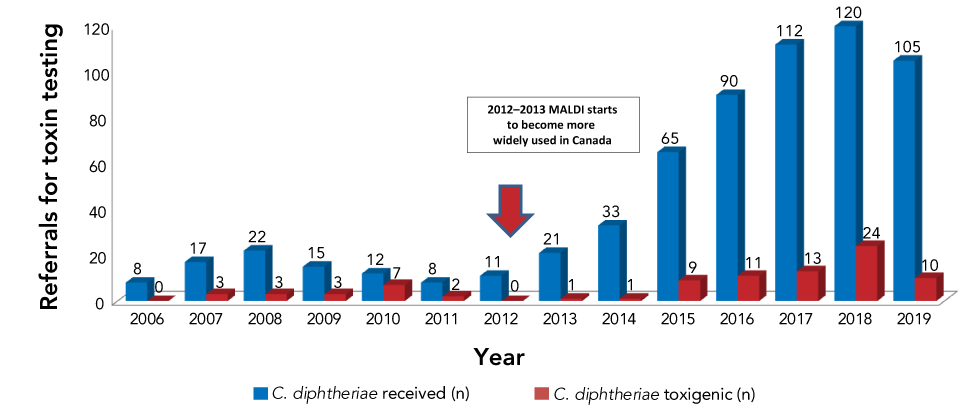
For graphs, the y-axis identifies the measures of interest (such as rates or the number of cases) and typically begins at zero. The x-axis represents the independent variable, for example, time (by days, months or years) (see Figure 1). Such a visual display makes it instantly obvious whether rates are increasing, decreasing or staying about the same. If you need to condense the height of the graph, the y-axis can be a logarithmic scale or you can use a pair of diagonal lines (-- // --) to show that the scale is not continuous.
Figure 1: Corynebacterium diphtheriae referrals for toxin testing by year and subset by number of toxigenic strains, 2006–2019Footnote 15
Text description: Figure 1
Figure 1: Corynebacterium diphtheriae referrals for toxin testing by year and subset by number of toxigenic strains, 2006–2019Footnote 15
| Species | Toxigenic strains/year | ||||||||||||||
|---|---|---|---|---|---|---|---|---|---|---|---|---|---|---|---|
| 2006 | 2007 | 2008 | 2009 | 2010 | 2011 | 2012 | 2013 | 2014 | 2015 | 2016 | 2017 | 2018 | 2019 | Total | |
| C. ulcerans received (n) | 0 | 3 | 1 | 0 | 0 | 0 | 0 | 4 | 5 | 1 | 0 | 1 | 2 | 5 | 22 |
| C. ulcerans toxigenic (n) | 0 | 1 | 1 | 0 | 0 | 0 | 0 | 1 | 4 | 0 | 0 | 0 | 1 | 2 | 10 |
Colour can be used to differentiate between different lines in graphs or bars in histograms, but to meet accessibility guidelines, the colours need to be sufficiently different to pass a colour blind test or have an additional design feature to distinguish them. Figures need a legend to identify each line or bar. In Figure 1, the legend identifies the data represented by the red bars and the blue bars; both of these colours passed colour blindness testing.
Tables
Precise outcomes and multiple types of data are best presented in tables. When constructing tables it is useful to consider both structure and the placement of content.
Structure
Authors often wonder what data to note in rows and what data to note in columns. A general principle is dependent or outcome variables are identified in rows and independent variables are identified in columnsFootnote 1. For example, if you are comparing the characteristics of two study populations, the study populations would be identified in columns and the different baseline characteristics or outcomes would be presented in rows. English and French is read horizontally and noting the characteristics in columns enables readers to more easily compare the two populations.
Each column needs a heading that describes what is in the column. Headings that span two or more columns are called spanner headings. For example, spanner headings might describe different populations (e.g. “Documented two-dose vaccination,” “Documented one-dose vaccination” and “No documentation or no history of vaccination”). Under each spanner heading are two column headings for “n” and “%” (Table 1).
| Column heading for stub and row headings | Spanner head | Spanner head | Total | ||||
|---|---|---|---|---|---|---|---|
| n | % | n | % | n | % | ||
| Stub heading | Row heading 1 | - | - | - | - | - | - |
| Row heading 2 | - | - | - | - | - | - | |
| Row heading (n) | - | - | - | - | - | - | |
| Stub heading | Row heading 1 | - | - | - | - | - | - |
| Row heading 2 | - | - | - | - | - | - | |
| Row heading (n) | - | - | - | - | - | - | |
| Total | - | - | - | - | - | - | 100 |
The far left column heading describes what is in the rows. In the far left of each row are row headings. Stub headings, which organize row headings into groups, can be included. Each row heading describes the data in the cells to the right. Consider the order of the row headings. This may be in chronologic order (e.g. “status on admission,” “status at discharge,” “status six months post-discharge”); in alphabetical order (such as the names of different countries if you are comparing their incidence of diseases) or geographically (e.g. disease incidence in Canada by province or territory from west to east). Ensure that each spanner, column, stub and row heading accurately describes what is presented in the cells it covers.
Write only one datum per cell and leave no cell empty. The convention used to be to write the “n” value followed by the percentage in brackets in a single cell. As seen in Table 1, these are now written in separate columns in order to be accurately interpreted by electronic readersFootnote 8Footnote 9. If the datum is zero, write zero. If there are no data, write “ND” (for “no data”) or “NA” (for “not applicable”) and explain the abbreviation below the table.
Content
Usually numeric results in tables are right justified and numbers are aligned on the decimal pointFootnote 1. If the total sample size is less than 100, use percentages as whole numbers (i.e. no decimal points) so you do not give the impression of greater precision than is meritedFootnote 3. Likewise, if the total sample size is less than 20, no percentages need be reportedFootnote 3. If the units vary in a column (for example, if you are reporting on different blood test results), the units need to be identified in the row headings and the data in each cell may be centred.
When indicated, add a column for a statistical measure of variation, such as standard deviation or standard error of the mean, and another column for the p valueFootnote 11.
In general, the entire study sample should be accounted forFootnote 3. If you are missing data for some elements (for example, if a survey participant did not respond to some questions), consider adding a “no response” category so readers can consider how this may affect the overall results. Related to this is that both the actual number (or “n”) and the percentage should be given and all the percentages should add up to 100%Footnote 3. To demonstrate this, there is often a total in the far right column and/or the bottom row.
Once the table is constructed there are a few finishing touches to consider, for example, how to minimize empty space. For text tables, use abbreviations and symbols to minimize column width, and then adjust column widths so the columns that contain the most information have the largest width. Finally, always double-check the numbers in the table with the original data and ensure any corrections are reflected in the text.
Best practices
There are a number of best practices that cover all the other information that may be associated with tables and figures. This summary is based on the definitive style manual for scientific publications, Scientific Style and FormatFootnote 1, the international Recommendations for the Conduct, Reporting, Editing and Publication of Scholarly Work in Medical JournalsFootnote 15 and the Web Content Accessibility GuidelinesFootnote 8.
Titles
The title of a table or figure should give enough information that it explains the data in the table without having to read the context in the article. Consider each table and figures as a “stand alone.” The title should be concise but complete, and include who and what, when and where and, when indicated, the total sample size. A set of tables or figures containing similar types of information calls for a parallel format for the titles. For example:
- Figure 1: New HIV cases in Canada, 2019, by geographic area (n= )
- Figure 2: New HIV cases in Canada, 2019, by age and sex (n= )
- Figure 3: New HIV cases in Canada, 2019, by risk factor (n= )
Abbreviations, footnotes and references
Abbreviations are generally identified in the line immediately under a table or figure and are listed in alphabetical order (e.g. AST, aspartate aminotransferase; DWI, driving while intoxicated, etc.). Even if abbreviations have been introduced in the text, they should be redefined under a table or figure so that these can be stand alone.
Footnotes are used when more explanation is needed. Footnotes are identified by placing a letter in superscript (beginning with “a” and proceeding in alphabetical order) immediately following the words or numbers that need additional explanation. Numbers are eschewed for footnotes as electronic readers may confuse them with either results or reference numbers. Footnotes are identified sequentially in the same order as one reads—from left to right in rows and from top to bottom. As shown in Table 1, the footnotes are placed sequentially, below the abbreviation line.
References are identified in tables to either show the source of a table or support an assertion in a footnote. References cited only in tables or figure legends should be numbered based on where the table or figure is first cited in the text. For example, Figure 1 above has a reference after the title that keeps the citations in numeric order.
Additional data
If you use data from other published or unpublished sources that are not in the public domain, you need to submit to your publisher written permission from the copyright holder to reproduce these dataFootnote 11. There is a trend now to move away from copyrighted articles to the public domain, such as with a Creative Commons licenceFootnote 16. In any case, it is important to identify the source and indicate if any changes were made to the original.
Occasionally, additional tables containing backup data may be appropriate in an appendix or a supplement or they are made available to readers directly by the authors upon request. This is something that is negotiated with the journal editor. When agreed to, a statement is added to the text to inform readers that this additional information is available and where it is located. Additional data are typically included with the manuscript upon submission so that the data are available as part of the peer review process.
Identification in text
Each table and figure in an article should be identified in the text. Tables and figures are numbered in order and the publishing convention is to place them at the end of the paragraph where they are first identified. However, for manuscript submission, most medical journals request that authors place the tables and figures at the end of the manuscriptFootnote 11. This allows editors and reviewers to focus on the text and the data presentation separately. Tables and figures are placed in the text during layout based on convention, but this may be altered slightly to maintain a pleasing layout to the article. It is useful to know this and avoid making statements like: “See Tables 1–4” as this means the text would normally be followed by four tables, which breaks up the flow of the text and creates formatting challenges on the printed page.
Accessibility
Electronic readers are able to read tables—as long as there is only one datum in each cell—but they are not able to read figures. To accommodate this, either include an Excel spreadsheet (for graphs, histograms and pie charts) or add a text description (for flow diagrams and illustrations). Table 2 shows an Excel-type table used to identify the data in Figure 1. In the HTLM version of the original publication, the table was hyperlinked to the word “Text Description” found below the figureFootnote 15.
| Species | Toxigenic strains/year | ||||||||||||||
|---|---|---|---|---|---|---|---|---|---|---|---|---|---|---|---|
| 2006 | 2007 | 2008 | 2009 | 2010 | 2011 | 2012 | 2013 | 2014 | 2015 | 2016 | 2017 | 2018 | 2019 | Total | |
| C. ulcerans received (n) | 0 | 3 | 1 | 0 | 0 | 0 | 0 | 4 | 5 | 1 | 0 | 1 | 2 | 5 | 22 |
| C. ulcerans toxigenic (n) | 0 | 1 | 1 | 0 | 0 | 0 | 0 | 1 | 4 | 0 | 0 | 0 | 1 | 2 | 10 |
Conclusion
Creating effective tables and figures is essential to successfully communicate scientific research. When developed to highlight the main findings of a study and constructed based on best practices, tables and figures help to make the results of a scientific study clear, accessible and memorable.
Author’s statement
PH conceived and wrote the article.
Competing interests
None.
