
Surveillance of viral gastroenteritis in Ontario, Canada, 2009–2014

 Download this article as a PDF
 Published by: The Public Health Agency of Canada
Issue: Volume 47 No. 10, October 2021: Influenza Vaccine
Date published: October 2021
ISSN: 1481-8531
Submit a manuscript
About CCDR
Browse
Volume 47 No. 10, October 2021: Influenza Vaccine
Surveillance
Epidemiology of norovirus and viral gastroenteritis in Ontario, Canada, 2009–2014
Stephanie L Hughes1 , Amy L Greer1, Alex J Elliot2, Scott A McEwen1, Ian Young3, Andrew Papadopoulos1
Affiliations
1 Department of Population Medicine, University of Guelph, Guelph, ON
2 Real-time Syndromic Surveillance Team, Field Service, National Infection Service, Public Health England, Birmingham, UK
3 School of Occupational and Public Health, Ryerson University, Toronto, ON
Correspondence
Suggested citation
Hughes SL, Greer AL, Elliot AJ, McEwen SA, Young I, Papadopoulos, A. Epidemiology of norovirus and viral gastroenteritis in Ontario, Canada, 2009–2014. Can Commun Dis Rep 2021;47(10):397–404. https://doi.org/10.14745/ccdr.v47i10a01
Keywords: norovirus, viral gastroenteritis, acute gastroenteritis, surveillance, Ontario, Canada
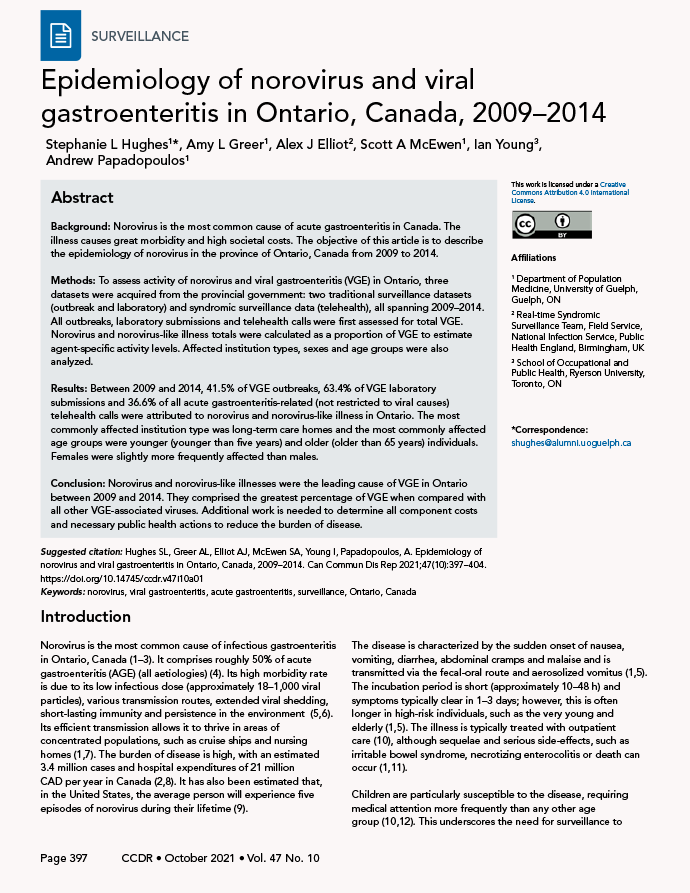
Abstract
Background: Norovirus is the most common cause of acute gastroenteritis in Canada. The illness causes great morbidity and high societal costs. The objective of this article is to describe the epidemiology of norovirus in the province of Ontario, Canada from 2009 to 2014.
Methods: To assess activity of norovirus and viral gastroenteritis (VGE) in Ontario, three datasets were acquired from the provincial government: two traditional surveillance datasets (outbreak and laboratory) and syndromic surveillance data (telehealth), all spanning 2009–2014. All outbreaks, laboratory submissions and telehealth calls were first assessed for total VGE. Norovirus and norovirus-like illness totals were calculated as a proportion of VGE to estimate agent-specific activity levels. Affected institution types, sexes and age groups were also analyzed.
Results: Between 2009 and 2014, 41.5% of VGE outbreaks, 63.4% of VGE laboratory submissions and 36.6% of all acute gastroenteritis-related (not restricted to viral causes) telehealth calls were attributed to norovirus and norovirus-like illness in Ontario. The most commonly affected institution type was long-term care homes and the most commonly affected age groups were younger (younger than five years) and older (older than 65 years) individuals. Females were slightly more frequently affected than males.
Conclusion: Norovirus and norovirus-like illnesses were the leading cause of VGE in Ontario between 2009 and 2014. They comprised the greatest percentage of VGE when compared with all other VGE-associated viruses. Additional work is needed to determine all component costs and necessary public health actions to reduce the burden of disease.
Introduction
Norovirus is the most common cause of infectious gastroenteritis in Ontario, CanadaFootnote 1Footnote 2Footnote 3. It comprises roughly 50% of acute gastroenteritis (AGE) (all aetiologies)Footnote 4. Its high morbidity rate is due to its low infectious dose (approximately 18–1,000 viral particles), various transmission routes, extended viral shedding, short-lasting immunity and persistence in the environmentFootnote 5Footnote 6. Its efficient transmission allows it to thrive in areas of concentrated populations, such as cruise ships and nursing homesFootnote 1Footnote 7. The burden of disease is high, with an estimated 3.4 million cases and hospital expenditures of 21 million CAD per year in CanadaFootnote 2Footnote 8. It has also been estimated that, in the United States, the average person will experience five episodes of norovirus during their lifetimeFootnote 9.
The disease is characterized by the sudden onset of nausea, vomiting, diarrhea, abdominal cramps and malaise and is transmitted via the fecal-oral route and aerosolized vomitusFootnote 1Footnote 5. The incubation period is short (approximately 10–48 h) and symptoms typically clear in 1–3 days; however, this is often longer in high-risk individuals, such as the very young and elderlyFootnote 1Footnote 5. The illness is typically treated with outpatient careFootnote 10, although sequelae and serious side-effects, such as irritable bowel syndrome, necrotizing enterocolitis or death can occurFootnote 1Footnote 11.
Children are particularly susceptible to the disease, requiring medical attention more frequently than any other age groupFootnote 10Footnote 12. This underscores the need for surveillance to inform public health, plan appropriate intervention measures and develop vaccinesFootnote 13. A lack of formal reporting mechanisms for norovirus (and AGE in general) leads to knowledge gaps. Approximately 15% of individuals suffering from AGE seek medical care and, of those, diagnostic samples are requested from only 13%Footnote 14.
In this study, we describe the epidemiology of norovirus in the province of Ontario, Canada using confirmed outbreak data, laboratory testing data, and telemedicine calls with vomiting calls as a proxy.
Methods
This study was conducted using data from the Canadian province of Ontario, which had a population of approximately 14.3 million residents at the time of this studyFootnote 15.
Datasets
All data acquired and used in this study were anonymized (no personal identifiers). For further information, see Appendix.
Outbreaks: The integrated Public Health Information System (iPHIS) dataset represents confirmed outbreaks of viral gastroenteritis (VGE) in institutions in Ontario reported to local public health units.
Laboratory reports: The Public Health Ontario Laboratories (PHOL) dataset represents all samples submitted to Public Health Ontario (PHO) with suspected VGE for confirmatory testing; more specifically, this dataset contains all samples sent to PHO with suspected norovirus or rotavirus infection.
Telehealth calls: The Telehealth Ontario (THO) dataset represents all calls made to the provincial telehealth service with gastrointestinal chief complaints. These gastrointestinal calls represent a collection of AGE symptoms, encompassing a broader scope than just VGE calls, captured by the nurses at THO. Callers may be ill with these gastrointestinal symptoms for a range of reasons including norovirus. Therefore, telehealth calls with the selected chief complaints "vomiting" and "vomiting with diarrhea" were selected as the "vomiting chief complaints" and used as a proxy for norovirus activity in this study. The vomiting chief complaint was chosen due to its compliance with the main presenting symptoms of norovirus illness and evidence from prior studies demonstrating its role as an indicator of the diseaseFootnote 1Footnote 5Footnote 16.
Data analyses
All three datasets in this study were analyzed for total VGE outbreaks and the proportion attributed to norovirus (or in the case of THO data, gastroenteritis illness due to the inability to confirm presence of norovirus). These percentages were used to assess norovirus activity levels in Ontario. Ontario census data, as well as the total number of institution type (child care centre, long-term care home, retirement home, correctional facility) were used as denominator data to standardize select analysesFootnote 17Footnote 18Footnote 19Footnote 20.
Descriptive analyses were performed on using SAS v.9.4 (Cary, North Carolina, United States) and Microsoft Office (Excel) 2010 (Redmond, Washington, United States).
Results
Outbreaks: There were 3,100 VGE outbreaks in Ontario during the years 2009–2014; 41.6% were caused by norovirus, either by case definition and/or laboratory confirmation. The remaining 58.4% were attributed to adenoviruses, astroviruses, enteroviruses/echoviruses, rotavirus, other caliciviruses and gastroenteritis unspecified/other.
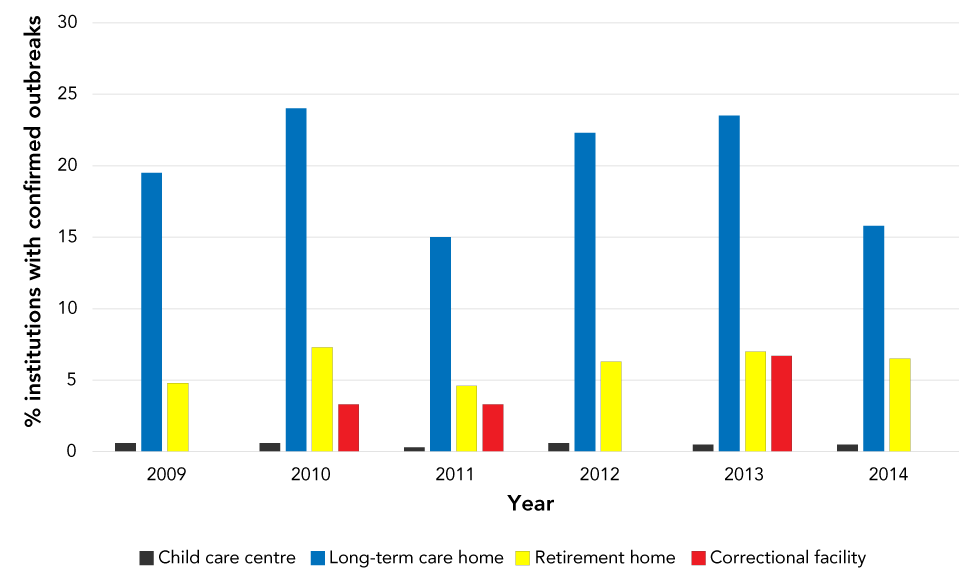
During 2009–2014, 45.1% of VGE outbreaks were in long-term care homes, 30.9% in child care facilities, 22.6% in retirement homes, 0.3% in correctional facilities and 1.2% in other settings. This distribution remained relatively consistent when the analysis was restricted to norovirus outbreaks, in which case retirement homes replaced child care facilities as the second most frequently affected institution type. Of those VGE outbreaks in long-term care homes, more than half (57.2%) were attributed to norovirus. An institutional breakdown for norovirus outbreaks is shown in Figure 1.
Figure 1: Percent of institutions affected by norovirus outbreaks in Ontario, 2009–2014
Text description: Figure 1
| Year | Child care centre | Long-term care home | Retirement home | Correctional facility |
|---|---|---|---|---|
| 2009 | 0.6 | 19.5 | 4.8 | 0 |
| 2010 | 0.6 | 24 | 7.3 | 3.3 |
| 2011 | 0.3 | 15 | 4.6 | 3.3 |
| 2012 | 0.6 | 22.3 | 6.3 | 0 |
| 2013 | 0.5 | 23.5 | 7 | 6.7 |
| 2014 | 0.5 | 15.8 | 6.5 | 0 |
The number of norovirus outbreaks per year was relatively stable across the six years; 211 in 2009, 265 in 2010, 178 in 2011, 247 in 2012, 215 in 2013 and 175 in 2014. This is comparable to the stability of VGE outbreaks across the same period.
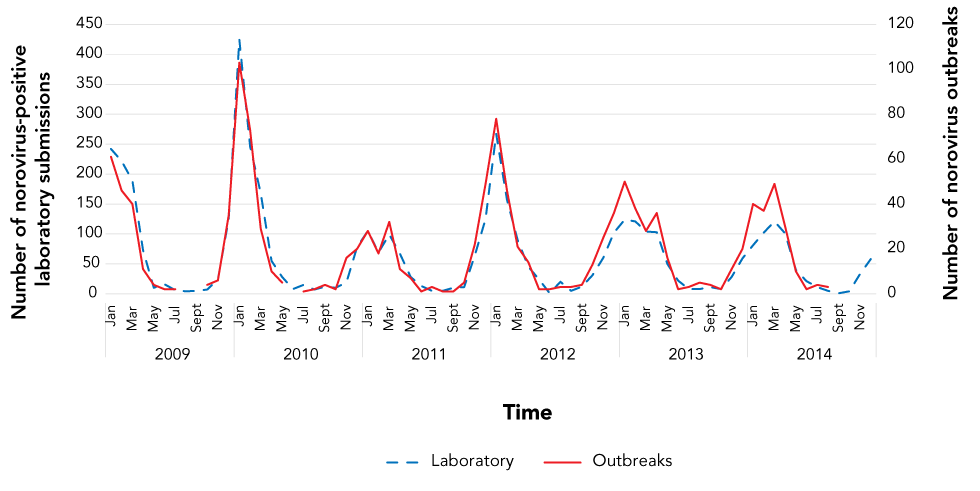
The seasonal distribution of norovirus outbreaks by month and year is shown in Figure 2. The average duration of VGE outbreaks was 12.6 days (range 1–78 days), and for norovirus outbreaks was 14.1 days (range 1–52 days).
Figure 2: Seasonality of norovirus laboratory submissionsFigure 2 Footnote a and outbreaksFigure 2 Footnote b in Ontario by month and year, 2009–2014
Text description: Figure 2
| Year | Month | Laboratory | Outbreaks |
|---|---|---|---|
| 2009 | Jan | 242 | 61 |
| Feb | 222 | 46 | |
| Mar | 189 | 40 | |
| Apr | 73 | 11 | |
| May | 10 | 4 | |
| Jun | 16 | 2 | |
| Jul | 6 | 2 | |
| Aug | 4 | 0 | |
| Sept | 5 | 0 | |
| Oct | 7 | 4 | |
| Nov | 24 | 6 | |
| Dec | 125 | 35 | |
| 2010 | Jan | 425 | 103 |
| Feb | 246 | 73 | |
| Mar | 168 | 29 | |
| Apr | 55 | 10 | |
| May | 28 | 5 | |
| Jun | 8 | 0 | |
| Jul | 15 | 1 | |
| Aug | 7 | 2 | |
| Sept | 12 | 4 | |
| Oct | 10 | 2 | |
| Nov | 19 | 16 | |
| Dec | 78 | 20 | |
| 2011 | Jan | 105 | 28 |
| Feb | 69 | 18 | |
| Mar | 99 | 32 | |
| Apr | 67 | 11 | |
| May | 28 | 7 | |
| Jun | 13 | 1 | |
| Jul | 5 | 3 | |
| Aug | 5 | 1 | |
| Sept | 10 | 1 | |
| Oct | 11 | 5 | |
| Nov | 64 | 22 | |
| Dec | 125 | 49 | |
| 2012 | Jan | 267 | 78 |
| Feb | 157 | 46 | |
| Mar | 90 | 21 | |
| Apr | 45 | 14 | |
| May | 24 | 2 | |
| Jun | 1 | 2 | |
| Jul | 20 | 3 | |
| Aug | 5 | 3 | |
| Sept | 12 | 4 | |
| Oct | 31 | 13 | |
| Nov | 60 | 25 | |
| Dec | 102 | 36 | |
| 2013 | Jan | 124 | 50 |
| Feb | 121 | 38 | |
| Mar | 104 | 28 | |
| Apr | 103 | 36 | |
| May | 50 | 16 | |
| Jun | 22 | 2 | |
| Jul | 8 | 3 | |
| Aug | 8 | 5 | |
| Sept | 11 | 4 | |
| Oct | 8 | 2 | |
| Nov | 28 | 11 | |
| Dec | 59 | 20 | |
| 2014 | Jan | 81 | 40 |
| Feb | 102 | 37 | |
| Mar | 121 | 49 | |
| Apr | 101 | 30 | |
| May | 40 | 10 | |
| Jun | 21 | 2 | |
| Jul | 11 | 4 | |
| Aug | 5 | 3 | |
| Sept | 1 | 0 | |
| Oct | 4 | 0 | |
| Nov | 33 | 0 | |
| Dec | 58 | 0 |
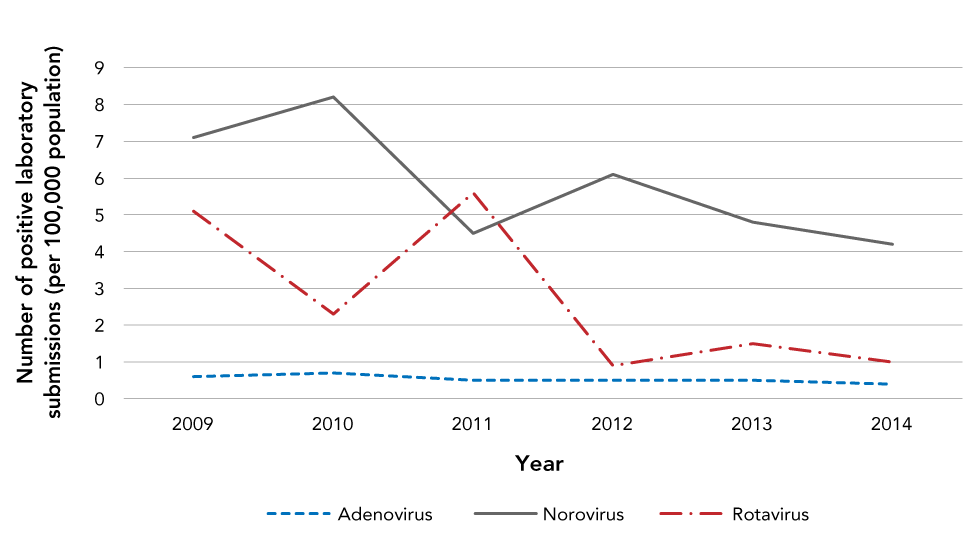
Laboratory reports: There were 29,459 submitted samples for rotavirus and norovirus-like VGE to PHO between 2009 and 2014, inclusive. The majority (n=22,147; 75.2%) were negative. Among positive samples (n=7,312), 63.4% were attributed to norovirus, with the remaining 36.6% composed of various other VGE aetiologies including adenovirus (16.5%), astrovirus (1.1%), other caliciviruses (0.3%), picornaviruses (0.3%), rotavirus (81.0%) and/or sapovirus (0.5%) (Figure 3).
Figure 3: Number of positive specimens submitted to Public Health Ontario Laboratories by virus type and year, 2009–2014 (per 100,000 population)Figure 3 Footnote a
Text description: Figure 3
| Year | Adenovirus | Norovirus | Rotavirus |
|---|---|---|---|
| 2009 | 0.6 | 7.1 | 5.1 |
| 2010 | 0.7 | 8.2 | 2.3 |
| 2011 | 0.5 | 4.5 | 5.6 |
| 2012 | 0.5 | 6.1 | 0.9 |
| 2013 | 0.5 | 4.8 | 1.5 |
| 2014 | 0.4 | 4.2 | 1 |
Female patients (40.0%) accounted for more positive VGE submissions (n=7,312) than males (32.4%); however, a large percentage of samples had incomplete sex information (27.6%). When restricting this analysis to norovirus-positive samples (n=4,633), this pattern was repeated.
The 65+ years age group had the highest number of VGE-positive submissions, followed by the 0–4 years age group; 93.5% and 15.3% of these VGE-positive submissions were positive for norovirus, respectively (Figure 4). Of all VGE positive submissions, 19% had missing age information.
Figure 4: Viral gastroenteritis activity attributed to norovirus by age group 2019–2014Figure 4 Footnote a
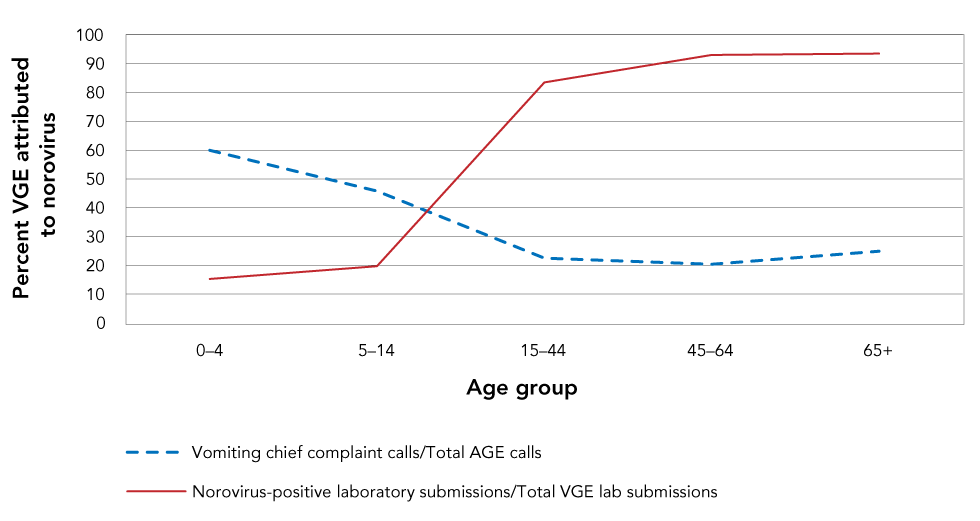
Text description: Figure 4
| Age group | Percent vomiting chief complaint calls | Percent norovirus-positive laboratory submissions |
|---|---|---|
| 0–4 | 60 | 15.3 |
| 5–14 | 45.8 | 19.7 |
| 15–44 | 22.5 | 83.5 |
| 45–64 | 20.4 | 93 |
| 65+ | 24.9 | 93.5 |
A total of 62.3% (n=4,559/7,312) of the VGE-positive samples were linked to outbreaks. Of the outbreak samples, long-term care homes were the most commonly affected location type, followed by hospitals, retirement homes, day cares and restaurants. The seasonality of norovirus-positive laboratory submissions broken down by month and year was closely associated with the seasonality of norovirus outbreaks (Figure 2).
Telehealth calls: A total of 320,834 telehealth calls was recorded for AGE illness in the period 2009–2014. Of these calls, 36.6% were due to vomiting as the chief complaint. The percentage of AGE calls attributed to the vomiting chief complaints fluctuated between 31% and 41% during 2009–2014 (Figure 5).
Figure 5: Percentage of acute gastroenteritis calls to Telehealth Ontario attributed to vomiting chief complaintsFigure 5 Footnote a by year, 2009–2014
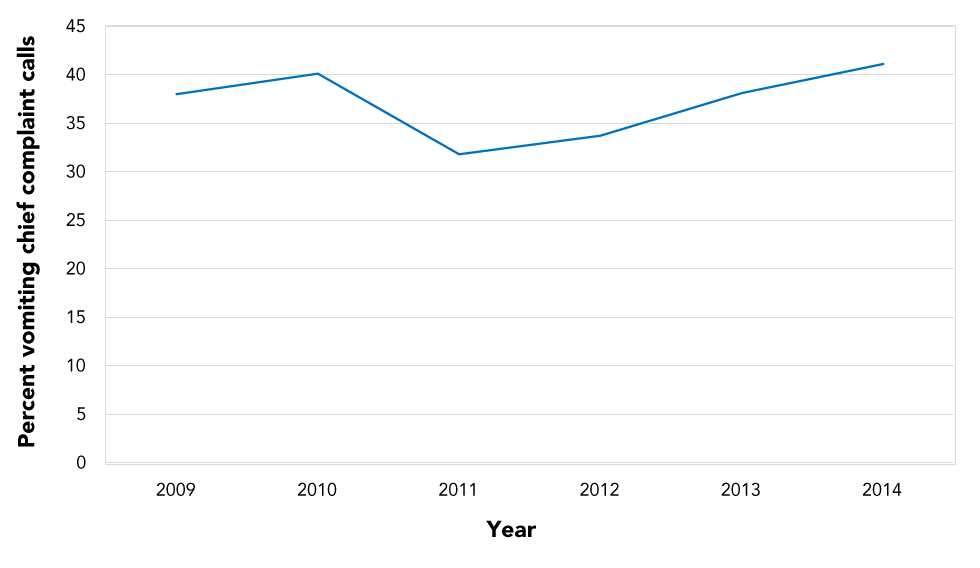
Text description: Figure 5
| Year | Percent vomiting chief complaint calls |
|---|---|
| 2009 | 38 |
| 2010 | 40.1 |
| 2011 | 31.8 |
| 2012 | 33.7 |
| 2013 | 38.1 |
| 2014 | 41.1 |
Telehealth calls were more frequently made by females (62.6% of AGE calls); with male calls comprising 35.9% and 1.5% from unknown/blank. When analyzing the vomiting chief complaints, this pattern was repeated.
The 15–44 age group comprised the highest number of AGE telehealth calls with 131,271 (40.9%) calls between 2009 and 2014. However, for vomiting chief complaint calls the highest call volumes (n=60,058 calls) were recorded for the 0–4 years age group. The 65+ years group consistently had the lowest number of calls. The youngest age groups (0–4, 5–14 years) displayed higher percentages of AGE calls attributed to the vomiting chief complaints in comparison to the older age groups (15–44, 45–64, 65+ years) (Figure 4). Less than 1% of AGE and vomiting chief complaint calls had missing age information.
Discussion
Norovirus was the most common cause of VGE cases and outbreaks in Ontario during the years 2009–2014. This work confirms previous research that has identified norovirus as the most common cause of VGE and intestinal infections in the communityFootnote 1Footnote 14Footnote 21Footnote 22. The outbreak dataset showed that norovirus comprised 41.6% of all VGE outbreaks during the study period, the laboratory dataset showed that norovirus comprised 63.4% of all VGE submissions, and the telehealth dataset showed 36.6% of all AGE calls had vomiting as the chief complaint.
The 2009–2014 outbreak data demonstrated that long-term care homes were the most commonly implicated institution type for both VGE and norovirus (Figure 1). This was not unexpected due to the higher incidence of VGE in older adults; the virus disproportionately causes more severe illness in vulnerable populations, such the elderly, young children and those with compromised immune systemsFootnote 1. The number of VGE outbreaks per year in child care facilities decreased after 2011 (Figure 1). This finding is likely due to the introduction of the Rotarix® vaccine administered at the ages of two and four months in the Ontario childhood vaccination schedule in August 2011; this primarily impacted outbreaks occurring in child care centresFootnote 23. Rotavirus is a common illness of children younger than five years of age, its primary symptom being diarrhea. Therefore, the presence of rotavirus infection in these data likely impacts the number of VGE outbreaks in young age groups. Other studies, both in Ontario and in countries worldwide, have also reported using surveillance to identify decreases in in rotavirus activity following the introduction of the vaccineFootnote 23Footnote 24Footnote 25.
Both the outbreak and laboratory data illustrated a rise in norovirus activity above normal seasonal activity during the winter of 2009/2010 (Figure 2). A rise above normal seasonal levels of norovirus activity typically occurs with the introduction of a new strain, mostly due to the quick mutation rate of the virus and lack of herd immunity in the populationFootnote 22Footnote 26. The introduction of new strains can cause shifts in seasonality and/or increases in the number of outbreaksFootnote 27. This is likely a result of the emergence of two novel strains: the GII.4 New Orleans strain which affected countries globally; and a GII.12 strainFootnote 28Footnote 29. The GII.4 New Orleans strain caused many outbreaks and was so widespread that it was still detected in high numbers up until 2013; this may also explain the higher peak seen in Figure 2 for the 2011/2012 seasonFootnote 30.
The two most commonly reported pathogens were norovirus and rotavirus. Norovirus tends to disproportionately affect very young (younger than five years) and older (65+ years) individuals when compared with middle-aged healthy people. Outbreaks are very common in high-density areas, such as daycares, retirement homes and long-term care homesFootnote 4Footnote 31. Rotavirus has a similar outcome in that it disproportionately affects young children (younger than five years), also resulting in outbreaks in daycares, preschools, etc.Footnote 1Footnote 23. Older individuals (65+ years) and those living in long-term care homes may be privy to more acute medical care and a higher likelihood of samples being collected and submitted to public health authorities, which might explain these findings. It should be noted that the difference in norovirus and rotavirus-positive samples was present even before the introduction of Rotarix into the Ontario childhood vaccination schedule. Further, our analyses clearly demonstrated the acute decrease in rotavirus cases following the introduction of Rotarix in 2011. From 2012 onwards, the laboratory-positive specimens were almost entirely norovirus.
The difference in telehealth call volumes for AGE and vomiting chief complaints for the 15–44 and 0–4-years age groups, respectively, is likely influenced by rotavirus. Because the illness disproportionately affects young populations, it would lead to a higher call volume for the 0–4 age group. It is likely that many callers phoning telehealth are parents concerned about their children. The 15–44 age group likely had the highest number of callers for AGE because of the various of illnesses affecting this population and their preference for virtual care.
While the datasets provided insight into activity of VGE and norovirus in Ontario, there was one clear disadvantage: a lack of community data (i.e. data from people suffering from illness at-home). Both the laboratory and outbreak datasets are biased towards institutional settings primarily because, outside of institutional settings, it is not mandatory for norovirus and other VGE to be reported to Ontario public health authorities. In addition, many VGE cases (norovirus specifically) suffer from underreportingFootnote 32. The inclusion of telehealth data in this study helps to bridge this gap in that it primarily collects community-based data that is not well-represented by the outbreak or laboratory data. Syndromic data are known for their ability to reduce underreporting and represent a higher percentage of the populationFootnote 33. Therefore, including telehealth data provides a greater understanding of VGE activity in Ontario and reduces bias.
Syndromic data are becoming increasingly more common and frequently utilized in public health practice due to their array of advantages. They are timely, can detect new/emerging threats, supplement data from traditional surveillance systems and are non-specificFootnote 34. Telehealth data are particularly beneficial as they represent one of the timeliest syndromic data options available; telemedicine helplines are one of the first points of medical care for symptomatic patientsFootnote 34. These data are also known for their availability in real-time and ease of access. However, telehealth data are not as specific as other sources and cannot necessarily be used to detect specific or severe outbreaksFootnote 34. In this study, telehealth data do not need to be specific because non-specific gastrointestinal calls provide the early warning of illness required for the system designed, and will be the most effective at observing norovirus and gastrointestinal illness in Ontario when combined with laboratory and outbreak data.
Limitations
There are a few notable limitations to this study. In the outbreak dataset, there was no age-related data. Rather, the institution type was used as an age proxy. In addition, there were many "gastroenteritis unspecified" and "gastroenteritis other" entries in the dataset, which likely contained additional norovirus cases, but were unusable. Furthermore, there was a lack of standardized reporting for norovirus and VGE in Ontario. Only institutional cases of norovirus are required to be reported to Ontario public health authorities (which also suffers from underreporting and time lags). As a result, analyses of norovirus and VGE activity are challenging due to the data gaps, as well as biases in age group reporting across the province. It is also important to note there is likely overrepresentation in the laboratory dataset. This dataset includes both outbreak samples as well as sporadic; when an outbreak occurs, one or more samples may be submitted. This study is, therefore, unable to describe specifically the burden of sporadic norovirus in Ontario, and there is likely a heavier focus on outbreak-related data. Finally, the telehealth calls may have included non-viral causes and may have contained some duplicate callers; however, it was not possible to stratify this in the dataset. As well, it was assumed vomiting was the main symptom of norovirus for telehealth analyses, which likely excluded additional norovirus-related calls from our results. Each dataset had limitations in terms of representative population; however, when combined, an overall summary of norovirus epidemiology in Ontario during the period 2009–2014 was generated.
Conclusion
This study describes the epidemiology of VGE and, specifically, norovirus in the province of Ontario, Canada between 2009 and 2014.Our study demonstrates that norovirus is a highly prevalent illness and the most dominant cause of VGE in the province. Our findings are in line with those of similar international studies, demonstrating norovirus as the leading cause of VGEFootnote 1Footnote 2Footnote 3. While a vaccine has been introduced in Ontario and countries worldwide to mitigate rotavirus infection, there is no vaccine for norovirus. Introducing preventative interventions, such as a vaccine, is ideal; however, other public health actions, such as novel surveillance techniques, are also necessary to inform public health interventions A combination of traditional and novel surveillance techniques will best capture data representative of Ontarians and reduce bias in surveillance. Additional techniques to help estimate norovirus disease burden knowledge gaps, such as sporadic norovirus, should be consideredFootnote 35.
Authors' statement
SLH — Conceptualized, obtained datasets, methodology, analyzed and interpreted data, drafted and revised the manuscript
AP — Participated in study designed, methodology, revision
All authors contributed to methodology and manuscript revisions and read and approved the final draft of the manuscript.
The content and view expressed in this article are those of the authors and do not necessarily reflect those of the Government of Canada.
Competing interests
None.
Acknowledgements
We are grateful for the assistance provided by Public Health England throughout this study. In addition, many thanks are necessary to W Sears at the University of Guelph for his assistance with the analyses in this study.
Funding
This work was supported by the University of Guelph.
Appendix
integrated Public Health Information System
The integrated Public Health Information System (iPHIS) dataset contains information on confirmed outbreaks of viral gastroenteritis (VGE) in Ontario reported to public health between January 1, 2009 and December 13, 2014. It is mandated in Ontario that all Reportable Diseases (as of 2018, these are now called "Diseases of Public Health Significance") be submitted to the databaseFootnote 1Footnote 2. Local public health units are responsible for collecting case information on all reportable diseases and entering them into iPHIS, as part of provincial and federal surveillance.
All outbreaks in the dataset are institutional (i.e. occurred at long-term care homes, retirement homes, child care facilities, correctional facilities, etc.).Additional information found in iPHIS includes the method of exposure (if determined), aetiologic agent (if determined), public health unit, disease confirmed status, date the outbreak was declared by the medical officer of health, date the outbreak was declared over by the medical officer of health, the initial onset date (time of index case) and final onset date (time of last case). The onset dates (time of index case) were used for analyses were used for this study, and the range between the onset date (time of index case) and onset date (time of last case) was used to calculate average VGE and norovirus outbreak duration.
While iPHIS data are continuously updated, public health authorities are required to enter all outbreaks from the past year by each August; therefore, incurring time delays. It should be noted laboratory confirmation is not required for an outbreak to be entered into the dataset, and when laboratory confirmation is present not all cases associated with an outbreak are laboratory tested.
Public Health Ontario Laboratories
The Public Health Ontario Laboratories (PHOL) dataset represents all the samples submitted to Public Health Ontario (PHO) between January 1, 2009 and December 31, 2014 for testing in Ontario. The data represent samples which were submitted to PHO from patients ill with suspected norovirus and/or rotavirus (i.e. symptoms of vomiting and/or diarrhea). Samples are submitted by medical professionals in the form of stool samples and are either tested by polymerase chain reaction, electron microscopy or immunochromatographic test. The dataset provides age, gender and public health unit information, as well as the dates the samples were collected and subsequently entered into the dataset. For analyses, the sample collection dates were used (i.e. the results represent the date the samples were collected from the ill person by the healthcare practitioner for testing). It should be noted not all VGE test requisitions from institutions and physicians are tested by PHO in Ontario; samples may also be sent to other private labs in Ontario, or in duplicates to multiple labs. As a result, not all laboratory-confirmed samples of VGE from Ontario are captured in this dataset.
Telehealth Ontario
The Telehealth Ontario (THO) dataset represents all phone calls made by residents of Ontario between January 1, 2009 and December 31, 2014 with gastrointestinal symptoms as chief complaints. Telehealth Ontario is a 24-hour, 7-days-a-week, confidential telephone hotline service which has been in service since 2001 and is available to anyone (providing a health card number is optional). The service is operated by Sykes Assistance Services Corporation, who are contracted by the Ontario Ministry of Health and Long-Term Care. An individual may call the hotline for any reason, where a responding nurse provides basic medical advice and directs the caller to an appropriate next course of action (i.e. visit an emergency room immediately, see a family physician very soon or within the next day, or self-care). The hotline helps alleviate the pressure on emergency departments and doctor's offices, while simultaneously providing free medical advice to millions of Ontarians. The THO dataset provides information on the date and time of call, the caller's chief complaint (primary reason for calling), the nurse's suggested next steps, age, gender, and location (city) of call.
The calls made to THO are referred to as acute gastroenteritis (AGE) in this study rather than VGE as in the iPHIS and PHOL datasets due to the fact they are less specific and encompass all causes of AGE, not strictly viral aetiologies. In addition, the calls made to THO for norovirus-like illness has not been confirmed as norovirus. Therefore, the "vomiting chief complaints" are used as a proxy for norovirus and norovirus-like illness and the burden of AGE calls cannot be attributed strictly to norovirus, but rather norovirus and norovirus-like illness.
