
Influenza vanishing following COVID-19 measures, Hamilton, ON

 Download this article as a PDF
Published by: The Public Health Agency of Canada
Issue: Volume 47-4: COVID-19: A Year Later
Date published: April 2021
ISSN: 1481-8531
Submit a manuscript
About CCDR
Browse
Volume 47-4: COVID-19: A Year Later
Epidemiologic study
Rapid disappearance of influenza following the implementation of COVID-19 mitigation measures in Hamilton, Ontario
Kevin Zhang1, Avika Misra2, Patrick J Kim3, Seyed M Moghadas4, Joanne M Langley5, Marek Smieja3,6
Affiliations
1 Faculty of Medicine, University of Toronto, Toronto, ON
2 Faculty of Medicine, University of Ottawa, Ottawa, ON
3 Department of Medicine, McMaster University, Hamilton, ON
4 Agent-Based Modelling Laboratory, York University, Toronto, ON
5 Canadian Center for Vaccinology, Dalhousie University, IWK Health Centre and Nova Scotia Health Authority, Halifax, NS
6 St. Joseph's Healthcare Hamilton, Hamilton, ON
Correspondence
Suggested citation
Zhang K, Misra A, Kim PJ, Moghadas SM, Langley JM, Smieja M. Rapid disappearance of influenza following the implementation of COVID-19 mitigation measures in Hamilton, Ontario. Can Commun Dis Rep 2021;47(4):202–8. https://doi.org/10.14745/ccdr.v47i04a04
Keywords: COVID-19, influenza, testing, public health interventions, Canada
Abstract
Background: Public health measures, such as physical distancing and closure of schools and non-essential services, were rapidly implemented in Canada to interrupt the spread of the coronavirus disease 2019 (COVID-19). We sought to investigate the impact of mitigation measures during the spring wave of COVID-19 on the incidence of other laboratory-confirmed respiratory viruses in Hamilton, Ontario.
Methods: All nasopharyngeal swab specimens (n=57,503) submitted for routine respiratory virus testing at a regional laboratory serving all acute-care hospitals in Hamilton between January 2010 and June 2020 were reviewed. Testing for influenza A and B, respiratory syncytial virus, human metapneumovirus, parainfluenza I–III, adenovirus, and rhinovirus/enterovirus was done routinely using a laboratory-developed polymerase chain reaction multiplex respiratory viral panel. A Bayesian linear regression model was used to determine the trend of positivity rates of all influenza samples for the first 26 weeks of each year from 2010 to 2019. The mean positivity rate of Bayesian inference was compared with the weekly reported positivity rate of influenza samples in 2020.
Results: The positivity rate of influenza in 2020 diminished sharply following the population-wide implementation of COVID-19 interventions. Weeks 12–26 reported 0% positivity for influenza, with the exception of 0.1% reported in week 13.
Conclusion: Public health measures implemented during the COVID-19 pandemic were associated with a reduced incidence of other respiratory viruses and should be considered to mitigate severe seasonal influenza and other respiratory virus pandemics.
Introduction
The coronavirus disease 2019 (COVID-19) has led to devastating global morbidity and mortalityFootnote 1. Restrictive public health measures have helped to mitigate COVID-19 transmission Footnote 2Footnote 3, but have led to widespread disruptions to the economyFootnote 4Footnote 5, tradeFootnote 6, and educationFootnote 7. Following the declaration of COVID-19 as a pandemic on March 11, 2020 by the World Health OrganizationFootnote 8, the province of Ontario, Canada announced the closure of all schools and non-essential workplacesFootnote 9Footnote 10. Months later, public health measures, such as physical distancing and mask-wearing, continue to be in place to reduce the toll associated with the COVID-19 pandemicFootnote 11.
Public health measures have reduced the transmission of severe acute respiratory syndrome coronavirus 2 (SARS-CoV-2) in OntarioFootnote 3. In some jurisdictions, these measures have also been associated with a lower incidence of other respiratory virus infectionsFootnote 12Footnote 13. We performed a time-series analysis, using a hierarchical regression model, to determine the timelines and positivity rates of influenza A and B viruses from 2010 to 2019 in an urban center in Ontario, and compare them to those of 2020 prior to and following the implementation of COVID-19 interventions in response to initial outbreaks.
Methods
Sampling and testing
We reviewed all nasopharyngeal swab specimens (n=57,503) submitted for routine respiratory virus testing at a regional laboratory serving all acute-care hospitals in Hamilton, Ontario between January 2010 and June 2020.
Testing was done using a TaqMan real-time reverse transcription polymerase chain reaction multiplex respiratory viral panel, developed by the Hamilton Regional Laboratory Medicine Program, for influenza A and B, respiratory syncytial virus, human metapneumovirus, parainfluenza I–III, adenovirus, and rhinovirus/enterovirus. On March 16, 2020, parainfluenza II was replaced by the SARS-CoV-2 virus. Sample ribonucleic acid (RNA) extraction and amplification were primarily performed on the bioMérieux NucliSENS easyMag and QIAGEN Rotor-Gene Q, respectively, from 2010–2019 and primarily performed on the BD MAX System from July 2019–2020. Clinical results were validated by experienced staff and recorded in a laboratory information system, following standard operating procedures.
Data
A respiratory virus database with all test results and demographic information is updated weekly and has been in place since 2010. A 10-year datacut with basic demographic information (age, sex, postal code, date, facility, accession number) and test results was exported from the laboratory database on June 29, 2020. The database included only samples sent for multiplex testing. Laboratory test results were filtered by postal code to exclude samples from persons living outside of Hamilton.
Ethics approval
The study was approved by the Hamilton Integrated Research Ethics Board (Project: 07-2923). The study was categorized as minimal risk, defined as no potential for negative impact on the health and safety of the participant, and waiver of individual consent for participation was obtained.
Statistical analysis
We used a Bayesian linear regression model with uninformative prior distributions to determine the trend of positivity rates of all influenza A and B samples for the first 26 weeks of each year from 2010–2019 (Appendix: Table A1). We then compared the mean positivity rate of Bayesian inference with the weekly reported positivity rate of influenza samples in 2020 (Appendix: Table A2).
The hierarchical regression model has the form
y ~ Normal(μ,σ)
μ=βTx
β=Normal(0, 100)
σ2=InverseGamma(2.5, 25)
where y represents the positivity rate over the first 26 weeks (variable x) of each year from 2010–2019. All parameters were sampled using Markov Chain Monte Carlo (MCMC) simulations in three independent chains. Each chain consisted of 10,000 iterations, with a burn-in period of 1,000 iterations and a thinning factor of five. To assess convergence, we inspected the trace plots and applied the Gelman-Rubin convergence test by computing the potential scale reduction factors (PSRF). All PSRF values were computed to be less than 1.1 (and remained close to 1), indicating the convergence of the model parameters to their posterior distributions. We used the posterior distributions of the parameters (β1, β2, σ) from our Bayesian analysis to derive mean estimates and credible intervals (Appendix: Table A3) by employing the method of Highest Posterior DensityFootnote 14.
Results
A description of individuals included in our study is provided in Table 1. A total of 48,459 patients were tested for respiratory viruses in Hamilton, Ontario in 2010–2019, of which 49.3% (n=23,898) were male and 30.6% (n=14,818) were children under 18 years. The bimodal age distribution had a median age of adults of 72.4 years (IQR: 59.4–83.5) and 1.5 years among children (IQR: 0.4–4.4). A median of 4,626 (IQR: 3,376–5,936) samples were tested each year, with a mean influenza positivity rate of 9.6% (SD: 2.9%). Mean percent positivity was also calculated for respiratory syncytial virus (6.9%, SD: 1.5%), metapneumovirus (2.8%, SD: 0.4%), parainfluenza (3.2%, SD: 0.6%), adenovirus (1.0%, SD: 0.6%), and rhinovirus/enterovirus (8.0%, SD: 5.5%). A total of 9,044 patients were tested for respiratory viruses in 2020, of which 2.5% were positive for influenza. The percent positivity of other respiratory viruses ranged from 0.1% (parainfluenza) to 0.9% (respiratory syncytial virus and rhinovirus/enterovirus).
| Description | 2010–2019 | 2020 | ||
|---|---|---|---|---|
| Age in years | Median | IQR | Median | IQR |
| Adults | 72.4 | 59.4–83.5 | 63.0 | 46.1–77.2 |
| Children | 1.5 | 0.4–4.4 | 1.9 | 0.5–6.0 |
| Demographics | Number | % | Number | % |
| Male | 23,898 | 49.3% | 4,073 | 45.0% |
| Adults | 33,641 | 69.4% | 7,983 | 88.3% |
| Children | 14,818 | 30.6% | 1,061 | 11.7% |
| Respiratory virus samples | Median | IQR | Number | |
| Samples per year | 4,626 | 3,376–5,936 | 9,044 | |
| Positivity rate | Mean | SD | Mean | |
| Influenza | 9.6% | 2.9% | 2.5% | |
| Respiratory syncytial virus | 6.9% | 1.5% | 0.9% | |
| Metapneumovirus | 2.8% | 0.4% | 0.4% | |
| Parainfluenza | 3.2% | 0.6% | 0.1% | |
| Adenovirus | 1.0% | 0.6% | 0.2% | |
| Rhinovirus/enterovirus | 8.0% | 5.5% | 0.9% | |
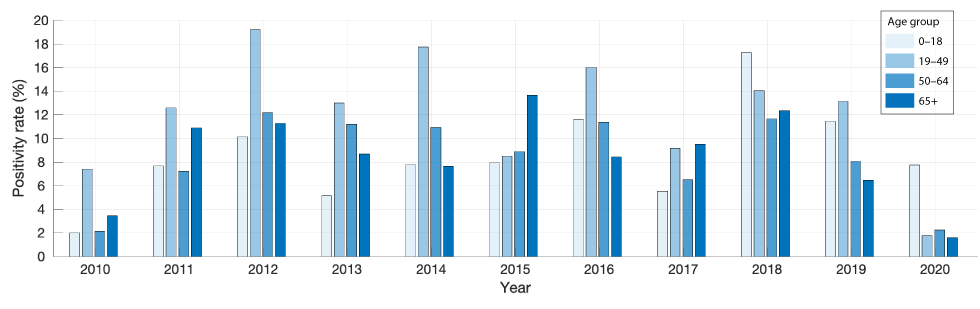
Figure 1 shows the positivity rates of influenza A and B in the database for the different age groups.
Figure 1: Positivity rates of influenza A and B in 2010–2020 for different age groups in Hamilton, Ontario
Text description: Figure 1
The graph shows the positivity rates of influenza A and B for different age groups in Hamilton, Ontario from 2010 to 2020.
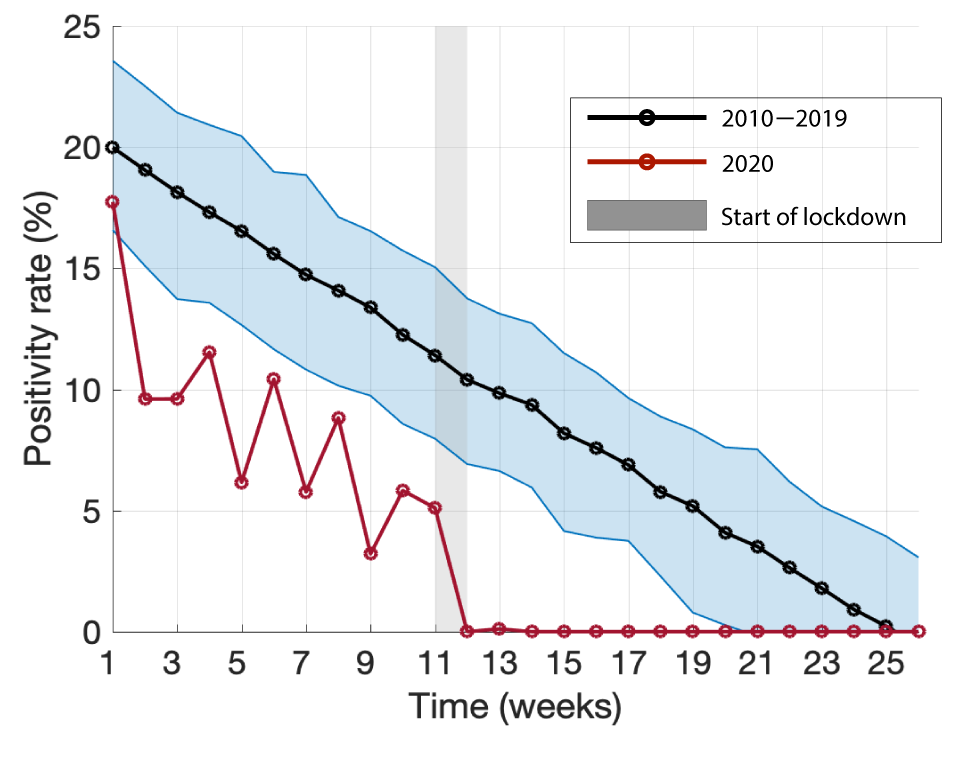
Figure 2 illustrates the mean positivity rate derived from posterior distributions of parameters in the Bayesian linear regression model using positivity rates reported for 2010–2019 (black curve). The positivity rate of influenza in 2020 (red curve) was highest at 17.7% in week 1, and dropped below the 95% credible interval for the preceding 10 years after the first week, with an ensuing declining trend (Figure 2; Appendix: Table A2). Following the implementation of COVID-19 interventions during week 12 (from March 12, 2020; grey bar in Figure 2), the positivity rate of influenza diminished sharply and remained at 0% for weeks 12–26, with the exception of 0.1% reported in week 13.
Figure 2: Bayesian inference for the mean positivity rate and its 95% credible interval of influenza A and B for the first 26 weeks in 2010–2019
Text description: Figure 2
The graph shows the mean positivity rate derived from posterior distributions of parameters in the Bayesian linear regression model using positivity rates reported for 2010–2019 (black curve). The positivity rate of influenza in 2020 is shown by the red curve.
Discussion
Public health measures have been used to interrupt the spread of influenza during pandemics, with variable levels of success. For example, school closures and physical distancing during the 2009 H1N1 pandemic in Mexico resulted in a 27%–29% reduction in influenza transmission during the spring waveFootnote 15. During the 1957–1958 influenza pandemic, school closures contributed to reducing the attack rate by over 90%Footnote 16. Similarly, following the implementation of COVID-19 mitigation measures, the influenza positivity rate was suppressed in the United States (US)Footnote 12Footnote 13. Our results suggest that COVID-19 public health measures may have contributed to a substantial disruption of the spread of influenza in Hamilton.
The 2020 influenza season was observed to be relatively mild in Hamilton, as compared with previous seasons (Appendix: Table A1, A2). However, the lower positivity rate observed in our analysis (Figure 2), may be attributed to several factors including voluntary precautions taken by individuals as a result of initial news reporting of the spread of COVID-19 in China and internationally, normal seasonal variation, or changes in sampling behaviour and diagnostic testing. For the 2010–2019 winter influenza season, the median influenza positivity rate reached 0% by week 23. In 2020, however, after the implementation of COVID-19 mitigation measures, percent positivity for influenza dropped precipitously—to 0% in week 12. The US Centers for Disease Control and Prevention reported similar findings through their weekly influenza surveillance system, in which the percent positivity for influenza decreased from 7.5% in week 12 to 1.0% in week 14. This abrupt change, without another explanation, suggests that COVID-19 mitigation measures may have reduced the spread of laboratory-confirmed influenza in the USFootnote 12Footnote 13. Moreover, the positivity rates for respiratory syncytial virus, metapneumovirus, parainfluenza, adenovirus, and rhinovirus/enterovirus were reported to be 0% by week 14 of 2020 (Appendix: Table A2), suggesting that public health measures could have also suppressed the transmission of other respiratory viruses.
Understanding the effect of COVID-19 interventions on other communicable diseases requires further study. A number of explicators may be considered to describe the rapid interruption in transmission chains of influenza compared with COVID-19 due to the pressure exerted by public health measures. First, there is relatively strong cross-immunity for influenza virus strains during seasonal epidemics, in addition to population immunity conferred by vaccinationFootnote 17Footnote 18. In contrast, the population was naive to SARS-CoV-2, and still remains largely susceptible in the absence of vaccination. Furthermore, there are major differences in the epidemiological characteristics between influenza and COVID-19 that influence the outcomes of interventionsFootnote 19. For example, the transmissibility of influenza has been estimated to be in the range 1.2–1.8Footnote 20, which is lower than the initial estimates of greater than two for COVID-19 in most settingsFootnote 21Footnote 22. The average incubation period of 5.2 days for COVID-19Footnote 21 is significantly longer than the same period for influenza A, which is estimated to be 1.4 daysFootnote 23. Moreover, the pre-symptomatic period is longer and more infectious in COVID-19 than in influenzaFootnote 24Footnote 25. Future studies will need to account for these factors when evaluating the effect of interventions against emerging infectious diseases.
The findings of our study should be interpreted in the context of study limitations. First, respiratory samples were not collected systematically, but rather they were obtained as part of routine clinical care. As such, the samples may not fully represent the prevalence of respiratory viruses in the region. It is also possible that clinicians may not have strictly followed hospital infection control policy and failed to sample patients who otherwise would have been eligible. Furthermore, sampling behaviour may have changed during the early stage of COVID-19 spread in Canada. However, these factors are unlikely to change our conclusions due to the near-elimination of the absolute number of laboratory-confirmed respiratory virus cases, despite the large increase in testing which accompanied concern for COVID-19 in the community.
Conclusion
Our findings suggest that efforts to control the COVID-19 pandemic may have had additional benefits in suppressing the transmission of other respiratory viruses in Hamilton, Ontario. Mitigation strategies, such as physical distancing, mask-wearing, and school closures, could play an important role in combating future seasonal respiratory viruses and emerging infectious diseases with pandemic potential.
Authors' statement
KZ, AM, PJK, SMM, and MS contributed to the conception and design of the work
KZ, SMM, JML, and MS contributed to the acquisition of data, analysis, and interpretation of results
All authors drafted, read, and approved the final manuscript.
The content and view expressed in this article are those of the authors and do not necessarily reflect those of the Government of Canada.
Competing interests
Dr. J Langley reports that Dalhousie University has received payment for the conduct of vaccine studies from Sanofi, Glaxo-SmithKline, Merck, Janssen, VBI and Pfizer. Dr. Langley holds the Canadian Institutes of Health Research-GlaxoSmithKline Chair in Pediatric Vaccinology. No other competing interests were declared.
Funding
S Moghadas: CIHR (OV4 — 170643), COVID-19 Rapid Research; Natural Sciences and Engineering Research Council of Canada; and Canadian Foundation for Innovation.
References
- Footnote 1
-
Johns Hopkins University of Medicine. Coronavirus Resource Center. COVID-19 Dashboard by the Center for Systems Science and Engineering (CSSE) (accessed 2020-09-01). https://coronavirus.jhu.edu/map.html
- Footnote 2
-
Zhang K, Vilches TN, Tariq M, Galvani AP, Moghadas SM. The impact of mask-wearing and shelter-in-place on COVID-19 outbreaks in the United States. Int J Infect Dis 2020;101:334-41. https://doi.org/10.1016/j.ijid.2020.10.002
- Footnote 3
-
Public Health Ontario. COVID-19 Seroprevalence in Ontario: March 27, 2020 to June 30, 2020. PHO; 2020. https://www.publichealthontario.ca/-/media/documents/ncov/epi/2020/07/covid-19-epi-seroprevalence-in-ontario.pdf?la=en
- Footnote 4
-
Fernandes N. Economic Effects of Coronavirus Outbreak (COVID-19) on the World Economy. IESE Business School. 2020 March 22; Working Paper No. WP-1240-E. https://dx.doi.org/10.2139/ssrn.3557504
- Footnote 5
-
Jones L, Palumbo D, Brown D. Coronavirus: A visual guide to the economic impact. BBC News. 2020 Jun 30 (accessed 2020-08-17). https://www.bbc.com/news/business-51706225
- Footnote 6
-
World Trade Organization. COVID-19 and world trade. Geneva (Switzerland): WHO; 2020 (accessed 2020-08-17). https://www.wto.org/english/tratop_e/covid19_e/covid19_e.htm
- Footnote 7
-
Dorn E, Hancock B, Sarakatsannis J, Viruleg E. New evidence shows that the shutdowns caused by COVID-19 could exacerbate existing achievement gaps. McKinsey and Company; 2020 June 1 (accessed 2020-08-17). https://www.mckinsey.com/industries/public-and-social-sector/our-insights/covid-19-and-student-learning-in-the-united-states-the-hurt-could-last-a-lifetime
- Footnote 8
-
World Health Organization. WHO Director-General's opening remarks at the media briefing on COVID-19 - 11 March 2020. Geneva (Switzerland): WHO; March 2020 (accessed 2020-08-17). https://www.who.int/dg/speeches/detail/who-director-general-s-opening-remarks-at-the-media-briefing-on-covid-19---11-march-2020
- Footnote 9
-
Rodrigues G. Ontario government declares state of emergency amid coronavirus pandemic. Global News. 2020 March 17 (accessed 2020-08-17). https://globalnews.ca/news/6688074/ontario-doug-ford-coronavirus-covid-19-march-17/
- Footnote 10
-
Vogel L. COVID-19: A timeline of Canada's first-wave response. CMAJ News. 2020 June 17 (accessed 2020-08-17). https://cmajnews.com/2020/06/12/coronavirus-1095847/
- Footnote 11
-
Government of Ontario. Reopening Ontario (accessed 2020-08-17). https://www.ontario.ca/page/reopening-ontario
- Footnote 12
-
Centers for Disease Control and Prevention. Influenza Positive Tests Reported to CDC by U.S. Clinical Laboratories, 2019-2020 Season. CDC; 2020 (accessed 2020-08-17). https://www.cdc.gov/flu/weekly/weeklyarchives2019-2020/data/whoAllregt_cl32.html
- Footnote 13
-
Blum K. Was Social Distancing a Help in Slowing the Flu Season? Infectious Disease Special Edition. April 3, 2020 (accessed 2020-08-17). https://www.idse.net/Covid-19/Article/04-20/Was-Social-Distancing-a-Help-in-Slowing-the-Flu-Season-/57839?ses=ogst
- Footnote 14
-
Chen MH, Shao QM. Monte Carlo Estimation of Bayesian Credible and HPD Intervals. J Comput Graph Stat 1999;8(1):69-92. http://www.tandfonline.com/doi/abs/10.1080/10618600.1999.10474802
- Footnote 15
-
Stephenson J. Social distancing helpful in Mexico during flu pandemic. JAMA 2011;305(24):2509. https://doi.org/10.1001/jama.2011.859
- Footnote 16
-
Glass RJ, Glass LM, Beyeler WE, Min HJ. Targeted social distancing design for pandemic influenza. Emerg Infect Dis 2006;12(11):1671-81. https://doi.org/10.3201/eid1211.060255
- Footnote 17
-
Valkenburg SA, Rutigliano JA, Ellebedy AH, Doherty PC, Thomas PG, Kedzierska K. Immunity to seasonal and pandemic influenza A viruses. Microb Infect. 2011;13(5):489-501. https://linkinghub.elsevier.com/retrieve/pii/S1286457911000372
- Footnote 18
-
Krammer F. The human antibody response to influenza A virus infection and vaccination. Nat Rev Immunol 2019;19(6):383-97. https://doi.org/10.1038/s41577-019-0143-6
- Footnote 19
-
Abdollahi E, Haworth-Brockman M, Keynan Y, Langley JM, Moghadas SM. Simulating the effect of school closure during COVID-19 outbreaks in Ontario, Canada. BMC Med 2020;18(1):230. https://doi.org/10.1186/s12916-020-01705-8
- Footnote 20
-
Biggerstaff M, Cauchemez S, Reed C, Gambhir M, Finelli L. Estimates of the reproduction number for seasonal, pandemic, and zoonotic influenza: a systematic review of the literature. BMC Infect Dis 2014;14:480. https://doi.org/10.1186/1471-2334-14-480
- Footnote 21
-
Li Q, Guan X, Wu P, Wang X, Zhou L, Tong Y, Ren R, Leung KS, Lau EH, Wong JY, Xing X, Xiang N, Wu Y, Li C, Chen Q, Li D, Liu T, Zhao J, Liu M, Tu W, Chen C, Jin L, Yang R, Wang Q, Zhou S, Wang R, Liu H, Luo Y, Liu Y, Shao G, Li H, Tao Z, Yang Y, Deng Z, Liu B, Ma Z, Zhang Y, Shi G, Lam TT, Wu JT, Gao GF, Cowling BJ, Yang B, Leung GM, Feng Z. Early Transmission Dynamics in Wuhan, China, of Novel Coronavirus-Infected Pneumonia. N Engl J Med 2020;382(13):1199-207. https://doi.org/10.1056/NEJMoa2001316
- Footnote 22
-
Wu JT, Leung K, Leung GM. Nowcasting and forecasting the potential domestic and international spread of the 2019-nCoV outbreak originating in Wuhan, China: a modelling study. Lancet 2020;395(10225):689-97. https://doi.org/10.1016/S0140-6736(20)30260-9
- Footnote 23
-
Lessler J, Reich NG, Brookmeyer R, Perl TM, Nelson KE, Cummings DA. Incubation periods of acute respiratory viral infections: a systematic review. Lancet Infect Dis 2009;9(5):291-300. https://doi.org/10.1016/S1473-3099(09)70069-6
- Footnote 24
-
He X, Lau EH, Wu P, Deng X, Wang J, Hao X, Lau YC, Wong JY, Guan Y, Tan X, Mo X, Chen Y, Liao B, Chen W, Hu F, Zhang Q, Zhong M, Wu Y, Zhao L, Zhang F, Cowling BJ, Li F, Leung GM. Temporal dynamics in viral shedding and transmissibility of COVID-19. Nat Med 2020;26(5):672-5. https://doi.org/10.1038/s41591-020-0869-5
- Footnote 25
-
Moghadas SM, Fitzpatrick MC, Sah P, Pandey A, Shoukat A, Singer BH, Galvani AP. The implications of silent transmission for the control of COVID-19 outbreaks. Proc Natl Acad Sci USA 2020;117(30):17513-5. https://doi.org/10.1073/pnas.2008373117
Appendices: Tables
Week |
Mean | Median | Quartile 1 | Quartile 3 | Standard deviation |
|---|---|---|---|---|---|
| 1 | 18.5 | 21.1 | 11.0 | 26.2 | 10.3 |
| 2 | 16.0 | 15.6 | 3.6 | 29.8 | 11.2 |
| 3 | 17.4 | 21.0 | 5.4 | 26.1 | 10.0 |
| 4 | 16.5 | 12.2 | 5.8 | 26.6 | 11.9 |
| 5 | 16.8 | 17.3 | 8.8 | 24.9 | 10.3 |
| 6 | 17.5 | 16.7 | 12.7 | 23.8 | 9.2 |
| 7 | 15.2 | 16.0 | 7.4 | 21.5 | 8.8 |
| 8 | 15.9 | 15.2 | 6.8 | 23.8 | 9.3 |
| 9 | 14.6 | 13.9 | 8.2 | 20.7 | 9.1 |
| 10 | 14.8 | 14.2 | 5.8 | 20.0 | 10.1 |
| 11 | 12.7 | 11.2 | 3.9 | 21.6 | 8.5 |
| 12 | 10.2 | 10.9 | 5.1 | 16.0 | 6.2 |
| 13 | 11.4 | 10.9 | 5.6 | 18.4 | 6.8 |
| 14 | 11.5 | 9.8 | 3.6 | 20.3 | 8.4 |
| 15 | 8.5 | 7.6 | 4.1 | 11.7 | 5.8 |
| 16 | 7.4 | 5.4 | 2.5 | 13.1 | 5.9 |
| 17 | 7.3 | 5.8 | 2.2 | 11.9 | 5.6 |
| 18 | 5.5 | 6.3 | 2.2 | 7.1 | 3.4 |
| 19 | 3.2 | 2.0 | 0.9 | 5.8 | 3.2 |
| 20 | 3.3 | 1.6 | 0.7 | 6.3 | 3.3 |
| 21 | 1.9 | 0.7 | 0.0 | 2.4 | 3.0 |
| 22 | 1.4 | 0.7 | 0.0 | 3.0 | 1.5 |
| 23 | 1.2 | 0.0 | 0.0 | 2.1 | 1.9 |
| 24 | 0.8 | 0.0 | 0.0 | 1.9 | 1.1 |
| 25 | 0.3 | 0.0 | 0.0 | 0.3 | 0.6 |
| 26 | 0.0 | 0.0 | 0.0 | 0.0 | 0.0 |
| Week | Influenza percent positivity | Respiratory syncytial virus percent positivity | Metapneumovirus percent positivity | Parainfluenza percent positivity | Adenovirus percent positivity | Rhinovirus/enterovirus percent positivity |
|---|---|---|---|---|---|---|
| 1 | 17.7 | 5.9 | 0.5 | 0.0 | 0.5 | 2.2 |
| 2 | 9.6 | 5.6 | 0.8 | 0.4 | 0.8 | 1.6 |
| 3 | 9.6 | 1.8 | 0.9 | 0.4 | 0.4 | 3.9 |
| 4 | 11.5 | 5.8 | 0.8 | 0.0 | 0.4 | 1.2 |
| 5 | 6.2 | 4.5 | 0.7 | 0.0 | 0.3 | 2.4 |
| 6 | 10.4 | 2.3 | 1.2 | 0.4 | 0.8 | 1.5 |
| 7 | 5.8 | 1.9 | 1.0 | 0.0 | 1.0 | 1.4 |
| 8 | 8.8 | 2.4 | 2.4 | 0.0 | 0.0 | 2.4 |
| 9 | 3.2 | 0.5 | 0.5 | 0.0 | 0.5 | 0.0 |
| 10 | 5.8 | 1.5 | 1.9 | 1.0 | 1.0 | 4.4 |
| 11 | 5.1 | 0.6 | 2.4 | 0.4 | 0.4 | 6.1 |
| 12 | 0.0 | 0.0 | 0.5 | 0.2 | 0.0 | 0.2 |
| 13 | 0.1 | 0.0 | 0.1 | 0.1 | 0.0 | 0.2 |
| 14 | 0.0 | 0.0 | 0.0 | 0.0 | 0.0 | 0.0 |
| 15 | 0.0 | 0.0 | 0.0 | 0.0 | 0.0 | 0.0 |
| 16 | 0.0 | 0.0 | 0.0 | 0.0 | 0.0 | 0.0 |
| 17 | 0.0 | 0.0 | 0.0 | 0.0 | 0.0 | 0.0 |
| 18 | 0.0 | 0.0 | 0.0 | 0.0 | 0.0 | 0.0 |
| 19 | 0.0 | 0.0 | 0.0 | 0.0 | 0.0 | 0.0 |
| 20 | 0.0 | 0.0 | 0.0 | 0.0 | 0.0 | 0.0 |
| 21 | 0.0 | 0.0 | 0.0 | 0.0 | 0.0 | 0.0 |
| 22 | 0.0 | 0.0 | 0.0 | 0.0 | 0.0 | 0.0 |
| 23 | 0.0 | 0.0 | 0.0 | 0.0 | 0.0 | 0.0 |
| 24 | 0.0 | 0.0 | 0.0 | 0.0 | 0.0 | 0.0 |
| 25 | 0.0 | 0.0 | 0.0 | 0.0 | 0.0 | 0.0 |
| 26 | 0.0 | 0.0 | 0.0 | 0.0 | 0.0 | 0.0 |
| Parameter | Mean | 95% | Credible interval |
|---|---|---|---|
| β1 | 13.494 | -0.891 | 21.695 |
| β2 | 0.114 | -0.888 | 1.985 |
| σ | 4.005 | 1.932 | 5.102 |
