
Coupling wastewater surveillance and modelling of SARS-CoV-2/COVID-19

 Download this article as a PDF
Published by: The Public Health Agency of Canada
Issue: Volume 49-5, May 2023: Innovative Technologies in Public Health
Date published: May 2023
ISSN: 1481-8531
Submit a manuscript
About CCDR
Browse
Volume 49-5, May 2023: Innovative Technologies in Public Health
Implementation Science
Coupling wastewater-based epidemiological surveillance and modelling of SARS-COV-2/COVID-19: Practical applications at the Public Health Agency of Canada
Meong Jin Joung1,2, Chand S Mangat3, Edgard M Mejia3, Audra Nagasawa4, Anil Nichani5, Carol Perez-Iratxeta4, Shelley W Peterson3, David Champredon1
Affiliations
1 National Microbiology Laboratory, Public Health Risk Sciences Division, Public Health Agency of Canada, Guelph, ON
2 Dalla Lana School of Public Health, University of Toronto. Toronto, ON
3 National Microbiology Laboratory, Wastewater Surveillance Unit, Public Health Agency of Canada, Winnipeg, MB
4 Statistics Canada, Centre for Direct Health Measures, Ottawa, ON
5 National Microbiology Laboratory, Public Health Agency of Canada, Guelph, ON
Correspondence
Suggested citation
Jin Joung M, Mangat CS, Mejia EM, Nagasawa A, Nichani A, Perez-Iratxeta C, Peterson SW, Champredon D. Coupling wastewater-based epidemiological surveillance and modelling of SARS-COV-2/COVID-19: Practical applications at the Public Health Agency of Canada. Can Commun Dis Rep 2023;49(5):166–74. https://doi.org/10.14745/ccdr.v49i05a01
Keywords: COVID-19, SARS-CoV-2, wastewater, epidemiology, environmental surveillance, mathematical modelling, pandemic
Abstract
Wastewater-based surveillance (WBS) of severe acute respiratory syndrome coronavirus 2 (SARS-CoV-2) offers a complementary tool for clinical surveillance to detect and monitor coronavirus disease 2019 (COVID-19). Since both symptomatic and asymptomatic individuals infected with SARS-CoV-2 can shed the virus through the fecal route, WBS has the potential to measure community prevalence of COVID-19 without restrictions from healthcare-seeking behaviours and clinical testing capacity. During the Omicron wave, the limited capacity of clinical testing to identify COVID-19 cases in many jurisdictions highlighted the utility of WBS to estimate disease prevalence and inform public health strategies; however, there is a plethora of in-sewage, environmental and laboratory factors that can influence WBS outcomes. The implementation of WBS, therefore, requires a comprehensive framework to outline a pipeline that accounts for these complex and nuanced factors. This article reviews the framework of the national WBS conducted at the Public Health Agency of Canada to present WBS methods used in Canada to track and monitor SARS-CoV-2. In particular, we focus on five Canadian cities—Vancouver, Edmonton, Toronto, Montréal and Halifax—whose wastewater signals are analyzed by a mathematical model to provide case forecasts and reproduction number estimates. The goal of this work is to share our insights on approaches to implement WBS. Importantly, the national WBS system has implications beyond COVID-19, as a similar framework can be applied to monitor other infectious disease pathogens or antimicrobial resistance in the community.
Introduction
Epidemics caused by infectious pathogens are traditionally monitored through clinical surveillance of individuals. Wastewater-based surveillance (WBS) is an alternative epidemiological surveillance approach that consists of assessing the concentration of a pathogen of interest in wastewater to estimate its associated infection prevalence in a community. Wastewater-based surveillance has been integrated as part of poliovirus eradication initiatives since 2010 Footnote 1. In Canada, it has been used to monitor drug consumption and viral pathogens for seasonal viral load changes and inactivation by wastewater treatment processes Footnote 2 Footnote 3 Footnote 4 Footnote 5 Footnote 6. During the coronavirus disease 2019 (COVID-19) pandemic, WBS has attracted a lot of attention for surveillance of severe acute respiratory syndrome coronavirus 2 (SARS-CoV-2) (the virus that causes COVID-19) both in Canada and globally Footnote 7. Wastewater-based surveillance provides a complementary tool for clinical surveillance to detect and monitor trends of disease caused by SARS-CoV-2. In contrast to clinical surveillance of COVID-19 Footnote 8, WBS is not limited by underdiagnosis of asymptomatic individuals because most individuals infected with SARS-CoV-2 shed viral particles in their stools Footnote 9 Footnote 10. Wastewater-based surveillance utilizes a pooled community sample from the catchment area of a sampling location to measure the levels of SARS-CoV-2 within the community Footnote 11. Multiple studies have shown that SARS-CoV-2 concentration measured in wastewater correlates with the real prevalence affecting the community living in the catchment area Footnote 12 Footnote 13 Footnote 14 Footnote 15.
Wastewater-based surveillance garnered high interest during the emergence of the variant of concern Omicron in November 2021 Footnote 16. Its large number of genetic mutations compared to the previous circulating lineages conferred the variant a higher transmissibility and immune escape that fuelled a rapid growth of cases Footnote 17. Hence, during the Omicron wave, testing capacities in many countries, including in major Canadian cities, were overwhelmed, forcing the polymerase chain reaction (PCR)-testing of SARS-CoV-2 in clinical samples to be restricted to certain high-risk or vulnerable populations Footnote 18. Previous research demonstrated that SARS-CoV-2 was detected in 29%–100% of fecal samples in infected individuals Footnote 19 and that WBS detection of SARS-CoV-2 preceded confirmed clinical cases by 5–63 days Footnote 11, confirming WBS as 1) an alternative measure of disease prevalence, especially when clinical surveillance is limited by overwhelming demand or test-seeking behaviours and 2) an early indicator of COVID-19 presence to inform testing and public health strategies at the community level Footnote 20. Overall, WBS offers a non-invasive and low-cost method to estimate the community prevalence of COVID-19 that addresses the limitations of traditional clinical surveillance.
However, WBS is not free of biases and uncertainties. Wastewater-based surveillance can be influenced by various pre- and post-analytical factors, including methods of sample collection and storage, laboratory analysis protocol, engineering of the sewer network and wastewater treatment plants (WWTP), changes in weather conditions and data analysis procedures Footnote 21 Footnote 22 Footnote 23. Moreover, since WBS for SARS-CoV-2 is still evolving, there is a lack of standardized procedures to address these factors. Considering the potential sensitivity of WBS data to these factors, it is crucial to establish a pipeline that specifies standardized protocols and methodologies from sample collection to analysis to ensure the accuracy of WBS. While it may be impossible to control for some sources of uncertainty, minimizing their effects remains crucial. Importantly, there is a need to implement a framework to combine the results of WBS and clinical surveillance to clearly communicate the epidemiological findings to inform public health strategies Footnote 24.
In Canada, WBS is performed by laboratories at federal, provincial and municipal levels as well as by academic groups Footnote 7. The National Microbiology Laboratory (NML) at the Public Health Agency of Canada (PHAC) collates and analyses samples from multiple provinces to conduct WBS at the national level. The objective of this review article is to provide a comprehensive overview of the WBS pipeline at the NML and a framework to incorporate WBS and clinical surveillance to enhance the national surveillance of COVID-19. We describe how mathematical modelling can be utilized to facilitate the interpretation of WBS outputs. To increase the usefulness of the WBS data, we assess key factors that influence WBS signals at each step of the pipeline and methods to address them.
Results
Wastewater-based surveillance pipeline
The Canadian national WBS program involves the collaboration of municipal WWTP and multiple government divisions and agencies, including Statistics Canada, NML and PHAC. The WBS pipeline was developed to streamline the WBS processes from sample collection to reporting in an accurate and timely manner (Figure 1).
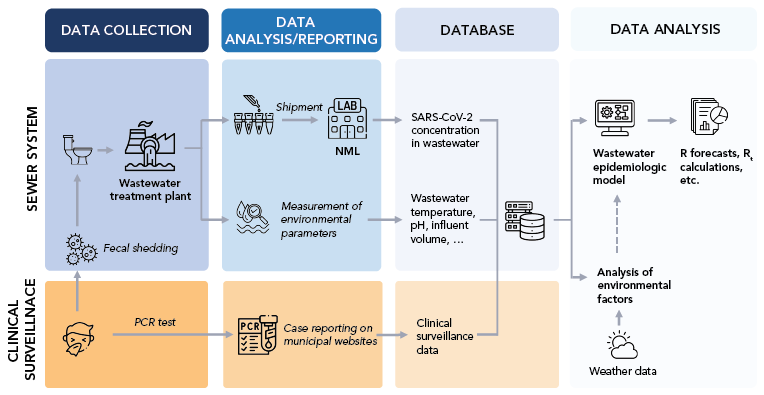
Figure 1 - Text description
While a fraction of clinical SARS-CoV-2 infections are asymptomatic and may be missed by traditional clinical surveillance, fecal shedding likely occurs in most infected individuals. These two types of events, symptomatic manifestations and fecal shedding, are at the origin of two data streams: clinical and wastewater. At the Public Health Agency of Canada/National Microbiology Laboratory, wastewater is sampled at the treatment plant, typically covering a large population. Real-time quantitative PCR testing of clinical cases is usually performed on a multitude of clinical samples to assess the infection status for tested individuals, whereas the wastewater assesses the SARS-CoV-2 concentration in a single sample to provide a proxy for the community-level prevalence. While clinical surveillance may be biased and missed entire demographic groups, the wastewater signal can be affected by environmental variables independent of the epidemic (e.g. temperature, industrial waste, weather). Clinical and wastewater data streams can be linked using the postal code of reported cases and sewage maps of sampling locations. Data is saved in a database in a standardized format for various municipalities across Canada to provide scalability of data analysis. This database is then used to fit epidemic models to estimate unobserved variables (e.g. reproduction number Rt) and perform short-term forecasts.
Data collection
The Canadian Wastewater Survey, jointly led by Statistics Canada and PHAC, currently involves 102 WWTPs across Canada. We focus on 15 WWTPs of five cities—Vancouver, Edmonton, Toronto, Montréal and Halifax—where mathematical modelling is applied to analyze the trends of SARS-CoV-2 (Figure 2). The wastewater sampling in the five cities began in September 2020. The samples are collected approximately twice a week from the raw influents. Samples are collected before de-gritting in one WWTP in Edmonton, three WWTPs in Montréal and three WWTPs in Vancouver and post-grit removal in four WWTPs in Toronto and two WWTPs in Vancouver. Wastewater can be sampled using composite or "grab sample" methods. Grab sampling constitutes rapid sampling at a specific point in time, which represents the influent at that time; therefore, the results are more subject to changes in the influent flow of the day. Composite sampling involves collecting multiple samples using an automatic sampler during a set period (typically 24 hours) to represent the wastewater composition for that period. For the Canadian Wastewater Survey, the composite sampling method was used where automatic samplers collected wastewater samples during a 24-hour period. These samples were kept at 4°C and shipped to the NML in Winnipeg, Manitoba.
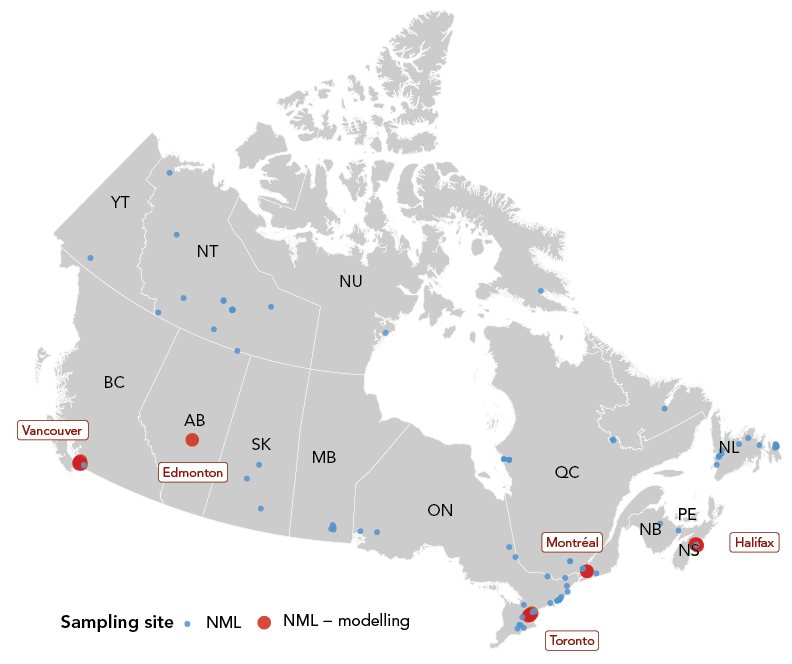
Figure 2 - Text description
While the current framework utilizes data from five cities—Vancouver, Edmonton, Toronto, Montréal and Halifax—which are used for the Wastewater Epidemiologic Model to provide case forecasts (red points), the wastewater-based surveillance (WBS) pipeline has the potential to expand to other cities and provide trends and/or forecasts of SARS-CoV-2 across Canada with the incorporation of concurrent WBS programs. The location of these WBS programs, conducted by NML, academic institutions and collaborators of NML, are plotted to visualize the total coverage of COVID-19 WBS in Canada as of June 2022 (blue and red points). Some NML sampling sites are not included in the map due to privacy policies (source: Public Health Agency of Canada).
In addition to sample collection, wastewater quality and environmental parameters of the wastewater, such as influent daily volume, temperature and pH, are measured at the WWTP. The wastewater data from NML are collated together with the environmental parameters from each WWTP by Statistics Canada for data management and shared with PHAC/NML.
Clinical surveillance data are retrieved from the PHAC line list of COVID cases (an anonymized list of COVID cases, at the individual level, communicated by the provinces and territories to PHAC during the COVID-19 response) or publicly available sources on municipal websites for each city in cases where the PHAC line list does not have sufficient spatial resolution. When available (e.g. Toronto, Vancouver), we collect data at the sub-municipal level to map the spatial location of the clinical reported cases with the catchment area of each WWTP. Weather-related environmental data, including amount of precipitation and snow on ground for each city, are obtained from Environment Canada.
Laboratory analysis of SARS-CoV-2 concentration
The SARS-CoV-2 concentration was measured with two methods. The laboratory protocols for the two methods were described in detail by Nourbakhsh et al. Footnote 25. Briefly, before February 12, 2021, SARS-CoV-2 ribonucleic acid (RNA) was extracted from the liquid supernatant portion of clarified wastewater samples. However, early studies found that the solid portion of clarified wastewater samples yield a higher viral concentration Footnote 26 Footnote 27 Footnote 28. Therefore, after February 12, 2021, RNA extraction was performed on the solid pellet after clarification. The change in protocol improved the efficiency of RNA quantification.
Data quality and sources of uncertainty
The WBS data are influenced by several factors, including environmental conditions, laboratory protocols and engineering of the WWTPs. Below, we summarize how environmental and laboratory factors can impact WBS data. This is still an area of active research, and many knowledge gaps remain.
Environmental factors such as precipitation or snowmelt have been described as critical factors that could influence viral signals in the wastewater Footnote 29. However, the impact of environmental factors could vary depending on the type of the sewer system serviced by a WWTP. There are two major types of sewer systems—combined and sanitary. Combined systems collect storm water from surface runoff and wastewater together within the same pipes. While combined systems would only collect wastewater as influent water to the WWTP during dry weather, wet weather or high precipitation events (including snowmelt) would increase the influent flow rate and dilute viral concentration present in the wastewater Footnote 29. In contrast, sanitary systems mostly separate storm water and sewage, which means the influent volume do not change significantly based on the weather, avoiding the dilution of the viral signal.
Combined systems are present in older parts of the cities monitored by PHAC. To ensure the quality of the WBS data, we investigated the potential mediating effects of precipitation on the WBS SARS-CoV-2 signal. Our quantitative analyses of environmental factors (manuscript in preparation) revealed that while some fluctuations in influent volume were recorded with changes in precipitation, they do not appear to significantly impact the SARS-CoV-2 concentration in wastewater for the dates and sites analyzed. Snowmelt has also been suggested to influence the SARS-CoV-2 signal in wastewater Footnote 21 Footnote 30. Although some studies showed the influent volume increased during snowmelt season Footnote 30 Footnote 31 Footnote 32, there is a paucity of evidence that snowmelt events have a significant impact on the viral signal.
Laboratory factors
Viral concentration measurement from a wastewater sample is a multi-step process, where each step can introduce a potential source of error. The duration and conditions of transport of the sample from the sampling location to the laboratory may impact the final concentration measurement of SARS-CoV-2. By their nature, wastewater samples are very "active"; i.e., there is a high degree of biological activity that causes the nature of the sample to change rapidly. In addition, the equipment and containers of the sampling system may be contaminated. Therefore, storing, transporting and handling wastewater samples are critical to maintain their integrity and are potential sources of errors. Moreover, the complex and variable nature of wastewater requires the proper use of control samples to account for variations in the composition of wastewater and evaluate overall efficiency of the process. Failure to properly run these controls are other potential sources of error. Molecular detection by real-time quantitative polymerase chain reaction (RT-qPCR) testing may also be prone to errors (e.g. standard curve not updated, new viral mutations affecting the identification by primers). Hence, rigorous protocols to ensure consistency and reliability of SARS-CoV-2 concentration measurements from wastewater samples should be in place at this stage of the WBS pipeline. Guidance regarding such protocols is presented in detail in the Supplemental material.
Normalization
As mentioned above, many factors can affect the viral concentration in wastewater. Ideally, those factors would be identified, measured and controlled for before communicating a "final" viral concentration in wastewater. Wastewater is a complex matrix that contains biological, chemical and physical factors that may affect the RNA concentration and/or detection. Wastewater not only contains domestic sewage, but may also have industrial/agricultural discharge and storm water depending on weather conditions Footnote 33. From these influents, the composition of wastewater may change in pH, chlorine and dissolved oxygen content, which may reduce the viral concentration Footnote 23. Moreover, transportation of wastewater through the sewage network involves fluctuations in wastewater temperature, flow rate, sedimentation/resuspension and travel time. For these reasons, it is unlikely to have a consistently smooth viral signal in wastewater, especially when monitoring small communities. However, several normalization approaches have been employed by different groups to address these uncertainties. Normalization is not yet standardized in WBS; even the word "normalization" may not be appropriate because it attempts to correct for various factors. Viral signal in wastewater should be controlled for 1) human fecal mass to account for population (e.g. using biomarkers like pepper mild mottle virus [PMMoV], crAssphage and ammonia); 2) environmental events (e.g. WWTP influent flow) and 3) transport and dispersion dynamics in the sewer (e.g. using metrics of particle suspension in wastewater). There is likely no global solution for controlling for these (and other) factors, as each sewer has unique specificities. Normalization is still an area of investigation at PHAC/NML, where collection of several normalizing variables (e.g. concentration of PMMoV, pH, mass of total solids in suspension) has been performed since the start of the federal WBS program.
Wastewater epidemiologic model
A mathematical model that describes both SARS-CoV-2 transmission at the population level and SARS-CoV-2 concentration in the wastewater (by explicitly modelling fecal shedding) was developed at PHAC/NML Footnote 25 and implemented as a publicly available R package Footnote 34. A simple representation of this model, called the wastewater epidemic model (WEM), is shown in Figure 3.
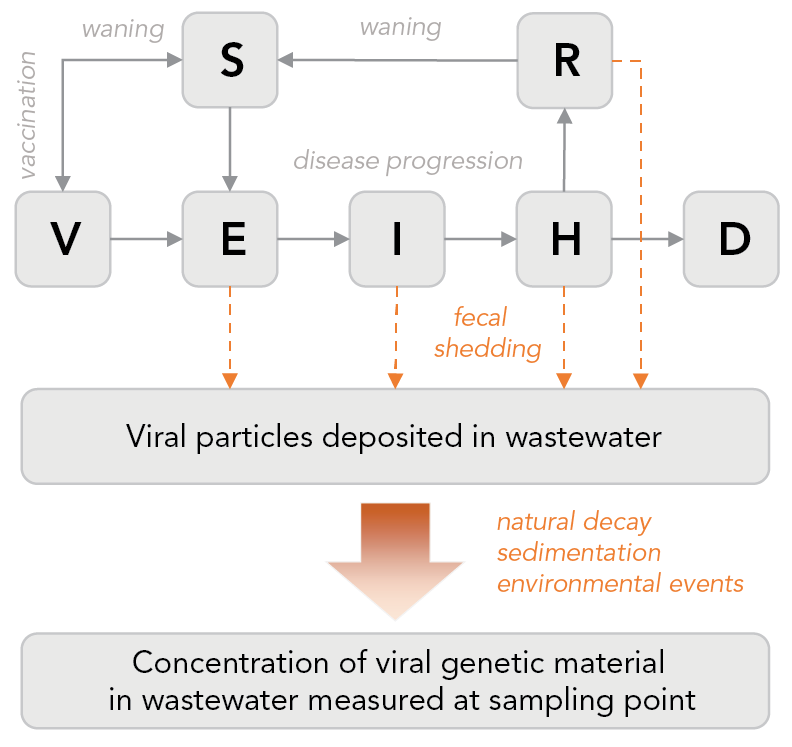
Figure 3 - Text description
Different stages of disease progression are represented (susceptible, latent exposure, infectious, hospitalized, recovered and deceased). Immunization is also modelled as well as waning immunity (natural and vaccine-induced). Fecal shedding is explicitly modelled, with the shedding dynamics informed by clinical studies. The viral particles shed in wastewater travel through sewers shed up to the sampling point. The model has a simplistic representation of this journey, to account for the effects that can impact the measured concentration, caused for example, by the decay of the genetic material of the virus, particles sedimentation and recirculation and potential impact of environmental events (e.g. large rainfall). The model is calibrated, simultaneously or independently, on clinical data (e.g. reported cases, hospitalizations) and wastewater data (viral concentration).
Like other mathematical models, WEM provides a principled framework to estimate unobserved epidemiological parameters (e.g. prevalence, effective reproduction number Rt) and to forecast cases, hospitalization and deaths. Importantly, WEM incorporates both the wastewater data and the traditional data based on clinical surveillance. These two data types, wastewater and clinical, can be used either in combination when more information is needed to triangulate the state of the pandemic, or as a substitute for one another when one of the two data source is missing or deemed inaccurate. We provide an example of the latter in the section analyzing the Omicron wave.
Because WEM integrates wastewater data, it translates the wastewater signal—that can be hard to interpret epidemiologically—into practical and well-known metrics for public health (e.g. prevalence, effective reproduction number). The lack of data and good understanding of the fate of viral RNA in the sewer prevented us from associating, a priori, the viral concentration measurement with the "true" prevalence level of infection in the catchment area of a WWTP. Thus, we were limited to estimating prevalence as if it was reported by clinical surveillance. This means we considered the historical data points of both the viral concentration in wastewater and the reported clinical prevalence to calculate their average ratio. We used this ratio to convert viral concentration into estimated "reportable" cases in WEM (i.e. reportable cases=ratio x viral concentration) Footnote 25. In other words, we did not try to estimate the reporting fraction. Although technically possible with WEM, we did not attempt to forecast hospitalizations or deaths because these data were not available to us at the sewer shed level (i.e. sub-municipal level), thus preventing us from fitting the model parameters associated with hospitalization and mortality. Hence, we limited our forecasts to reportable cases and the Supplemental material Figure S1 shows our estimations for five Canadian cities.
We did not see significant differences in the forecasts produced by WEM, whether the concentration was normalized by PMMoV or not. Hence, we decided to simply use raw (unnormalized) SARS-CoV-2 concentration in wastewater since normalization is still an area of investigation at NML. The case forecasts are key indicators in planning public health actions because they predict the transmission of disease at the population level. We monitored the four-week forecast accuracy of WEM using log scores Footnote 35.
The effective reproduction number (Rt) is another important measure that summarizes the current state of transmission dynamics. We show Rt estimates obtained from WEM in the Supplemental material Figure S2. These epidemiological indicators of virus transmission played an important role in the national COVID-19 surveillance, and modelling allows to incorporate information from WBS to enhance the estimation of these indicators.
Wastewater-based surveillance reporting
Wastewater-based surveillance is, by nature, conducted locally—typically at the level of a municipality (sampling at a WWTP), a neighbourhood (sampling in a manhole) or an institution (e.g. hospital, university campus). When data from several sampling sites are available, it may be more relevant to aggregate the data to provide a trend indicator for a broader geographical area. A possible approach to aggregate viral concentrations in wastewater from different sites is to perform a weighted average where the weights represent the population sizes of each catchment area. Of course, the viral concentrations must be standardized beforehand.
To inform its analyses, PHAC aggregates WBS from samples collected at the wastewater treatment plants to municipal and national levels. PHAC analyzes WBS through the lens of modelling; hence, the weighted average aggregation is performed on the epidemiological metrics (e.g. forecasted incidence, Rt) after fitting WEM to the data of each sampling site. In other words, we do not fit WEM to an aggregated wastewater signal. Wastewater-based surveillance is reported in combination with clinical surveillance and modelling forecasts to show the wastewater concentration and cases to date, and predictions based on WEM.
Application to the analysis of the Omicron wave in Canada
The Omicron variant of SARS-CoV-2 was classified as a variant of concern on November 26, 2021 Footnote 16. By January 2022, over 90% of SARS-CoV-2 samples collected in Canada were identified as Omicron Footnote 36. Omicron spread rapidly across Canada, which prompted a change in testing policies to restrict PCR testing to high-risk or vulnerable populations in many jurisdictions to meet the overwhelming demand. This change likely led to an underestimation of disease burden by clinical surveillance. Importantly, case forecasts from models using the case data could no longer serve as reliable indicators to inform public health policies. In fact, in all five cities analyzed with WEM, wastewater viral loads increased concordantly with clinical cases, but the trends diverged with the implementation of PCR testing restrictions (Supplemental material, Figure S1). While clinical cases appeared to have peaked around the date of the restriction, wastewater signals remained elevated or continued to increase. The discordance between clinical surveillance and WBS during the Omicron wave emphasized the utility of WBS when clinical testing was restricted Footnote 3.
To assess the impact of the data source on case estimates and forecasting with WEM in absence of reliable clinical testing, the model was calibrated alternatively to clinical and WBS data. In addition, the model parameters representing the asymptomatic proportion and vaccine efficacy—assumed constant for all the waves before Omicron—were calibrated on available Omicron-specific data once they became available (e.g. early studies on vaccine effectiveness). After these adjustments were made, data from WBS, clinical surveillance and model forecasts were reported with epidemiological interpretations for internal monitoring of the national SARS-CoV-2 trends (Figure 1). The WEM provided estimates of reportable cases (i.e. clinical cases that would have been reported without PCR testing restrictions) using wastewater data only, in comparison with actual reported clinical cases, to assess the extent of under-reporting and the likelihood of having passed peak incidence of the wave. In Figure 4, we illustrate how modelling outputs were used in two different cities during the Omicron wave. In this example, WEM was fitted alternatively to clinical or wastewater data in Toronto (the largest city in Canada) and Edmonton (a medium-size city). The model suggests that under-reporting of cases in the former was more pronounced than in the latter. This modelling analysis of the Omicron wave, together with the estimates for five cities over a longer period presented in the Supplemental material, Figure S1, highlighted the limitations of clinical surveillance, especially after the change in PCR testing guidelines. From WBS, the under-reporting of cases was evident through the comparison of cases estimated from clinical surveillance and WBS. Moreover, WBS complemented the information from clinical surveillance including the timing of the peak and increasing/decreasing trends. Overall, the Omicron wave in Canada has allowed for an appreciation for the utility of WBS as an alternative approach to monitor SARS-CoV-2 transmission when clinical surveillance became overwhelmed and struggled to provide high quality data on disease prevalence trends.
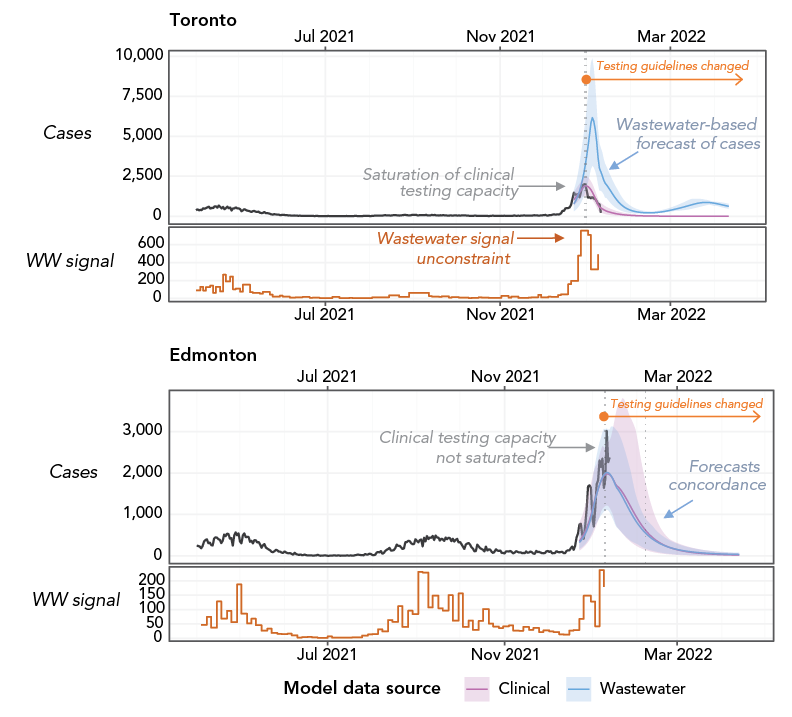
Figure 4 - Text description
For each city, the top panel shows the reported clinical cases (black curve) and the model-inferred reportable cases using clinical reports (pink curve) or using the wastewater signal (blue curve). The bottom panel shows the average SARS-CoV-2 concentration in wastewater in the city (orange step line). The vertical dotted line indicates when the municipal testing guidelines were restricted. The difference between the blue and pink curve is proportional to the extent of under-reporting of clinical cases. In Toronto, modelling suggests that under-reporting was significant around peak incidence, whereas Edmonton seems not to have been as affected. Analysis performed as of January 19, 2022.
Discussion
Limitations of wastewater-based surveillance in Canada
Currently, the wastewater-based modelling focuses on five major cities in Canada. While the combined catchment area of WBS for these five cities is about 23% of the Canadian population Footnote 37, it cannot provide a comprehensive overview of the SARS-CoV-2 trends with the limited scope of surveillance. It is not clear what minimum proportion of the population should be monitored through WBS to provide a reliable estimate of national prevalence. Monitoring large cities may be a good starting point to assess the intensity of transmission nationwide because most of the transmission likely occurs there. Although the expansion of the Canadian Wastewater Survey may increase the coverage of WBS, several challenges are anticipated given the geography and population distributions in Canada.
First, WBS in small or remote communities will require different sampling methods, such as sample collection from a septic tank, manhole or lagoon, due to the absence of WWTPs in such areas. Although previous research has demonstrated that sampling from manholes, did not result in significant RNA decay Footnote 38, it poses as a logistical challenge. Moreover, our current modelling framework (WEM) is not adapted to analyze small populations, mainly because WEM is not a stochastic model.
Although still an area of active research, controlling for uncertainty in the viral signal in wastewater, such as fecal shedding dynamics and in-sewer RNA decay, is critical. Since the viral signal is meant to be used to inform public health, normalization may improve its accuracy in estimating the prevalence of infections. The uncertainty of the efficacy of normalization techniques, at PHAC/NML but also for many other groups, is currently a limitation that hampers the interpretation of WBS and an area of active research.
Beyond COVID-19
The implementation of WBS as a routine surveillance tool has broader implications beyond COVID-19. Wastewater-based surveillance can also be used for monitoring respiratory pathogens other than SARS-CoV-2 (including influenza viruses, respiratory syncytial virus), sexually transmitted infections, antibiotic resistance and antibiotic use in the community Footnote 39 Footnote 40. Importantly, the active research of WBS during the COVID-19 pandemic allowed for a better understanding of in-sewer factors, environmental factors and population dynamics that affect WBS and the development of mathematical modelling to estimate population prevalence of the health risk and its future predictions. However, we note that for any pathogen surveyed in wastewater, it is critical to understand its fecal shedding dynamics and in-sewer decay to improve estimates of infection prevalence in the community from viral concentration measured in wastewater. Unfortunately, there is a dearth of such clinical studies, even for SARS-CoV-2. While the expansion of WBS to other pathologies will require the development of novel laboratory assays, the current framework and knowledge of WBS and modelling with WEM will provide a strong foundation to facilitate the surveillance of other infectious pathogens.
Next steps
While the present framework provides a comprehensive WBS pipeline for the current scope of national WBS, changes and improvements can be implemented to respond to the dynamic nature of the COVID-19 pandemic. A crucial step in further developing WBS is to standardize the surveillance data, including its measurement metrics and storage, across many laboratories. The Public Health Environmental Surveillance Open Data Model Footnote 41 is an initiative to develop an open data structure, including metadata and vocabulary, to support environmental surveillance such as WBS. PHAC is in the process of incorporating its national WBS into the Public Health Environmental Surveillance Open Data Model to augment its capacity to monitor multiple pathogens and geographical locations for WBS—facilitating the scalability of data analysis, thanks to its standardized data structure. In addition to incorporating data from concurrent WBS programs, WBS has the potential to expand to more geographical locations with diverse environments, such as remote or small communities. However, remote communities pose unique challenges because they often lack a WWTP and require alternative sampling methods for WBS. Hence, the framework may also expand to incorporate data analysis processes from these varying sources of WBS samples to standardize the analyses. Lastly, WBS can serve as an indicator of emerging variants of concern through SARS-CoV-2's genome sequencing. Although this is currently conducted at NML, the epidemiological interpretations of the results are not yet incorporated in the WBS pipeline described here.
Conclusion
Although WBS has previously been used to inform public health responses for other health risks, the COVID-19 pandemic stimulated an expansion of WBS to an unprecedented scale. As demonstrated during the Omicron wave, COVID-19 WBS has the potential to have high policy implications, especially when traditional epidemiological surveillance methods are curtailed. The present framework outlines the first national WBS of COVID-19 in Canada. In particular, the use of mathematical modelling is a critical tool to interpret WBS because it translates wastewater concentrations into prevalence for easier interpretation in public health settings. While WBS of COVID-19 provides unique information on the community spread of SARS-CoV-2, there remain many uncertainties and inconsistencies to be addressed in WBS data. The establishment of this framework will support further expansion and development of the WBS program, including monitoring other geographical areas and other pathogens.
Authors' statement
MJJ — Writing original draft, data analysis, review and editing, final approval
CSM — Data acquisition, data analysis, review and editing, final approval
EMM — Data acquisition, writing original draft of Supplemental material, data analysis, review and editing, final approval
ANagasawa — Data acquisition, data analysis, review and editing, final approval
ANichani — Data acquisition, review and editing, final approval
CPI — Data acquisition, data analysis, review and editing, final approval
SWP — Data acquisition, writing original draft of Supplemental material, data analysis, review and editing, final approval
DC — Writing original draft, writing original draft of Supplemental material, data analysis, review and editing, final approval
The datasets obtained and/or analyzed during the current study available from the corresponding author on reasonable request.
Competing interests
None.
Funding
None.
Supplemental material
These documents can be accessed on the Supplemental material file.
References
- Footnote 1
-
Hovi T, Shulman LM, van der Avoort H, Deshpande J, Roivainen M, DE Gourville EM. Role of environmental poliovirus surveillance in global polio eradication and beyond. Epidemiol Infect 2012;140(1):1–13. https://doi.org/10.1017/S095026881000316X
- Footnote 2
-
Qiu Y, Lee BE, Neumann N, Ashbolt N, Craik S, Maal-Bared R, Pang XL. Assessment of human virus removal during municipal wastewater treatment in Edmonton, Canada. J Appl Microbiol 2015;119(6):1729–39. https://doi.org/10.1111/jam.12971
- Footnote 3
-
Statistics Canada. Canadian Wastewater Survey, December 2021 to January 2022. Ottawa, ON: StatCan; 2022. [Accessed 2022 April 22]. https://www150.statcan.gc.ca/n1/daily-quotidien/220218/dq220218d-eng.htm
- Footnote 4
-
Yargeau V, Taylor B, Li H, Rodayan A, Metcalfe CD. Analysis of drugs of abuse in wastewater from two Canadian cities. Sci Total Environ 2014;487:722–30. https://doi.org/10.1016/j.scitotenv.2013.11.094
- Footnote 5
-
Qiu Y, Li Q, Lee BE, Ruecker NJ, Neumann NF, Ashbolt NJ, Pang X. UV inactivation of human infectious viruses at two full-scale wastewater treatment plants in Canada. Water Res 2018;147:73–81. https://doi.org/10.1016/j.watres.2018.09.057
- Footnote 6
-
Webb AL, Taboada EN, Selinger LB, Boras VF, Inglis GD. Prevalence and diversity of waterborne Arcobacter butzleri in southwestern Alberta, Canada. Can J Microbiol 2017;63(4):330–40. https://doi.org/10.1139/cjm-2016-0745
- Footnote 7
-
Naughton CC, Roman FA, Alvarado AGF, Tariqi A, Deeming MA, Kadonsky KF, Bibby K, Bivins A, Medema G, Ahmed W, Katsivelis P, Allan V, Sinclair R, Rose JB. Show us the data: global COVID-19 wastewater monitoring efforts, equity, and gaps. FEMS Microbes 2023;4:xtad003. https://doi.org/10.1093/femsmc/xtad003
- Footnote 8
-
Hilborne LH, Wagner Z, Cabreros I, Brook RH. Linking Statistics With Testing Policy to Manage COVID-19 in the Community. Am J Clin Pathol 2020;154(2):142–8. https://doi.org/10.1093/ajcp/aqaa099
- Footnote 9
-
Miura F, Kitajima M, Omori R. Duration of SARS-CoV-2 viral shedding in faeces as a parameter for wastewater-based epidemiology: re-analysis of patient data using a shedding dynamics model. Sci Total Environ 2021;769:144549. https://doi.org/10.1016/j.scitotenv.2020.144549
- Footnote 10
-
Sangkham S. A review on detection of SARS-CoV-2 RNA in wastewater in light of the current knowledge of treatment process for removal of viral fragments. J Environ Manage 2021;299:113563. https://doi.org/10.1016/j.jenvman.2021.113563
- Footnote 11
-
Shah S, Gwee SX, Ng JQ, Lau N, Koh J, Pang J. Wastewater surveillance to infer COVID-19 transmission: A systematic review. Sci Total Environ 2022;804:150060. https://doi.org/10.1016/j.scitotenv.2021.150060
- Footnote 12
-
Akingbola S, Fernandes R, Borden S, Gilbride K, Oswald C, Straus S, Tehrani A, Thomas J, Stuart R. Early identification of a COVID-19 outbreak detected by wastewater surveillance at a large homeless shelter in Toronto, Ontario. Can J Public Health 2023;114(1):72–9. https://doi.org/10.17269/s41997-022-00696-8
- Footnote 13
-
Izquierdo-Lara RW, Heijnen L, Oude Munnink BB, Schapendonk CM, Elsinga G, Langeveld J, Post J, Prasad DK, Carrizosa C, Been F, van Beek J, Schilperoort R, Vriend R, Fanoy E, de Schepper EI, Sikkema RS, Molenkamp R, Aarestrup FM, Medema G, Koopmans MP, de Graaf M. Rise and fall of SARS-CoV-2 variants in Rotterdam: comparison of wastewater and clinical surveillance. Sci Total Environ 2023;873:162209. https://doi.org/10.1016/j.scitotenv.2023.162209
- Footnote 14
-
Pang X, Gao T, Ellehoj E, Li Q, Qiu Y, Maal-Bared R, Sikora C, Tipples G, Diggle M, Hinshaw D, Ashbolt NJ, Talbot J, Hrudey SE, Lee BE. Wastewater-Based Surveillance Is an Effective Tool for Trending COVID-19 Prevalence in Communities: A Study of 10 Major Communities for 17 Months in Alberta. ACS ES T Water 2022;2(11):2243–54. https://doi.org/10.1021/acsestwater.2c00143
- Footnote 15
-
Li Q, Lee BE, Gao T, Qiu Y, Ellehoj E, Yu J, Diggle M, Tipples G, Maal-Bared R, Hinshaw D, Sikora C, Ashbolt NJ, Talbot J, Hrudey SE, Pang X. Number of COVID-19 cases required in a population to detect SARS-CoV-2 RNA in wastewater in the province of Alberta, Canada: sensitivity assessment. J Environ Sci (China) 2023;125:843–50. https://doi.org/10.1016/j.jes.2022.04.047
- Footnote 16
-
World Health Organization. Classification of Omicron (B.1.1.529): SARS-CoV-2 Variant of Concern. Geneva (CH): WHO; 2021. [Accessed 2022 Apr 22]. https://www.who.int/news/item/26-11-2021-classification-of-omicron-(b.1.1.529)-sars-cov-2-variant-of-concern
- Footnote 17
-
Khandia R, Singhal S, Alqahtani T, Kamal MA, El-Shall NA, Nainu F, Desingu PA, Dhama K. Emergence of SARS-CoV-2 Omicron (B.1.1.529) variant, salient features, high global health concerns and strategies to counter it amid ongoing COVID-19 pandemic. Environ Res 2022;209:112816. https://doi.org/10.1016/j.envres.2022.112816
- Footnote 18
-
Public Health Ontario. Underreporting of COVID-19 Case Counts in the Context of the Omicron Variant. Toronto, ON: PHO; 2021. [Accessed 2022 Apr 22]. https://www.publichealthontario.ca/en/About/news/2021/Underreporting-of-COVID-19-Case-Counts-in-the-Context-of-the-Omicron-Variant
- Footnote 19
-
Kitajima M, Ahmed W, Bibby K, Carducci A, Gerba CP, Hamilton KA, Haramoto E, Rose JB. SARS-CoV-2 in wastewater: state of the knowledge and research needs. Sci Total Environ 2020;739:139076. https://doi.org/10.1016/j.scitotenv.2020.139076
- Footnote 20
-
Wu F, Xiao A, Zhang J, Moniz K, Endo N, Armas F, Bonneau R, Brown MA, Bushman M, Chai PR, Duvallet C, Erickson TB, Foppe K, Ghaeli N, Gu X, Hanage WP, Huang KH, Lee WL, Matus M, McElroy KA, Nagler J, Rhode SF, Santillana M, Tucker JA, Wuertz S, Zhao S, Thompson J, Alm EJ. SARS-CoV-2 RNA concentrations in wastewater foreshadow dynamics and clinical presentation of new COVID-19 cases. Sci Total Environ 2022;805:150121. https://doi.org/10.1016/j.scitotenv.2021.150121
- Footnote 21
-
Wade MJ, Lo Jacomo A, Armenise E, Brown MR, Bunce JT, Cameron GJ, Fang Z, Farkas K, Gilpin DF, Graham DW, Grimsley JM, Hart A, Hoffmann T, Jackson KJ, Jones DL, Lilley CJ, McGrath JW, McKinley JM, McSparron C, Nejad BF, Morvan M, Quintela-Baluja M, Roberts AM, Singer AC, Souque C, Speight VL, Sweetapple C, Walker D, Watts G, Weightman A, Kasprzyk-Hordern B. Understanding and managing uncertainty and variability for wastewater monitoring beyond the pandemic: lessons learned from the United Kingdom national COVID-19 surveillance programmes. J Hazard Mater 2022;424 Pt B:127456. https://doi.org/10.1016/j.jhazmat.2021.127456
- Footnote 22
-
McCall C, Fang ZN, Li D, Czubai AJ, Juan A, LaTurner Z, Ensor K, Hopkins L, Bedient P, Stadler LB. Modeling SARS-CoV-2 RNA Degradation in Small and Large Sewersheds. Environ Sci Water Res Technol 2022;8:290–300. https://doi.org/10.1039/D1EW00717C
- Footnote 23
-
Bertels X, Demeyer P, Van den Bogaert S, Boogaerts T, van Nuijs AL, Delputte P, Lahousse L. Factors influencing SARS-CoV-2 RNA concentrations in wastewater up to the sampling stage: A systematic review. Sci Total Environ 2022;820:153290. https://doi.org/10.1016/j.scitotenv.2022.153290
- Footnote 24
-
Smith T, Holm RH, Yeager R, Moore JB 4th, Rouchka EC, Sokoloski KJ, Elliott EM, Talley D, Arora V, Moyer S, Bhatnagar A. Combining Community Wastewater Genomic Surveillance with State Clinical Surveillance: A Framework for SARS-CoV-2 Public Health Practice. Food Environ Virol 2022;14(4):410–6. https://doi.org/10.1007/s12560-022-09531-2
- Footnote 25
-
Nourbakhsh S, Fazil A, Li M, Mangat CS, Peterson SW, Daigle J, Langner S, Shurgold J, D'Aoust P, Delatolla R, Mercier E, Pang X, Lee BE, Stuart R, Wijayasri S, Champredon D. A wastewater-based epidemic model for SARS-CoV-2 with application to three Canadian cities. Epidemics 2022;39:100560. https://doi.org/10.1016/j.epidem.2022.100560
- Footnote 26
-
Li B, Di DY, Saingam P, Jeon MK, Yan T. Fine-Scale Temporal Dynamics of SARS-CoV-2 RNA Abundance in Wastewater during A COVID-19 Lockdown. Water Res 2021;197:117093. https://doi.org/10.1016/j.watres.2021.117093
- Footnote 27
-
Palmer EJ, Maestre JP, Jarma D, Lu A, Willmann E, Kinney KA, Kirisits MJ. Development of a reproducible method for monitoring SARS-CoV-2 in wastewater. Sci Total Environ 2021;799:149405. https://doi.org/10.1016/j.scitotenv.2021.149405
- Footnote 28
-
Kim S, Kennedy LC, Wolfe MK, Criddle CS, Duong DH, Topol A, White BJ, Kantor RS, Nelson KL, Steele JA, Langlois K, Griffith JF, Zimmer-Faust AG, McLellan SL, Schussman MK, Ammerman M, Wigginton KR, Bakker KM, Boehm AB. SARS-CoV-2 RNA is enriched by orders of magnitude in primary settled solids relative to liquid wastewater at publicly owned treatment works. Environ Sci (Camb) 2022;8(4):757–70. https://doi.org/10.1039/D1EW00826A
- Footnote 29
-
Lazuka A, Arnal C, Soyeux E, Sampson M, Lepeuple AS, Deleuze Y, Pouradier Duteil S, Lacroix S. COVID-19 wastewater based epidemiology: long-term monitoring of 10 WWTP in France reveals the importance of the sampling context. Water Sci Technol 2021;84(8):1997–2013. https://doi.org/10.2166/wst.2021.418
- Footnote 30
-
Statistics Canada. Wastewater analysis suggests that consumption of fentanyl, cannabis and methamphetamine increased in the early pandemic period. Ottawa, ON: StatCan; 2021. [Accessed 2022 Apr 22]. https://www150.statcan.gc.ca/n1/daily-quotidien/210726/dq210726a-eng.htm
- Footnote 31
-
Tiwari A, Lipponen A, Hokajärvi AM, Luomala O, Sarekoski A, Rytkönen A, Österlund P, Al-Hello H, Juutinen A, Miettinen IT, Savolainen-Kopra C, Pitkänen T. Detection and quantification of SARS-CoV-2 RNA in wastewater influent in relation to reported COVID-19 incidence in Finland. Water Res 2022;215:118220. https://doi.org/10.1016/j.watres.2022.118220
- Footnote 32
-
Ai Y, Davis A, Jones D, Lemeshow S, Tu H, He F, Ru P, Pan X, Bohrerova Z, Lee J. Wastewater SARS-CoV-2 monitoring as a community-level COVID-19 trend tracker and variants in Ohio, United States. Sci Total Environ 2021;801:149757. https://doi.org/10.1016/j.scitotenv.2021.149757
- Footnote 33
-
Nagarkar M, Keely SP, Jahne M, Wheaton E, Hart C, Smith B, Garland J, Varughese EA, Braam A, Wiechman B, Morris B, Brinkman NE. SARS-CoV-2 monitoring at three sewersheds of different scales and complexity demonstrates distinctive relationships between wastewater measurements and COVID-19 case data. Sci Total Environ 2022;816:151534. https://doi.org/10.1016/j.scitotenv.2021.151534
- Footnote 34
-
Wastewater Epidemic Model. [Accessed 2022 Apr 22]. https://github.com/phac-nml-phrsd/wem
- Footnote 35
-
Gneiting T, Balabdaoui F, Raftery AE. Probabilistic forecasts, calibration and sharpness. J R Stat. 2007;69(2):247–68. https://doi.org/10.1111/j.1467-9868.2007.00587.x
- Footnote 36
-
Public Health Ontario. COVID-19 Variant of Concern Omicron (B.1.1.529): Risk Assessment, January 26, 2022. Toronto, ON: PHO; 2022. https://www.publichealthontario.ca/-/media/documents/ncov/voc/2022/01/covid-19-omicron-b11529-risk-assessment-jan-26.pdf?sc_lang=en
- Footnote 37
-
Statistics Canada. Census Profile, 2021 Census of Population. Ottawa, ON: StatCan; 2023. [Accessed 2022 Apr 22]. https://www12.statcan.gc.ca/census-recensement/2021/dp-pd/prof/index.cfm?Lang=E
- Footnote 38
-
Yeager R, Holm RH, Saurabh K, Fuqua JL, Talley D, Bhatnagar A, Smith T. Wastewater Sample Site Selection to Estimate Geographically Resolved Community Prevalence of COVID-19: A Sampling Protocol Perspective. Geohealth 2021;5(7):GH000420. https://doi.org/10.1029/2021GH000420
- Footnote 39
-
Zhang Y, Duan L, Wang B, Du Y, Cagnetta G, Huang J, Blaney L, Yu G. Wastewater-based epidemiology in Beijing, China: prevalence of antibiotic use in flu season and association of pharmaceuticals and personal care products with socioeconomic characteristics. Environ Int 2019;125:152–60. https://doi.org/10.1016/j.envint.2019.01.061
- Footnote 40
-
Heijnen L, Medema G. Surveillance of influenza A and the pandemic influenza A (H1N1) 2009 in sewage and surface water in the Netherlands. J Water Health 2011;9(3):434–42. https://doi.org/10.2166/wh.2011.019
- Footnote 41
-
The Public Health Environmental Surveillance Open Data Model. [Accessed 2023 Mar 9]. https://github.com/Big-Life-Lab/PHES-ODM
